

Abstract
Background
In spite of efforts to improve gender diversity in orthopaedic surgery, women remain underrepresented, particularly with increasing academic rank. Opportunities to speak at society meetings are an important component of building a national reputation and achieving academic promotions. However, little is known about the gender diversity of orthopaedic society annual meeting speakers. Data on this topic are needed to determine whether these speaking roles are equitably distributed between men and women, which is fundamental to equalizing professional opportunity in academic orthopaedic surgery.
Question/purposes
(1) Is the gender diversity of invited speakers at annual orthopaedic subspecialty society meetings proportional to society membership? (2) Are there differences in the proportion of women invited to speak in technical sessions (defined as sessions on surgical outcomes, surgical technique, nonsurgical musculoskeletal care, or basic science) versus nontechnical sessions (such as sessions on diversity, work-life balance, work environment, social media, education, or peer relationships)? (3) Does the presence of women on the society executive committee and annual meeting program committee correlate with the gender diversity of invited speakers? (4) Do societies with explicit diversity efforts (the presence of a committee, task force, award, or grant designed to promote diversity, or mention of diversity as part of the organization’s mission statement) have greater gender diversity in their invited speakers?
Methods
Seventeen national orthopaedic societies in the United States were included in this cross-sectional study of speakership in 2018. Each society provided the number of men and women members for their society in 2018. The genders of all invited speakers were tabulated using each society’s 2018 annual meeting program. Speakers of all credentials and degrees were included. All manuscript/abstract presenters were excluded from all analyses because these sessions are selected by blinded scientific review. A Fisher’s exact test was used to compare the proportion of women versus men in nontechnical speaking roles. The relationship between women in society leadership roles and women in all speaking roles was investigated using a linear regression analysis. A chi square test was used to compare the proportion of women in all speaking roles between societies with stated diversity efforts with societies without such initiatives.
Results
Overall, women society members were proportionately represented as annual meeting speakers, comprising 13% (4389 of 33,051) of all society members and 14% (535 of 3928) of all annual meeting speakers (% difference 0.6% [95% CI -0.8 to 1.5]; p = 0.60); however, representation of women speakers ranged from 0% to 33% across societies. Women were more likely than men to have nontechnical speaking roles, with 6% (32 of 535) of women’s speaking roles being nontechnical, compared with 2% (51 of 3393) of men’s speaking roles being nontechnical (OR 4.2 [95% CI 2.7 to 6.5]; p < 0.001). There was a positive correlation between the proportion of women in society leadership roles and the proportion of women in speaking roles (r = 0.73; p < 0.001). Societies with a stated diversity effort had more women as conference speakers; with 19% (375 of 1997) women speakers for societies with a diversity effort compared with 8% (160 of 1931) women speakers in societies without a diversity effort (OR 2.6 [95% CI 2.1 to 3.1]; p < 0.001).
Conclusions
Although the percentage of women in speaking roles was proportional to society membership overall, our study identified opportunities to improve gender representation in several societies and in technical versus nontechnical sessions. Positioning more women in leadership roles and developing stated diversity efforts are two interventions that may help societies improve proportional representation; we recommend that all societies monitor the gender representation of speakers at their annual meetings and direct conference organizing committees to create programs with gender equity.
Clinical Relevance
Society leadership, national oversight committees, invited speakers, and conference attendees all contribute to the layers of accountability for equitable speakership at annual meetings. National steering committees such as the American Academy of Orthopaedic Surgeons Diversity Advisory Board should monitor and report conference speaker diversity data to create systemwide accountability. Conference attendees and speakers should critically examine conference programs and raise concerns if they notice inequities. With these additional layers of accountability, orthopaedic surgery annual meetings may become more representative of their society members.
Introduction
Cultivating gender diversity is indispensable for meeting challenges facing health care and encouraging innovation in medicine [9]. A study showed that diverse groups identify and solve problems, make sense of new information, and perform at higher levels when responding to unfamiliar situations more effectively than less-diverse groups do [26]. Workplace diversity is especially relevant in health care. Recently, academic institutions have been making concerted efforts to diversify their faculty and students [1, 2, 10, 11, 16, 24, 28, 29, 32]. Additionally, two studies have shown that diversity in the physician workforce may help address health inequalities and lead to better patient outcomes [21, 30].
The percentage of women in United States medical schools has risen from 7% in 1965 [4] to nearly equal gender balance since 2000 [4]. Despite 20 years of gender parity in medical education, women physicians continue to be underrepresented in academic medicine, particularly in higher-level faculty positions. According to the 2014 Association of American Medical Colleges report, women constitute 39% of the full-time faculty members at academic medical centers [5, 6]. When categorized by academic rank, the percentage of women decreases to 25% for full professors, 18% for department chairs, and 16% for deans [25]. In the orthopaedic workforce, the gender disparity among medical school faculty is even more dramatic; women comprise 20% of assistant professors, 15% of associate professors, and 9% of full professors in orthopaedic surgery departments [7]. Of the 119 chairpersons of academic orthopaedic surgery departments in 2017, only one was a woman [8]. This phenomenon of decreasing numbers of women in higher academic ranks is often referred to as the “leaky pipeline” [27].
National recognition is a major determinant of academic appointment and promotion. Medical societies and their annual meetings are important platforms for physicians and their work to gain visibility. In fact, speaking roles are often used as a proxy for physicians’ regional and national contributions to their field [33]. Since promotion depends largely on proving a national reputation, the opportunity to speak at conferences is inextricably linked to academic advancement and building a robust faculty pipeline. As such, gender disparities among speaking roles at annual meetings may contribute to the gender imbalance in senior faculty positions, and thus contribute to the leaky pipeline phenomenon [12, 20]. To understand and affect this process, data on the current state of speaker diversity at orthopaedic annual meetings are needed. A recent study showed that overall, women were proportionately represented as conference speakers at a subset of orthopaedic subspecialty societies in 2008 and 2017 [31]. However, this study did not evaluate differences in speaker representation according to session topic or investigate society-level factors that could contribute to speakership disparities. Data on these issues is critical for the leadership and membership of orthopaedic societies to understand the current climate; only with this insight can they develop evidence-driven interventions to create equitable conferences, build a robust orthopaedic promotion pipeline, and foster a culture of inclusion.
Therefore, we asked: (1) Is the gender diversity of invited speakers at annual orthopaedic subspecialty society meetings proportional to society membership? (2) Are there differences in the proportion of women invited to speak in technical sessions (defined as sessions on surgical outcomes, surgical technique, nonsurgical musculoskeletal care, or basic science) versus nontechnical sessions (such as sessions on diversity, work-life balance, work environment, social media, education, or peer relationships)? (3) Does the presence of women on the society executive committee and annual meeting program committee correlate with the gender diversity of invited speakers? (4) Do societies with stated diversity efforts (the presence of a committee, task force, award, or grant designed to promote diversity, or the mention of diversity in the organization’s mission statement) have greater gender diversity in their invited speakers?
Materials and Methods
Societies
This is a cross-sectional study of American Academy of Orthopaedic Surgeons (AAOS)-recognized, national orthopaedic subspecialty or research societies in 2018 (Table 1) [3]. Nineteen societies met the inclusion criteria. Two societies, the Ruth Jackson Orthopaedic Society and J. Robert Gladden Orthopaedic Society, were excluded because they were founded with a primary focus on diversity. Societies with both open and closed membership structures were included.
Table 1.
Orthopaedic societies and their membership
| Society | Abbreviation | Total members | Number of men members | Number of women members | % women members |
| American Association of Hip and Knee Surgeons | AAHKS | 3953 | 3712 | 241 | 6% |
| American Association for Hand Surgery | AAHS | 1590 | 1211 | 379 | 24% |
| Arthroscopy Association of North America* | AANA | ||||
| American Orthopaedic Association | AOA | 1186 | 1075 | 111 | 9% |
| American Orthopaedic Foot and Ankle Society | AOFAS | 2015 | 1782 | 233 | 12% |
| American Orthopaedic Society for Sports Medicine | AOSSM | 2755 | 2497 | 258 | 9% |
| American Shoulder and Elbow Surgeons | ASES | 850 | 802 | 48 | 6% |
| American Society for Surgery of the Hand | ASSH | 4553 | 3801 | 752 | 17% |
| The Hip Society | Hip | 200 | 195 | 5 | 3% |
| The Knee Society | Knee | 198 | 196 | 2 | 1% |
| Limb Lengthening and Reconstruction Society | LLRS | 155 | 132 | 23 | 15% |
| Musculoskeletal Tumor Society | MSTS | 344 | 284 | 60 | 17% |
| North American Spine Society | NASS | 7252 | 6551 | 701 | 10% |
| Orthopaedic Research Society | ORS | 3428 | 2511 | 917 | 27% |
| Orthopaedic Trauma Association | OTA | 2410 | 2176 | 234 | 10% |
| Pediatric Orthopaedic Society of North America | POSNA | 1470 | 1130 | 340 | 23% |
| Society of Military Orthopaedic Surgeons | SOMOS | 692 | 607 | 85 | 12% |
| Total | 33,051 | 28,662 | 4389 | 13% |
The Arthroscopy Association of North America was not able to provide demographic information for their membership.
Society Membership
Societies were contacted by email or telephone for aggregate gender data from their 2018 membership records. Societies were asked to include all membership categories (full members, candidate members, corresponding members, and any others) in their membership count (Table 1). All 17 societies responded to our request for information. One society, the Arthroscopy Association of North America, was unable to provide membership data, so it was excluded from our analyses involving comparisons to membership. Two other societies did not track historical membership data and instead provided current membership information for 2019. Two societies did not track the demographic data of their members and instead provided a list of member names. For these societies, two coders (TC, DJK) undertook a prespecified process to assign gender to each member: First, traditional naming conventions were applied; for example, members with names such as “Gregory” or “Fred” were coded as men without further investigation. If there was any uncertainty about the gender of the member, a study team member conducted an internet search. Departmental websites, LinkedIn, and personal internet pages were sequentially investigated. If the gender of the individual could not be confirmed after this process, that individual was excluded from the analysis. To establish interrater reliability between the two coders (TC, DJK), 10% of content was cross coded to determine Cohen’s kappa. Cohen’s kappa for member gender was 0.9, indicating excellent agreement [14].
Overall, 13% (4389 of 33,051) of orthopaedic society members were women, ranging from 1% to 27% of members. In total, 6% (2012 of 33,051) of society members had an unknown gender, either because it was unknown to the society (that is, the member did not specify their gender in society records, n = 1926), or because the member’s gender could not be determined by the coders after exhausting the gender-coding process described above (n = 86). Gender remained unknown in less than 2% of members in each society, with the exceptions of AOSSM (30%, n = 1161), AOA (28%, n = 461, and ORS (8%, n = 290).
Conference Speakers
The final program for each society’s independent 2018 annual meeting was found online or provided electronically by that society. We did not study the AAOS Specialty Day meetings. We used conference programs to determine the number of men and women invited to speak at each society’s 2018 annual meeting, assigning gender according to the process described above. Speakers of all backgrounds were tabulated, irrespective of professional credentials (MD, PhD, RN). If we could not verify the gender of a speaker, the speaker was excluded from the analysis. The gender of less than 1% (23 of 3928) of speakers could not be identified by the two coders (TC, DJK) after exhausting the gender-coding process, and these individuals were therefore excluded. The Cohen’s kappa for speaker gender was 0.9, indicating excellent agreement [14].
Of note, this work studies invited meeting speakers, not speakers selected based on a blinded and/or peer-review process. Opportunities to present scientific abstracts, posters, or manuscripts are generally assigned based on blinded scientific review, so these were excluded from all counts and analyses.
To differentiate levels of prestige within speaking opportunities, two coders (TC, DJK) categorized invited speakers as plenary speakers, moderators, or panelists. Plenary speakers were defined as those delivering a keynote address or named lecture. Moderators were defined as those leading a session that included other speakers and presenters. Individuals introducing plenary speakers were also coded as moderators. Panelists were defined as speakers who lectured in a larger session. The Cohen’s kappa between the two coders for speaker role was 0.9, indicating excellent agreement [14].
Individuals speaking in multiple sessions during a conference were counted once for each session in which they participated. If a speaker held multiple roles or had multiple lectures during one session, they were only counted once for their highest role in that session. For example, if a moderator of a session also spoke as a panelist during the same session, that individual was only counted as a moderator.
The presence or absence of a panel consisting only of men, sometimes colloquially referred to as an “all-male panel,” was noted for each session. We defined this as a session that had two or more speakers, all of whom were men.
Technical versus Nontechnical Sessions
Sessions were defined as “technical sessions” if they focused directly on surgical outcomes, surgical technique, nonsurgical musculoskeletal care, or basic science. Sessions were defined as “nontechnical” if they did not fit the definition of “technical sessions,” above. The major subject-matter themes in nontechnical sessions were: diversity, work-life balance, work environment, social media, resident education, medical education, and peer relationships (Table 2). Two coders (TC, DJK) examined the title of each session and independently coded it as a technical or nontechnical session. Because of the subjective nature of this categorization, both coders cross-coded 100% of session titles. The Cohen’s kappa for the two coders was 0.8, indicating excellent agreement [14].
Table 2.
Example sessions for technical and nontechnical categorization
| Society | Technical sessions | Nontechnical sessions |
| ASSH | “Advanced Microsurgery Solutions” | “Emotional Aspects of Recovery” |
| ASSH | “Practical Pearls for Nerve Repair Algorithm” | “Excellence in Mentorship” |
| ORS | “In Vivo MicroCT Imaging: Longitudinal Assessment” | “Early Career After Party: Celebrate Diversity” |
| ORS | “Osseointegrated Prosthetic Limbs: Recent Developments” | “What Does Your CV/Resume Say About You?” |
| OTA | “Surgical Techniques: How I Do It: Elbow Injuries” | “Women in Orthopaedic Trauma” |
| OTA | “Chemicals and Compounds in Fracture Optimization” | “Maintaining Mid-Career Quality of Life” |
Full society names and abbreviations can be found in Table 1.
Gender Diversity of Society Executive Committee and Annual Meeting Program Committee
For each society, we obtained the names of executive board members, annual meeting planning committee members (or an equivalent), and chair of the annual meeting planning committee. When possible, we obtained this information from the annual meeting’s brochure. If the program brochure did not contain this information, societies directly provided the missing data. We then determined the genders of executive board members, annual meeting planning committee members, and conference chairs using the process described above. Individuals on the executive committee and program committee were combined for overall leadership analyses.
Stated Diversity Effort
We coded societies based on the presence of a committee, task force, award, or grant designed to promote diversity, or if diversity was included as part of the organization’s mission statement. These data were obtained through an exhaustive internet search of each society’s webpage.
Statistical Analysis
We used a chi-square or Fisher’s exact test to evaluate the independence of cross-tabulated counts. The results of analyses are expressed as odds ratios with 95% confidence intervals and associated p values. Ordinary least-squares regression was used to fit expressions characterizing linear relationships between variables. All statistical analyses were two-tailed, and a significance level of 0.05 was considered significant. Statistical tests were performed using SAS Base software version 9.4 (Cary, NC, USA). Additionally, when appropriate, we used the MedCalc Comparison of Proportions Calculator to compare proportions and calculate percent-difference with 95% confidence intervals [23].
Institutional review board approval for this study was waived, because this study was deemed to be nonhuman subject research by the institutional review board at Washington University School of Medicine in St. Louis, MO, USA.
Results
Gender Diversity of Invited Speakers Compared With Society Members
Overall, women society members were proportionately represented as annual meeting speakers. Women constituted a median (range) of 14% (535 of 3928, 0% to 33%) of annual meeting speakers compared with 13% (4389 of 33,051) of society members (% difference = 0.3% [95% CI -0.8% to 1.5%]; p = 0.60) (Fig. 1). Women constituted 11% (15 of 135) of plenary speakers, 15% (175 of 1162) of moderators, and 13% (345 of 2631) of panelists at 2018 annual meetings (Table 3). Ten of the 17 societies had no women as plenary speakers, which are the roles of highest prestige at an annual meeting. Of all conference panels, 59% (488 of 829) of panels were composed of only men, with a median (range) size of four speakers per all-men panel (two to 33 speakers) (Fig. 2).
Fig. 1.

This graph shows the gender breakdown of annual meeting speakers compared with corresponding society membership; AAHKS = American Association of Hip and Knee Surgeons; AAHS = American Association for Hand Surgery; AANA = Arthroscopy Association of North America; AOA = American Orthopaedic Association; AOFAS = Association of Foot and Ankle Surgeons; AOSSM = Association Orthopaedic Society for Sports Medicine; ASES = American Shoulder and Elbow Surgeons; ASSH = American Society for Surgery of the Hand; Hip = The Hip Society; Knee = The Knee Society; LRRS = Limb Lengthening and Reconstruction Society; MSTS = Musculoskeletal Tumor Society; NASS = North American Spine Society; ORS = Orthopaedic Research Society; OTA = Orthopaedic Trauma Association; POSNA = Pediatric Orthopaedic Society of North America; SOMOS = Society of Military Orthopaedic Surgeons.
Table 3.
Plenary, moderator, and panelist speaker data for each society
| Society | Plenary speakers | Moderators | Panelist speakers | All speakers | ||||
| Number of men | Number of women | Number of men | Number of women | Number of men | Number of women | Number of men | Number of women | |
| AAHKS | 1 | 0 | 33 | 0 | 46 | 0 | 80 | 0 |
| AAHS | 14 | 4 | 44 | 11 | 103 | 40 | 161 | 55 |
| AANA | 20 | 1 | 76 | 4 | 166 | 15 | 262 | 20 |
| AOA | 4 | 0 | 13 | 5 | 14 | 7 | 31 | 12 |
| AOFAS | 17 | 0 | 61 | 5 | 141 | 13 | 219 | 18 |
| AOSSM | 3 | 0 | 64 | 5 | 262 | 19 | 329 | 24 |
| ASES | 9 | 0 | 60 | 1 | 91 | 5 | 160 | 6 |
| ASSH | 10 | 2 | 139 | 40 | 722 | 143 | 871 | 185 |
| Hip | 3 | 0 | 20 | 1 | 88 | 0 | 111 | 1 |
| Knee | 2 | 0 | 0 | 0 | 75 | 1 | 77 | 1 |
| LLRS | 1 | 1 | 11 | 0 | 2 | 1 | 14 | 2 |
| MSTS | 3 | 0 | 15 | 9 | 2 | 1 | 20 | 10 |
| NASS | 3 | 1 | 125 | 20 | 183 | 25 | 311 | 46 |
| ORS | 9 | 4 | 136 | 57 | 55 | 25 | 200 | 86 |
| OTA | 6 | 2 | 111 | 4 | 208 | 13 | 325 | 19 |
| POSNA | 4 | 0 | 31 | 11 | 25 | 8 | 60 | 19 |
| SOMOS | 11 | 0 | 48 | 2 | 103 | 29 | 162 | 31 |
| Total | 120 | 15 | 987 | 175 | 2286 | 345 | 3393 | 535 |
AAHKS = American Association of Hip and Knee Surgeons; AAHS = American Association for Hand Surgery; AANA = Arthroscopy Association of North America; AOA = American Orthopaedic Association; AOFAS = Association of Foot and Ankle Surgeons; AOSSM = Association Orthopaedic Society for Sports Medicine; ASES = American Shoulder and Elbow Surgeons; ASSH = American Society for Surgery of the Hand; Hip = The Hip Society; Knee = The Knee Society; LRRS = Limb Lengthening and Reconstruction Society; MSTS = Musculoskeletal Tumor Society; NASS = North American Spine Society; ORS = Orthopaedic Research Society; OTA = Orthopaedic Trauma Association; POSNA = Pediatric Orthopaedic Society of North America; SOMOS = Society of Military Orthopaedic Surgeons.
Fig. 2.

This graph shows the percentage of all-men panels at each society’s annual meeting. The Limb Lengthening and Reconstruction Society is excluded from this figure because they had only one panel at their meeting; AAHKS = American Association of Hip and Knee Surgeons; AAHS = American Association for Hand Surgery; AANA = Arthroscopy Association of North America; AOA = American Orthopaedic Association; AOFAS = Association of Foot and Ankle Surgeons; AOSSM = Association Orthopaedic Society for Sports Medicine; ASES = American Shoulder and Elbow Surgeons; ASSH = American Society for Surgery of the Hand; Hip = The Hip Society; Knee = The Knee Society; MSTS = Musculoskeletal Tumor Society; NASS = North American Spine Society; ORS = Orthopaedic Research Society; OTA = Orthopaedic Trauma Association; POSNA = Pediatric Orthopaedic Society of North America; SOMOS = Society of Military Orthopaedic Surgeons.
Proportion of Women Speakers in Technical versus Nontechnical Speaking Roles
Women were more likely than men to have nontechnical speaking roles. A total of 6% (32 of 535) of women’s speaking roles were nontechnical, whereas 2% (51 of 3393) of men’s speaking roles were nontechnical (OR 4.2 [95% CI 2.7 to 6.5]; p < 0.001). Women were overrepresented in nontechnical speaking roles compared with overall society membership. Women comprised 39% (32 of 83) of all nontechnical speakers but comprised 13% (4389 of 33,051) of society members (% difference 26% [95% CI 16.2 to 36.8]; p < 0.001).
Women in Society Leadership Roles and Gender Diversity of Invited Speakers
There was a positive correlation between women in leadership roles and women in speaking roles at a society’s conference; that is, as the number of women in leadership increased across the societies surveyed, so did their presence in speaking roles in those societies (r = 0.73; p < 0.001) (Fig. 3). Women held 10% (24 of 250) of executive board positions and 9% (14 of 159) of program committee positions (Fig. 4). Twenty-three of 24 conference program chairpersons were men (Fig. 5).
Fig. 3.
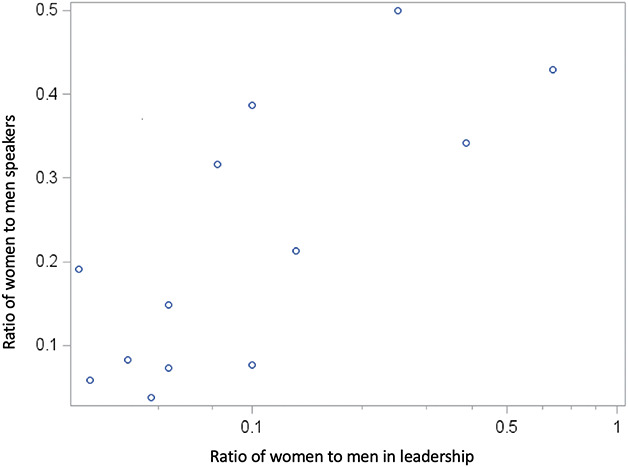
This graph shows the relationship between the proportion of women as meeting speakers and the proportion of women as society leaders.
Fig. 4.

This graph shows the gender breakdown of executive board and program committee leadership roles by society; E = executive board; P = program committee; AAHKS = American Association of Hip and Knee Surgeons; AAHS = American Association for Hand Surgery; AANA = Arthroscopy Association of North America; AOA = American Orthopaedic Association; AOFAS = Association of Foot and Ankle Surgeons; AOSSM = Association Orthopaedic Society for Sports Medicine; ASES = American Shoulder and Elbow Surgeons; ASSH = American Society for Surgery of the Hand; Hip = The Hip Society; Knee = The Knee Society; MSTS = Musculoskeletal Tumor Society; NASS = North American Spine Society; ORS = Orthopaedic Research Society; OTA = Orthopaedic Trauma Association; POSNA = Pediatric Orthopaedic Society of North America; SOMOS = Society of Military Orthopaedic Surgeons.
Fig. 5.

This graph shows the number and gender of conference chairpersons by society; AAHKS = American Association of Hip and Knee Surgeons; AAHS = American Association for Hand Surgery; AANA = Arthroscopy Association of North America; AOA = American Orthopaedic Association; AOFAS = Association of Foot and Ankle Surgeons; AOSSM = Association Orthopaedic Society for Sports Medicine; ASES = American Shoulder and Elbow Surgeons; ASSH = American Society for Surgery of the Hand; Hip = The Hip Society; Knee = The Knee Society; MSTS = Musculoskeletal Tumor Society; NASS = North American Spine Society; ORS = Orthopaedic Research Society; OTA = Orthopaedic Trauma Association; POSNA = Pediatric Orthopaedic Society of North America; SOMOS = Society of Military Orthopaedic Surgeons.
Speaker Diversity in Societies With and Without Stated Diversity Efforts
Societies with stated diversity efforts had greater gender diversity in their invited speakers. Seven of 17 societies had a diversity statement or initiative. Societies with a diversity effort had 19% (375 of 1997) women speakers in their programs compared with 8% (160 of 1931) women speakers in societies without a diversity effort (OR 2.6 [95% CI 2.1 to 3.1]; p < 0.001).
Discussion
Annual meetings are important platforms for physicians to gain visibility and build a national reputation, both of which are important for promotion and tenure decisions [33]. As such, gender disparities within speaking roles at annual meetings may contribute to the gender imbalance in senior faculty [12, 20] that has been described as the leaky pipeline of women in academic medicine [27]. Although a preliminary study of conference speakership in orthopaedic surgery has been conducted [31], it was still unknown whether there are gender disparities in speaking roles based on session topics or whether there are society-level factors that could be associated with speakership disparities.
There are several limitations to our work. Most importantly, as a cross-sectional study, it does not provide information about trends in gender representation over time, and our results may not reflect the true gender representation of a society’s annual meeting speakers if 2018 was an anomalous year. We were unable to compare historical society speakership and membership because of the lack of membership records kept by each society; for this reason, we encourage societies to maintain yearly membership records that include demographic information to assess trends, both for internal monitoring and future research efforts. In spite of this limitation, our study uniquely comments upon the current diversity environment at annual meetings, which we hope will provide a baseline for future comparison and inspire data-driven improvements.
Our study is also limited by the imperfect comparison of society speakers to the membership denominator. A society’s annual meeting speakers are not only drawn from its membership (that is, speakers are often but not always members), and societies may have nonphysician members (such as midlevel providers) who may be less likely to speak. Additionally, several societies were missing substantial amounts of gender data for their membership. Although our approach captures speakers and members of all types, including nonclinical researchers, midlevel providers, and physical therapists, it does not evaluate gender representation within specific professional identities (for example, midlevel provider speakers compared with midlevel provider members). Considering all of these factors, we felt that broadly comparing society speakership to membership would best reflect who was on the stage versus in the audience at meetings, thereby providing a perspective on overall gender representation and inclusion. In addition, our choice to compare speakership to society membership may actually underestimate the true speakership disparities in academia. Given that women comprise 13% of society members and 19% of orthopaedic faculty members, women may in fact be underrepresented on the level of society membership [7]. In several societies, membership requires some form of nomination, sponsorship, or invitation. If membership itself is a barrier to inclusion, the exclusion of women from speaking roles would not be captured by using membership as a denominator; for example, minimal representation of women would still be considered proportional in a “closed” society that admits very few women as members.
Other limitations of our study include the subjective classification of sessions as technical and nontechnical. We attempted to mitigate this by requiring both coders to categorize independently all sessions and resolve discrepancies through consensus; we also note that even before the consensus process, the interobserver agreement was excellent (kappa of 0.8), so any impact of subjectivity should have been minimal here. Finally, we recognize that gender diversity is only one form of diversity. Given the demographic data available, we were unable to examine racial, ethnic, religious, sexual orientation, disability, or other forms of diversity, or assess the effects of intersectionality. These are important areas of future research.
Gender Diversity of Invited Speakers and Society Members
Our finding that, in general, women were proportionately represented as annual meeting speakers is aligned with a previous study on gender diversity across orthopaedic society meetings [31]. However, within this overall finding, our data revealed a large variation in proportionate representation, from no women speakers in one society to the proportion of women speakers being twice that of women members in another society. This is consistent with prior research on general surgery meetings, which describes roughly proportionate representation of speakers overall, with a wide range between societies [17]. Societies with speaker representation disproportionate to their membership should critically analyze the inclusivity of their speaker selection process, and society leaders should direct conference planning committees to proactively monitor the gender balance of their meeting programs. Based on solutions proposed in general surgery, orthopaedic surgery societies could improve gender equity among speakers by decreasing the proportion of all-men panels and including women as plenary speakers in conference programs [17].
Proportion of Women Speakers in Technical versus Nontechnical Speaking Roles
When assessing gender balance on the podium, it is important to consider the subjects on which women are invited to speak. In our study, women were overrepresented in nontechnical speaking roles. Similar patterns have been reported in studies of political legislative structures, which have found that women tend to be overrepresented on women’s issues and social issues committees, while underrepresented on power and economics committees [18]. In both the political and the orthopaedic arenas, women seem to be relegated to secondary topics, which may be associated with lower prestige. This is not to say that nontechnical topics are less important, but they may be seen as less substantial in the context of a meeting where the primary stated focus of the society is technical. Limiting the roles available to women prevents their full inclusion; as such, overrepresenting women in nontechnical sessions and underrepresenting them in technical sessions effectively constitutes a form of professional marginalization within orthopaedics. This could be improved by reassessing the gender balance of technical session roles and making intentional efforts to include women as experts on clinical and surgical topics in addition to sessions about work-life balance, mentorship, and diversity. Societies have the opportunity to encourage or require meeting planning committees to achieve proportional gender representation in both nontechnical and technical speaking roles. Doing so would promote equality of opportunity and help move the specialty away from gender-stereotyped topics.
Women in Society Leadership Roles and Gender Diversity of Invited Speakers
Our findings regarding the positive association between diversity in society leadership and gender diversity of meeting speakers are well-supported by prior work. Studies of speaker diversity in several scientific disciplines have shown that the gender diversity of conference organizing committees is directly correlated with the gender diversity of conference speakers [13, 17, 19]. Increasing the representation of women within society and program committee leadership could be one possible intervention to generate greater diversity in conference programming. It has been theorized that the positive relationship between women in society leadership positions and women speakers could be a function of underlying society values that generally support the contributions of women, or that women in leadership roles are more likely than men to recommend women for open positions [13, 17]. For societies aiming to improve the gender diversity of their meeting programming, we would recommend increasing the representation of women on program committees and within other society leadership roles.
Speaker Diversity in Societies With and Without Stated Diversity Efforts
We found that societies with stated diversity efforts had greater proportions of women speakers at their annual meetings. Although our data cannot establish causality or explain the mechanism of this association, we speculate that such diversity efforts can have an impact on several levels. Including diversity in society mission statements can encourage individuals who share this value to feel included and apply for membership or leadership positions. By establishing equity as an organizational and cultural value, this can also encourage individuals to raise concerns about observed disparities or suggest opportunities for improvement. Another type of effort was the creation of taskforces, subcommittees, or specific initiatives with a focus on diversity. In a world of competing demands and interests, this ensures that resources including effort, time, and funding are directed toward diversity measures, which might otherwise be easily and inadvertently overlooked. As with all initiatives, tracking progress is critical to measure effectiveness [22]; however, to our knowledge, such evaluation of diversity efforts has been lacking to this point. We recommend that societies obtain and compare demographic data about their membership, leadership, and speakers over time to determine whether diversity efforts are achieving their intended goals.
Conclusions
Gender diversity has been recognized as a need in orthopaedic surgery but has not yet been comprehensively examined in the context of annual meeting speakers. We observed that representation of women speakers was largely proportionate to the membership of women in societies overall; however, it varied widely between societies, and women were underrepresented in technical compared with nontechnical sessions. Individual societies, national oversight committees, invited speakers, and conference attendees all contribute to improving these disparities by creating layers of accountability. We encourage all societies to critically examine the inclusivity of their speaker selection practices to promote equitable representation of women. There are several actionable findings from our work that societies can leverage to improve in this respect. Women were overrepresented as speakers in nontechnical sessions compared with technical sessions. Societies should actively monitor the gender balance of topic assignments and direct conference organizing committees to create programs with equitable gender representation across session types. Societies with more women in leadership roles and stated diversity efforts had higher proportions of women speakers, representing two strategies that may help promote equity in annual meeting visibility.
In addition to societies independently monitoring their own speakership data, we would recommend that oversight committees, such as the AAOS Diversity Advisory Board or AAOS Board of Orthopaedic Specialty Societies, monitor speakership diversity data to create system-wide accountability. Transparent reporting of long-term trends will expand upon our data to further inform strategies for change. We encourage conference speakers to inquire about the gender-diversity of the sessions in which they have been asked to participate, and to raise awareness when they notice gender imbalance. As an example, Dr. Francis Collins, Director of the National Institute of Health, recently stated that he would refuse to be a meeting speaker if attention to inclusiveness was not evident in the meeting agenda [15]. Similarly, conference attendees should notify organizers when they see inequities in conference programs and draw attention to their concerns [20]. With these four layers of accountability, orthopaedic surgery annual meetings can truly become representative of their society members.
Acknowledgments
We thank all of the orthopaedic societies that contributed data for this study.
Footnotes
Each author certifies that he or she has no commercial associations (consultancies, stock ownership, equity interest, patent/licensing arrangements, etc) that might pose a conflict of interest in connection with the submitted article.
All ICMJE Conflict of Interest Forms for authors and Clinical Orthopaedics and Related Research® editors and board members are on file with the publication and can be viewed on request.
Each author certifies that his or her institution waived approval for this investigation and that all investigations were conducted in conformity with ethical principles of research.
References
- 1.Achenjang JN, Elam CL. Recruitment of Underrepresented Minorities in Medical School Through a Student-led Initiative. J Natl Med Assoc . 2016;108:147–151. [DOI] [PubMed] [Google Scholar]
- 2.Acosta D, Olsen P. Meeting the needs of regional minority groups: The University of Washington’s programs to increase the American Indian and Alaskan Native physician workforce. Acad Med . 2006;81:863-870. [DOI] [PubMed] [Google Scholar]
- 3.American Academy of Orthopaedic Surgeons. Board of Specialty Societies. 2019. Available at: https://www.aaos.org/about/governance-overview/board-of-specialty-societies/. Accessed August 12, 2019.
- 4.Association of American Medical Colleges. Table 1: Medical Students, Selected Years, 1965-2015. Available at: https://www.aamc.org/download/481178/data/2015table1.pdf. Accessed September 29, 2018.
- 5.Association of American Medical Colleges. Table 6A: 2015 Benchmarking full time women faculty new hires and departures. 2016. Available at: https://www.aamc.org/system/files/reports/1/2015table6a.pdf. Accessed April 22, 2018.
- 6.Association of American Medical Colleges. Table 3: Distribution of Full-Time Faculty by Department, Rank, and Gender, 2015. Available at: https://www.aamc.org/download/481182/data/2015table3.pdf. Accessed April 22, 2018.
- 7.Association of American Medical Colleges. Table 13: U.S. Medical School Faculty by Sex, Rank, and Department, 2016. Available at: https://www.aamc.org/download/475530/data/16table13.pdf. Accessed April 22, 2018.
- 8.Association of American Medical Colleges. Department Chairs by Department, Sex, and Race/Ethnicity, 2017. Available at: https://www.aamc.org/download/486590/data/supplementaltablec.pdf. Accessed December 20, 2018.
- 9.Bickel J, Wara D, Atkinson BF, Cohen LS, Dunn M, Hostler S, Johnson TRB, Morahan P, Rubenstein AH, Sheldon GF, Stokes E, Association of American Medical Colleges Project Implementation Committee. Increasing women’s leadership in academic medicine: report of the AAMC Project Implementation Committee. Acad Med . 2002;77:1043–61. [DOI] [PubMed] [Google Scholar]
- 10.Byrd D, Razani J, Suarez P, Lafosse JM, Manly J, Attix DK. Diversity Summit 2008: challenges in the recruitment and retention of ethnic minorities in neuropsychology. Clin Neuropsychol . 2010;24:1279–91. [DOI] [PubMed] [Google Scholar]
- 11.Capers Q, McDougle L, Clinchot DM. Strategies for Achieving Diversity through Medical School Admissions. J. Health Care Poor Underserved. 2018;29:9–18. [DOI] [PubMed] [Google Scholar]
- 12.Carley S, Carden R, Riley R, May N, Hruska K, Beardsell I, Johnston M, Body R. Are there too few women presenting at emergency medicine conferences? Emerg Med J . 2016;33:681–683. [DOI] [PubMed] [Google Scholar]
- 13.Casadevall A, Handelsman J. The Presence of Female Conveners Correlates with a Higher Proportion of Female Speakers at Scientific Symposia. MBio. 2014;5:e00846-13. [DOI] [PMC free article] [PubMed] [Google Scholar]
- 14.Cicchetti D V., Sparrow SA. Developing criteria for establishing interrater reliability of specific items: Applications to assessment of adaptive behavior. Am J Ment Defic . 1981;86:127–137. [PubMed] [Google Scholar]
- 15.Collins F. Time to End the Manel Tradition. 2019. Available at: https://www.nih.gov/about-nih/who-we-are/nih-director/statements/time-end-manel-tradition. Accessed December 11, 2019.
- 16.Dalley B, Podawiltz A, Castro R, Fallon K, Kott M, Rabek J, Richardson J, Thomson W, Ferry P, Mabry B, Hermesmeyer P, Smith Q. The Joint Admission Medical Program: a statewide approach to expanding medical education and career opportunities for disadvantaged students. Acad Med . 2009;84:1373–82. [DOI] [PubMed] [Google Scholar]
- 17.Gerull KM, Wahba BM, Goldin LM, McAllister J, Wright A, Cochran A, Salles A. Representation of women in speaking roles at surgical conferences. Am J Surg . 2019 Sep 9. pii: S0002-9610(19)30598-7. [DOI] [PubMed] [Google Scholar]
- 18.Heath RM, Schwindt-Bayer LA, Taylor-Robinson MM. Women on the sidelines: Women’s representation on committees in Latin American legislatures. Am J Pol Sci . 2005;49:420–436. [Google Scholar]
- 19.Isbell LA, Young TP, Harcourt AH. Stag Parties Linger: Continued Gender Bias in a Female-Rich Scientific Discipline. PLoS One. 2012;7:e49682. [DOI] [PMC free article] [PubMed] [Google Scholar]
- 20.Klein RS, Voskuhl R, Segal BM, Dittel BN, Lane TE, Bethea JR, Carson MJ, Colton C, Rosi S, Anderson A, Piccio L, Goverman JM, Benveniste EN, Brown MA, Tiwari-Woodruff SK, Harris TH, Cross AH. Speaking out about gender imbalance in invited speakers improves diversity. Nat Immunol . 2017;18:475–478. [DOI] [PMC free article] [PubMed] [Google Scholar]
- 21.Marrast LM, Zallman L, Woolhandler S, Bor DH, McCormick D. Minority physicians’ role in the care of underserved patients: Diversifying the physicianworkforce may be key in addressing health disparities. JAMA Intern Med . 2014;174:289-291. [DOI] [PubMed] [Google Scholar]
- 22.Martin JL. Ten Simple Rules to Achieve Conference Speaker Gender Balance. PLoS Comput Biol . 2014;10:e1003903. [DOI] [PMC free article] [PubMed] [Google Scholar]
- 23.Comparison MedCalc. of proportions calculator. Available at: https://www.medcalc.org/calc/comparison_of_proportions.php. Accessed April 1, 2020.
- 24.O’Reilly SL, Milner J. Supporting culturally and linguistically diverse students during clinical placement: strategies from both sides of the table. BMC Med Educ . 2015;15:175. [DOI] [PMC free article] [PubMed] [Google Scholar]
- 25.Paturel A. Where are all the women deans? AAMC News. Available at: https://www.aamc.org/news-insights/where-are-all-women-deans. Accessed December 20, 2019.
- 26.Rock D, Grant H. Why Diverse Teams Are Smarter. Harvard Business Review. Available at: https://hbr.org/2016/11/why-diverse-teams-are-smarter. Accessed December 20, 2018.
- 27.Sexton KW, Hocking KM, Wise E, Osgood MJ, Cheung-Flynn J, Komalavilas P, Campbell KE, Dattilo JB, Brophy CM. Women in Academic Surgery: The Pipeline Is Busted. J Surg Educ . 2012;69:84–90. [DOI] [PMC free article] [PubMed] [Google Scholar]
- 28.Sheridan JT, Fine E, Pribbenow CM, Handelsman J, Carnes M. Searching for Excellence & Diversity: Increasing the Hiring of Women Faculty at One Academic Medical Center. Acad Med . 2010;85:999–1007. [DOI] [PMC free article] [PubMed] [Google Scholar]
- 29.Smith SG, Nsiah-Kumi P a, Jones PR, Pamies RJ. Pipeline programs in the health professions, part 1: preserving diversity and reducing health disparities. J Natl Med Assoc . 2009;101:836-840, 845-851. [DOI] [PubMed] [Google Scholar]
- 30.Spector ND, Overholser B. Examining Gender Disparity in Medicine and Setting a Course Forward. JAMA Netw Open. 2019;2:e196484. [DOI] [PubMed] [Google Scholar]
- 31.Tougas C, Valtanen R, Bajwa A, Beck J. Gender of Presenters at Orthopaedic Meetings Reflects Gender Diversity of Society Membership. J Orthop . 2019;19:212–217. [DOI] [PMC free article] [PubMed] [Google Scholar]
- 32.Valantine H, Sandborg CI. Changing the Culture of Academic Medicine to Eliminate the Gender Leadership Gap. Acad Med . 2013;88:1411–1413. [DOI] [PMC free article] [PubMed] [Google Scholar]
- 33.Washington University School of Medicine. Washington University School of Medicine Appointments & Promotions Guidelines and Requirements. 2014. Available at: https://biochem.wustl.edu/data/pdfs/forms_info/APGAR.pdf. Accessed September 29, 2018.