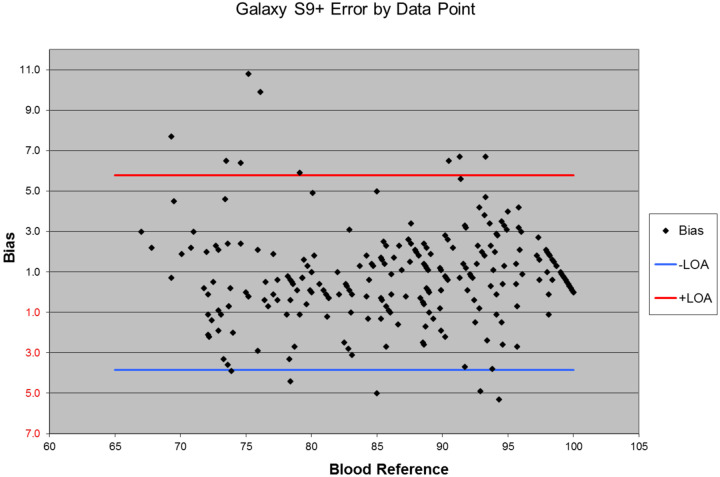
Figure 3:
Plot of data collected from 12 human volunteers during this test of the bias in blood oxygen measurements. Each point on the plot represents paired blood oxygen levels recorded by the hemoximeter associated with the Samsung Phone reading. The upper and lower limits of agreement per Bland Altman 200717 are shown in red and blue lines respectively.

