

Abstract
Background:
Gastric cancer, characterized by insidious onset and multiple metastasis, is almost incurable and has poor prognosis, and also one of the leading causes of treatment failure and death in patients with gastric cancer (GC). However, the prognosis of collagen type V alpha2 chain (COL5A2) in GC and renal metastasis is unknown.
Methods:
Recruited 148 patients who underwent GC. The diagnosis of GC was confirmed by ultrasound imaging and pathological examination. Immunohistochemistry and RT-qPCR were performed to exam the expression level of COL5A2. The statistical methods included Pearson chi-square test, Spearman-rho correlation test, univariate and multivariate cox regression analysis. Finally, this research constructed receiver operating characteristic (ROC) curves and applied the area under the curve (AUC).
Results:
Based on Pearson's chi-square test, Spearman-rho test, and univariate/multivariate cox regression, pathologic grade (P < .001), renal metastasis (P < .001) and staging (P < .001) were significantly related to COL5A2. And COL5A2 expression (hazard ratio [HR]: 18.834, P < .001) is an independent risk factor of GC. The AUC was used as the degree of confidence in judging each factor: COL5A2 (AUC = 0.878, P < .001), COL1A1 (AUC = 0.636, P = .006), COL1A2 (AUC = 0.545, P = .368), and COL3A1 (AUC = 0.617, P = .019). Through the ROC result, COL5A2 had more advantage as a biomarker for GC than other collagens.
Conclusions:
COL5A2 gene expression level might be a risk factor for GC. COL5A2 has a strong correlation with the prognosis of the disease.
Keywords: collagen type V alpha2 chain, gastric cancer, overall survival, pathologic grade, renal metastasis
1. Introduction
Gastric cancer (GC), as one of the most common malignant tumors, is featured with high degree of malignancy, rapid development, strong invasiveness and poor prognosis.[1,2] GC can form metastasis in liver, lung, kidney, adrenal gland, brain and other places.[3] Renal metastasis of GC, characterized by insidious onset and multiple metastasis, is almost incurable and has poor prognosis, and also one of the leading causes of treatment failure and death in patients with GC. Although serum tumor markers, imaging and other related techniques have been improved, most GC patients with renal metastasis have insidious onset and poor surgical and drug treatment results.[4,5] Therefore, gene research related to renal metastasis of GC is of great importance, which is expected to provide new methods for diagnosis and treatment of the disease.[6]
Collagen type V alpha2 chain (COL5A2) plays an important role in immune system regulation, angiogenesis and tumor metastasis, which is involved in the development of colorectal cancer, breast tumor and osteosarcoma.[7–9] Research shows when the expression of COL5A2 increased, tumor cells showed unlimited growth and angiogenesis, and the expression of related cytokines such as VEGF and P53 increased.[10–12] COL5A2 may be potential biomarkers and therapeutic targets for GC.[13] However, the prognosis of COL5A2 in GC with renal metastasis is unknown.
Therefore, specific aim of the research was to explore the influence of COL5A2 on renal metastasis of GC and provide scientific basis for the management and prevention of the disease.
2. Methods
2.1. Patients and ethics
The study subjects were 148 patients who underwent surgery in Weifang People's Hospital between November 2014 and December 2019. The inclusion criteria are: 18 to 80 years old, patients with pathologic diagnosis of renal metastasis from GC, patients without surgical history will be screened out for inclusion criteria. Exclusion criteria included: age <18 or >80 years, patients with poor cardiac function, pulmonary function and liver and kidney function who could not tolerate surgery, patients requiring emergency surgery.
This study was approved by the Ethics Committee of Weifang People's Hospital. Written informed consent was obtained from all patients.
2.2. Diagnosis of renal metastasis from GC and the tissues
A diagnosis of GC was made by colonoscopy and pathology. And the GC tissues were also obtained from the patients with GC. All samples were then stored at −80°C until RNA isolation was performed.
2.3. Clinical characteristic index
Additional data recorded included clinical information, such as sex, age, tumor size, pathologic grade, renal metastasis, staging.
2.4. Immunohistochemistry
The slices of GC tissues were placed in xylene, 95% ethanol and 80% ethanol. Rinse with tap water for 3 times and soak in PBS for 5 minutes, 2 times in total. PBS solution was soaked for 5 minutes, twice in total. Methanol hydrogen peroxidewas soaked for 20 minutes. Slide was wiped, slide was placed in a wet box, the appropriate concentration of COL5A2 monoclonal anti-antibody (ab7046, Abcam, UK) was added to the tissue drip, so that the antibody fully covered the tissue, and the slide was placed in the refrigerator at 4°C overnight. The 50 μl immunochromogenic agent was added to the tissue to make it fully cover the tissue and incubated at room temperature for 25 minutes. The neutral resin seal sheet and read the sheet under a microscope.
2.5. RT-qPCR
GC tissues of patients were obtained via surgery and preserved at −80°C immediately. RT-qPCR was performed on a Roche LightCycler 480 instrument (Roche, Basel, Switzerland) using 2× SG Fast qPCR Master Mix (Sangon, Shanghai, China). All experiments were repeated twice, and the Cp-values were pre-converted into relative quantities (Q) using the equation Q = 2−ΔCp for subsequent statistical analysis. This study was done with reference to Minimum Information for Publication of Quantitative Real-Time PCR Experiments (MIQE) recommendation 23, to detecting the expression of COL5A2 by RT-qPCR. GAPDH was used as an endogenous control. Primers were showed in the Table 1.
Table 1.
Primers and their sequences for PCR analysis.
| Primer | Sequence (5′–3′) |
| COL5A2-hF | AACATCAGTTGGGTGGAG |
| COL5A2-hR | CTTGAAATCGGTGTAGGC |
| COL1A1-hF | TGGGCAACAGTGCGAGAT |
| COL1A1-hR | GGAGGGCCACCAACAACA |
| COL1A2-hF | GAAGCCGGGACCTCTAAC |
| COL1A2-hR | GAGGCTGACATACGAGATAAGG |
| COL3A1-hF | TAGGTTAGTGAAGGCTATT |
| COL3A1-hR | TGCCCTGAAGTAAAGAAG |
| GAPDH-hF | ATCCGATTACCGATACCTAGACC |
| GAPDH-hR | ATGGACTATATCCGACGACGA |
2.6. Statistical analysis
The data statistics are presented as sample size and percentage of total. Pearson chi-square test was used to analyze the relationship between COL5A2 and related clinical factors. Correlation analysis was performed using the Spearman-rho correlation test to further examine the correlation between the two. Univariate and multivariate cox regression analyses were used to calculate hazard ratios (HRs) for each variable based on their statistical results. Finally, we used the Kaplan–Meier method to explore overall survival (OS). Finally, we constructed receiver operating characteristic (ROC) curves and applied the area under the curve (AUC) to assess the accuracy and sensitivity of COL5A2, COL1A1, COL1A2, and COL3A1 in diagnosing OS of the GC patients.
All statistical analyses were conducted using SPSS software, version 24.0 (IBM Corp., Armonk, NY, USA). A P value <.05 was considered statistically significant.
3. Results
3.1. The averages of COL5A2 expression in different groups
The Table 2 showed the mean ± standard deviation of COL5A2 expression in the different groups. And COL5A2 expression by different scatter plots in different groups was manifested in the Figure 1. There were significant correlations among the COL5A2 expression and pathologic grade, renal metastasis, staging (Fig. 1).
Table 2.
The averages of COL5A2 expression in different groups.
| COL5A2 expression | ||
| Characteristic | Mean ± standard deviation | |
| Sex | ||
| Male | 61 | 9.206 ± 4.794 |
| Female | 87 | 8.975 ± 5.423 |
| Age | ||
| <65 yr | 72 | 10.101 ± 5.055 |
| ≥65 yr | 76 | 8.093 ± 5.094 |
| Tumor size | ||
| <5 cm | 63 | 8.222 ± 5.365 |
| ≥5 cm | 85 | 9.698 ± 4.936 |
| Pathologic grade | ||
| I | 36 | 6.227 ± 5.357 |
| II | 49 | 7.866 ± 4.291 |
| III | 63 | 11.631 ± 4.484 |
| Renal metastasis | ||
| No | 87 | 7.819 ± 5.319 |
| Yes | 61 | 10.854 ± 4.370 |
| Staging | ||
| I | 28 | 4.452 ± 4.161 |
| II | 39 | 5.874 ± 3.786 |
| III | 33 | 12.178 ± 4.039 |
| IV | 48 | 12.223 ± 3.525 |
Figure 1.
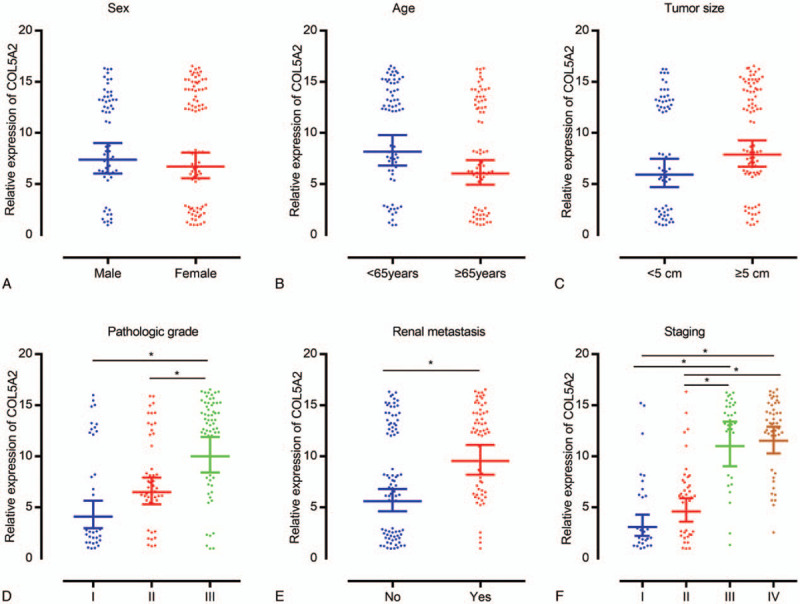
COL5A2 expression by different scatter plots in different groups. (A) Sex, (B) age, (C) tumor size, (D) pathologic grade, (E) renal metastasis, and (F) staging. ∗P < .05.
The cases were classed into 3 group based on the expression of COL5A2: the labeling of + represents the weak expression of COL5A2, and the averages of COL5A2 expression in the + group is 1.923; the labeling of ++ represents the medial expression of COL5A2, and the averages of COL5A2 expression in the ++ group is 6.851; the labeling of +++ represents the strong expression of COL5A2, and the averages of COL5A2 expression in the +++ group is 14.006. The immunohistochemistry result could compare the scoring to show the expression level of COL5A2 in different tumor tissues (+, ++, +++) (Fig. 2).
Figure 2.
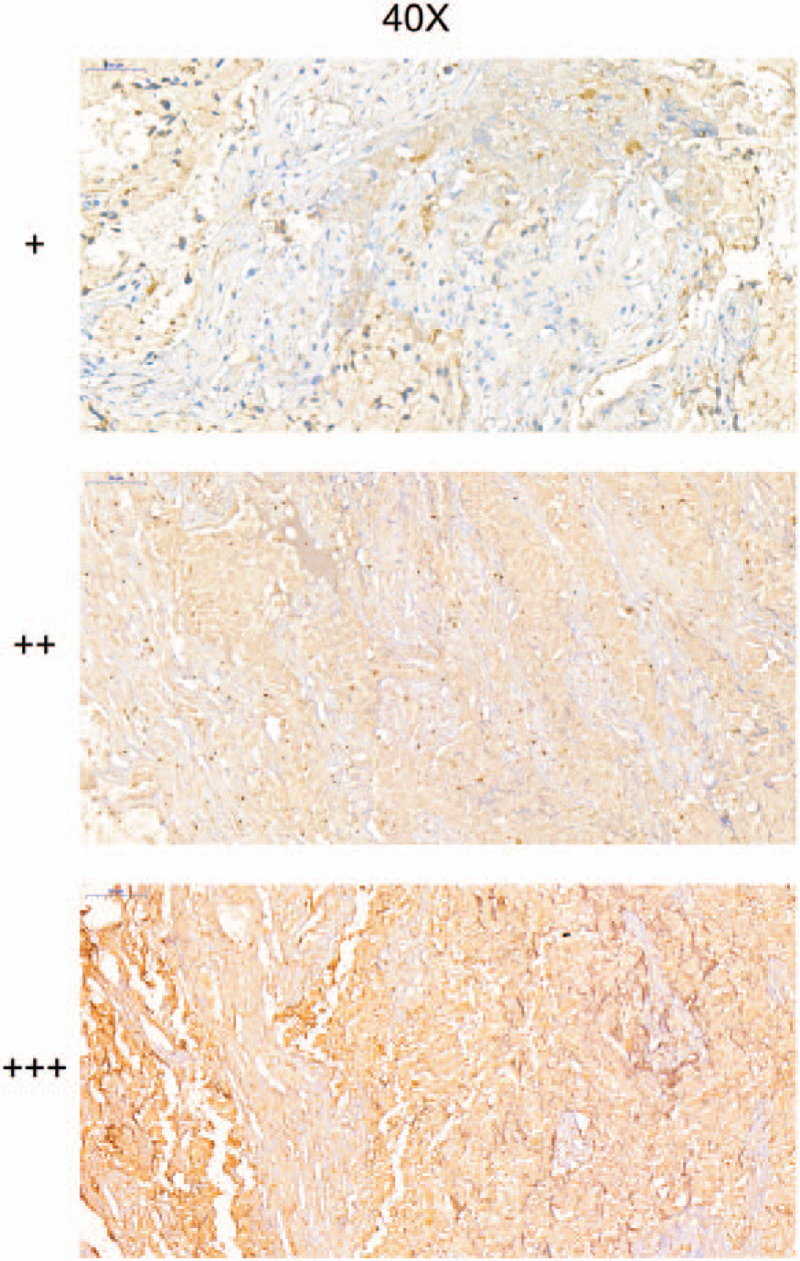
The immunohistochemistry to show the expression level of COL5A2 in different tumor tissues.
3.2. Associations between characteristics and COL5A2 based on chi-square test
Table 3 summarized the associations between COL5A2 and the related clinical factors according to the Pearson's chi-squared test. Among the individuals, pathologic grade (P < .001), renal metastasis (P < .001) and staging (P < .001) were markedly related to the COL5A2. However, no significant associations were found between sex (P = .299), age (P = .145), tumor size (P = .118) and COL5A2.
Table 3.
Clinicopathological variables and the expression status of COL5A2.
| COL5A2 | |||||
| + (%) | ++ (%) | +++ (%) | P | ||
| Sex | |||||
| Male | 61 | 11 (7.4%) | 21 (14.2%) | 29 (19.6%) | .299 |
| Female | 87 | 24 (16.2%) | 22 (14.9%) | 41 (27.7%) | |
| Age | |||||
| <65 yr | 72 | 14 (9.5%) | 18 (12.2%) | 40 (27.0%) | .145 |
| ≥65 yr | 76 | 21 (14.2%) | 25 (16.9%) | 30 (20.3%) | |
| Tumor size | |||||
| <5 cm | 63 | 20 (13.5%) | 15 (10.1%) | 28 (18.9%) | .118 |
| ≥5 cm | 85 | 15 (10.1%) | 28 (18.9%) | 42 (28.4%) | |
| Pathologic grade∗ | |||||
| I | 36 | 20 (13.5%) | 5 (3.4%) | 11 (7.4%) | <.001∗ |
| II | 49 | 9 (6.1%) | 26 (17.6%) | 14 (9.5%) | |
| III | 63 | 6 (4.1%) | 12 (8.1%) | 45 (30.4%) | |
| Renal metastasis∗ | |||||
| No | 87 | 31 (20.9%) | 24 (16.2%) | 32 (21.6%) | <.001∗ |
| Yes | 61 | 4 (2.7%) | 19 (12.8%) | 38 (25.7%) | |
| Staging∗ | |||||
| I | 28 | 18 (12.2%) | 7 (4.7%) | 3 (2.0%) | <.001∗ |
| II | 39 | 14 (9.5%) | 20 (13.5%) | 5 (3.4%) | |
| III | 33 | 2 (1.4%) | 6 (4.1%) | 25 (16.9%) | |
| IV | 48 | 1 (0.7%) | 10 (6.8%) | 37 (25.0%) | |
3.3. Further associations between potentially characteristics and COL5A2 by Spearman's correlation test
Spearman's correlation coefficient displayed that COL5A2 were significantly correlated with the pathologic grade (ρ = 0.433, P < .001), renal metastasis (ρ = 0.321, P < .001), staging (ρ = 0.640, P < .001), and survival time (ρ = −0.744, P < .001). However, there was no significant correlation between other relevant parameters and COL5A2 after surgery. (Table 4)
Table 4.
The relationship between characteristics of patients and COL5A2.
| COL5A2 | ||
| Characteristics | ρ | P (spearman) |
| Sex | −0.049 | .552 |
| Age | −0.155 | .060 |
| Tumor size | 0.104 | .209 |
| Pathologic grade∗ | 0.433 | <.001∗ |
| Renal metastasis∗ | 0.321 | <.001∗ |
| Staging∗ | 0.640 | <.001∗ |
| Survival time∗ | −0.744 | <.001∗ |
3.4. Univariate cox regression for the proportional hazards analysis of correlative factors
Table 5 presented the univariate HRs and 95% confidence intervals (95% CI) for patients who underwent GC with renal metastasis. The HR for OS was 2.022 (95% CI, 1.114–3.672, P < .001) in the factor of pathologic grade with type II compared with type I, and type III had higher HR of 5.489 (95% CI, 3.100–9.718, P < .001) than type I. For OS, patients with renal metastasis had higher HR of 1.893 (95% CI, 1.272–2.818, P = .002) than patients without. In the characteristic of staging, stage III had the highest HR on OS of 25.800 (95% CI, 11.637–57.202, P < .001) than stage I, stage II and stage IV. Subjects who had high COL5A2, had obviously lower OS than subjects who had low and moderate COL5A2 level, and the HR is 18.834 (95% CI, 8.696–40.794, P < .001). However, sex (HR = 0.904, 95% CI: 0.610–1.340, P = .615), age (HR = 0.746, 95% CI: 0.513–1.085, P = .126) and tumor size (HR = 1.044, 95% CI: 0.715–1.523, P = .824) had no disadvantageous for OS significantly.
Table 5.
Characteristics and their effect on OS based on univariate cox proportional regression analysis.
| OS | ||||
| Characteristics | HR | 95% CI | P | |
| Sex | ||||
| Male | 61 | 1 | .615 | |
| Female | 87 | 0.904 | 0.610–1.3403 | |
| Age | ||||
| <65 yr | 72 | 1 | .126 | |
| ≥65 yr | 76 | 0.746 | 0.513–1.085 | |
| Tumor size | ||||
| <5 cm | 63 | 1 | .824 | |
| ≥5 cm | 85 | 1.044 | 0.715–1.523 | |
| Pathologic grade∗ | ||||
| I | 36 | 1 | <.001∗ | |
| II | 49 | 2.022 | 1.114–3.672 | |
| III | 63 | 5.489 | 3.100–9.718 | |
| Renal metastasis∗ | ||||
| No | 87 | 1 | .002∗ | |
| Yes | 61 | 1.893 | 1.272–2.818 | |
| Staging∗ | ||||
| I | 28 | 1 | <.001∗ | |
| II | 39 | 2.652 | 1.357–5.183 | |
| III | 33 | 25.800 | 11.637–57.202 | |
| IV | 48 | 19.557 | 8.889–43.033 | |
| COL5A2∗ | ||||
| Low (+) | 35 | 1 | <.001∗ | |
| Moderate (++) | 43 | 6.047 | 2.729–13.399 | |
| High (+++) | 70 | 18.834 | 8.696–40.794 | |
3.5. Analysis of OS based on multivariate cox regression for the proportional hazards of related characteristics
In order to effectively control the influence of confounding factors, all factors were incorporated into the multivariate cox regression model simultaneously. Table 6 showed the result of multivariate cox proportional regression analysis, pathologic grade (HR = 1.415, 95% CI: 1.062–1.886, P = .018), renal metastasis (HR = 0.467, 95% CI: 0.266–0.819, P = .008), staging (HR = 2.406, 95% CI: 1.723–3.359, P < .001) and COL5A2 (HR = 2.709, 95% CI: 1.904–3.854, P < .001) were significantly associated with OS, whereas the sex (HR = 0.869, 95% CI: 0.597–1.306, P = .500), age (HR = 0.788, 95% CI: 0.528–1.176, P = .244) and tumor size (HR = 0.863, 95% CI: 0.580–1.282, P = .464) have no significant correlation with OS (Table 6; Fig. 3)
Table 6.
Characteristics and their effect on OS based on multivariate cox regression analysis.
| OS | |||
| Characteristics | HR | 95% CI | P |
| Sex | 0.869 | 0.597–1.306 | .500 |
| Age | 0.788 | 0.528–1.176 | .244 |
| Tumor size | 0.863 | 0.580–1.282 | .464 |
| Pathologic grade∗ | 1.415 | 1.062–1.886 | .018∗ |
| Renal metastasis∗ | 0.467 | 0.266–0.819 | .008∗ |
| Staging∗ | 2.406 | 1.723–3.359 | <.001∗ |
| COL5A2∗ | 2.709 | 1.904–3.854 | <.001∗ |
Figure 3.
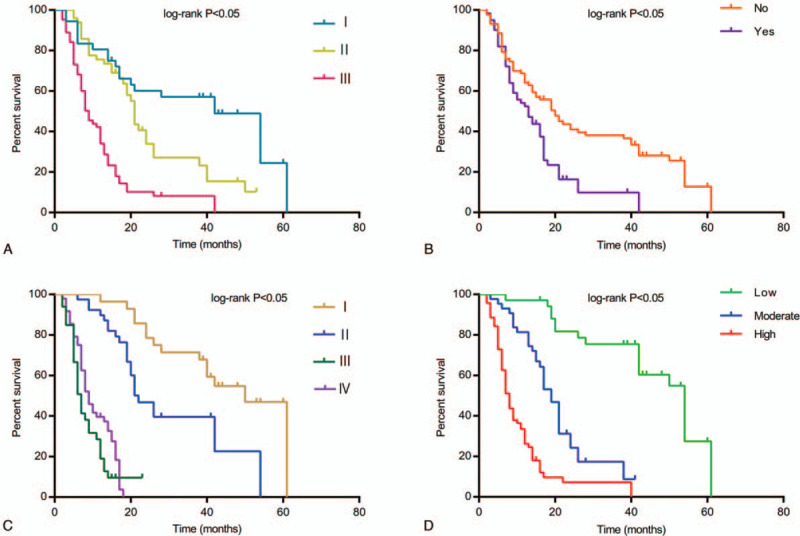
A comparison of relative characteristics and their effect on overall survival (OS). (A) Correlation of OS with pathologic grade. (B) Correlation of OS with renal metastasis. (C) Correlation of OS with staging. (D) Correlation of OS with COL5A2.
3.6. The ROC curve analysis
Finally, we constructed ROC curves to determine the effect of COL5A2, COL1A1, COL1A2, and COL3A1 on diagnosing OS of the GC patients. And the AUC was used as the degree of confidence in judging each factor: COL5A2 (AUC = 0.878, P < .001), COL1A1 (AUC = 0.636, P = .006), COL1A2 (AUC = 0.545, P = .368), and COL3A1 (AUC = 0.617, P = .019). Through the ROC result, COL5A2 had more advantage as a biomarker for GC than other collagens (Fig. 4).
Figure 4.
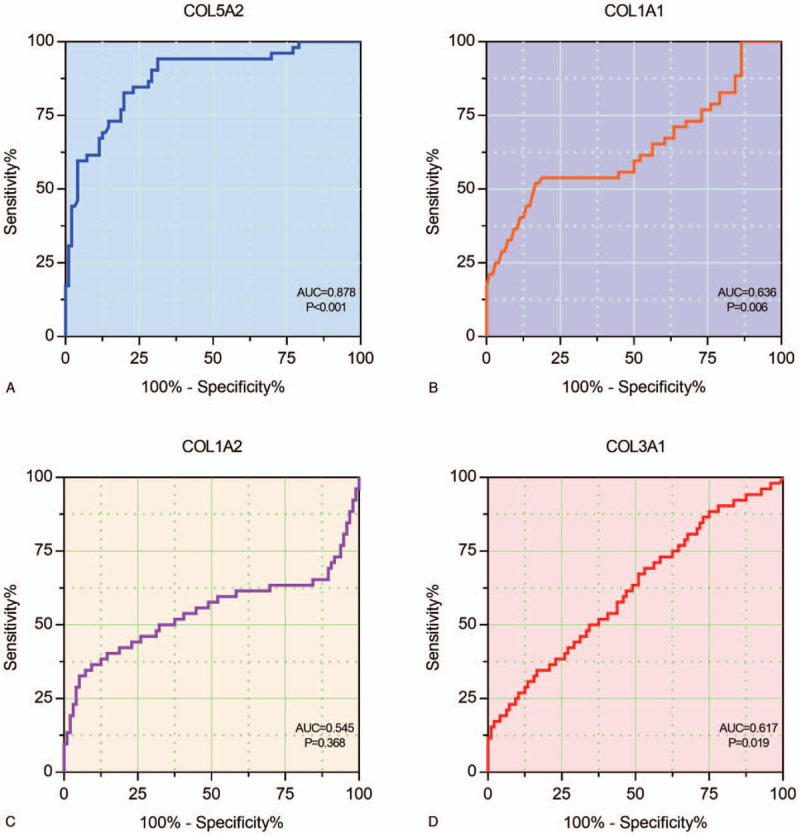
ROC curves to determine the effect of collagens on diagnosing OS of the GC patients. (A) COL5A2, (B) COL1A1, (C) COL1A2, and (D) COL3A1.
4. Discussion
COL5A2 is strongly correlated with OS. The higher COL5A2 patients have, the significantly greater risk there has. Therefore, the researchers could make use of the expression level of COL5A2 to identify the prognosis in patients with renal metastasis from GC.
The growth and metastasis of GC is a complex multi-step process. Tumor first breaks through the barrier of extracellular matrix, enters the lymphatic system or capillaries, and forms a new lesion at a distance during invasion and metastasis. Extracellular matrix, as an important factor affecting the growth of tumor infiltration, is composed of laminin, collagen, elastin, etc.[14,15] It is not only the environment in which tumor cells grow, but also plays a role in regulating the genes of tumor cells and thus affecting tumor metabolism.[16–18]
COL5A2, COL1A1, COL1A2 and COL3A1 all belong to the collagen family, which is the main component of the extracellular matrix.[19] Therefore, the up-regulation of collagen expression is crucial to promote tumor growth. It has been reported that the expression of COL1A1 and COL1A2 is significantly increased in colon cancer epithelial cells,[20] suggesting these 2 kinds of collagen play an important role in the 2 key steps of angiogenesis and connective tissue formation during the progression of colon cancer. In addition, the expression of COL5A2 was also associated with the occurrence and development of colon cancer.[21] Fischer et al confirmed their expression in colon cancer samples, but not in normal colon epithelial cells. However, the regulation of these genes in GC remains to be studied.[7] Recently, studies have confirmed the correlation between collagen family gene and GC. For example, Rong et al have showed high expression of COL1A2 in GC tissues, which was correlated to the histological type and the lymph node status significantly.[22] Ao et al demonstrated that COL1A2 gene silencing inhibits GC cell proliferation, migration, and invasion[23] Li et al found a diagnostic use of COL1A1 to screen for early GC.[24] They also considered COL1A1 and COL1A2 as predictors of poor clinical outcomes in GC patients. Zhuo et al hypothesized higher expression of COL1A2 in tumor tissues and better prognosis in patients with lower COL1A2 expression.[25] Liu et al considered COL1A1, COL1A2 and COL3A1 provided some directive significance for further investigating the diagnostic and prognostic biomarkers to facilitate the molecular targeting therapy of GC.[26] Studying these hub genes can also increase the understanding of other metastases from GC. Sun et al reported that THBS2 expression was significantly lower in GC tissues compared to normal tissues, and that patients with higher levels of THBS2 had better prognosis.[27] Cao et al found a total of 6 hub genes including COL1A2, COL1A1, COL5A2, THBS2 and ITGA5 in particular genes of GC. Except COL5A2, others were significantly correlated with worse OS for GC patients.[13]
Our study confirmed COL5A2 has a strong correlation with the prognosis of renal metastasis of GC. Furthermore, we verified that the high expression of COL5A2 genes in metastatic renal tissues is closely related to the disease by RT-qPCR, thus increasing the reliability of our results.
However, there are some weaknesses in the research. First of all, the cross-sectional design of this study makes it challenging to establish any causal relationship based on the collected data. Prospective and/or interventional studies are necessary to identify risk factors for GC with renal metastasis. Second, the data collection method may have introduced a risk of bias. Therefore, further studies are needed to clarify the mechanism of COL5A2 on GC with renal metastasis.
5. Conclusions
In summary, the research demonstrated that COL5A2 has a strong correlation and precise predictability for patients with renal metastasis from GC. COL5A2 gene expression level might be a risk factor for renal metastasis of GC, which can better guide clinicians to evaluate the prognosis of the disease, and which could be beneficial to the decision making on early prevention and timely therapy.
Author contributions
Conceptualization, Methodology: Guang-Liang Zhao;
Data curation, Formal analysis, Investigation: Guang-Liang Zhao;
Project administration, Resources, Software: Yun-Long Ding;
Validation, Visualization: Shu-fang sun;
Writing-original draft, Writing-review & editing: Yun-Long Ding.
All authors read and approved the final manuscript.
Investigation: Shu-fang sun.
Methodology: Yun-Long Ding, Shu-fang sun, Guang-Liang Zhao.
Project administration: Yun-Long Ding, Guang-Liang Zhao.
Resources: Yun-Long Ding, Shu-fang sun, Guang-Liang Zhao.
Footnotes
Abbreviations: AUC = area under the curve, CI = confidence intervals, COL5A2 = collagen type V alpha2 chain, GC = gastric cancer, HR = hazard ratio, OS = overall survival, ROC = receiver operating characteristic.
How to cite this article: Ding YL, Sun SF, Zhao GL. COL5A2 as a potential clinical biomarker for gastric cancer and renal metastasis. Medicine. 2021;100:7(e24561).
This research did not receive any specific grant from funding agencies in the public, commercial, or not-for-profit sectors.
The authors declare no conflicts of interest. The study funders played no role in the design of the study; in the collection, analysis, or interpretation of the data; in the writing of the manuscript; or in the decision to publish the results.
All data generated or analyzed during this study are included in this published article [and its supplementary information files].
Pearson's chi-squared test was used.
P < .05.
Spearman-rho test was used.
P < .05.
95% CI = 95% confidence interval, HR = hazard ratio, OS = overall survival.
P < .05.
95% CI = 95% confidence interval, HR = hazard ratio, OS = overall survival.
P < .05.
References
- [1].Strong VE. Progress in gastric cancer. Updates Surg 2018;70:157–9. [DOI] [PubMed] [Google Scholar]
- [2].den Hoed CM, Kuipers EJ. Gastric cancer: how can we reduce the incidence of this disease. Curr Gastroenterol Rep 2016;18:34. [DOI] [PMC free article] [PubMed] [Google Scholar]
- [3].Youn GJ, Chung WC. Micrometastasis in gastric cancer. Korean J Gastroenterol 2017;69:270–7. [DOI] [PubMed] [Google Scholar]
- [4].Biagioni A, Skalamera I, Peri S, et al. Update on gastric cancer treatments and gene therapies. Cancer Metastasis Rev 2019;38:537–48. [DOI] [PubMed] [Google Scholar]
- [5].Necula L, Matei L, Dragu D, et al. Recent advances in gastric cancer early diagnosis. World J Gastroenterol 2019;25:2029–44. [DOI] [PMC free article] [PubMed] [Google Scholar]
- [6].Miwa T, Kanda M, Tanaka H, et al. FBXO50 enhances the malignant behavior of gastric cancer cells. Ann Surg Oncol 2017;24:3771–9. [DOI] [PubMed] [Google Scholar]
- [7].Fischer H, Stenling R, Rubio C, et al. Colorectal carcinogenesis is associated with stromal expression of COL11A1 and COL5A2. Carcinogenesis 2001;22:875–8. [DOI] [PubMed] [Google Scholar]
- [8].Srour MK, Gao B, Dadmanesh F, et al. Gene expression comparison between primary triple-negative breast cancer and paired axillary and sentinel lymph node metastasis. Breast J 2020;26:904–10. [DOI] [PMC free article] [PubMed] [Google Scholar]
- [9].Chen H, Liu W, Zhong L, et al. NKX2-2 suppresses osteosarcoma metastasis and proliferation by downregulating multiple target genes. J Cancer 2018;9:3067–77. [DOI] [PMC free article] [PubMed] [Google Scholar]
- [10].Zeng XT, Liu XP, Liu TZ, et al. The clinical significance of COL5A2 in patients with bladder cancer: a retrospective analysis of bladder cancer gene expression data. Medicine (Baltimore) 2018;97:e0091. [DOI] [PMC free article] [PubMed] [Google Scholar]
- [11].Park AC, Phan N, Massoudi D, et al. Deficits in Col5a2 expression result in novel skin and adipose abnormalities and predisposition to aortic aneurysms and dissections. Am J Pathol 2017;187:2300–11. [DOI] [PMC free article] [PubMed] [Google Scholar]
- [12].Park AC, Phillips CL, Pfeiffer FM, et al. Homozygosity and heterozygosity for null Col5a2 alleles produce embryonic lethality and a novel classic Ehlers-Danlos syndrome-related phenotype. Am J Pathol 2015;185:2000–11. [DOI] [PMC free article] [PubMed] [Google Scholar]
- [13].Cao L, Chen Y, Zhang M, et al. Identification of hub genes and potential molecular mechanisms in gastric cancer by integrated bioinformatics analysis. PeerJ 2018;6:e5180. [DOI] [PMC free article] [PubMed] [Google Scholar]
- [14].Walker C, Mojares E, Del RHA. Role of extracellular matrix in development and cancer progression. Int J Mol Sci 2018;19:3028. [DOI] [PMC free article] [PubMed] [Google Scholar]
- [15].Erdogan B, Webb DJ. Cancer-associated fibroblasts modulate growth factor signaling and extracellular matrix remodeling to regulate tumor metastasis. Biochem Soc Trans 2017;45:229–36. [DOI] [PMC free article] [PubMed] [Google Scholar]
- [16].Stewart DA, Cooper CR, Sikes RA. Changes in extracellular matrix (ECM) and ECM-associated proteins in the metastatic progression of prostate cancer. Reprod Biol Endocrinol 2004;2:2. [DOI] [PMC free article] [PubMed] [Google Scholar]
- [17].Eble JA, Niland S. The extracellular matrix in tumor progression and metastasis. Clin Exp Metastasis 2019;36:171–98. [DOI] [PubMed] [Google Scholar]
- [18].Kai F, Drain AP, Weaver VM. The extracellular matrix modulates the metastatic journey. Dev Cell 2019;49:332–46. [DOI] [PMC free article] [PubMed] [Google Scholar]
- [19].Haq F, Ahmed N, Qasim M. Comparative genomic analysis of collagen gene diversity. 3 Biotech 2019;9:83. [DOI] [PMC free article] [PubMed] [Google Scholar]
- [20].St CB, Rago C, Velculescu V, et al. Genes expressed in human tumor endothelium. Science 2000;289:1197–202. [DOI] [PubMed] [Google Scholar]
- [21].Uddin MN, Li M, Wang X. Identification of transcriptional markers and microRNA-mRNA regulatory networks in colon cancer by integrative analysis of mRNA and microRNA expression profiles in colon tumor stroma. Cells 2019;8:1054. [DOI] [PMC free article] [PubMed] [Google Scholar]
- [22].Rong L, Huang W, Tian S, et al. COL1A2 is a novel biomarker to improve clinical prediction in human gastric cancer: integrating bioinformatics and meta-analysis. Pathol Oncol Res 2018;24:129–34. [DOI] [PubMed] [Google Scholar]
- [23].Ao R, Guan L, Wang Y, et al. Silencing of COL1A2, COL6A3, and THBS2 inhibits gastric cancer cell proliferation, migration, and invasion while promoting apoptosis through the PI3k-Akt signaling pathway. J Cell Biochem 2018;119:4420–34. [DOI] [PubMed] [Google Scholar]
- [24].Li J, Ding Y, Li A. Identification of COL1A1 and COL1A2 as candidate prognostic factors in gastric cancer. World J Surg Oncol 2016;14:297. [DOI] [PMC free article] [PubMed] [Google Scholar]
- [25].Zhuo C, Li X, Zhuang H, et al. Elevated THBS2, COL1A2, and SPP1 expression levels as predictors of gastric cancer prognosis. Cell Physiol Biochem 2016;40:1316–24. [DOI] [PubMed] [Google Scholar]
- [26].Liu X, Wu J, Zhang D, et al. Identification of potential key genes associated with the pathogenesis and prognosis of gastric cancer based on integrated bioinformatics analysis. Front Genet 2018;9:265. [DOI] [PMC free article] [PubMed] [Google Scholar]
- [27].Sun R, Wu J, Chen Y, et al. Down regulation of Thrombospondin2 predicts poor prognosis in patients with gastric cancer. Mol Cancer 2014;13:225. [DOI] [PMC free article] [PubMed] [Google Scholar]