



Abstract
BACKGROUND:
The Prostate Cancer Prevention Trial Risk Calculator 2.0 (PCPTRC) is a widely used risk-based calculator used to assess a man’s risk of prostate cancer (PCa) before biopsy. This risk calculator was created from data of a patient cohort undergoing a 6-core sextant biopsy, and subsequently validated in men undergoing 12-core systematic biopsy (SBx). The accuracy of the PCPTRC has not been studied in patients undergoing magnetic resonance imaging/ultrasound (MRI/US) fusion-guided biopsy (FBx). We sought to assess the performance of the PCPTRC for straitifying PCa risk in a FBx cohort.
METHODS:
A review of a prospective cohort undergoing MRI and FBx/SBx was conducted. Data from consecutive FBx/SBx were collected between August 2007 and February 2014, and PCPTRC scores using the PCPTRC2.0R-code were calculated. The risk of positive biopsy and high-grade cancer (Gleason ≥ 7) on biopsy was calculated and compared with overall and high-grade cancer detection rates (CDRs). Receiver operating characteristic curves were generated and the areas under the curves (AUCs) were compared using DeLong’s test.
RESULTS:
Of 595 men included in the study, PCa was detected in 39% (232) by SBx compared with 48% (287) on combined FBx/SBx biopsy. The PCPTRC AUCs for the CDR were similar (P = 0.70) for SBx (0.69) and combined biopsy (0.70). For high-grade disease, AUCs for SBx (0.71) and combined biopsy (0.70) were slightly higher, but were not statistically different (P = 0.55).
CONCLUSIONS:
In an MRI-screened population of men undergoing FBx, PCPTRC continues to represent a practical method of accurately stratifying PCa risk.
INTRODUCTION
The emergence of prostate multiparametric magnetic resonance imaging (mpMRI), and its integration in MRI/ultrasound (US) fusion-guided biopsy (FBx) has allowed for the advancement of prostate cancer (PCa) diagnosis, offering improved pathologic risk stratification.1,2 Yet the decision to obtain a prostate biopsy is often contingent on inefficient screening measures that involve serum PSA and digital rectal exam (DRE), followed by systematic but non-targeted biopsy. As a screening tool, PSA and DRE have limited sensitivity and specificity, leading to unnecessary biopsies3,4 and over detection of clinically indolent cancers.5
The need for more accurate PCa risk assessment has led to the development of several risk calculators. The Prostate Cancer Prevention Trial Risk Calculator 2.0 (PCPTRC), one such commonly used risk calculator, was constructed from data of the 6664 patients in the placebo arm of the phase III Prostate Cancer Prevention Trial;6 the variables include age, race, PSA, DRE and previous biopsy history.7,8 The first version of the PCPTRC had been externally validated, but demonstrated variable performance depending on the composition of the patient cohorts.9–11 Further development improved the accuracy of the risk tool, which was subsequently validated in the screened patient populations undergoing a 12-core systematic biopsy (SBx).12,13
Still, even with better tools to predict PCa risk, the focus of detecting clinically significant cancer has become central to avoiding the diagnosis/treatment of patients with low-grade, potentially indolent cancers that would not benefit from intervention.14 Risk calculators, such as the PCPTRC, have been investigated as a tool for assessing probability of high-grade PCa, as defined by a Gleason score ≥ 7.8,15,16 However, there is uncertainty about whether PCPTRC is applicable to patients undergoing mpMRI and targeted biopsy. The PCPTRC has yet to be validated in a large, diverse mpMRI-screened population who undergo FBx. The objective of our study was, therefore, to validate the PCPTRC for overall PCa risk and risk of high-grade disease in an MRI-screened population and compare it with the results of 12-core systematic biopsies obtained in the same population.
MATERIALS AND METHODS
Patient population
A review was performed of patients enrolled in a prospective institutional review board approved clinical trial, titled Use of Tracking Devices to Locate Abnormalities During Invasive Procedures, at the National Institutes of Health evaluating electromagnetic tracking as a tool to identify disease for procedure navigation from August 2007 to February 2014 (ClinicalTrials.gov identifier: NCT00102544). This patient population has been published on previously, but the current study represents a unique subset and analysis.17 Following informed consent, patients with suspicion for PCa due to elevated PSA or abnormal DRE were enrolled from August 2007 to February 2014 and underwent mpMRI with subsequent FBx, when imaging identified suspicious lesions. Patient-level clinical variables were used to generate PCPTRC scores from the publicly available PCPTRC2.0 R-code. The risk of observing a positive biopsy, low-grade cancer risk and high-grade cancer risk were calculated for each patient. ‘Low-grade’ cancer was defined as Gleason score of 6 on biopsy, whereas ‘high-grade’ cancer was defined as Gleason ≥ 3+4.
mpMRI acquisition and interpretation
MRI included the following pulse sequences: tri-plane T2-weighted imaging, diffusion-weighted imaging with apparent diffusion coefficient maps and dynamic contrast-enhanced imaging. All scans were performed on 3 T MRI (Achieva, Philips, Cleveland, OH, USA) used in combination with both an endorectal coil (BPX-30, Medrad, Pittsburgh, PA, USA) and a cardiac coil (16-channel; SENSE, Philips). The images were read by two experienced radiologists (BT, PC with 9 and 12 years of experience, respectively) and lesions were assigned suspicion scores using a previously National Institutes of Health-validated scoring system.18 Although PIRADSv2 is the current method by which prostatic MRI lesions are evaluated, this method for image interpretation was not applied to this patient population as the prospective data procurement for this study were initiated in 2007; institution of PIRADSv2 began in January 2015 and is currently being validated.19,20
MRI/US FBx
FBx was performed using the UroNav platform (Philips-Invivo, Gainesville, FL, USA). Each lesion was sampled in both the axial and sagittal plane by one physician. A 12-core SBx was obtained by another physician, blind to the targets, following the FBx. Each patient received a combined biopsy, consisting of a FBx and a SBx. A single genitourinary pathologist (MJM) evaluated all biopsy cores.
Statistical analysis
Statistical analysis was performed with JMP v.11.0 (SAS Institute, Cary, NC, USA) and Microsoft Excel (version 2010; Seattle, WA, USA). Age, PSA and prostate volume were defined as continuous variables, whereas DRE results and family history were designated as categorical variables. Measures of central tendencies and dispersion were calculated for each covariate and subsequent univariate analysis for association with high-grade disease was performed. Variables that produced a significant association were subjected to multivariate comparison. Fisher’s exact test was used to compare proportions of categorical variables. A calibration curve was plotted by comparing the observed cancer incidence to the mean PCPTRC estimations. Area under the curve (AUC) were calculated from the receiver operator characteristic curves for overall cancer detection and high-grade cancer detection of PCPTRC in combined biopsy and SBx, and compared using DeLong’s test. The AUC was generated by calculating the sensitivity and specificity of the PCPTRC. These statistical analyses were performed using MedCalc for Windows, version 12.5 (MedCalc Software, Ostend, Belgium).
RESULTS
Patient demographics
A total of 1003 men underwent mpMRI and FBx during the study period, and of these, 595 patients had no prior diagnosis of PCa before the study enrollment. Patient demographics are presented in Table 1. In patients with low-grade PCa or no PCa, the median age (interquartile range) was 61 (56–66) years old, and the median PSA was 6.8 (4.4–10.8) ng ml−1. Men with high-grade PCa (Gleason ≥ 7) were relatively older, with a median age of 65.0 (60.0–70.0) years old, and had a higher PSA level, found to be 10.2 (6.7–17.6) ng ml−1 (P < 0.0001 and P < 0.0001, respectively). On multivariate analysis, additional variables associated with high-grade disease included African–American race (odds ratio (OR) 2.09, 95% confidence interval (CI) (1.15–3.83), P = 0.02), positive family history (OR 1.74, 95%CI (1.07–2.84), P = 0.03) and number of MRI lesions (OR 1.22, 95%CI (1.03–1.46), P = 0.03).
Table 1.
Patient demographics
| Covariate |
No of patients (%) or median (IQR) |
Univariate |
Multivariate |
||||
|---|---|---|---|---|---|---|---|
| Gleason >/= to 7, n = 201 | No PCa and Gleason < 7, n = 394 | P-value | OR (CI) | P-value | |||
| Age (years) | 65 | (60–70) | 61 | (56–66) | < 0.0001 | 1.13 (1.09–1.17) | < 0.0001 |
| African American | 41 | 20.4% | 54 | 13.7% | 0.04 | 2.09 (1.15–3.83) | 0.02 |
| Family history of PCa | 71 | 35.3% | 102 | 25.9% | 0.02 | 1.74 (1.07–2.84) | 0.03 |
| History of prior biopsy | 115 | 57.2% | 302 | 76.7% | < 0.0001 | 0.38 (0.23–0.62) | 0.0001 |
| Abnormal DRE | 35 | 17.4% | 29 | 7.4% | 0.0004 | 1.34 (0.64–2.81) | 0.44 |
| PSA (ng ml−1) | 10.2 | (6.7–17.6) | 6.8 | (4.4–10.8) | < 0.0001 | 1.08 (1.05–1.11) | < 0.0001 |
| MRI prostate volume (cm−3) | 42 | (34.5–57.0) | 58 | (42.0–83.0] | < 0.0001 | 0.96 (0.95–0.97) | < 0.0001 |
| PSAD (ng ml−1 cm−3) | 0.250 | (0.150–0.418) | 0.113 | (0.073–0.163) | < 0.0001 | — | — |
| # MRI lesions | 3 | (2–4) | 2 | (1–3) | < 0.0001 | 1.22 (1.03–1.46) | 0.03 |
| MRI suspicion score | < 0.0001 | Overall | < 0.0001 | ||||
| Low | 5 | 2.5% | 64 | 16.2% | H to L: 14.3 (4.7–51.2) | < 0.0001 | |
| Moderate | 122 | 60.7% | 310 | 78.7% | H to M: 3.6 (1.9–7.1) | < 0.0001 | |
| High | 74 | 36.8% | 20 | 5.1% | M to L: 4.0 (1.5–12.6) | 0.004 | |
| Average PCPT risk (s.d.), (CI) | |||||||
| Any grade | 39.7 (0.9) | (37.9–41.5) | 26.8 (0.6) | (25.5–28.0) | < 0.0001 | ||
| High grade | 22.1 (0.9) | (20.3–23.8) | 11.7 (0.6) | (10.4–12.9) | < 0.0001 | ||
Abbreviations: CI, confidence interval; DRE, digital rectal exam; IQR, interquartile range; MRI, magnetic resonance imaging; OR, odds ratio; PCa, prostate cancer; PCPT, Prostate Cancer Prevention Trial; PSAD, PSA density. Patients were grouped into two categories. The first group consisted of patients with high-grade cancer as defined by Gleason ⩾ 7. The second group contained patients with low-grade disease, as defined by Gleason < 7 cancer, as well as patients with a negative biopsy. Univariate and multivariate analysis was performed to indicate the covariates associated with high-grade disease. P-values in bold indicate statistical significance.
MRI suspicion scores
In the entire cohort, 69/595 (11.60%) had only low suspicion lesion (s) identified on mpMRI, 432/595 (72.60%) patients had a moderately suspicious lesion on mpMRI and 94 (15.80%) patients had a highly suspicious lesion found on mpMRI (Table 2). Of the patients with high-grade PCa detected on biopsy, 5/201 (2.5%) had a low suspicious MRI, 122/201 (60.7%) had a moderately suspicious MRI and 74/201 (36.8%) had a highly suspicious MRI.
Table 2.
Comparison of cancer detection rate and calculated PCPT risk by magnetic resonance imaging suspicion score
| MRI suspicion score | Total no. | Fusion CDR | 12-Core CDR | Overall CDR | Overall Gleason ⩾ 7 CDR | Mean PCPTRC risk of any PCa (%) | Mean PCPTRC high-grade risk (%) | ||||
|---|---|---|---|---|---|---|---|---|---|---|---|
| Low | 69 | 9 | 13.0% | 16 | 23.2% | 18 | 26.1% | 5 | 7.2% | 26.40% | 11.70% |
| Moderate | 432 | 158 | 36.6% | 153 | 35.4% | 190 | 44.0% | 122 | 28.2% | 29.40% | 13.60% |
| High | 94 | 76 | 80.9% | 63 | 67.0% | 79 | 84.0% | 74 | 78.7% | 42.30% | 25.20% |
| Total | 595 | 243 | 40.8% | 232 | 39.0% | 287 | 48.2% | 201 | 33.8% | 31.10% | 15.20% |
Abbreviations: CDR, cancer detection rate; MRI, magnetic resonance imaging; PCa, prostate cancer; PCPTRC, Prostate Cancer Prevention Trial Risk Calculator 2.0.
Cancer detection
Cancer detection rate (CDR) for combined biopsy and systematic biopsy stratified by MRI suspicion score is reported in Table 2. The overall CDR of the combined biopsy was 287/595 (48.2%). High-grade CDR was 201/595 (33.8%), whereas low-grade cancer was found in 86/595 (14.5%) men. For SBx alone, the overall CDR was 232/595 (39.0%) and high-grade CDR was 139/595 (23.4%). MRI suspicion score demonstrated a linear association with overall CDR, PCPTRC score for any grade cancer, high-grade CDR and PCPTRC score for high-grade cancer.
One-hundred eighty-four patients from this cohort had no prior history of prostate biopsies. The incidence of PCa in this cohort was 125/184 (67.9%) with combined biopsy. This group also demonstrated a high-grade cancer rate of 89/184 (48.4%). With SBx, however, this cohort had a CDR of 115/184 (62.5%) and a high-grade CDR of 77/184 (41.8%).
Pathologic concordance between FBx and SBx was observed in 438/595 (74%) patients (Table 3). The biopsy modalities were comparable to overall CDR, as FBx identified 243 cancers, whereas SBx identified 232 cancers. However, FBx identified 21% more high-grade cancers than systematic biopsy (181 vs 139, P = 0.007) and 36% fewer low-grade cancers (62 vs 93, P = 0.01).
Table 3.
Comparison of biopsy results from standard 12-core biopsy and targeted MRI/US fusion-guided biopsy
| Standard biopsy Gleason |
||||||
|---|---|---|---|---|---|---|
| 0 | 6 | 7 | 8+ | Total | ||
| Targeted biopsy Gleason | 0 | 308 | 31 | 12 | 1 | 352 |
| 6 | 20 | 35 | 7 | 0 | 62 | |
| 7 | 21 | 23 | 34 | 4 | 82 | |
| 8+ | 14 | 4 | 20 | 61 | 99 | |
| Total | 363 | 93 | 73 | 66 | 595 | |
Abbreviations: MRI/US, magnetic resonance imaging/ultrasound; Standard biopsy, standard 12-core biopsy; targeted biopsy, targeted MRI/US fusion-guided biopsy. Cells with orange highlighting indicates patients in which targeted MRI/US fusion-guided biopsy upgraded the prostate cancer Gleason score when compared with the standard 12-core biopsy. The dark orange highlighting indicates an upgrade to high-grade disease, as defined by Gleason ⩾ 7. Cells with blue highlighting indicates patients, in which the standard 12-core biopsy upgraded the prostate cancer Gleason score when compared with the targeted MRI/US fusion-guided biopsy. Dark blue highlighting shows an upgrade to high-grade disease.
PCPTRC-estimated risk
Each patient’s individual probability of being diagnosed with any PCa and high-grade PCa was calculated with the PCPTRC, and composite mean risks were generated for the entire patient population. The PCPTRC estimated an overall mean CDR of 31.1% (s.d. 14.2, 95%CI (29.9–32.3)), lower than the actual observed cancer incidence of 48.2%. When used to assess the likelihood of discerning high-grade cancer, the PCPTRC approximated a mean probability of 15.2% (s.d. 13.5, 95%CI (14.1–16.3)) for the entire cohort. As shown in Table 1, patients were stratified into two categories: high-grade cancer as defined by Gleason ≥ 7 cancer in one category, and no PCa and Gleason < 7 cancer in the other category. Within these two categories, the PCPTRC score for any grade PCa was calculated to be 39.7% (s.d. 0.09, 95%CI (37.9–41.50)) and 26.8% (s.d. 0.06, 95%CI (25.5–28.)]), respectively, and the estimated high-grade cancer risk was calculated to be 22.1% (s.d. 0.9, 95%CI (20.3–23.8)) and 11.7% (s.d. 0.6, 95%CI (10.4–12.9)), respectively. The predicted PCPTRC estimates for patients in each MRI suspicion score category can be viewed in Table 2.
The entire cohort was collated by PCPTRC-estimated risk intervals of 0.05 for any grade cancer and high-grade cancer. The total number of patients, mean cancer risk, 12-core standard biopsy, fusion biopsy and combined biopsy cancer incidence for each PCPTRC risk interval are displayed in Tables 4a and b. The risk calculated overestimated the rate of cancer diagnosis at higher- and lower-risk percentiles as seen in Figure 1. However, for most of the range, the PCPTRC demonstrated reasonable agreement between the estimated and observed PCa risk.
Table 4a.
Comparison of PCPTRC calculated risk with observed prostate cancer rate
| PCPTRC predicted risk of any PCa | Total no. | Mean risk | 12-Core observed risk | Fusion observed risk | Overall observed risk | |||
|---|---|---|---|---|---|---|---|---|
| < 0.20 | 117 | 0.159 | 21 | 17.9% | 21 | 17.9% | 29 | 24.8% |
| 0.20–0.25 | 98 | 0.223 | 31 | 31.6% | 30 | 30.6% | 37 | 37.8% |
| 0.25–0.30 | 124 | 0.273 | 48 | 38.7% | 50 | 40.3% | 60 | 48.4% |
| 0.30–0.35 | 83 | 0.325 | 31 | 37.3% | 35 | 42.2% | 40 | 48.2% |
| 0.35–0.40 | 57 | 0.371 | 26 | 45.6% | 25 | 43.9% | 31 | 54.4% |
| 0.40–0.45 | 33 | 0.424 | 21 | 63.6% | 21 | 63.6% | 24 | 72.7% |
| 0.45–0.50 | 22 | 0.471 | 11 | 50.0% | 15 | 68.2% | 16 | 72.7% |
| 0.50–0.55 | 20 | 0.526 | 14 | 70.0% | 15 | 75.0% | 16 | 80.0% |
| 0.55–0.60 | 12 | 0.577 | 10 | 83.3% | 8 | 66.7% | 10 | 83.3% |
| > 0.60 | 29 | 0.725 | 19 | 65.5% | 24 | 82.8% | 24 | 82.8% |
| Sum | 595 | 232 | 244 | 287 | ||||
Abbreviations: PCa, prostate cancer; PCPTRC, Prostate Cancer Prevention Trial Risk Calculator 2.0.
Table 4b.
Comparison of PCPTRC calculated risk with observed high-grade prostate cancer rate
| PCPTRC predicted risk high-grade PCa | Total no. | Mean HG risk | 12-Core observed HG risk | Fusion observed HG risk | Overall observed HG risk | |||
|---|---|---|---|---|---|---|---|---|
| 0.00–0.05 | 102 | 0.033 | 8 | 7.8% | 9 | 8.8% | 9 | 8.8% |
| 0.05–0.10 | 157 | 0.073 | 19 | 12.1% | 30 | 19.1% | 36 | 22.9% |
| 0.10–0.15 | 129 | 0.125 | 35 | 27.1% | 45 | 34.9% | 50 | 38.8% |
| 0.15–0.20 | 74 | 0.171 | 19 | 25.7% | 21 | 28.4% | 25 | 33.8% |
| 0.20–0.25 | 42 | 0.220 | 14 | 33.3% | 21 | 50.0% | 22 | 52.4% |
| 0.25–0.30 | 24 | 0.272 | 8 | 33.3% | 9 | 37.5% | 11 | 45.8% |
| 0.30–0.35 | 17 | 0.331 | 10 | 58.8% | 10 | 58.8% | 12 | 70.6% |
| 0.35–0.40 | 12 | 0.377 | 8 | 66.7% | 8 | 66.7% | 8 | 66.7% |
| 0.40–0.45 | 11 | 0.423 | 6 | 54.5% | 8 | 72.7% | 8 | 72.7% |
| > 0.45 | 27 | 0.599 | 12 | 44.4% | 20 | 74.1% | 20 | 74.1% |
| Sum | 595 | 139 | 181 | 201 | ||||
Abbreviations: HG, high-grade as defined by Gleason ⩾ 7; PCa, prostate cancer; PCPTRC, Prostate Cancer Prevention Trial Risk Calculator 2.0.
Figure 1.
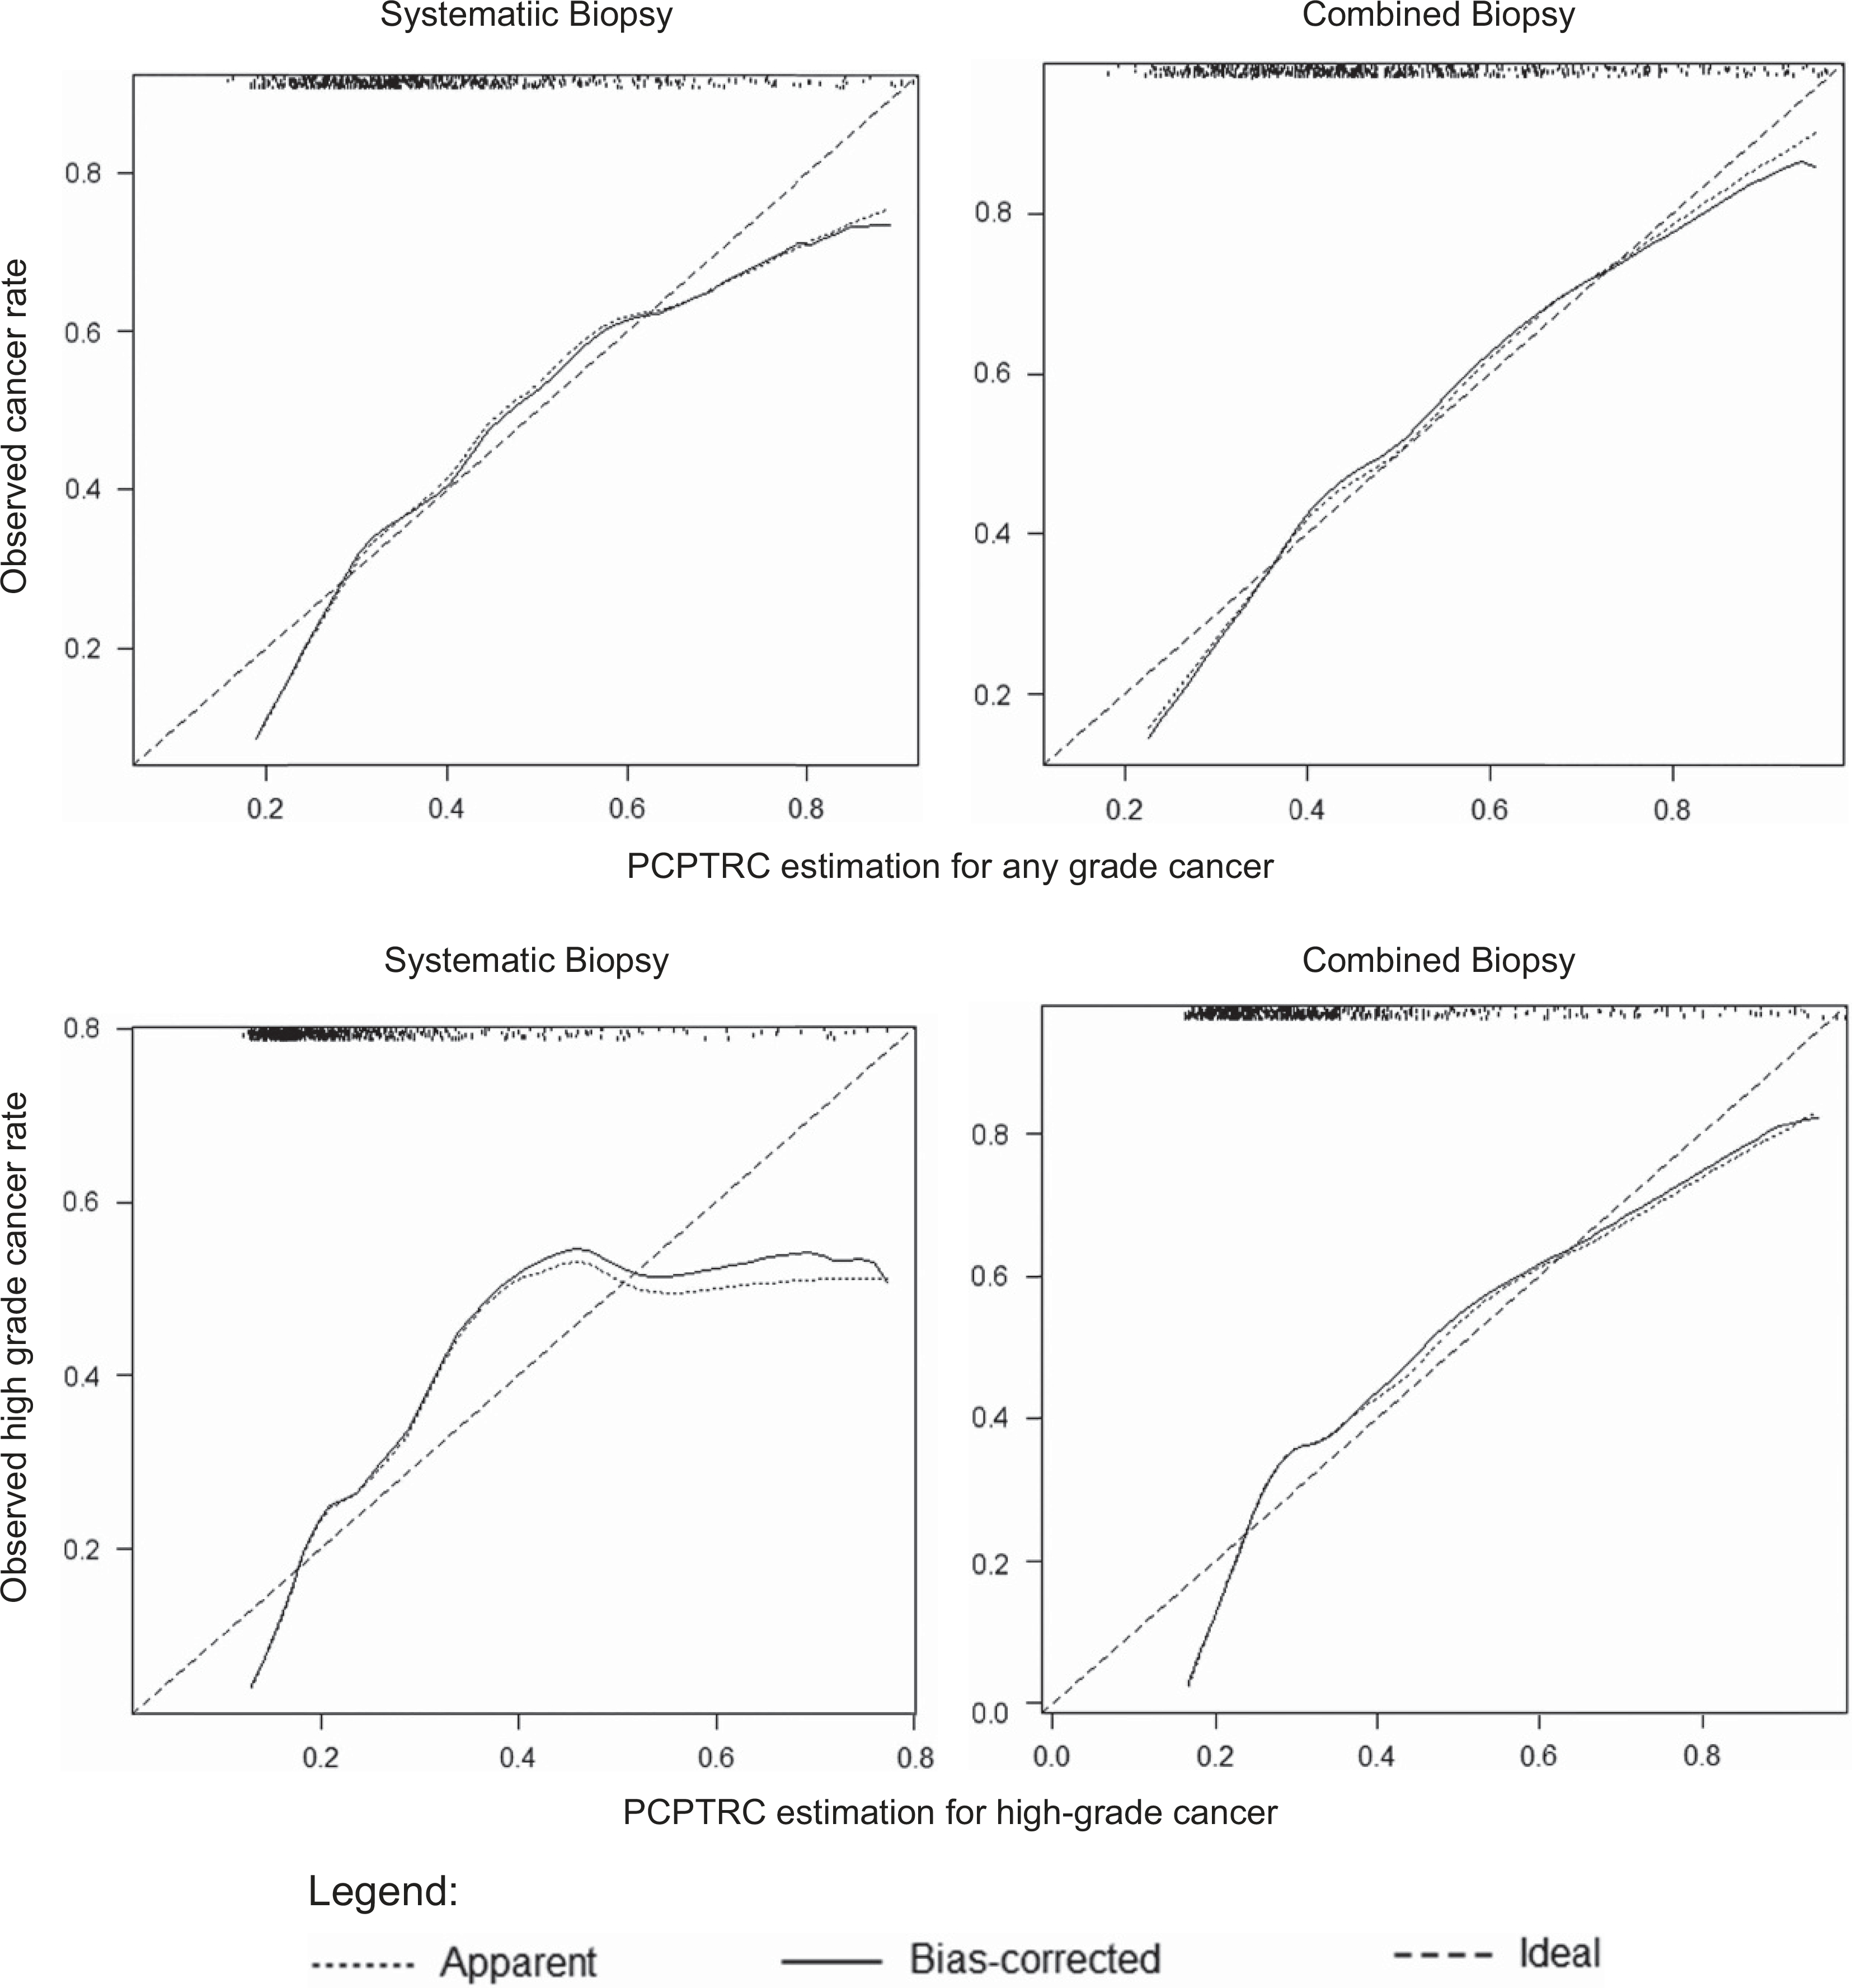
The calibration plots of the PCPTRC demonstrate the congruence between the estimated probabilities and the observed cancer rate. For the detection of any grade cancer, the mean absolute error was 0.026 with systematic biopsy and 0.025 with combined biopsy. For the detection of high-grade cancer with systematic biopsy, the PCPTRC over-predicted the observed high-grade cancer rate in the risk percentiles < 0.2 and > 0.5, with an absolute error of 0.047. In comparison, when detecting high-grade cancer with combined biopsy, the PCPTRC also tended to over-predict the actual rate of high-grade cancer within the risk percentiles < 0.2 and > 0.6. The mean absolute error was 0.48. Combined biopsy, combined targeted MRI/US fusion-guided biopsy with a 12-core systematic biopsy; MRI/US, magnetic resonance imaging/ultrasound; PCPTRC, cancer risk estimated by the Prostate Cancer Prevention Trial Risk Calculator 2.0; standard biopsy, standard 12-core biopsy.
The AUCs of the PCPTRC for predicting PCa were 0.70 in FBx alone and 0.69 in SBx alone, which were not statistically different (P = 0.66). Similarly, the difference between AUCs for the estimation of high-grade cancer by the PCPTRC in FBx alone and SBx alone, 0.73 and 0.71 respectively, was also not significant (P = 0.54).
The AUC of the PCPTRC for predicting PCa was 0.70 in combined biopsies, which was not statistically different from that of SBx (P = 0.70). Furthermore, the AUC of the PCPTRC for predicting high-grade PCa in combined biopsy, 0.73, was also not statistically different from that of SBx (P = 0.55). Graphical representation of the PCPTRC AUCs can be viewed in Figure 2.
Figure 2.
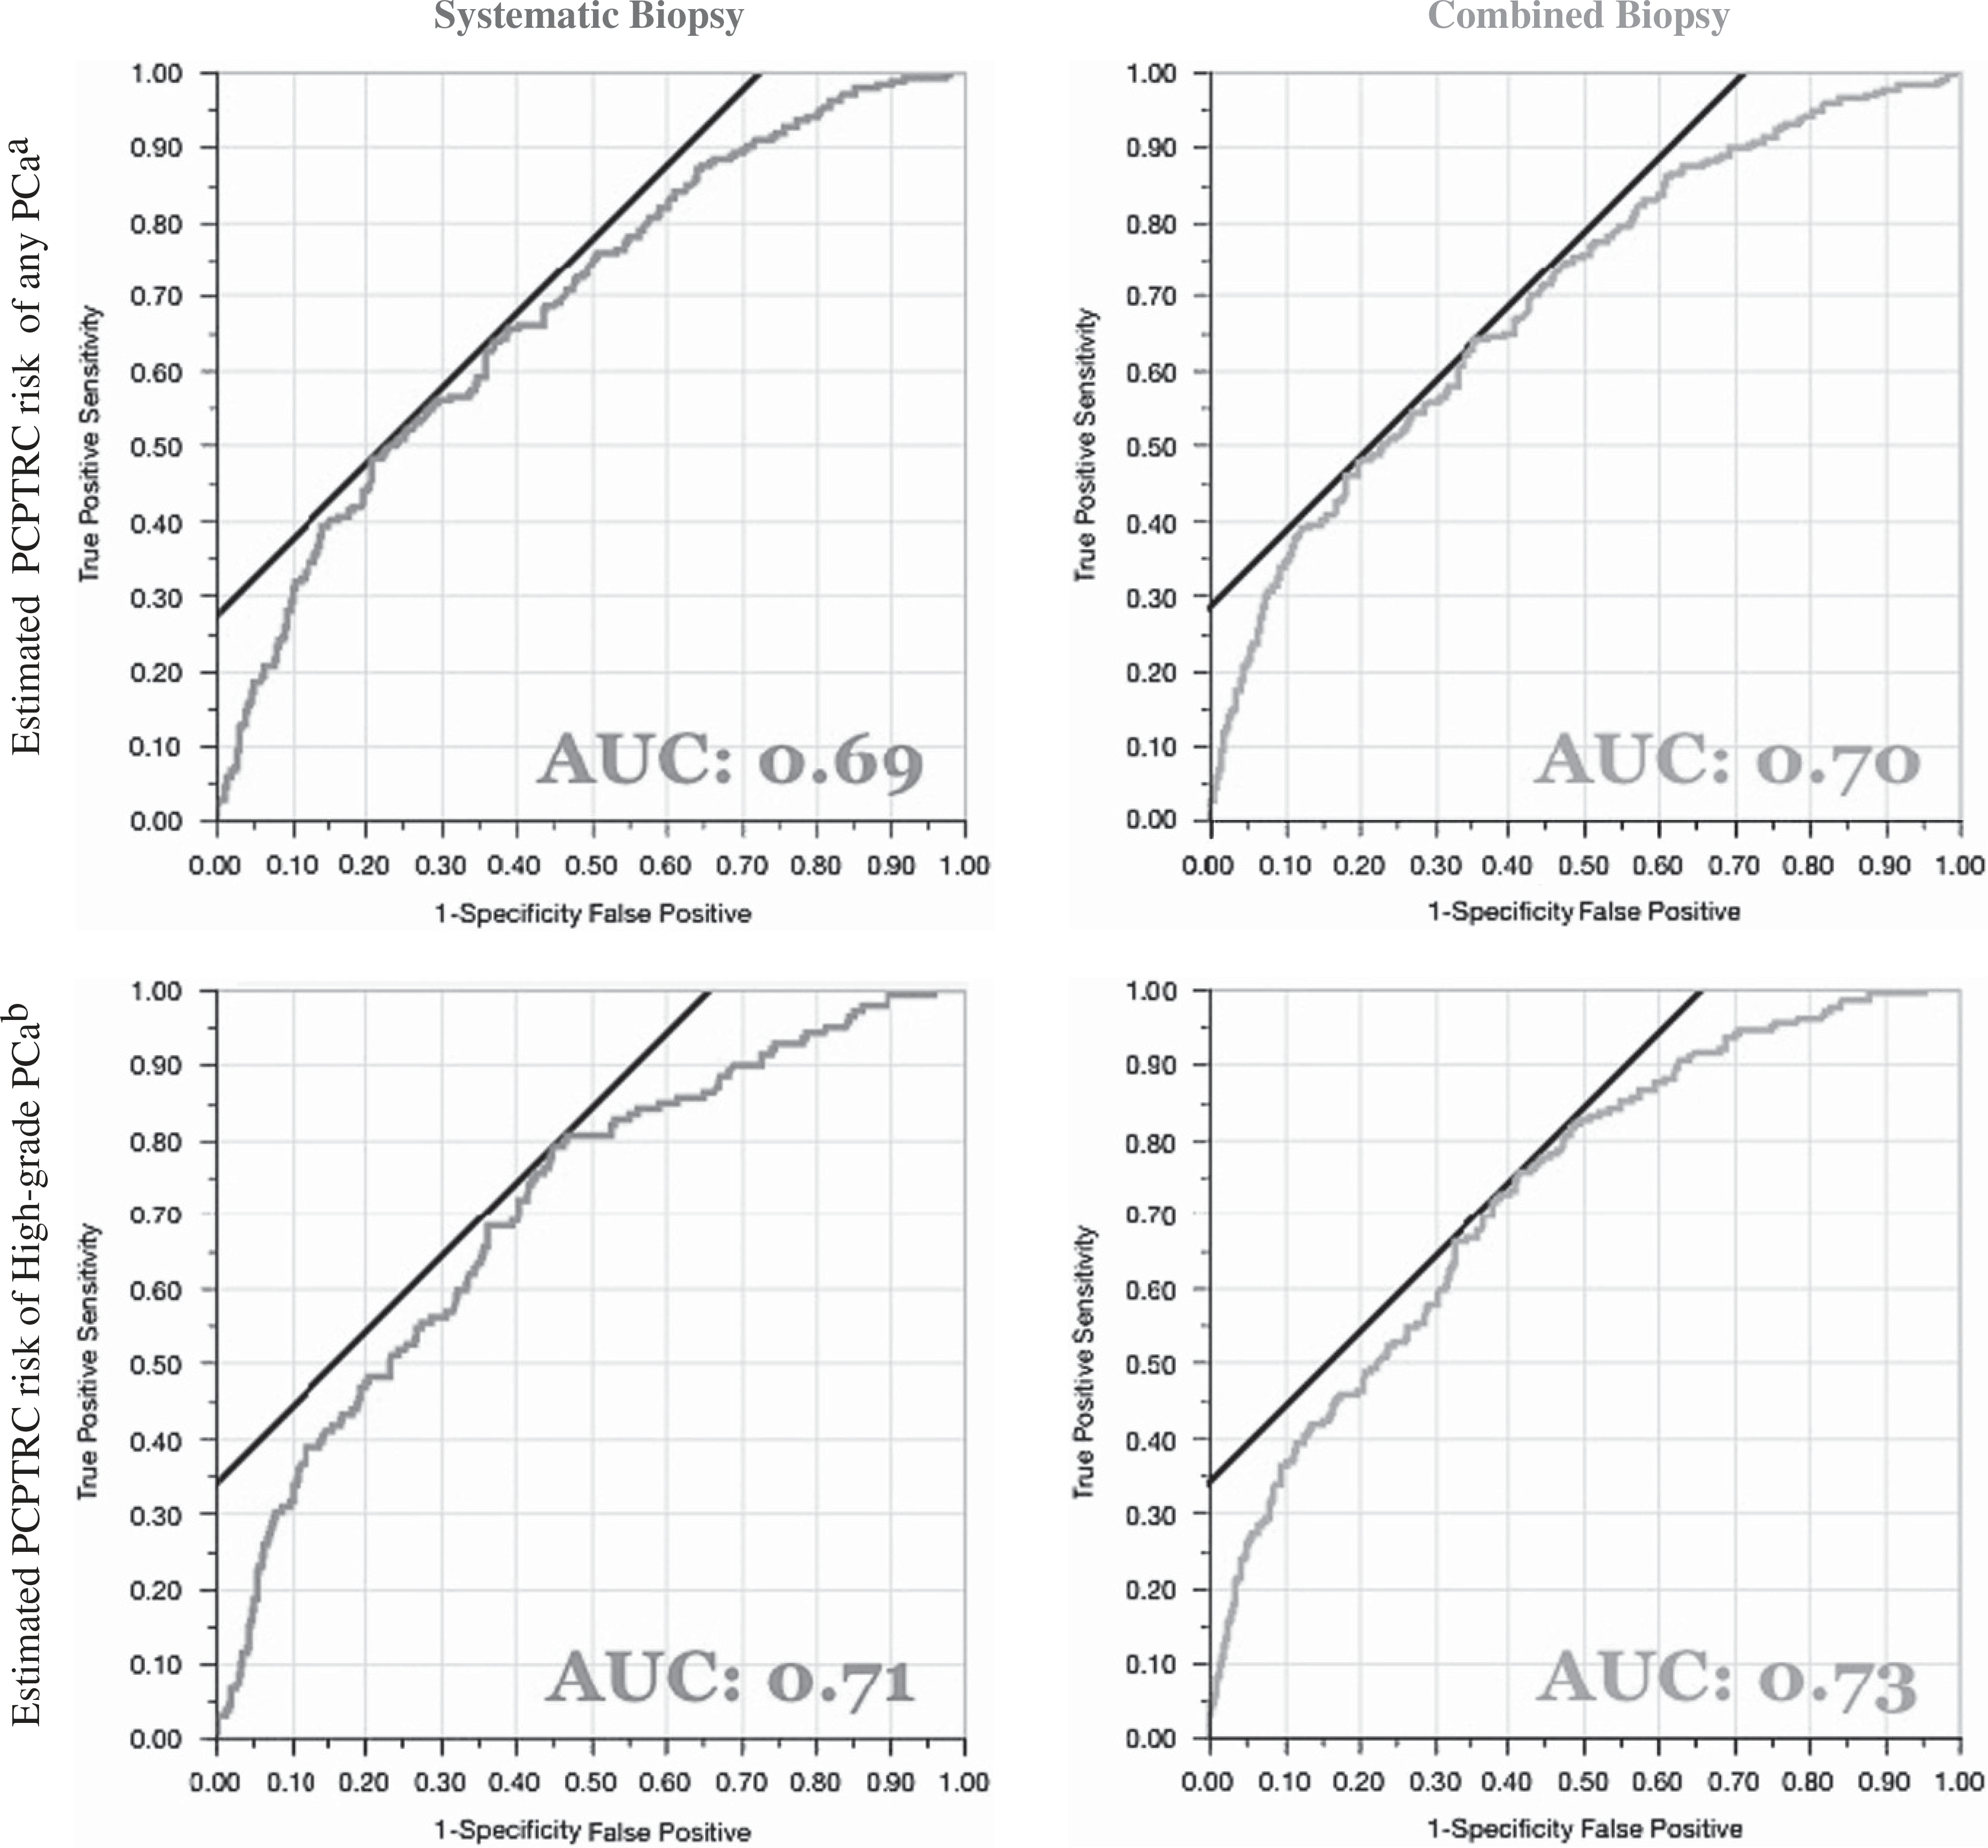
Area under the curve (AUC) of the receiver operator characteristics specify the ability of the PCPTRC to detect any grade cancer (above) and high-grade cancer (below) in combined biopsy and systematic biopsy. The ROC curve represents a graphical relationship between false-positive and true-positive rates. In the plots, a black line is tangentially drawn at a 45° angle to the ROC curve, demarcating a cutoff point, under the assumption that false negatives and false positives have equal value; the slope of the line can be used to calculate likelihood ratios for the test.28 aP = 0.55 comparing the AUC of systematic biopsy alone to combined biopsy. bP = 0.70 comparing the AUC of systematic biopsy alone to combined biopsy. Combined biopsy, combined targeted MRI/US fusion-guided biopsy with a 12-core systematic biopsy; MRI/US, magnetic resonance imaging/ultrasound; PCa, prostate cancer; PCPTRC, cancer risk estimated by the Prostate Cancer Prevention Trial Risk Calculator 2.0; ROC, receiver operator characteristic curves; standard biopsy, standard 12-core biopsy.
DISCUSSION
The current paradigm of PCa management involves the identification of clinically significant disease, although avoiding potentially indolent cancers. A major limitation of this model is the method of selecting men who are at risk for clinically significant cancer. Risk calculators, such as the PCPTRC, have been developed in order to identify men who may be in jeopardy of high-grade PCa on biopsy. Since its conception in 2006, the PCPTRC has been validated in multiple cohorts to verify its utility in contemporary clinical practice. Patients undergoing a FBx are an emerging patient population as the use of mpMRI and targeted biopsy becomes increasingly adopted. FBx confers a more accurate pathologic-risk stratification, identifying more patients with high-grade PCa and fewer patients with low-grade PCa.1 The first version of the PCPTRC demonstrated a more accurate capacity for identifying PCa and high-grade PCa with a greater number of cores sampled, raising the question of whether the current PCPTRC may demonstrate analogous performance in a FBx patient cohort.21 As the PCPTRC has been previously validated in patients receiving a SBx, our study compared the performance of the risk calculator in patients receiving a SBx with the results of the same patients receiving a FBx, thus demonstrating the validity of the PCPTRC in a biopsy modality that alters PCa risk stratification.15,22
The current study found no difference in AUCs for PCPTRC detecting high-grade disease in combined biopsy vs SBx (0.73 vs 0.71; P = 0.55), suggesting that current pre-biopsy variables provide adequate risk estimations for PCa in an MRI-screened population. In a similar manner, there was no statistical difference between the AUCs for PCPTRC detecting high-grade cancer in FBx alone compared with SBx (0.73 vs 0.71; P = 0.54); however, the implications of this comparison may be limited as contemporary practice is to perform a combined biopsy. Performance comparisons of risk calculators in FBx and SBx alone will indeed be necessary as we entertain the feasibility of FBx alone in patients with visible MRI lesions. The accuracy of a risk calculator is limited by the performance of the confirmatory biopsy. Instances in which the PCPTRC predicts a high probability of cancer, but the transrectal ultrasound (TRUS) standard biopsy does not yield disease may actually be a reflection of the limited ability of TRUS biopsies to capture all the disease that is present. For example, anterior or posterior subcapsular cancers are frequently undersampled by standard TRUS biopsies.23,24 Men with these cancers may have a relatively high risk of PCa predicted by the PCPTRC, but a TRUS biopsy may not yield a cancer diagnosis due to the location of the cancer within the prostate. FBx has proven to be an effective tool for sampling these areas and may yield a PCa diagnosis in those patients with a high-estimated PCPTRC risk. In this cohort, the mean calculated PCPTRC probabilities tended to underestimate the observed cancer incidence, largely due to the enriched patient population, as all the patients in this study had a suspicious lesion on MRI. As a result of this patient selection, calibration showed a similar underestimation in SBx and combined biopsy. However, when combined with pre-biopsy mpMRI, this tool may aid in identifying patients who are least at risk for PCa. Patients with a low-suspicion lesion on MRI had a calculated probability comparable to the actual cancer incidence (26.4% vs 26.1%), demonstrating a more accurate estimation in this group.
Improvements in prostate imaging have expanded the role of mpMRI. Recently, mpMRI has been compared with the PCPTRC for the prediction of clinically significant PCa. When clinically significant cancer was defined by Epstein criteria, MRI suspicion score outperformed the PCPTRC for the prediction of PCa (AUC 0.812 vs 0.676, respectively, P = 0.008).25 The authors reported an increase in the proportion of patients diagnosed with Gleason ≥ 7 PCa as the MRI suspicion increased; however, the difference in performance of MRI and PCPTRC for diagnosing Gleason ≥ 7 PCa was not statistically different (0.769 vs 0.676, respectively, P = 0.09). Similarly, our study demonstrated that the proportion of patients with Gleason ≥ 7 PCa increased from 7.2% to 28.2% to 78.7% as the MRI suspicion score increased from low to moderate to high, respectively. Although these results suggest the use of MRI for the selection of patients for biopsy, the PCPTRC may provide sufficient information to recommend further investigation. Patients referred to a urologist for suspicion of PCa present with all the information necessary to obtain a PCPTRC score, making it straightforward to use in clinical practice. The PCPTRC score is not only easily calculated from existing clinical data, but is also an objective measure of PCa probability, and can be used for shared decision making with the patient before obtaining a FBx. Conversely, interpretation of prostate MRI contains some degree of subjectivity, and is thus prone to interobserver variability.26 However, it is paramount to recognize the objective of this study was not to compare the PCPTRC to MRI suspicion score for PCa probability assessment. Rather, the aim of this study was to demonstrate the validity of using the PCPTRC for patients undergoing a FBx in light of the improved pathologic risk categorization that FBx confers.
Identification of screened patients at risk for high-grade disease with the PCPTRC, and subsequent diagnosis with FBx, represents a model for sparing unnecessary biopsies in patients who would not benefit from intervention. Current screening measures of PSA and DRE results alone are poorly associated with clinically significant PCa risk. The PCPTRC combines these parameters with family history, race and previous biopsy history to more accurately reflect a patient’s risk. In this study, 70% of patients presented with at least one prior negative biopsy. Nearly, a third of patients with a negative biopsy may still harbor PCa,27 and the decision of whether to repeat a biopsy with MRI/US guidance warrants more accurate cancer risk assessment to avoid obtaining a biopsy in a patient with low risk of clinically indolent cancer. The PCPTRC may be especially useful when incorporated into algorithms to determine if a patient would benefit from a FBx following a prior negative SBx.
This study of the PCPTRC in patients undergoing FBx has limitations. First, this is a retrospective analysis of a prospective clinical trial. Second, patients with a negative mpMRI were not included in this study, and thus we were not able to compare the CDR of patients with a suspicious lesion on MRI to patients with a negative MRI.
CONCLUSION
Our study demonstrates that PCPTRC is equally predictive of clinically significant disease in men undergoing FBx and SBx. Thus, in an MRI-screened population of men undergoing fusion biopsy, the PCPTRC continues to represent a practical method of accurately stratifying PCa risk.
ACKNOWLEDGEMENTS
This research was supported by the Intramural Research Program of the NIH, National Cancer Institute, Center for Cancer Research.
Footnotes
CONFLICT OF INTEREST
The authors declare no conflict of interest.
DISCLOSURE
NIH and Philips Healthcare have a cooperative research and development agreement. NIH and Philips share intellectual property in the field.
REFERENCES
- 1.Siddiqui MM, Rais-Bahrami S, Turkbey B, George AK, Rothwax J, Shakir N et al. Comparison of MR/ultrasound fusion-guided biopsy with ultrasound-guided biopsy for the diagnosis of prostate cancer. JAMA 2015; 313: 390–397. [DOI] [PMC free article] [PubMed] [Google Scholar]
- 2.Filson CP, Natarajan S, Margolis DJ, Huang J, Lieu P, Dorey FJ et al. Prostate cancer detection with magnetic resonance-ultrasound fusion biopsy: the role of systematic and targeted biopsies. Cancer 2016; 122: 884–892. [DOI] [PMC free article] [PubMed] [Google Scholar]
- 3.Meigs JB, Barry MJ, Oesterling JE, Jacobsen SJ. Interpreting results of prostate-specific antigen testing for early detection of prostate cancer. J Gen Intern Med 1996; 11: 505–512. [DOI] [PubMed] [Google Scholar]
- 4.Barry MJ. Clinical practice. Prostate-specific-antigen testing for early diagnosis of prostate cancer. N Engl J Med 2001; 344: 1373–1377. [DOI] [PubMed] [Google Scholar]
- 5.Loeb S, Bjurlin MA, Nicholson J, Tammela TL, Penson DF, Carter HB et al. Over-diagnosis and overtreatment of prostate cancer. Eur Urol 2014; 65: 1046–1055. [DOI] [PMC free article] [PubMed] [Google Scholar]
- 6.Thompson IM, Goodman PJ, Tangen CM, Lucia MS, Miller GJ, Ford LG et al. The influence of finasteride on the development of prostate cancer. N Engl J Med 2003; 349: 215–224. [DOI] [PubMed] [Google Scholar]
- 7.Thompson IM, Ankerst DP, Chi C, Goodman PJ, Tangen CM, Lucia MS et al. Assessing prostate cancer risk: results from the Prostate Cancer Prevention Trial. J Natl Cancer Inst 2006; 98: 529–534. [DOI] [PubMed] [Google Scholar]
- 8.Ankerst DP, Hoefler J, Bock S, Goodman PJ, Vickers A, Hernandez J et al. Prostate Cancer Prevention Trial risk calculator 2.0 for the prediction of low- vs high-grade prostate cancer. Urology 2014; 83: 1362–1367. [DOI] [PMC free article] [PubMed] [Google Scholar]
- 9.Lundon DJ, Kelly BD, Foley R, Loeb S, Fitzpatrick JM, Watson RW et al. Prostate cancer risk assessment tools in an unscreened population. World J Urol 2015; 33: 827–832. [DOI] [PubMed] [Google Scholar]
- 10.Oliveira M, Marques V, Carvalho AP, Santos A. Head-to-head comparison of two online nomograms for prostate biopsy outcome prediction. BJU Int 2011; 107: 1780–1783. [DOI] [PubMed] [Google Scholar]
- 11.Trottier G, Roobol MJ, Lawrentschuk N, Bostrom PJ, Fernandes KA, Finelli A et al. Comparison of risk calculators from the Prostate Cancer Prevention Trial and the European Randomized Study of Screening for Prostate Cancer in a contemporary Canadian cohort. BJU Int 2011; 108: E237–E244. [DOI] [PubMed] [Google Scholar]
- 12.Poyet C, Nieboer D, Bhindi B, Kulkarni GS, Wiederkehr C, Wettstein MS et al. Prostate cancer risk prediction using the novel versions of the European Randomised Study for Screening of Prostate Cancer (ERSPC) and Prostate Cancer Prevention Trial (PCPT) risk calculators: independent validation and comparison in a contemporary European cohort. BJU Int 2016; 117: 401–408. [DOI] [PubMed] [Google Scholar]
- 13.Foley RW, Maweni RM, Gorman L, Murphy K, Lundon DJ, Durkan G et al. The ERSPC risk calculators significantly outperform the PCPT 2.0 in the prediction of prostate cancer; a multi-institutional study. BJU Int 2016; 118: 706–714. [DOI] [PubMed] [Google Scholar]
- 14.Ploussard G, Epstein JI, Montironi R, Carroll PR, Wirth M, Grimm MO et al. The contemporary concept of significant versus insignificant prostate cancer. Eur Urol 2011; 60: 291–303. [DOI] [PubMed] [Google Scholar]
- 15.Ankerst DP, Boeck A, Freedland SJ, Jones JS, Cronin AM, Roobol MJ et al. Evaluating the Prostate Cancer Prevention Trial High Grade Prostate Cancer Risk Calculator in 10 international biopsy cohorts: results from the Prostate Biopsy Collaborative Group. W J Urol 2014; 32: 185–191. [DOI] [PMC free article] [PubMed] [Google Scholar]
- 16.Nam RK, Kattan MW, Chin JL, Trachtenberg J, Singal R, Rendon R et al. Prospective multi-institutional study evaluating the performance of prostate cancer risk calculators. J Clini Oncol 2011; 29: 2959–2964. [DOI] [PubMed] [Google Scholar]
- 17.Siddiqui MM, George AK, Rubin R, Rais-Bahrami S, Parnes HL, Merino MJ et al. Efficiency of Prostate Cancer Diagnosis by MR/Ultrasound Fusion-Guided Biopsy vs Standard Extended-Sextant Biopsy for MR-Visible Lesions. J Natl Cancer Inst 2016; 108: djw039. [DOI] [PMC free article] [PubMed] [Google Scholar]
- 18.Rais-Bahrami S, Siddiqui MM, Turkbey B, Stamatakis L, Logan J, Hoang AN et al. Utility of multiparametric magnetic resonance imaging suspicion levels for detecting prostate cancer. J Urol 2013; 190: 1721–1727. [DOI] [PMC free article] [PubMed] [Google Scholar]
- 19.Mertan FV, Greer MD, Shih JH, George AK, Kongnyuy M, Muthigi A et al. Prospective Evaluation of the Prostate Imaging Reporting and Data System Version 2 for Prostate Cancer Detection. J Urol 2016; S0022-S5347: 30199–30199. [DOI] [PubMed] [Google Scholar]
- 20.Muller BG, Shih JH, Sankineni S, Marko J, Rais-Bahrami S, George AK et al. Prostate cancer: interobserver agreement and accuracy with the revised prostate imaging reporting and data system at multiparametric MR imaging. Radiology 2015; 277: 741–750. [DOI] [PMC free article] [PubMed] [Google Scholar]
- 21.Ankerst DP, Till C, Boeck A, Goodman P, Tangen CM, Feng Z et al. The impact of prostate volume, number of biopsy cores and american urological association symptom score on the sensitivity of cancer detection using the Prostate Cancer Prevention Trial Risk Calculator. J Urol 2013; 190: 70–76. [DOI] [PMC free article] [PubMed] [Google Scholar]
- 22.Eyre SJ, Ankerst DP, Wei JT, Nair PV, Regan MM, Bueti G et al. Validation in a multiple urology practice cohort of the Prostate Cancer Prevention Trial calculator for predicting prostate cancer detection. J Urol 2009; 182: 2653–2658. [DOI] [PMC free article] [PubMed] [Google Scholar]
- 23.Sankineni S, George AK, Brown AM, Rais-Bahrami S, Wood BJ, Merino MJ et al. Posterior subcapsular prostate cancer: identification with mpMRI and MRI/TRUS fusion-guided biopsy. Abdom Imaging 2015; 40: 2557–2565. [DOI] [PMC free article] [PubMed] [Google Scholar]
- 24.Volkin D, Turkbey B, Hoang AN, Rais-Bahrami S, Yerram N, Walton-Diaz A et al. Multiparametric magnetic resonance imaging (MRI) and subsequent MRI/ultrasonography fusion-guided biopsy increase the detection of anteriorly located prostate cancers. BJU Int 2014; 114: E43–E49. [DOI] [PMC free article] [PubMed] [Google Scholar]
- 25.Salami SS, Vira MA, Turkbey B, Fakhoury M, Yaskiv O, Villani R et al. Multiparametric magnetic resonance imaging outperforms the Prostate Cancer Prevention Trial risk calculator in predicting clinically significant prostate cancer. Cancer 2014; 120: 2876–2882. [DOI] [PubMed] [Google Scholar]
- 26.Esen T, Turkbey B, Patel A, Futterer J. Multiparametric MRI in prostate cancer. BioMed Res Int 2014; 2014: 296810. [DOI] [PMC free article] [PubMed] [Google Scholar]
- 27.Sonn GA, Chang E, Natarajan S, Margolis DJ, Macairan M, Lieu P et al. Value of targeted prostate biopsy using magnetic resonance-ultrasound fusion in men with prior negative biopsy and elevated prostate-specific antigen. Euro Urol 2014; 65: 809–815. [DOI] [PMC free article] [PubMed] [Google Scholar]
- 28.DeLong ER, DeLong DM, Clarke-Pearson DL. Comparing the areas under two or more correlated receiver operating characteristic curves: a nonparametric approach. Biometrics 1988; 44: 837–845. [PubMed] [Google Scholar]