

Abstract
The amplitude of the auditory N1 component of the event‐related potential (ERP) is typically suppressed when a sound is accompanied by visual anticipatory information that reliably predicts the timing and identity of the sound. While this visually induced suppression of the auditory N1 is considered an early electrophysiological marker of fulfilled prediction, it is not yet fully understood whether this internal predictive coding mechanism is primarily driven by the temporal characteristics, or by the identity features of the anticipated sound. The current study examined the impact of temporal and identity predictability on suppression of the auditory N1 by visual anticipatory motion with an ecologically valid audiovisual event (a video of a handclap). Predictability of auditory timing and identity was manipulated in three different conditions in which sounds were either played in isolation, or in conjunction with a video that either reliably predicted the timing of the sound, the identity of the sound, or both the timing and identity. The results showed that N1 suppression was largest when the video reliably predicted both the timing and identity of the sound, and reduced when either the timing or identity of the sound was unpredictable. The current results indicate that predictions of timing and identity are both essential elements for predictive coding in audition.
Keywords: event‐related potentials, predictive coding, visual‐auditory
Impact statement
Auditory N1 suppression by visual anticipatory information is considered an early electrophysiological marker of fulfilled prediction. It is not yet fully understood what drives this internal predictive coding mechanism. The current study demonstrates–for the first time in an ecologically valid audiovisual event–that predictions of timing and identity are both essential elements for predictive coding in audition.
1. INTRODUCTION
Our brain is constantly exposed to sensory information that must be adequately processed and contextualized in order to facilitate appropriate responses and interactions with our environment. Being able to predict the sensory consequences of our own actions and those of others greatly improves the efficiency of this process, and enables us to allocate cognitive resources to novel or otherwise newsworthy information. A contemporary theoretical framework that describes the predictive coding of sensory information, postulates that our brain continuously generates an internal predictive model of our environment based on previous experiences (Friston, 2005). This internal model enables the brain to form both temporal (“when”) and identity (“what”) predictions of upcoming sensory events (Arnal & Giraud, 2012).
A frequently applied approach to study predictive coding mechanisms is by comparing electrophysiological brain responses evoked by predictable and unpredictable sounds. Numerous studies have shown that the auditory N1 is typically suppressed for sounds that are initiated by motor actions (e.g., a key‐press), compared to the N1 evoked by sounds with identical temporal and acoustic features that are triggered externally (for review, see Bendixen et al., 2012). N1 suppression effects have also been reported in the visual‐auditory domain. Lip‐read speech, for example, consistently suppresses the N1 (for review, see Baart, 2016). Other studies have shown that the N1 induced by sounds that are accompanied by anticipatory visual motion (e.g., seeing someone performing a handclap) is typically suppressed compared to the same sounds played in isolation (Stekelenburg & Vroomen, 2007, 2012; Vroomen & Stekelenburg, 2010).
The amplitude of the auditory N1 is assumed to be modulated by the precision of our internal predictive model (Arnal & Giraud, 2012; Friston, 2005). When precision is high, an incoming sound likely matches the prediction, and the auditory N1 is attenuated. For unpredictable sounds, the precision of the predictive model is low, and so the auditory N1 is not suppressed. Given that the timing and identity of sounds that are accompanied by visual anticipatory information are usually quite predictable, the precision of the internal prediction model is typically higher for such sounds than sounds played in isolation or externally initiated sounds. From a predictive coding perspective, the N1 suppression effect for sounds that are predictable by visual motion can thus be explained as an indication of the internal prediction model correctly anticipating the upcoming auditory stimulation.
While the available data agree that the N1 suppression effect is an early electrophysiological marker of fulfilled prediction (for review, see Bendixen et al., 2012), it is not yet fully understood whether predictive coding mechanisms in audition are primarily driven by the temporal characteristics, or by the identity features of the anticipated sound. In the visual‐auditory domain, there is some evidence that N1 suppression by visual motion may be less affected by identity prediction, and more reliant on temporal prediction (Huhn et al., 2009; Klucharev et al., 2003; Stekelenburg & Vroomen, 2007; van Wassenhove et al., 2005; Vroomen & Stekelenburg, 2010). Several studies have shown that synchronous presentation of speech sounds and visual articulatory movements (i.e., lip‐read speech) suppresses the auditory N1, even if the visual information is ambiguous or incongruent with the speech sounds (Klucharev et al., 2003; Stekelenburg & Vroomen, 2007; van Wassenhove et al., 2005), while suppression of the N1 is reduced if visual articulatory movements and speech sounds are presented asynchronous (Huhn et al., 2009). Similarly, N1 suppression in artificial audiovisual events is reduced when the timing of the auditory signal, relative to the visual signal, is inconsistent (Vroomen & Stekelenburg, 2010). Another study on N1 suppression by visual motion using ecological valid audiovisual stimuli has shown that N1 suppression was not affected by audiovisual congruency (i.e., the N1 was similarly suppressed by a video of a handclap paired with the actual sound of a handclap, as by a video of the handclap paired with the sound of a spoon tapping on a cup), but only occurs when the visual motion precedes the auditory signal and reliably predicts the timing (and not necessarily the identity) of the anticipated sound (Stekelenburg & Vroomen, 2007). These findings suggest that visually induced N1 suppression appears to be mostly driven by temporal prediction. However, in the studies that examined the impact of identity prediction on visually induced N1 suppression through manipulation of audiovisual congruency, only two (Stekelenburg & Vroomen, 2007; van Wassenhove et al., 2005) or four (Klucharev et al., 2003) incongruent audiovisual stimulus pairings were included that were repeated several times. Hence, participants may have learned to expect these few incongruent pairings and may have incorporated both the incongruent and congruent stimulus pairings in their internal predictive model–which in turn may have led to an overall suppression of the auditory N1 induced by both congruent and incongruent audiovisual stimulus pairings. Furthermore, temporal prediction was not manipulated in these studies, so the impact of temporal prediction on N1 suppression by visual motion in ecologically valid audiovisual events is yet to be examined.
Previous studies examining the impact of temporal and identity predictions on N1 suppression induced by visual motion either manipulated audiovisual timing in speech or artificial stimuli (Huhn et al., 2009; Vroomen & Stekelenburg, 2010), or audiovisual congruency in speech and ecologically valid stimuli (Klucharev et al., 2003; Stekelenburg & Vroomen, 2007; van Wassenhove et al., 2005). To our knowledge, the impact of both temporal and identity prediction on N1 suppression by visual motion has not been formally investigated in ecologically valid audiovisual events.
The visually induced N1 suppression effect is often accompanied by a suppression of the P2 (for review, see Baart, 2016). Although the impact of temporal and identity prediction on P2 suppression is still unclear, some studies suggest that P2 suppression by visual motion may be less affected by temporal predictability, and more driven by identity prediction (Stekelenburg & Vroomen, 2007; Vroomen & Stekelenburg, 2010). In a previous study using artificial audiovisual stimuli, no effect of temporal predictability on P2 suppression by visual motion was found (Vroomen & Stekelenburg, 2010), whereas a study using ecologically valid audiovisual stimuli suggests that P2 suppression may be modulated by audiovisual congruency (Stekelenburg & Vroomen, 2007).
The current study examined the impact of temporal and identity predictability on suppression of the auditory N1 and P2 by visual anticipatory motion with an ecologically valid audiovisual stimulus. Predictability of auditory onset (relative to visual onset) and sound identity was manipulated in three conditions (Table 1). The first condition was adapted from a previous study showing robust and consistent N1‐P2 suppression effects (Stekelenburg & Vroomen, 2007). In this natural condition, a video of a handclap was presented synchronously with the sound of the actual handclap. In the other two conditions, either the onset (random‐timing condition) or the identity (random‐identity condition) of the sound was unpredictable. In the random‐timing condition, the sound and video of the handclap were always presented asynchronous. The magnitude of asynchrony varied on a trial‐to‐trial basis in order to prevent adaptation to temporal asynchrony (Vroomen et al., 2004). In the random‐identity condition, the sound was randomly selected out of a pool of 100 stimuli on a trial‐to‐trial basis–thereby rendering the video an unreliable predictor for sound identity, while sound onset was always synced to the video. We tested for the presence of visually induced N1 and P2 suppression effects by presenting randomly intermixed audiovisual (AV), auditory‐only (A), and visual‐only (V) trials in each condition (natural, random‐timing, and random‐identity). In accord with previous research on early electrophysiological correlates of audiovisual interactions (Besle et al., 2004; Teder‐Salejarvi et al., 2002), visual activity was eliminated from event‐related potential (ERPs) evoked by AV trials by subtracting ERPs evoked by V trials. The additive model (A = AV‒V) assumes that the neural activity evoked by AV stimuli is equal to the sum of activities of A and V if the unimodal signals are processed independently. This assumption is valid for extracellular media and is based on the law of superposition of electric fields (Barth et al., 1995). Hence, differences in ERP amplitude between the A and AV‒V modality can be attributed to interactions between the two modalities and neural correlates of visual‐auditory predictive coding. However, the additive model approach may lead to spurious interaction effects if common activity such as anticipatory slow wave potentials (which continue for some time after stimulus onset) or late common ERP components (e.g., P3) are found in A, V, and AV ERPs, because this common activity will be present in A but is removed in the AV − V subtraction process (Besle et al., 2004; Teder‐Salejarvi et al., 2002). To reduce the occurrence of such common anticipatory processes, a variable intertrial interval and a variable interval from trial start to visual motion onset was used (Besle et al., 2004). To circumvent potential problems of late common activity, we restricted our analysis to early ERP components occurring <300 ms after stimulus onset.
TABLE 1.
Experimental conditions
| Condition | Sound timing | Sound identity |
|---|---|---|
| Natural | Synchronized with video | Handclap |
| Random‐timing | Randomb | Handclap |
| Random‐identity | Synchronized with video | Randoma |
aThe identity of the sound was randomly selected in every trial out of 100 different environmental sounds (e.g., doorbell, dog bark, and car horn) with equal rise and fall times, equal length and matched amplitudes.
bThe sound could either precede or follow the visual collision moment of the two hands at a randomly selected SOA of −250, −230, −210, −190, −170, 210, 240, 260, 290, or 320 (all values in ms, negative and positive values indicate sound leading and following the natural synchrony point, respectively).
Suppression of the N1 induced by visual anticipatory motion was expected to be most pronounced in the natural condition, where the video reliably predicted both the timing and identity of the sound. Based on the previous finding that temporal predictability is important for N1 suppression in artificial audiovisual events (Vroomen & Stekelenburg, 2010), suppression of the auditory N1 was expected to be reduced in the random‐timing condition. Assuming that identity of the sound is also of importance in the visual‐auditory domain, we expected that N1 suppression was also reduced in the random‐identity condition. Although the impact of temporal and identity predictability on visually induced P2 suppression is relatively under‐examined, there is some evidence for increased P2 suppression for audiovisual stimuli in which the identity of the sound is incongruent with the visual signal (Stekelenburg & Vroomen, 2007). Hence, suppression of the P2 was expected to be increased in the random‐identity condition compared to the natural and random‐timing condition.
It is well established that the auditory N1 is not a unitary response, but consist of (at least) three subcomponents that originate from both sensory and nonsensory brain regions (Näätänen & Picton, 1987; Woods, 1995). The first and second component occurring after stimulus onset (N1a, and N1b) are assumed to reflect auditory processing in primary and secondary auditory cortex, respectively. The third component (N1c) is considered to be a reflection of the orienting response, and is often referred to as the “unspecific” component. If the visually induced N1 suppression effect is a true reflection of the internal prediction model correctly anticipating the upcoming auditory stimulation, then, components generated in auditory cortex (i.e., N1a and N1b) should be attenuated. If, on the contrary, suppression of the auditory N1 by visual motion is mostly driven by a difference in orienting response between auditory and audiovisual stimulation, suppression of the N1 should be limited to the unspecific component of the N1 (i.e., N1c). To our knowledge, the visually induced N1 suppression effect has thus far only been examined at central electrode locations (e.g., Cz or a subset of frontocentral electrodes). Hence, the current study aimed to provide a more detailed analysis of suppression of the auditory N1 by visual motion by comparing suppression effects separately for the N1a, N1b, and N1c subcomponents.
2. METHOD
All experimental procedures were approved by the Ethics Review Board of the School of Social and Behavioral Sciences of Tilburg University (EC‐2016.48), and conducted in accordance with the ethical standards of the Declaration of Helsinki.
2.1. Participants
Twenty‐nine undergraduate students from Tilburg University participated in this study (23 female, mean age 19.72 years, SD = 1.74, and age range 17–25 years). Written informed consent was obtained from each participant prior to participation. All participants reported normal hearing and normal or corrected‐to‐normal vision. None were diagnosed with a neurological disorder and none reported use of medication. All participants were reimbursed with course credits as part of a curricular requirement.
2.2. Stimuli
Stimulus materials were adapted from a previous study showing robust and consistent N1 suppression effects (Stekelenburg & Vroomen, 2007). Visual stimuli consisted of a video recording portraying the visual motion of a single handclap on a black background (Figure 1). The video started with a 200 ms fade‐in followed by a still image with a randomly jittered duration from 200 to 800 ms showing the hands separated. Subsequently, the hands moved to each other and struck together 500 ms after motion onset. After impact, the hands returned to their original starting position and a 200 ms fade‐out was shown. The intertrial interval (ITI) was randomly jittered from 250 to 1,750 ms, during which a black screen was displayed. The video was presented on a 19‐inch CRT monitor (Iiyama Vision Master Pro 454) at a frame rate of 25 frames/s, a refresh rate of 100 Hz, a resolution of 640 × 480 pixels (14° horizontal and 12° vertical visual angle), and at a viewing distance of approximately 70 cm. Auditory stimuli consisted of an audio recording of the handclap portrayed in the video, and audio recordings of 100 different environmental sounds (e.g., doorbell, dog bark, and car horn) adapted from a previous study (Otte et al., 2013). All sounds were recorded at a sampling rate of 44.1 kHz with a duration of 200 ms duration (including 10 ms rise and fall times), and with matched root mean square (RMS) amplitudes. Sounds were presented over JAMO S100 stereo speakers, located directly on the left and right side of the monitor, at approximately 61 dB(A) sound pressure level. Stimulus presentation was controlled using E‐Prime 1.2 (Psychology Software Tools Inc., Sharpsburg, PA, USA).
FIGURE 1.
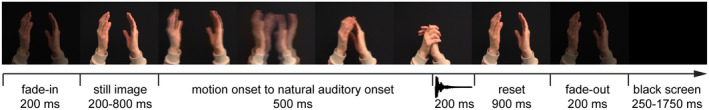
Time‐course of the video presented in audiovisual and visual trials
2.3. Procedure
Participants were individually tested in a sound attenuated and dimly lit room, and were seated in front of the monitor positioned at eye‐level. They were instructed to carefully listen to the presented sounds and to maintain their gaze on the center of the screen. Gaze direction was monitored through CCTV.
Three experimental conditions were included and presented in separate blocks: a natural condition, a random‐timing condition, and a random‐identity condition (Table 1). Three trial types were included in each block: audiovisual (AV), auditory (A), and visual (V). During AV trials in the natural condition, the video of a handclap was presented synchronously with the sound of the actual handclap. During A and V trials in the natural condition, only the sound or video of the handclap was presented, respectively. During AV trials in the random‐timing condition, the sound of the handclap could either precede or follow the visual collision of the two hands at an unpredictable stimulus onset asynchrony (SOA). Based on the results of a simultaneity judgment (SJ) task from a previous study using the same stimuli (van Laarhoven et al., 2017), SOAs of −250, −230, −210, −190, −170, 210, 240, 260, 290, and 320 were included (all values in ms, negative and positive values indicate sound leading and lagging the onset of the sound in the natural condition, respectively) to ensure that the timing of the sound relative to the video was highly unpredictable and never perceived as synchronous. During A trials in the random‐timing condition, the sound of the handclap was presented at the same unpredictable variable onset, but without the video. V trials in the random‐timing condition were identical to V trials in the natural condition. During AV trials in the random‐identity condition, the video of the handclap was presented synchronously with an environmental sound that was randomly selected out of the pool of 100 sounds. During A trials in the random‐identity condition, the same randomly selected environmental sounds were presented. V trials in the random‐identity condition were identical to V trials in the natural and random‐timing condition.
For each condition, a total of 270 randomly intermixed AV, A, and V trials (90 for each modality) were presented across three blocks of 90 trials. An intermixed design–as opposed to a blocked design, in which each modality is presented in a separate block–was implemented to limit the impact of potential attentional demand differences between modalities on the N1 response (Besle et al., 2004; Horváth & Winkler, 2010; Lange et al., 2003). Block order was quasi‐randomized across participants with the restriction that natural, random‐timing, and random‐identity blocks were never repeated successively.
2.4. EEG acquisition and processing
The EEG was sampled at 512 Hz from 64 locations using active Ag‐AgCl electrodes (BioSemi, Amsterdam, The Netherlands) mounted in an elastic cap and two mastoid electrodes. Electrodes were placed in accordance with the extended International 10–20 system. Two additional electrodes served as reference (Common Mode Sense active electrode) and ground (Driven Right Leg passive electrode). Horizontal electrooculogram (EOG) was recorded using two electrodes placed at the outer canthi of the left and right eye. Vertical EOG was recorded from two electrodes placed above and below the right eye. BrainVision Analyzer 2.0 (Brain Products, Gilching, Germany) was used for ERP analyses. EEG was referenced offline to an average of left and right mastoids and band‐pass filtered (0.01–30 Hz, 24 dB/octave). The (residual) 50 Hz interference was removed by a 50‐Hz notch filter. Raw data were segmented into epochs of 1,000 ms, including a 200‐ms prestimulus baseline period. Epochs were time‐locked to the sound onset in the AV and A trials, and to the corresponding timestamp in the V trials separately for all conditions. After EOG correction (Gratton et al., 1983), epochs with an amplitude change exceeding ±150 μV at any EEG channel were rejected. The remaining epochs were subsequently averaged and baseline corrected for each condition separately. On average 7.75% (SD = 7.24) of the trials were rejected. There were no significant differences in rejected trials between conditions or trial types (natural: AV 8.00%, A 8.25%, and V 7.72%; random‐timing: AV 7.59%, A 9.27%, and V 7.66%; random‐identity AV 5.71%, A 7.28%, and V 6.51%). To facilitate a direct comparison between the AV and A trials within and between each condition, V ERPs were subtracted from the AV ERPs for each condition to nullify the contribution of visual activity (Besle et al., 2004; Stekelenburg & Vroomen, 2007; Teder‐Salejarvi et al., 2002; Vroomen & Stekelenburg, 2010).
2.5. ERP analysis
All statistical analyses were performed using SPSS Statistics version 26 (IBM Corp, Armonk, NY, USA), and were focused on whether visual motion suppressed auditory‐evoked responses equally in the natural, random‐timing, and random‐identity condition by comparing the amplitude of the N1a, N1b, N1c, and P2 components of the auditory (A) and audiovisual minus visual (AV‒V) ERP waveforms within and between conditions. Time windows and electrodes of interest for each component were identified on the grand average A ERP waveforms for each condition. N1a and N1c were identified at temporal electrodes T7 and T8 as the first and second negative peaks occurring after sound onset (Näätänen & Picton, 1987; Tonnquist‐Uhlen et al., 2003; Woods, 1995). N1b was identified at central electrode Cz as the largest negative peak occurring 50–150 ms after sound onset. P2 was identified at central electrode Cz as the largest positive peak occurring immediately after the N1 components. Individual amplitudes of the N1 components for each modality were calculated as the average amplitude measured in a 20 ms time window centered on the identified N1a, N1b, and N1c peaks of the grand average A ERP waveforms at the previously mentioned electrodes for each condition. For the individual amplitudes of the P2 component, a time window of 40 ms centered around the identified P2 peak of the grand average A ERP waveform measured at Cz was used.
Individual amplitudes for N1a and N1c were submitted to univariate repeated measures ANOVAs with the within‐subjects variables condition (natural, random‐timing, and random‐identity), modality (A, AV‒V), and electrode (T7, T8). N1b and P2 amplitudes were submitted to univariate repeated measures ANOVAs with the within‐subjects variables condition (natural, random‐timing, and random‐identity), and modality (A, AV‒V). Greenhouse–Geisser correction was applied when the sphericity assumption was violated, in which case ε‐values, corrected p values, and uncorrected degrees of freedom are reported. Significant interaction effects were further examined with post hoc paired samples t tests using the Holm–Bonferroni correction method for multiple comparisons (Holm, 1979).
Whenever significant suppression effects where found for an ERP component in more than one condition, individual amplitudes for the ERP component were normalized by dividing them by the across‐participant mean amplitude of the A modality in the respective condition (see Sanmiguel et al., 2013). Subsequently, proportional differences between the A and AV‒V modalities were calculated and submitted to the same univariate repeated measures ANOVA as used to analyze the absolute differences, but without the factor modality. This procedure allowed to control for general effects due to differences in physical stimulus characteristics across conditions as a confounder for the difference in suppression effects between conditions.
To examine whether the observed suppression effects at the electrodes of interest were potentially confounded by topographical differences between conditions, additional analyses were conducted on the individual amplitudes measured in a cluster of electrodes with the electrode(s) of interest for the particular ERP component at the center. For each ERP component showing significant suppression effects, topographical distributions between conditions and modalities were examined with a Condition × Modality × Electrode repeated measures ANOVA. Greenhouse–Geisser correction was applied whenever the sphericity assumption was violated, in which case ε‐values, corrected p values, and uncorrected degrees of freedom are reported. A significant interaction including the factor electrode in these analyses indicates a potential difference in topographical distribution, which suggests that the observed suppression effect is not merely a modulation of the underlying ERP components, but may also reflect activity of additional neural generators. However, a significant interaction with the factor electrode may also result from differences in ERP amplitudes between conditions (McCarthy & Wood, 1985). Hence, whenever a significant interaction with the factor electrode was observed, amplitudes were vector‐normalized (McCarthy & Wood, 1985) separately for each condition and modality, and submitted to the same Condition × Modality × Electrode repeated measures ANOVA to determine whether the topographical distributions differed between conditions.
3. RESULTS
The grand average A and AV‒V ERP waveforms showed clearly identifiable N1a and N1c components at temporal electrodes, and N1 and P2 components at central electrodes (Figure 2). In accordance with previous research on auditory and audiovisual processing (Baart, 2016; Tonnquist‐Uhlen et al., 2003), maximum amplitudes for N1a and N1c were measured at temporal electrodes T7 and T8, while maximum amplitudes for N1b and P2 were measured at Cz (Figure 3). N1a peaked at 90 ms after sound onset in the grand average A ERP waveform in the natural and random‐timing condition, and at 92 ms in the random‐identity condition. N1b peaked at 102 ms after sound onset in the grand average A ERP waveform in the natural and random‐timing condition, and at 109 ms in the random‐identity condition. N1c peaked at 145 ms, 143 ms, and 141 ms in the natural, random‐timing, and random‐identity condition, respectively. P2 peaked at 191 ms in the natural and random‐timing condition, and at 199 ms in the random‐identity condition.
FIGURE 2.
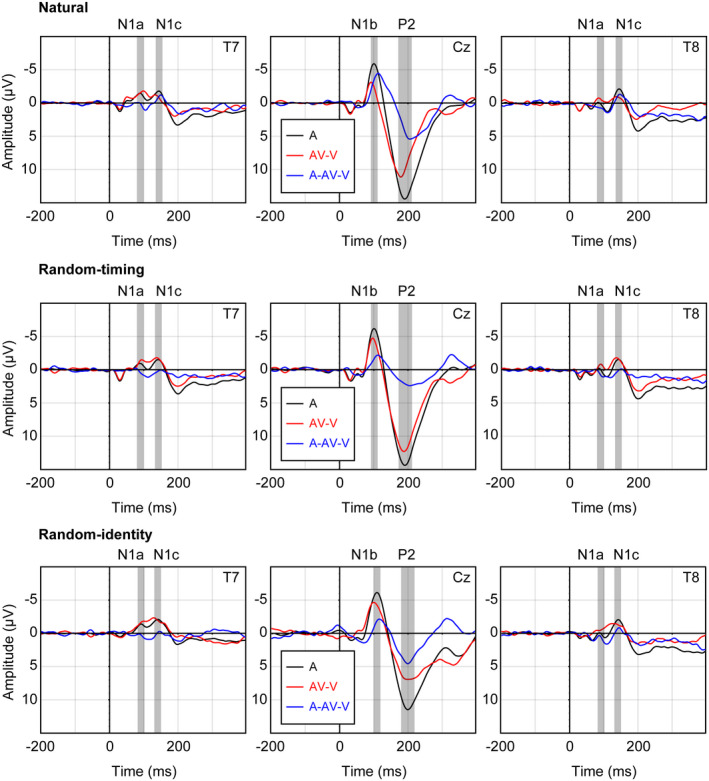
Grand average auditory (a), audiovisual‒visual (AV‒V) event‐related potential (ERP) waveforms and difference waveforms (A‒AV‒V) for the natural, random‐timing, and random‐identity condition. Analyzed time windows are marked in gray on the relevant electrodes for the N1a, N1b, N1c, and P2 component
FIGURE 3.
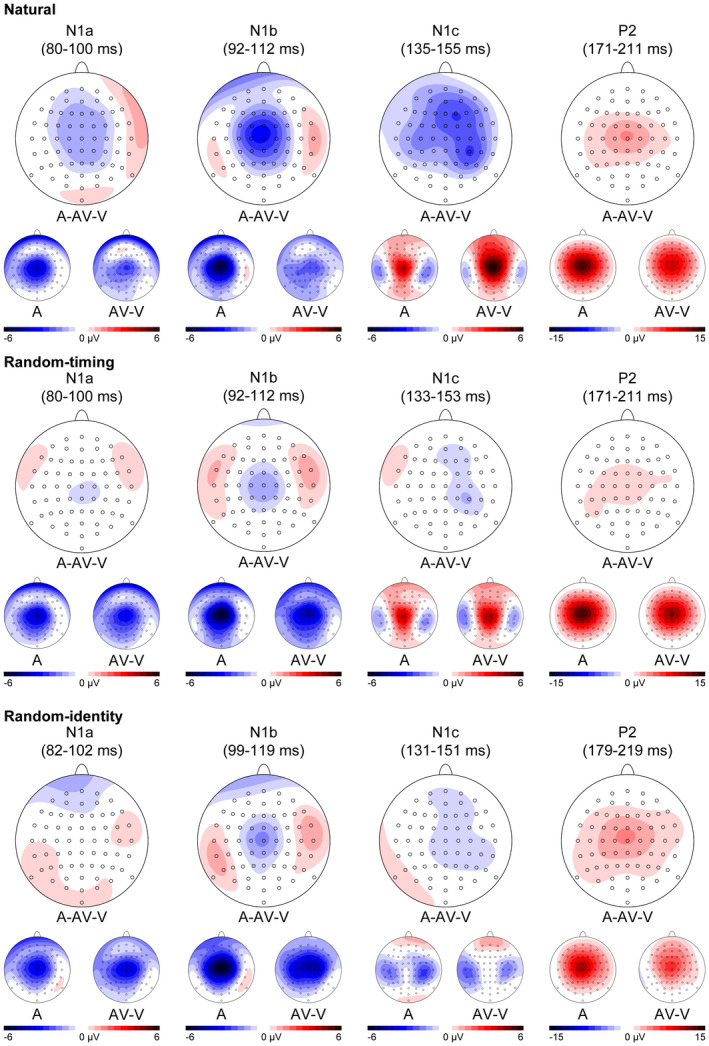
Scalp potential maps of the grand average auditory (a) and audiovisual‒visual (AV‒V) modality and difference topographies (A‒AV‒V) in the analyzed N1a, N1b, N1c, and P2 time windows for the natural, random‐timing, and random‐identity condition
3.1. N1a
The Condition (natural, random‐timing, and random‐identity) × Modality (A, AV‒V) × Electrode (T7, T8) repeated measures ANOVA revealed a main effect of electrode, F(1, 28) = 7.57, p = .01, = 0.21, indicating that the overall N1a amplitude was more negative at T7 compared to T8. There were no other significant main or interaction effects (all p values > .10), indicating that visual motion did not suppress the N1a in any of the included conditions.
3.2. N1b
The Condition (natural, random‐timing, and random‐identity) × Modality (A, AV‒V) repeated measures ANOVA revealed a main effect of condition, F(2, 56) = 4.97, p = .01, = 0.15, and modality, F(1, 28) = 38.16, p < .001, = 0.58. There was a significant Condition × Modality interaction, F(2, 56) = 4.96, p = .01, = 0.15. Post hoc paired samples t tests indicated that N1b amplitude was attenuated in the AV‒V modality compared to the A modality in all conditions (all t values < −2.78, and Holm–Bonferroni corrected p values < .01). N1b amplitude in the AV‒V modality was lower in the natural condition compared to the random‐timing (t(28) = −3.30, p < .01) and random‐identity condition (t(28) = −3.38, p < .01). There were no significant differences in N1b amplitude between the three conditions in the A modality (all t values < 0.85, uncorrected p values > .40, and Holm–Bonferroni corrected p values = 1), which indicates that the extent to which the N1 was suppressed by visual motion in each condition could likely not be attributed to differences in unisensory auditory processing between conditions. As shown in Figure 4a, visual information suppressed the N1b by 3.32 µV in the natural condition, 1.57 µV in the random‐timing condition, and 1.67 µV in the random‐identity condition (natural: A −5.58 µV, AV‒V −2.26 µV; random‐timing: A −5.86 µV, AV‒V −4.29 µV, random‐identity: A −5.88 µV, AV‒V −4.21 µV).
FIGURE 4.
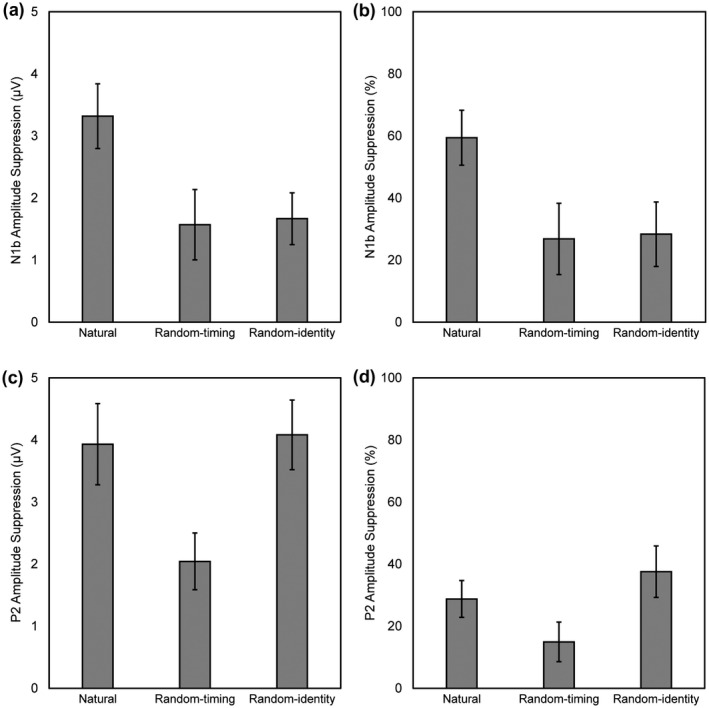
Average amplitude suppression in microvolts (µV) and percentage (%) of auditory amplitude of the N1b (a, b) and P2 (c, d) components for the natural, random‐timing, and random‐identity condition. Error bars represent ± one standard error of the mean
An ANOVA on the proportional differences in N1b amplitude between the A and AV‒V modalities revealed a main effect of condition, F(2, 56) = 6.34, p = .003, = 0.19. Post hoc t tests with Holm–Bonferroni corrected p values showed that the proportional suppression of N1b was larger in the natural condition compared to the random‐timing (t(28) = 3.09, p = .01) and random‐identity condition (t(28) = 3.12, p = .01), and did not significantly differ between the random‐timing and random‐identity condition (t(28) = −0.15, p = .88). On average, visual information suppressed N1b amplitude by 59% in the natural condition, 27% in the random‐timing condition, and 28% in the random‐identity condition (Figure 4b).
Topographical distribution of the N1b between conditions and modalities was examined with a Condition (natural, random‐timing, and random‐identity) × Modality (A, AV‒V) × Electrode (FC1, FCz, FC2, C1, Cz, C2, CP1, CPz, and CP2) repeated measures ANOVA on the individual N1b amplitudes. The ANOVA revealed significant interactions between electrode and condition (F(16, 448) = 1.41 p = .03, = 0.08, ε = 0.35), and electrode and modality (F(8, 224) = 4.85, p < .001, = 0.15, ε = 0.28). However, the same ANOVA on the vector‐normalized amplitudes (McCarthy & Wood, 1985) revealed no interactions between electrode and condition (F(16, 448) = 2.06, p = .06, = 0.07, ε = 0.36), electrode and modality (F(8, 224) = 1.53, p = .21, = 0.05, ε = 0.42), or Electrode × Condition ×Modality (F(16, 448) = 1.64, p = .14, = 0.06, ε = 0.38), which indicates that the observed suppression effects reflect genuine modulations of the N1b component.
3.3. N1c
The Condition (natural, random‐timing, and random‐identity) × Modality (A, AV‒V) × Electrode (T7, T8) repeated measures ANOVA revealed no significant main or interaction effects (all p values > .11), indicating that visual motion did not suppress the N1c in any of the included conditions.
3.4. P2
The Condition (natural, random‐timing, and random‐identity) × Modality (A, AV‒V) repeated measures ANOVA revealed main effects of condition, F(2, 56) = 34.02, p < .001, = 0.55, and modality, F(1, 28) = 73.28, p < .001, = 0.72. There was a significant Condition × Modality interaction, F(2, 56) = 5.23, p < .01, = 0.16. Post hoc paired samples t tests with Holm–Bonferroni corrected p values indicated that P2 amplitude was attenuated in the AV‒V modality compared to the A modality in all conditions (all t values < −4.47, and p values < .001). P2 amplitude measured in the A modality was lower in the random‐identity condition compared to the natural (t(28) = −4.45, p < .001) and random‐timing condition (t(28) = −4.54, p < .001). There were no significant differences in P2 amplitude in the A modality between the natural and random‐timing condition (t(28) = −0.043, p =.97). P2 amplitude in the AV‒V modality significantly differed between all conditions (all t values > 3.48, and p values < .01), such that amplitude was lowest in the random‐identity condition (6.78 µV), intermediate in the natural condition (9.74 µV), and highest in the random‐timing condition (11.64 µV). As shown in Figure 4c, visual information suppressed the P2 by 3.93 µV in the natural condition, 2.04 µV in the random‐timing condition, and 4.08 µV in the random‐identity condition (natural: A 13.67 µV, AV‒V 9.74 µV; random‐timing: A 13.68 µV, AV‒V 11.64 µV, random‐identity: A 10.86 µV, AV‒V 6.78 µV).
An ANOVA on the proportional differences in P2 amplitude between the A and AV‒V modalities revealed a main effect of condition, F(2, 56) = 9.27, p = .001, = 0.25, ε = 0.82. Post hoc t tests with Holm–Bonferroni corrected p values showed that the proportional suppression of P2 was lower in the random‐timing condition compared to the natural (t(28) = 3.46, p < .001), and random‐identity condition (t(28) = 4.13, p < .001), and did not significantly differ between the natural and random‐identity condition (t(28) = −1.42, p = .17). On average, visual information suppressed P2 amplitude by 29% in the natural condition, 15% in the random‐timing condition, and 38% in the random‐identity condition (Figure 4d).
Topographical distribution of the P2 between conditions and modalities was examined with a Condition (natural, random‐timing, and random‐identity) × Modality (A, AV‒V) × Electrode (FC1, FCz, FC2, C1, Cz, C2, CP1, CPz, and CP2) repeated measures ANOVA on the individual P2 amplitudes. The ANOVA revealed a significant Electrode × Modality interaction (F(8, 224) = 5.20, p = .01, = 0.16, ε = 0.26). However, the same ANOVA on the vector‐normalized amplitudes (McCarthy & Wood, 1985), revealed no significant interaction between electrode and modality (F(8, 224) = 0.75, p = .51, = 0.03, ε = 0.33), and no Electrode × Condition ×Modality interaction (F(16, 448) = 0.91, p = .49, = 0.03, ε = 0.35), which indicates that the observed suppression effects reflect genuine modulations of the P2 component.
4. DISCUSSION
The current study examined the impact of temporal and identity predictability on suppression of the auditory N1 and P2 by visual motion. In three conditions, a video of a handclap either reliably predicted both the timing and identity of the sound (the natural condition), or only the identity (random‐timing condition) or timing (random‐identity condition). Compared to the N1 evoked by sounds played in isolation, the N1 was suppressed when the same sounds were accompanied by visual motion, regardless of whether the video reliably predicted the timing or identity of the sound. The largest suppression of the N1b occurred when both the timing and identity were predictable. N1 suppression was similarly reduced when either the timing or identity were unpredictable. It is unlikely that these differences in suppression effects between conditions can be attributed to differences in unisensory auditory processing, differences in allocation of attention, or general effects due to differences in physical stimulus characteristics across conditions. The current results thus demonstrate that visually induced temporal and identity predictions both contribute to suppression of the N1 in the visual‐auditory domain. In addition, suppression effects were limited to the N1b subcomponent, which indicates that N1 suppression by visual motion is not driven by a difference in orienting response between conditions, but more likely reflects attenuation of sensory responses due to a match of incoming auditory stimulation with internal predictions generated by auditory predictive coding mechanisms.
4.1. N1 suppression effects in the visual‐auditory domain
Previous studies have shown that suppression of the auditory N1 by visual motion is reduced in audiovisual speech and artificial audiovisual stimuli when the timing of the auditory and visual signal varies from trial‐to‐trial (Huhn et al., 2009; Vroomen & Stekelenburg, 2010). The current results regarding the random‐timing condition are in line with these findings, and demonstrate that visually induced suppression of the auditory N1 is also reduced in ecologically valid audiovisual events when the visual signal does not reliably predict the timing of the anticipated sound, but only the identity. The current findings regarding the random‐identity condition, however, are not in agreement with those of previous studies using audiovisual speech stimuli (Klucharev et al., 2003; Stekelenburg & Vroomen, 2007; van Wassenhove et al., 2005), and ecologically valid audiovisual stimuli (Stekelenburg & Vroomen, 2007), in which no effect of audiovisual congruency on N1 suppression was found. A plausible explanation for these different results could be due to the fact that only two (Stekelenburg & Vroomen, 2007; van Wassenhove et al., 2005) or four (Klucharev et al., 2003) different sounds were used in these studies to manipulate identity predictability–whereas in the random‐identity condition of the current study, sound identity was more unpredictable as the sound was randomly selected out of a pool of 100 stimuli on a trial‐to‐trial basis. Hence, participants in the aforementioned studies may have still been able to generate identity predictions to some degree, whereas in the current study this was virtually impossible, and hence, identity predictions were likely much less precise–as indicated by the reduced N1b suppression effect for sounds with unpredictable identity. In a future study, it would be interesting to examine whether the extent to which the N1 is suppressed by visual motion is indeed affected by the number of distinct sounds that are paired with the visual signal by including different conditions with varying degrees of identity predictability. In addition, it has been hypothesized that the signaling of temporal predictions predominantly involves slow delta–theta oscillations, while identity predictions seem to be mediated on beta and gamma frequencies (Arnal & Giraud, 2012). It would therefore be interesting to see if a future study incorporating a time‐frequency analysis might be able to examine the underlying oscillatory patterns of early electrophysiological markers of temporal and identity prediction in the visual‐auditory domain.
4.2. N1 suppression effects in the motor‐auditory domain
The current results are in accordance with a previous study in the motor‐auditory domain (Baess et al., 2008), which showed that the auditory N1 is suppressed for self‐initiated sounds compared to externally initiated sounds, even when the onset and identity of the sound was unpredictable. Similar to the current results, this study found that suppression was largest when both sound frequency and onset were predictable, and reduced when the sound frequency could not be predicted (Baess et al., 2008). Unlike in the study by Baess et al. (2008), suppression of the N1 was not larger in the current study when the onset of the sound was unpredictable when compared to a context with unpredictable sound identity. A plausible explanation for the different results is that, compared to auditory prediction by a self‐generated motor act, auditory prediction by vision might be more affected by the temporal association between the auditory and visual stimulus. While strict intersensory temporal associations are not necessarily involved in the act of a button press in daily life, perceiving a video of a natural audiovisual event may induce relatively strong temporal auditory expectations based on lifelong experience. When operating electronic or mechanical devices, a button press may induce sensory stimulation with a great variety of delays. In the perception of audiovisual events, however, intersensory timing is much more confined by the naturally occurring lag in arrival time of the sensory information streams. Any disruption of this natural order of events thus likely results in less accurate predictions and decreased sensory attenuation–as indicated by the reduced suppression effect for sounds with unpredictable timing in the current study.
4.3. P2 suppression effects in the visual‐auditory domain
In line with previous studies in the visual‐auditory domain (Baart, 2016; Stekelenburg & Vroomen, 2007, 2012; Vroomen & Stekelenburg, 2010), the N1 suppression effect was accompanied by a suppression of the P2. The P2 was suppressed by visual motion in all three conditions, regardless of whether the video reliably predicted the timing and identity of the sound. However, suppression of the P2 was reduced when the video did not reliably predict the timing of the sound. The current results are in line with previous research using artificial audiovisual stimuli which showed that suppression of the P2 only occurs when the visual signal reliably predicts the timing of the sound (Vroomen & Stekelenburg, 2010). The current findings regarding suppression of the P2 in the random‐identity condition are not in accord with a previous study using similar audiovisual stimuli as used in the current study (Stekelenburg & Vroomen, 2007). In this study, an increased P2 suppression was found for incongruent audiovisual stimulus pairings. However, only two different incongruent audiovisual stimuli were used in this study to manipulate identity predictability, and incongruent and congruent stimulus pairings were administered in the same block. It could therefore be speculated that the incongruent audiovisual stimulus pairings were considered as a deviant stimulus category, and that the observed increase in P2 suppression in the study by Stekelenburg and Vroomen (2007) was in part caused by an overlapping mismatch negativity (MMN) ERP component related to the detection of a deviant stimulus or conflict between the visually anticipated sound and presented sound (Horváth et al., 2013; Näätänen et al., 1978, 2007). In the random‐identity condition of the current study, the P2 suppression was likely not affected by an overlapping MMN‐like component, since all audiovisual stimulus pairings in this condition were incongruent, and hence, equally salient.
4.4. P2 suppression effects in the motor‐auditory domain
Suppression of the P2 for sounds with predictable timing and identity has also been reported in the motor‐auditory domain (Horváth et al., 2012; Knolle et al., 2012, 2013). Unfortunately, the few studies that manipulated temporal or identity prediction in the motor‐auditory domain did not examine the P2 component (Baess et al., 2008; Horváth, 2013). To our knowledge, only one study has reported an effect of identity prediction on P2 suppression in the motor‐auditory domain (Hughes et al., 2013). However, the manipulation of identity prediction in this study was very limited (i.e., only two different sounds were used), so the validity of these results is unclear and further research is warranted in order to determine the impact of identity and temporal prediction on P2 suppression in the motor‐auditory domain. Nevertheless, the current results suggest that suppression of the auditory P2 may be less affected by identity predictability, and more driven by temporal predictions. Although the functional interpretation of the auditory P2 is poorly understood (for review, see Crowley & Colrain, 2004), these findings suggest that different predictive coding mechanisms may underly N1 and P2 suppression effects.
5. CONCLUSIONS
The current study examined the impact of temporal and identity prediction on suppression of the auditory N1 and P2 by visual motion. Predictability of the timing and identity of auditory stimulation was manipulated in a fully crossed design using three different conditions in which sounds were either played in isolation or in conjunction with a video that either reliably predicted both the timing and identity of the sound, or only the timing or identity. The extent to which the N1 was suppressed by visual motion was affected by the temporal and identity predictability of the sound. Suppression was largest when the video reliably predicted the timing and identity of the sound, and reduced when either the timing or identity of the sound was unpredictable. Suppression of the N1 was limited to the sensory‐specific N1b subcomponent, which indicates that N1 suppression by visual motion likely reflects a match between incoming auditory stimulation and internal auditory predictions, and can thus be considered as an early electrophysiological marker of fulfilled prediction. Several studies in the auditory and motor‐auditory domain have shown that both temporal and identity expectations may lead to suppression of the auditory N1 (for review, see Bendixen et al., 2012). The current results extend the existing literature by demonstrating that temporal and identity predictions contribute to suppression of the auditory N1 in the visual‐auditory domain as well. The auditory P2 was equally suppressed when sound identity was predictable or unpredictable, but reduced when the video did not reliably predict the timing of the sound–which suggests that suppression of the auditory P2 may be less affected by identity predictability, and more driven by temporal predictions.
Taken together, these findings indicate that predictions of timing and identity are both essential elements for predictive coding in audition. Future studies should examine if the current findings apply to other intersensory domains as well.
AUTHOR CONTRIBUTIONS
Conceptualization; Data curation; Formal analysis; Investigation; Methodology; Project administration; Visualization; Writing‐original draft; Writing‐review & editing: van Laarhoven. Conceptualization; Formal analysis; Methodology; Supervision; Writing‐review & editing: Stekelenburg. Conceptualization; Supervision; Writing‐review & editing: Vroomen.
ACKNOWLEDGMENTS
The authors thank Maria‐Elise van der Sluys for her help with the data collection. Open access funding enabled and organized by Projekt DEAL.
van Laarhoven T, Stekelenburg JJ, Vroomen J. Suppression of the auditory N1 by visual anticipatory motion is modulated by temporal and identity predictability. Psychophysiology. 2021;58:e13749 10.1111/psyp.13749
REFERENCES
- Arnal, L. H. , & Giraud, A. L. (2012). Cortical oscillations and sensory predictions. Trends in Cognitive Sciences, 16(7), 390–398. 10.1016/j.tics.2012.05.003 [DOI] [PubMed] [Google Scholar]
- Baart, M. (2016). Quantifying lip‐read‐induced suppression and facilitation of the auditory N1 and P2 reveals peak enhancements and delays. Psychophysiology, 53(9), 1295–1306. 10.1111/psyp.12683 [DOI] [PubMed] [Google Scholar]
- Baess, P. , Jacobsen, T. , & Schröger, E. (2008). Suppression of the auditory N1 event‐related potential component with unpredictable self‐initiated tones: Evidence for internal forward models with dynamic stimulation. International Journal of Psychophysiology, 70(2), 137–143. 10.1016/j.ijpsycho.2008.06.005 [DOI] [PubMed] [Google Scholar]
- Barth, D. S. , Goldberg, N. , Brett, B. , & Di, S. (1995). The spatiotemporal organization of auditory, visual, and auditory‐visual evoked potentials in rat cortex. Brain Research, 678(1‐2), 177–190. 10.1016/0006-8993(95)00182-P [DOI] [PubMed] [Google Scholar]
- Bendixen, A. , SanMiguel, I. , & Schröger, E. (2012). Early electrophysiological indicators for predictive processing in audition: A review. International Journal of Psychophysiology, 83(2), 120–131. 10.1016/j.ijpsycho.2011.08.003 [DOI] [PubMed] [Google Scholar]
- Besle, J. , & Giard, M. H. (2004). Interest and validity of the additive model in electrophysiological studies of multisensory interactions. Cognitive Processing, 5(3), 189–192. 10.1007/s10339-004-0026-y [DOI] [Google Scholar]
- Crowley, K. E. , & Colrain, I. M. (2004). A review of the evidence for P2 being an independent component process: Age, sleep and modality. Clinical Neurophysiology, 115(4), 732–744. 10.1016/j.clinph.2003.11.021 [DOI] [PubMed] [Google Scholar]
- Friston, K. J. (2005). A theory of cortical responses. Philosophical Transactions of the Royal Society B: Biological Sciences, 360(1456), 815–836. 10.1098/rstb.2005.1622 [DOI] [PMC free article] [PubMed] [Google Scholar]
- Gratton, G. , Coles, M. G. H. , & Donchin, E. (1983). A new method for off‐line removal of ocular artifact. Electroencephalography and Clinical Neurophysiology, 55(4), 468–484. 10.1016/0013-4694(83)90135-9 [DOI] [PubMed] [Google Scholar]
- Holm, S. (1979). A simple sequentially rejective multiple test procedure. Scandinavian Journal of Statistics, 6(2), 65–70. [Google Scholar]
- Horváth, J. (2013). Attenuation of auditory ERPs to action‐sound coincidences is not explained by voluntary allocation of attention. Psychophysiology, 50(3), 266–273. 10.1111/psyp.12009 [DOI] [PubMed] [Google Scholar]
- Horváth, J. , Maess, B. , Baess, P. , & Tóth, A. (2012). Action‐sound coincidences suppress evoked responses of the human auditory cortex in EEG and MEG. Journal of Cognitive Neuroscience, 24(9), 1919–1931. 10.1162/jocn_a_00215 [DOI] [PubMed] [Google Scholar]
- Horváth, J. , Schilberg, L. , & Thomson, J. (2013). Does sight predominate sound? Electrophysiological evidence for multisensory mismatch negativity correlation. Neurophysiology, 45(5–6), 459–467. 10.1007/s11062-013-9394-1 [DOI] [Google Scholar]
- Horváth, J. , & Winkler, I. (2010). Distraction in a continuous‐stimulation detection task. Biological Psychology, 83(3), 229–238. 10.1016/j.biopsycho.2010.01.004 [DOI] [PubMed] [Google Scholar]
- Hughes, G. , Desantis, A. , & Waszak, F. (2013). Attenuation of auditory N1 results from identity‐specific action‐effect prediction. European Journal of Neuroscience, 37(7), 1152–1158. 10.1111/ejn.12120 [DOI] [PubMed] [Google Scholar]
- Huhn, Z. , Szirtes, G. , Lorincz, A. , & Csépe, V. (2009). Perception based method for the investigation of audiovisual integration of speech. Neuroscience Letters, 465(3), 204–209. 10.1016/j.neulet.2009.08.077 [DOI] [PubMed] [Google Scholar]
- Klucharev, V. , Mottonen, R. , Sams, M. , Möttönen, R. , & Sams, M. (2003). Electrophysiological indicators of phonetic and non‐phonetic multisensory interactions during audiovisual speech perception. Cognitive Brain Research, 18(1), 65–75. 10.1016/j.cogbrainres.2003.09.004 [DOI] [PubMed] [Google Scholar]
- Knolle, F. , Schröger, E. , Baess, P. , & Kotz, S. A. (2012). The cerebellum generates motor‐to‐auditory predictions: ERP lesion evidence. Journal of Cognitive Neuroscience, 24(3), 698–706. 10.1162/jocn_a_00167 [DOI] [PubMed] [Google Scholar]
- Knolle, F. , Schröger, E. , & Kotz, S. A. (2013). Prediction errors in self‐ and externally‐generated deviants. Biological Psychology, 92(2), 410–416. 10.1016/j.biopsycho.2012.11.017 [DOI] [PubMed] [Google Scholar]
- Lange, K. , Rösler, F. , & Röder, B. (2003). Early processing stages are modulated when auditory stimuli are presented at an attended moment in time: An event‐related potential study. Psychophysiology, 40(5), 806–817. 10.1111/1469-8986.00081 [DOI] [PubMed] [Google Scholar]
- McCarthy, G. , & Wood, C. C. (1985). Scalp distributions of event‐related potentials: An ambiguity associated with analysis of variance models. Electroencephalography and Clinical Neurophysiology, 61(3), S226–S22. 10.1016/0013-4694(85)90858-2 [DOI] [PubMed] [Google Scholar]
- Näätänen, R. , Gaillard, A. W. K. , & Mäntysalo, S. (1978). Early selective‐attention effect on evoked potential reinterpreted. Acta Psychologica, 42(4), 313–329. 10.1016/0001-6918(78)90006-9 [DOI] [PubMed] [Google Scholar]
- Näätänen, R. , Paavilainen, P. , Rinne, T. , & Alho, K. (2007). The mismatch negativity (MMN) in basic research of central auditory processing: A review. Clinical Neurophysiology, 118(12), 2544–2590. 10.1016/j.clinph.2007.04.026 [DOI] [PubMed] [Google Scholar]
- Näätänen, R. , & Picton, T. (1987). The N1 wave of the human electric and magnetic response to sound: A review and an analysis of the component structure. Psychophysiology, 24(4), 375–425. 10.1111/j.1469-8986.1987.tb00311.x [DOI] [PubMed] [Google Scholar]
- Otte, R. A. , Winkler, I. , Braeken, M. A. K. A. , Stekelenburg, J. J. , van der Stelt, O. , & Van den Bergh, B. R. H. (2013). Detecting violations of temporal regularities in waking and sleeping two‐month‐old infants. Biological Psychology, 92(2), 315–322. 10.1016/j.biopsycho.2012.09.009 [DOI] [PubMed] [Google Scholar]
- Sanmiguel, I. , Todd, J. , & Schröger, E. (2013). Sensory suppression effects to self‐initiated sounds reflect the attenuation of the unspecific N1 component of the auditory ERP. Psychophysiology, 50(4), 334–343. 10.1111/psyp.12024 [DOI] [PubMed] [Google Scholar]
- Stekelenburg, J. J. , & Vroomen, J. (2007). Neural correlates of multisensory integration of ecologically valid audiovisual events. Journal of Cognitive Neuroscience, 19(12), 1964–1973. 10.1162/jocn.2007.19.12.1964 [DOI] [PubMed] [Google Scholar]
- Stekelenburg, J. J. , & Vroomen, J. (2012). Electrophysiological correlates of predictive coding of auditory location in the perception of natural audiovisual events. Frontiers in Integrative Neuroscience, 6, 26 10.3389/fnint.2012.00026 [DOI] [PMC free article] [PubMed] [Google Scholar]
- Teder‐Salejarvi, W. A. , McDonald, J. J. , Di Russo, F. , & Hillyard, S. A. (2002). An analysis of audio‐visual crossmodal integration by means of event‐related potential (ERP) recordings. Brain Research. Cognitive Brain Research, 14(1), 106–114. Retrieved from http://www.ncbi.nlm.nih.gov/pubmed/12063134. 10.1016/S0926-6410(02)00065-4 [DOI] [PubMed] [Google Scholar]
- Tonnquist‐Uhlen, I. , Ponton, C. W. , Eggermont, J. J. , Kwong, B. , & Don, M. (2003). Maturation of human central auditory system activity: The T‐complex. Clinical Neurophysiology, 114(4), 685–701. 10.1016/S1388-2457(03)00005-1 [DOI] [PubMed] [Google Scholar]
- van Laarhoven, T. , Stekelenburg, J. J. , & Vroomen, J. (2017). Temporal and identity prediction in visual‐auditory events: Electrophysiological evidence from stimulus omissions. Brain Research, 1661, 79–87. 10.1016/j.brainres.2017.02.014 [DOI] [PubMed] [Google Scholar]
- van Wassenhove, V. , Grant, K. W. , & Poeppel, D. (2005). Visual speech speeds up the neural processing of auditory speech. Proceedings of the National Academy of Sciences of the United States of America, 102(4), 1181–1186. 10.1073/pnas.0408949102 [DOI] [PMC free article] [PubMed] [Google Scholar]
- Vroomen, J. , Keetels, M. , De Gelder, B. , & Bertelson, P. (2004). Recalibration of temporal order perception by exposure to audio‐visual asynchrony. Brain Research. Cognitive Brain Research, 22(1), 32–35. 10.1016/j.cogbrainres.2004.07.003 [DOI] [PubMed] [Google Scholar]
- Vroomen, J. , & Stekelenburg, J. J. (2010). Visual anticipatory information modulates multisensory interactions of artificial audiovisual stimuli. Journal of Cognitive Neuroscience, 22(7), 1583–1596. 10.1162/jocn.2009.21308 [DOI] [PubMed] [Google Scholar]
- Woods, D. L. (1995). The component structure of the N1 wave of the human auditory evoked potential. Electroencephalography and Clinical Neurophysiology. Supplement, 44, 102–109. [PubMed] [Google Scholar]