Abstract
Gene network transitions in embryos and other fate-changing contexts involve combinations of transcription factors. A subset of fate-changing transcription factors act as pioneers; they scan and target nucleosomal DNA and initiate cooperative events that can open the local chromatin. But a gap has remained in understanding how molecular interactions with the nucleosome contribute to the chromatin-opening phenomenon. Here we identified a short alpha-helical region, conserved among FOXA pioneer factors, that interacts with core histones and contributes to chromatin opening in vitro. The same domain is involved in chromatin opening in early mouse embryos for normal development. Thus, local opening of chromatin by interactions between pioneer factors and core histones promotes genetic programming.
Cell fate changes during embryonic development, stem cell differentiation, regeneration, and directed reprogramming with ectopic transcription factors all require new genetic networks to be activated. The new networks include silent genes that may be antagonistic to the starting cell type and thus reside in chromatin that is inaccessible to many transcription factors and the transcriptional machinery. Such DNA inaccessibility can be conferred by nucleosome occupancy with a minimum of exposed DNA, the presence of linker histones, and different types of repressed chromatin features1-4. Indeed, regulatory DNA, such as enhancers, inherently promote nucleosome formation5-7, underscoring the question of how the nucleosome barrier is overcome. Among each set of transcription factors required for a given cell fate change, it has become clear that a subset of the factors has the inherent biochemical property of targeting a DNA binding motif on a nucleosome, in vitro and in vivo, and hence have been termed pioneer transcription factors8-12. Here we investigate the important next step after nucleosome targeting—the mechanism by which local chromatin is opened to enable cooperative events for new genetic networks.
FOXA transcription factors, including the paradigm pioneer factors FOXA1 and FOXA2, are evolutionarily conserved and regulate diverse biological processes during embryonic development and adult life13. In mammalian embryos, Foxa2 is the first FOXA family member to be expressed in the endoderm, primitive streak, node, and notochord, followed by Foxa1 and then Foxa3, with partially overlapping expression patterns in developing and mature tissues14-16. The earlier expression of Foxa2 than Foxa1 and Foxa3 is reflected in the more severe phenotypes in mice lacking Foxa2, resulting in embryonic lethality17,18. The evolutionary significance of FOXA proteins is underscored by the C. elegans PHA4 recognizing the same DNA motif as mammalian FOXA factors, binding nucleosomes, and being important for foregut development19,20.
FOXA1 can bind its target motif on a recombinant mononucleosome21 and on a central nucleosome within a recombinant nucleosome array8,22. Such arrays are phased by repeats of 5S gene sequences23 that flank a central “N1” sequence from the Alb gene, where a naturally occurring nucleosome is targeted by FOXA proteins in liver cells24,25. Nucleosome arrays bound by linker histone H1 generate compact structures that resemble chromatin fragments from cells26. FOXA1 binding to the N1 nucleosome on an H1-compacted array leads to the exposure of the underlying nucleosome, as seen by DNase and restriction enzyme sensitivity, without apparent nucleosome displacement8. Induced hypersensitivity on chromatin in vitro occurs in the absence of an ATP-dependent nucleosome remodeler, and indeed nucleosome remodelers have been reported to be refractory to linker histone-compacted chromatin27-29. In addition to its central DNA binding domain30, FOXA proteins contain an N-terminal trans-activation domain31 and two short amino acid segments in the C-terminus, designated CRII and CRIII, that are conserved in FOXA factors from humans to Drosophila32 and contribute to transcriptional activity33. The C-terminal region of FOXA proteins was found to bind histone octamers and is necessary for chromatin opening in vitro8. In vivo, pioneer factor binding can lead to opening of the local chromatin, in some cases apparently displacing a nucleosome34 or displacing linker histone, but retaining nucleosomes25,35,36. Yet in vivo, FOXA binding to regulatory sequences occurs with diverse other factors that could recruit remodelers and chromatin modifying enzymes. Thus, it is unclear whether FOXA proteins, after targeting a nucleosome in vivo, are dependent upon the same chromatin opening activity that has been defined on nucleosome array templates in vitro.
Here we investigate the basis for the FOXA1-core histone interaction. We demonstrate a chromatin-opening activity of an α-helical domain within the C-terminal region, and we assess the function of the α-helical domain in chromatin opening and function in mouse embryogenesis. The results show that the mechanism for generating chromatin accessibility in vitro is intrinsic to a pioneer factor’s ability to enable chromatin accessibility in development for proper cell fate control.
Results
Core histones crosslink to an α-helical region within the FOXA1 C-terminal domain.
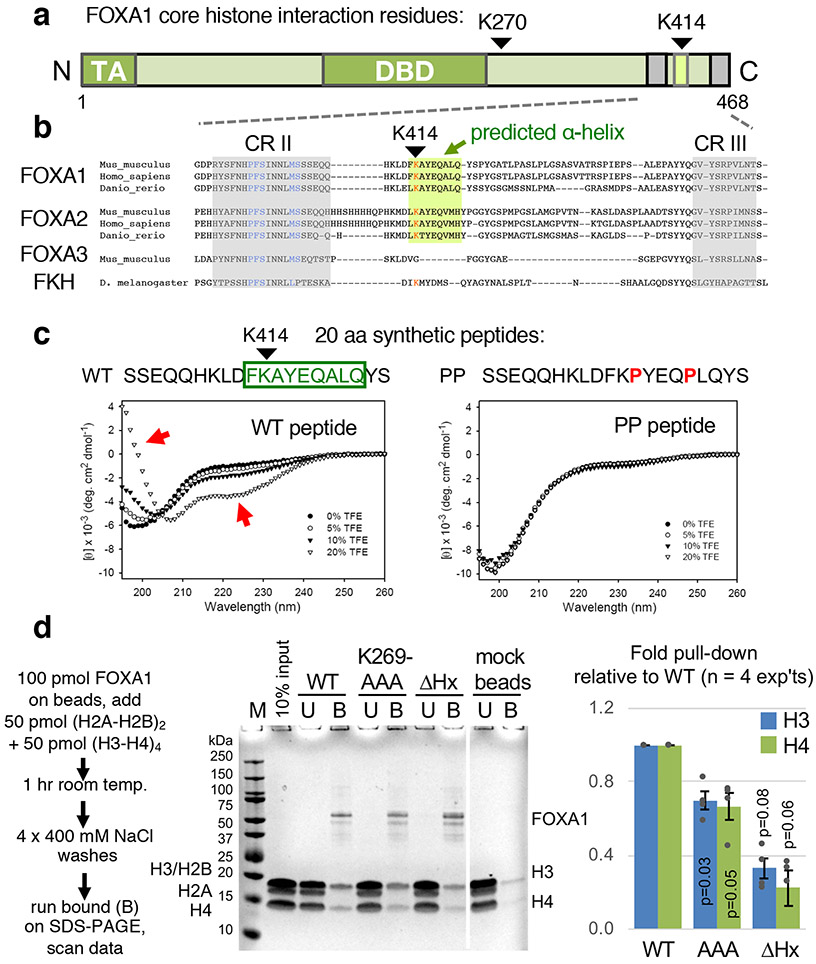
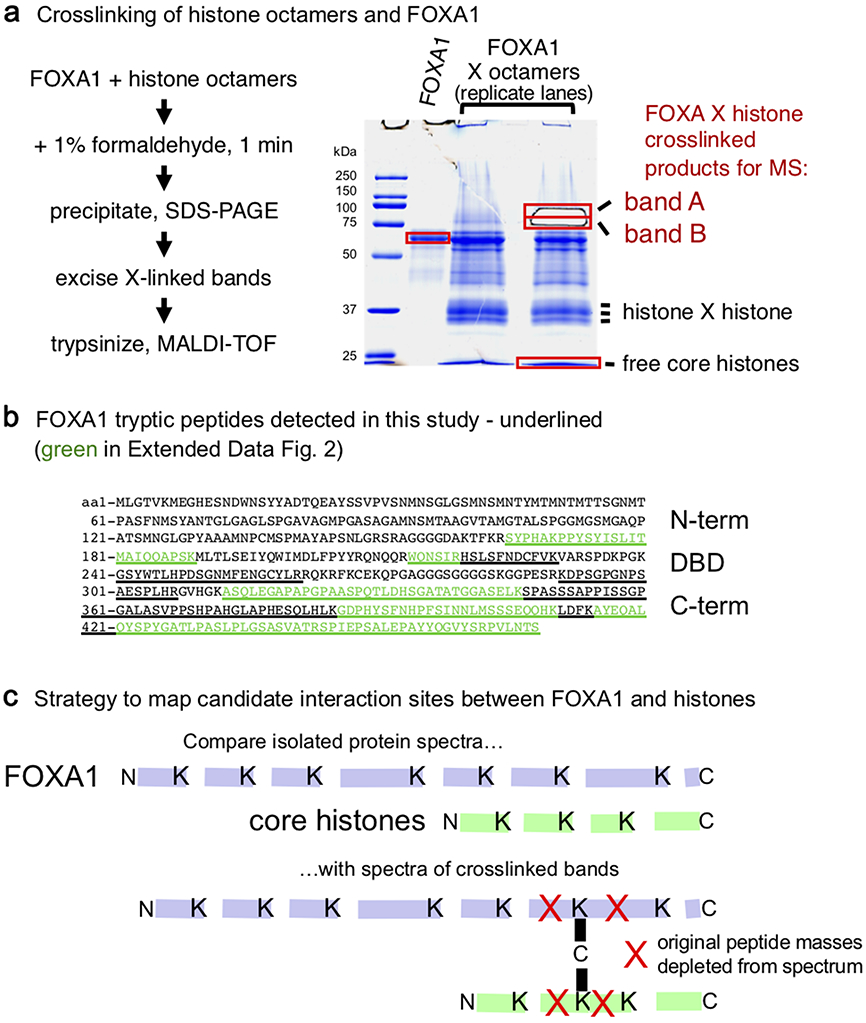
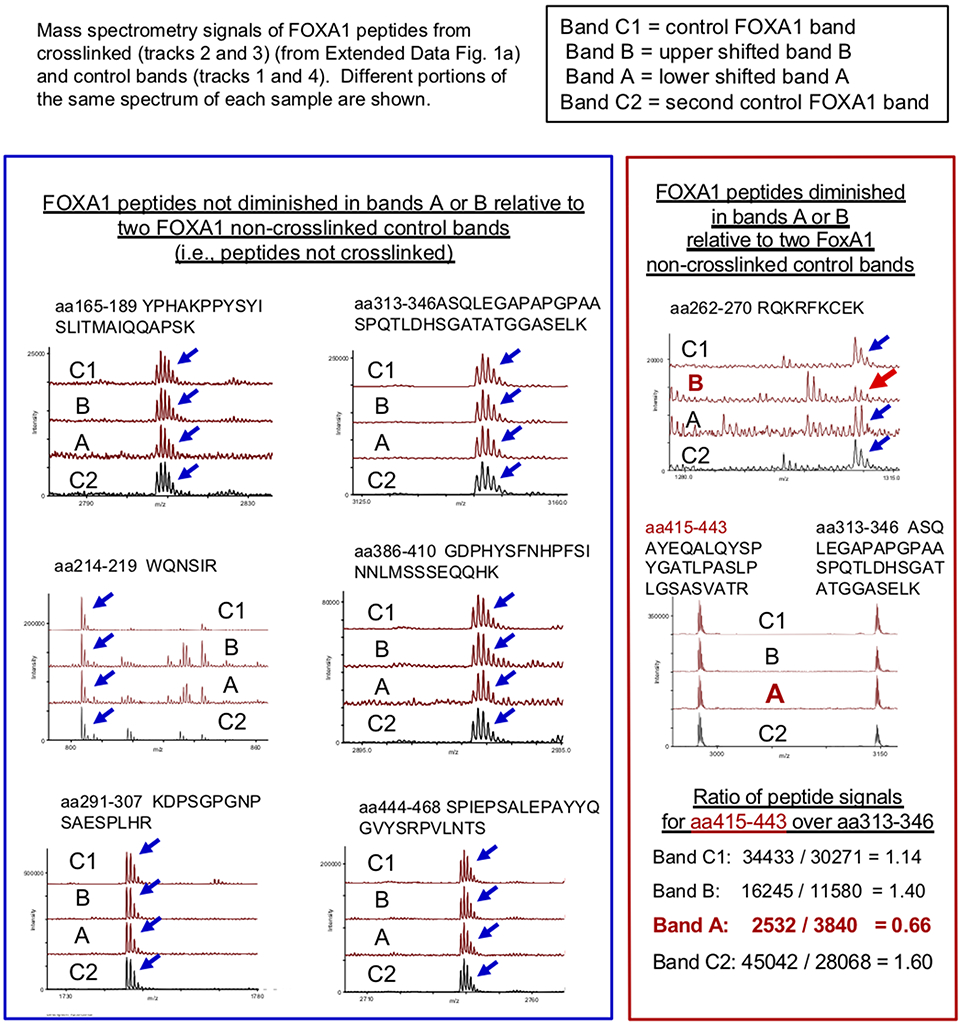
To understand how FOXA1 opens chromatin, we sought to map which FOXA1 protein sites can be crosslinked to core histones. We incubated purified FOXA1 protein with recombinant histone octamers in the presence of formaldehyde, a lysine crosslinker. The crosslinked material was applied to SDS-PAGE, where in addition to the parent FOXA1 and core histone bands, we observed two protein bands, designated A and B, with an approximate mass expected for FOXA1 crosslinked to one or another core histone (Extended Data Fig. 1a,b). Bands A and B were excised from the gel, along with the control FOXA1 and core histone bands, and subjected to trypsinization and mass spectrometry. Bands A and B each contained FOXA1 and core histones; here we focus on FOXA1 contact sites. Formaldehyde crosslinking blocks tryptic cleavage at lysines and thus loss of a tryptic cleavage product can indicate a site of crosslinking. Comparison of FOXA1 peptide masses in the crosslinked bands to two control samples of non-crosslinked FOXA1 revealed one peptide in band A and another peptide in band B that were reduced in abundance compared to the controls (Extended Data Figs. 1c and 2). The strategy revealed two possible FOXA1 interacting sites with core histones, at lysine residues K270 and K414 (Fig. 1a). K270 is just downstream of the DNA binding domain37. K414 is between FOXA conserved regions II (CRII) and III (CRIII), originally defined by the few FOXA homologs sequenced at the time33, and within the C-terminal region previously shown to be necessary for compacted chromatin opening in vitro8.
Figure 1 ∣. A FOXA site of core histone interaction is located in an α-helical structure of the C-terminal domain.
a, Domain structure of FOXA1 and amino acid positions of crosslink sites with core histones. DBD, DNA-binding domain; TA, transactivation domain. b, Amino acid sequences of FOXA family members, highlighting conserved region II (CR II), predicted α-helix, and conserved region III (CR III). c, Far-UV CD spectra of wild-type peptide (WT) and double proline-containing control peptide (PP), in unbuffered aqueous solutions (pH 8.2) containing 0%, 5%, 10%, and 20% TFE, recorded at 20 °C. Each spectral display is an average of five scans. Arrows indicate spectral changes indicative of α-helicity. d, FOXA1 wild-type (WT) protein and mutants bound to Sepharose beads in a pulldown assay to assess binding to a mixture of histone dimers (H2A-H2B) and tetramers (H3-H4). All lanes shown were on the same gel, with the last two lanes in place of other lanes that were cropped out. The full blot is presented in the Source Data files. The bar graph represents mean +/− s.e.m. of four replicates. P values in the bar graph are from a one-sided paired t-test, comparing the ratio of the core histones H3/H4 and H2A/H2B to the recovered amount of FOXA1 in the same lane (n = 4 experiments).
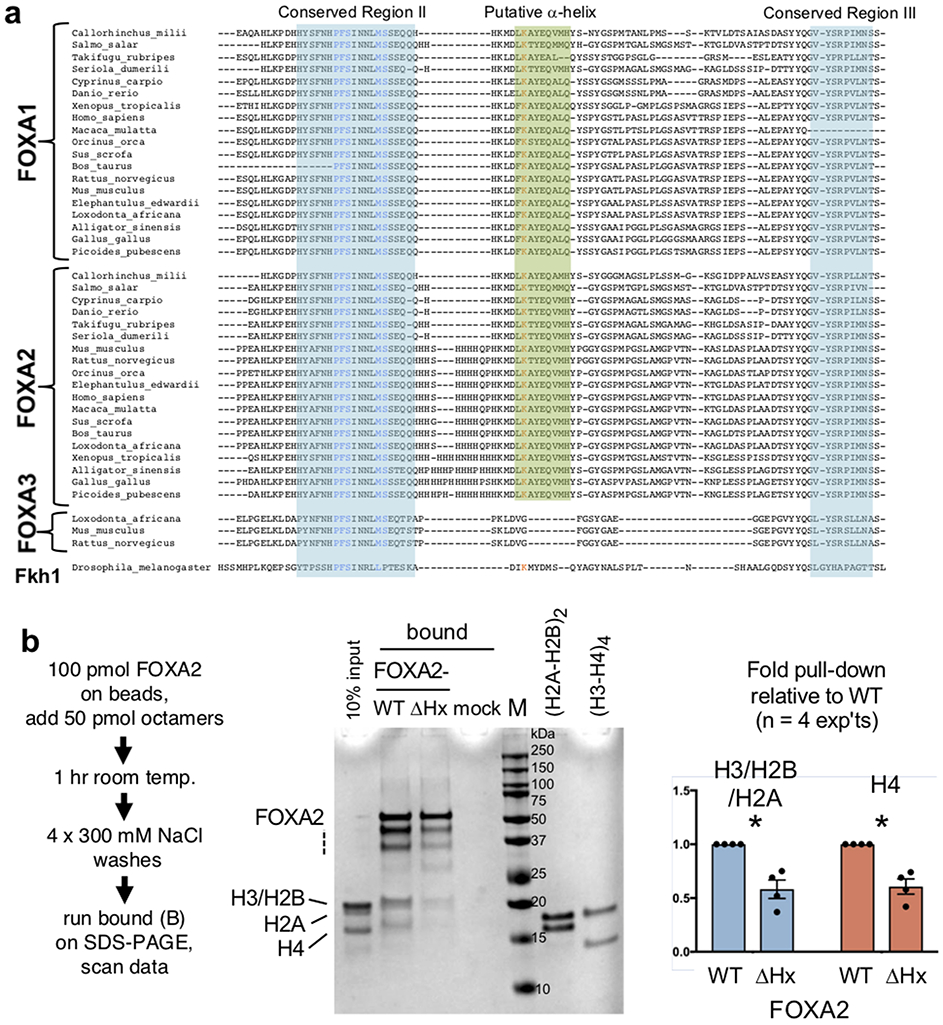
We compared the FOXA amino acid sequence from 10 residues before CRII to the end of the protein for all eumetazoan FOXA homologs. FOXA1 and FOXA2 sequences from 226 and 194 species, respectively, and 33 available sequences for FOXA3, along with the original Drosophila Forkhead protein, were clustered, and representatives of clades are shown in Extended Data Figure 3. The results revealed an additional 12 amino acid conserved domain among FOXA1 and FOXA2 homologs, but not in FOXA3 or Forkhead, immediately downstream of CRII (summarized in Fig. 1b). The new conserved domain is predicted to have 9 amino acids of an amphipathic α-helical structure. Given the proximity of the putative α-helical region to CRII, to test whether the domain can form an α−helix, we synthesized a 20 amino acid peptide spanning the region and into CRII, and a peptide with a double proline mutant (PP) that should disrupt an α−helical structure (Fig. 1c). Upon assessing the peptides by circular dichroism, in the presence of the co-solvent TFE, the wild-type FOXA1 peptide exhibited a large increase in ellipticity below 200 nm and a growing negative band in the 215-230 nm range, indicating an α−helical content; such was not observed for the PP mutant (Fig. 1c, red arrows, left panel).
We tested the role of the K270 and K414 regions for histone interactions by generating FOXA1-K269AAA, containing a triple alanine substitution around K270, and FOXA1-ΔHx, containing a 10 amino acid deletion that spans the alpha helical domain (Fig. 2a). Purified recombinant wild-type and mutant FOXA1 proteins were attached to beads and tested for their ability to pull down a mixture of H2A/H2B dimers and H3/H4 tetramers. In four experiments, FOXA1-K269AAA was about two-thirds as effective as wild-type FOXA1 in pulling down histones H3 and H4, and FOXA1-ΔHx was about one-third as effective (Fig. 1d). Testing the ability to interact with histone octamers, we made the comparable FOXA2-ΔHx allele and found that it was half as effective as wild-type FOXA2 in retaining octamers (Extended Data Fig. 3b). We conclude that the conserved FOXA histone α−helical domain promotes interactions with core histones and focused on its chromatin opening properties.
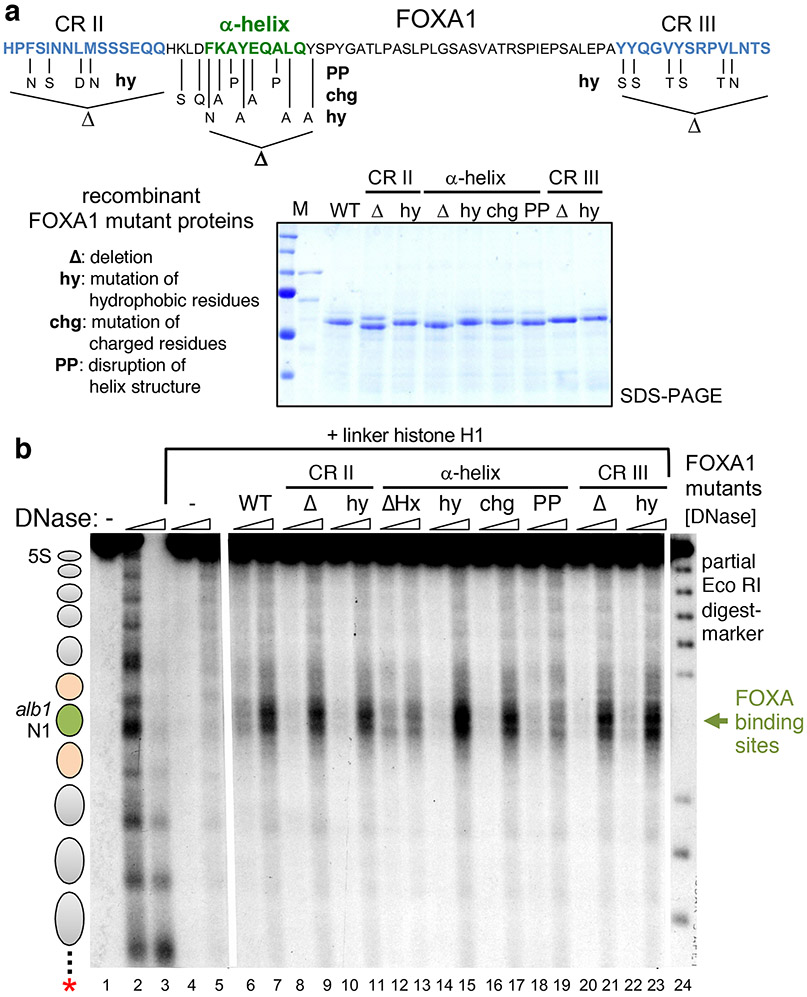
Figure 2 ∣. FOXA α-helix is required for efficient chromatin opening in vitro.
a, C-terminal sequence of FOXA1 with conserved regions highlighted, amino acid changes for designated mutations, and SDS-PAGE analysis of recombinant proteins used for chromatin binding assays. b, DNase I hypersensitive assay of recombinants FOXA1 (wild-type and mutants) to end-labeled nucleosome arrays compacted by linker histone H1. Lanes 2 and 3 exhibit canonical linker sequence cleavage pattern of the nucleosome arrays, lanes 4 and 5 exhibit the extent of compaction and inaccessibility caused by linker histone binding, and lanes 6 and 7 show the selective accessibility to DNase elicited by FOXA1 binding to two target sequences on the central Alb N1 nucleosome. Lanes 8-23, patterns elicited by FOXA1 protein mutations; lane 24, marker. All lanes shown were on the same gel, with lanes between 5 and 6, and 23 and 24, cropped out. The full gel and blot images are presented in the Source Data files.
FOXA α-helical domain is required for chromatin opening in vitro.
To assess the relative functionality of the conserved CRII, α-helix, and CRIII domains in the FOXA1 C-terminal region, we generated: (i) clusters of mutations predicted to perturb hydrophobicity in each domain (hy); (ii) deletions of each domain (Δ), and; (iii) mutations predicted to alter charge (chg) and α-helical structure (double proline mutant: PP) (Fig. 2a). Recombinant mutant FOXA1 proteins were compared to the wild-type protein for their ability to generate a DNase hypersensitive site at two FOXA1 binding sites in the middle of a linker histone-compacted nucleosome array. As seen previously8, DNase cleavage of the nucleosome arrays reveals the expected nucleosome repeat pattern across the 2.7-kb chromatin fragment (Fig. 2b, lanes 1-3). Linker H1 addition dramatically suppresses DNase digestion across the template (Fig. 2b, lanes 4 and 5), reflecting chromatin inaccessibility. Purified FOXA1 protein robustly generated hypersensitivity at its target sites in the H1-compacted chromatin, independent of other proteins or nucleosome remodelers (Fig. 2b, lanes 6 and 7). Notably, all of the mutant FOXA1 proteins generated similar hypersensitivity except for the deletion or double proline mutant of the α-helical domain, which were much weaker (Fig. 2b, lanes 8-23; see lanes 13 and 19). The results indicate that the histone-interacting FOXA α-helical domain is necessary for opening compacted chromatin in vitro.
FOXA α-helical region contributes to target gene activation in cellular chromatin.
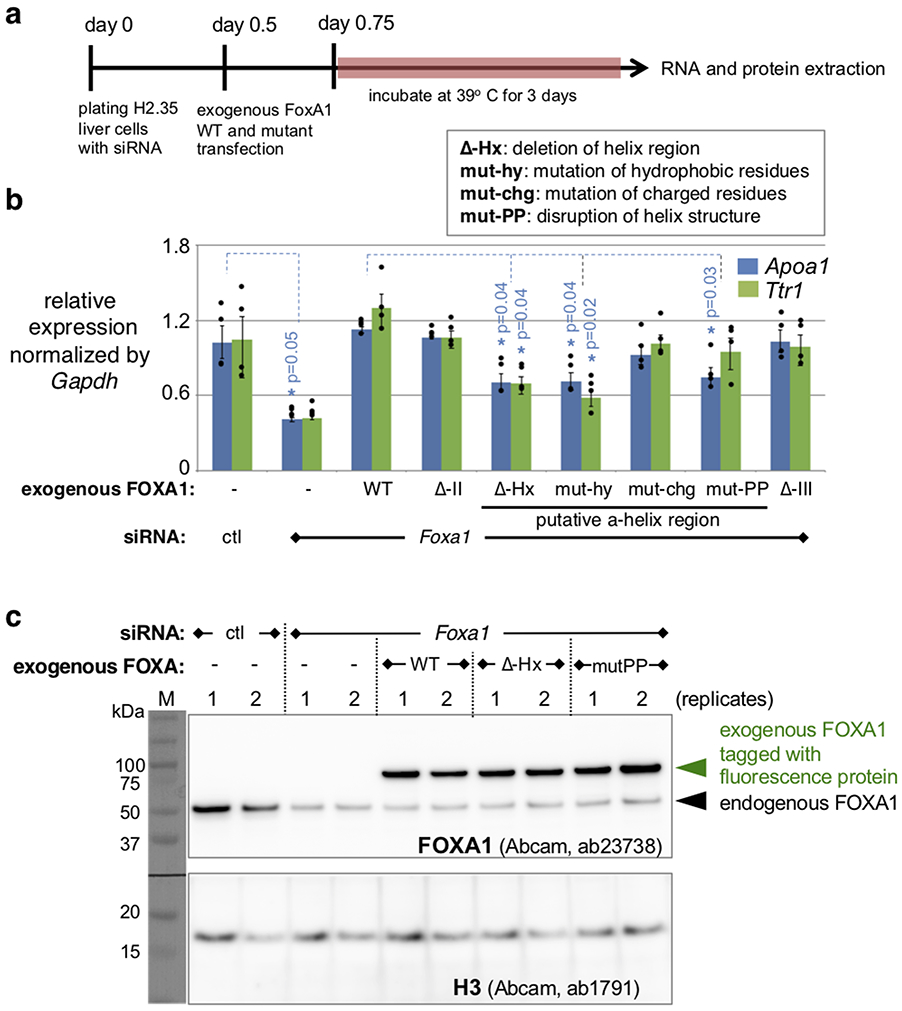
We next investigated whether the FOXA1 C-terminal domains are necessary for target gene activation in cellular chromatin using the mouse liver cell line H2.3538. We knocked down endogenous FOXA1 expression with siRNAs and observed about a 60% decrease in expression of the endogenous FOXA target genes Apoa1 and Ttr1; additional transduction of wild-type FOXA1 restored Apoa1 and Ttr1 expression (Extended Data Fig. 4a,b). Transduction of the FOXA1 mutants into the knockdown cells revealed that deletions of CRII or CRIII allowed restoration of Apoa1 and Ttr1 expression, but mutation or deletion of the α-helical region significantly impaired the ability of FOXA1 to induce the endogenous target genes (Extended Data Fig. 4b). The exogenous FOXA1 protein levels of the phenotypic mutants were comparable to wild-type (Extended Data Fig. 4c), demonstrating the importance of the histone-interacting, α-helical domain in activating genes in cellular chromatin.
Deletion of the FOXA2 α-helical region in mice impairs embryonic development.
Foxa2 is the first member of the FOXA family to be expressed during embryonic development, starting in the anterior primitive streak around embryonic day 6 (E6), and persisting in node, head process/notochord, visceral and definitive endoderm and their derivatives, as well as in the ventral region of the neural tube (floor plate) and the ventral midbrain14-16. Homozygous Foxa2 null mutants were generated by deleting the coding sequence or 3’-most exon, which contains the DNA-binding and C-terminal domains17,18. Both null mutant embryos showed variable penetrance in early stages and lethality between E11 and E13.
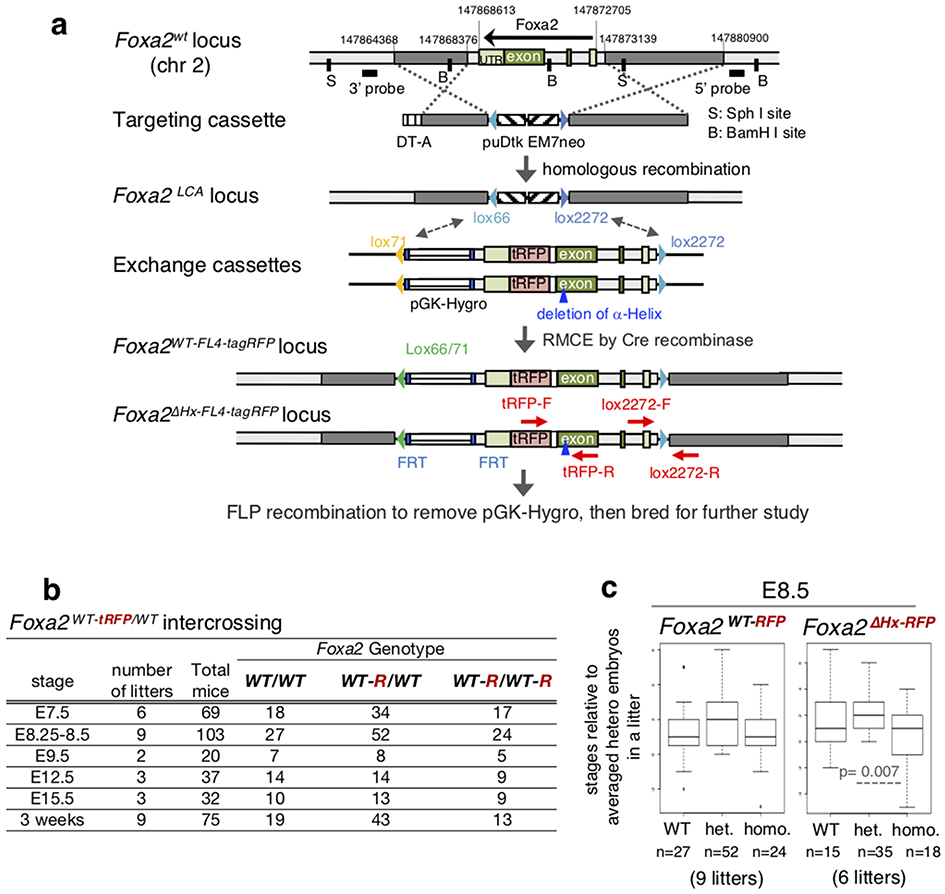
To address whether the α-helical region of FOXA is involved in chromatin opening in embryonic development, we utilized recombinase-mediated cassette exchange (RMCE)39 to modify the Foxa2 genomic locus. For control mice, we inserted a flexible linker40 and tagRFP downstream of the wild-type Foxa2 coding sequence (Extended Data Fig. 5a) to allow FOXA2-positive cells to be isolated by fluorescence activated cell sorting (FACS). All 13 homozygous Foxa2-WT-tagRFP (Foxa2WT-tagRFP/WT-tagRFP) mice, recovered from 75 three-week old mice from heterozygote intercrossings (Extended Data Fig. 5b), were viable and fertile, exhibiting the minor phenotype of a hopping gait.
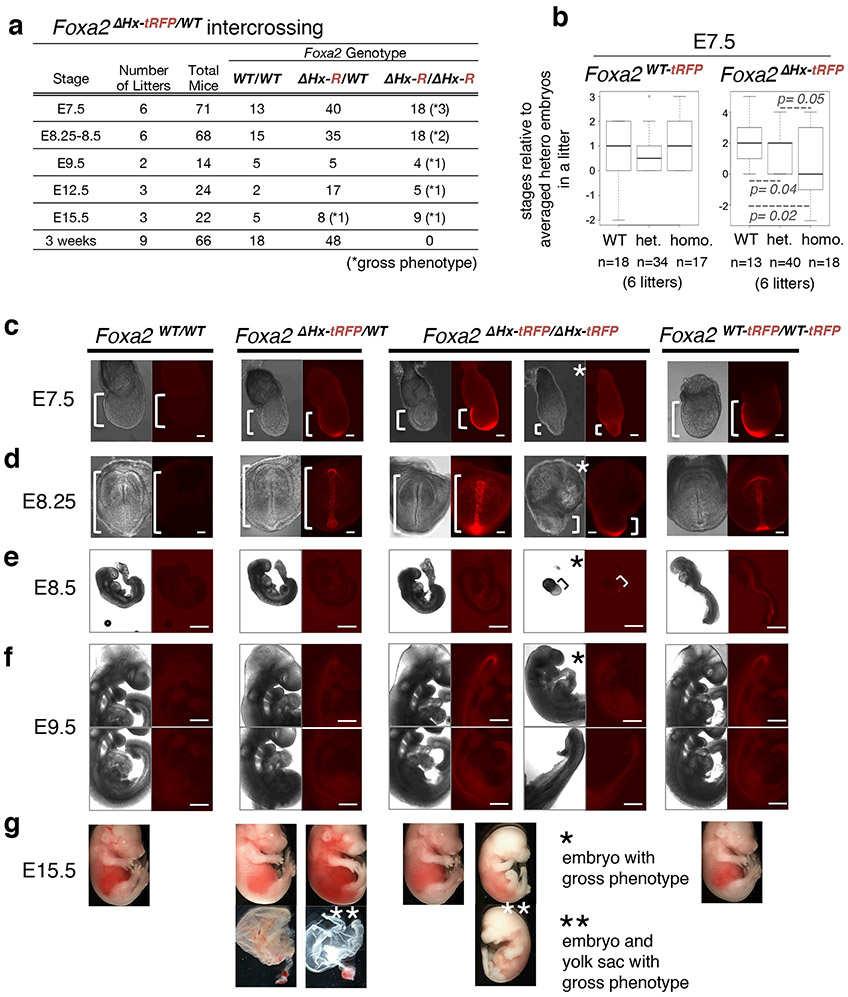
For mutant mice, we generated a ΔHx allele by recombineering into the Foxa2-tagRFP allele (Fig. 2a and Extended Data Fig. 5a). The heterozygous Foxa2-ΔHx-tagRFP (Foxa2ΔHx-tagRFP/WT) mice were viable and fertile. However, no homozygous Foxa2-ΔHx-tagRFP (Foxa2ΔHx-tagRFP/ΔHx-tagRFP) mice were recovered upon genotyping 66 three-week old mice from heterozygote intercrosses (Fig. 3a). At E7.5, approximately 17% of homozygous Foxa2-ΔHx-tagRFP embryos exhibited a gross phenotype, with a minute embryonic portion compared to their extraembryonic portion (Fig. 3c; embryonic portion is indicated by a bracket). The remaining mutant embryos from E7.5 to E8.5 showed developmental retardation compared to heterozygous or wild-type littermates (Fig. 3b and Extended Data Fig. 5c). At E8.25 to E8.5, by which time Foxa1 and Foxa3 have become active, about 10% of homozygous Foxa2-ΔHx-tagRFP embryos exhibited a gross phenotype, similar to that seen in the null mutants reported at that stage17,18. At E9.5, one out of four homozygous Foxa2-ΔHx-tagRFP embryos exhibited the gross phenotype of a small head and unfolded heart tube (Fig. 3f). At E12.5, one out of five homozygous Foxa2-ΔHx-tagRFP embryos were reduced in size and exhibited grossly abnormal head, abdomen morphology, and a kinked neural tube (Extended Data Fig. 6a), as in the null mutants17,18. At E15.5, one out of eight heterozygotes exhibited a bloody body and a yolk sac without any blood vessels, and one out of nine homozygous Foxa2-ΔHx-tagRFP embryos exhibited a smaller and paler body, grossly abnormal in the abdomen, and a yolk sac without any blood vessels (Fig. 3g). None of these phenotypes were seen in homozygous Foxa2-WT-tagRFP embryos (Fig. 3c-g and Extended Data Fig. 5b). Although further analysis is required to understand the variable penetrance of homozygous Foxa2-ΔHx embryonic phenotypes, loss of the α-helical region from the mouse Foxa2 genomic locus markedly affects embryonic development and leads to embryonic or perinatal lethality.
Figure 3 ∣. Deletion of the α-helix encoded by Foxa2 impairs mouse embryonic development.
a, Frequency of genotypes resulting from heterozygous intercrosses of Foxa2ΔHx-tRFP/WT at designated embryonic stages. Numbers of embryos with a gross phenotype are indicated in parentheses. b, Box and whisker plots show stage distribution at wild-type, heterozygous, and homozygous of Foxa2WT-tRFP and Foxa2ΔHx-tRFP embryos at E7.5. The bottom and top of the boxes correspond to the 25th and 75th percentiles, and the internal band is the 50th percentile (median). The ends of the whiskers represent 1.5 times the IQR. The point represents an outlier. The indicated P-values are obtained by one-sided Wilcoxon rank sum test. c-g, Bright field and fluorescence images of Foxa2WT /WT, Foxa2ΔHx-tRFP/WT, and Foxa2ΔHx-tRFP/ΔHx-tRFP littermates from heterozygous intercrosses and Foxa2WT-tRFP /WT-tRFP embryos as controls. White brackets indicate embryonic portion. Images are representative of the numbers of embryos indicated in a. Scale bar represents 200 μm.
Distinguishing FOXA2-positive endoderm and node/notochord/head process cells in the early embryo.
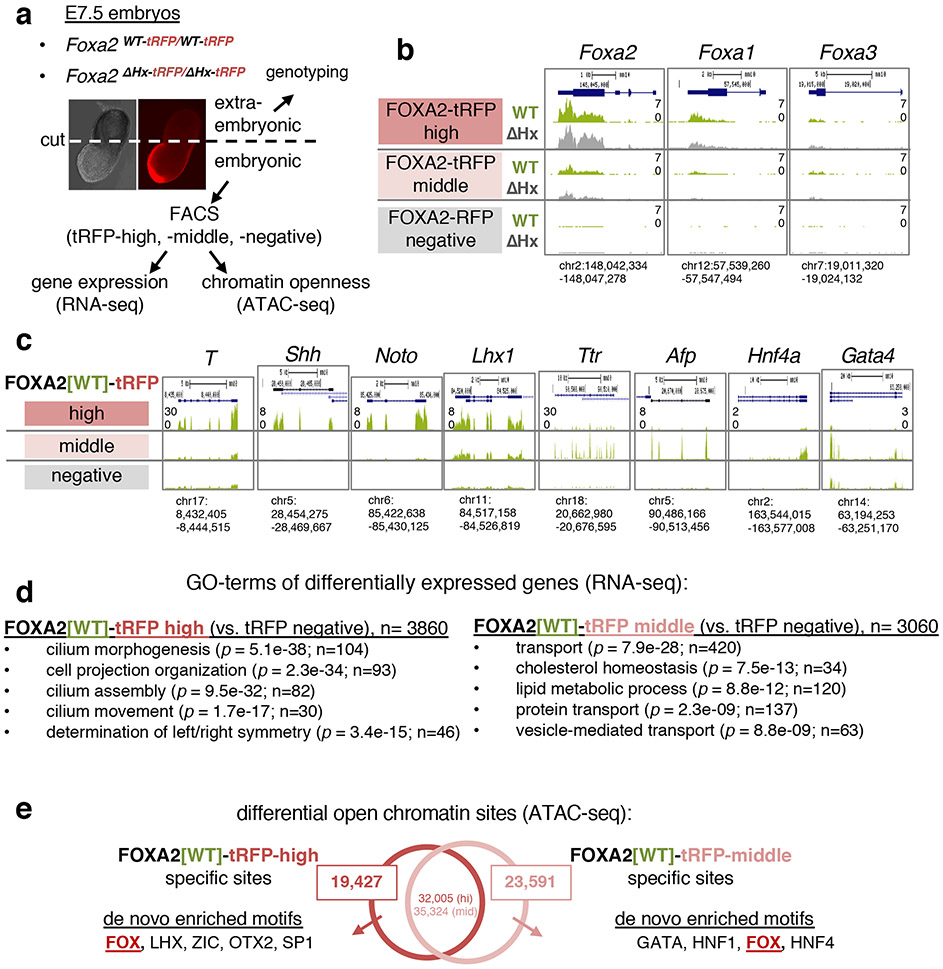
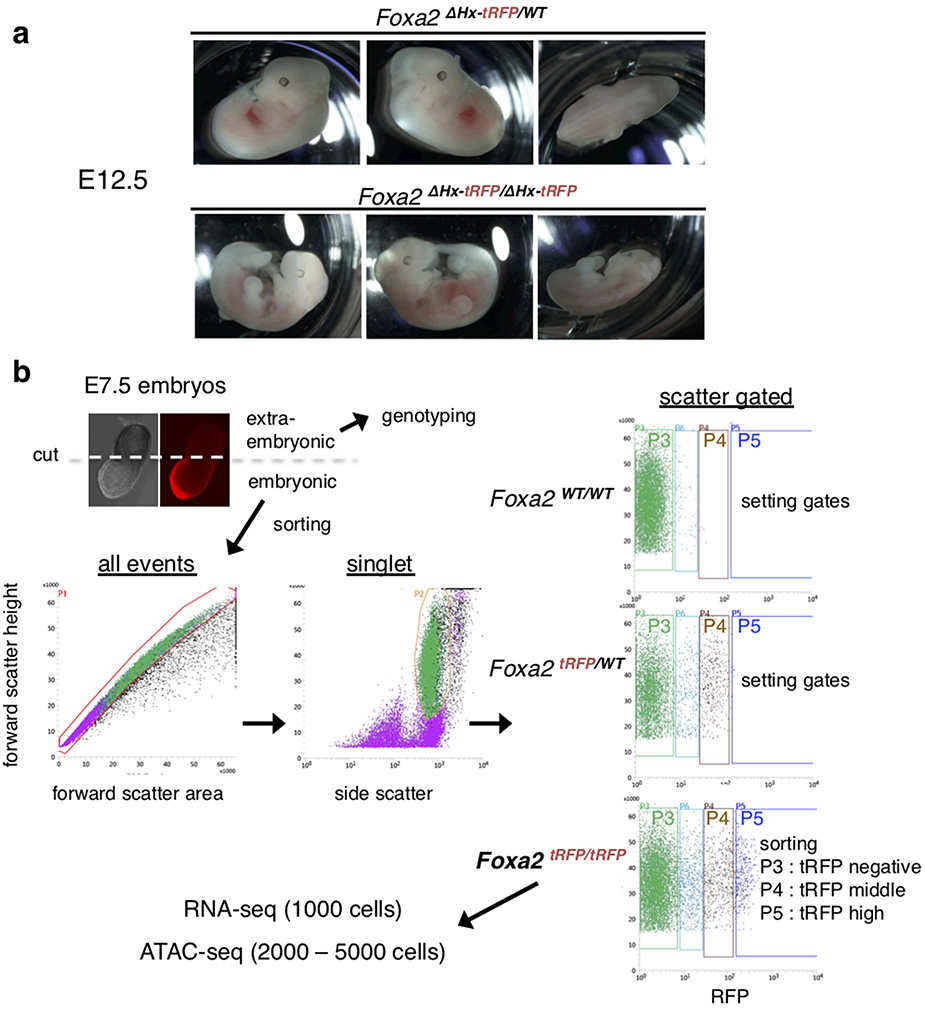
To analyze the earliest and direct effect of the Foxa2-ΔHx mutants in vivo, we focused on E7.5 embryos, when the expression of the other FOXA factors was still low. The expression of Foxa2-tagRFP in the endoderm and node/notochord/head process in E7.5 embryos (Fig. 4a) allowed us to independently assess the Foxa2-ΔHx allele in different cell contexts by RNA-seq and ATAC-seq. From E7.5 Foxa2-WT-tagRFP and Foxa2-ΔHx-tagRFP homozygous embryos, we isolated three RFP populations by FACS: “FOXA2-tagRFP-negative”; “FOXA2-tagRFP-middle,” which were gated to avoid autofluorescence and included up to the maximum tagRFP intensity of heterozygous (Foxa2tagRFP/WT) cells; and “FOXA2-tagRFP-high,” which exhibited a higher tagRFP signal than heterozygous cells (Fig. 4a and Extended Data Fig. 6b). RNA-seq confirmed the highest Foxa2 expression in FOXA2-tagRFP-high population, less in FOXA2-tagRFP-middle population, and little or no expression in FOXA2-tagRFP-negative population (Fig. 4b). In the FOXA2-tagRFP-high population, Foxa1 was modestly expressed and Foxa3 was expressed at a low level (Fig. 4b), which could partially compensate for a Foxa2-ΔHx effect. In the FOXA2-tagRFP-middle population, both Foxa1 and Foxa3 were expressed at low but detectable levels at E7.5 (Fig. 4b).
Figure 4 ∣. Identifying two different FOXA2-positive populations in E7.5 embryos.
a, Schematic of FACS isolation of FOXA2-positive cells in E7.5 embryos for RNA-seq and ATAC-seq. b, RNA-seq tracks of FOXA2-tRFP high, mid, and negative cells from E7.5 Foxa2WT-tRFP /WT-tRFP (green) and Foxa2ΔHx-tRFP/ΔHx-tRFP (gray) embryos at Foxa2, Foxa1, and Foxa3 loci. c, RNA-seq tracks of FOXA2-tRFP high, mid, and negative cells from E7.5 Foxa2WT-tRFP /WT-tRFP embryos at node/notochord and endodermal gene loci. d, GO term enrichment analysis of differentially expressed genes in FOXA2-tRFP-high cells and FOXA2-tRFP-middle cells compared with FOXA2-tRFP-negative cells (adjusted P-value < 0.1 by one-sided Wald test with FDR correction at 10%). P-value (by one-sided EASE/Fisher's exact test) and gene count are indicated in parentheses. n = 3 biologically independent RNA-seq datasets per group. e, De novo motif enrichment analysis at differential open chromatin sites (ATAC-seq peaks) in FOXA2-tRFP-high cells and FOXA2-tRFP-middle cells (see Extended Data Fig. 7a for statistics of the motif analysis). Numbers of peaks in the intersection represent the number of FOXA2-high or FOXA2-middle peaks with one or more overlaps to the other data set, allowing for one-to-many peak overlaps.
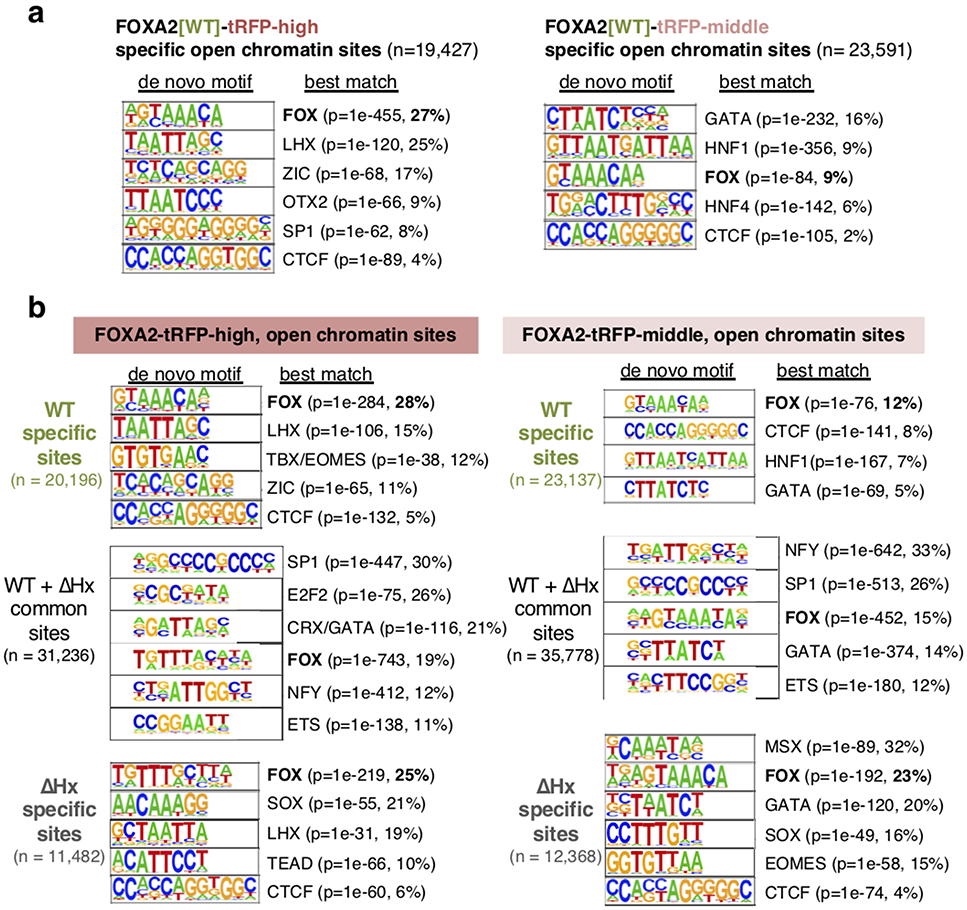
The FOXA2-high population exhibited node/notochord/head process-related gene expression (Fig. 4c for T, Shh, Noto, Lhx1) and cilium related Gene Ontology (GO) terms (Fig. 4d), consistent with the role of cilia in the node for establishing left-right asymmetry41. From ATAC-seq data, differential open chromatin sites in the FOXA2-high population, over FOXA2-negative cells, were enriched with de novo motifs for FOX and other node/notochord/head process-related transcription factors (LHX and OTX2) (Fig. 4e and Extended Data Fig. 8a). By contrast, the FOXA2-middle population was enriched for expression of endoderm transcription factors (Fig. 4c for Ttr, Afp, Hnf4a, Sox7, Gata4) and metabolism and transport related GO terms, consistent with endodermal function (Fig. 4d). Differential open chromatin sites in the FOXA2-middle population was enriched with a FOX de novo motif and motifs for other endoderm transcription factors (HNF1, GATA, HNF4) (Fig. 4e and Extended Data Fig. 8a). We conclude that, at E7.5, the FOXA2-high population was enriched for node/notochord/head process cells and FOXA2-middle population was enriched for endodermal cells.
Deletion of α-helical region of FOXA2 affects gene expression in E7.5 embryos.
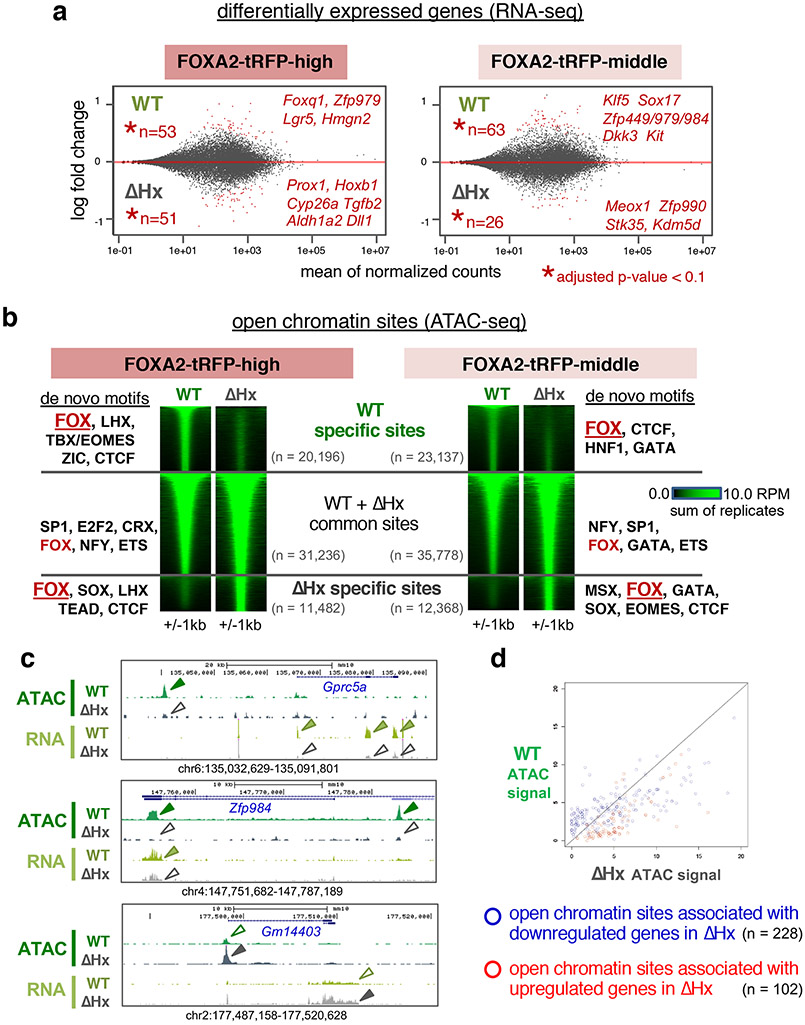
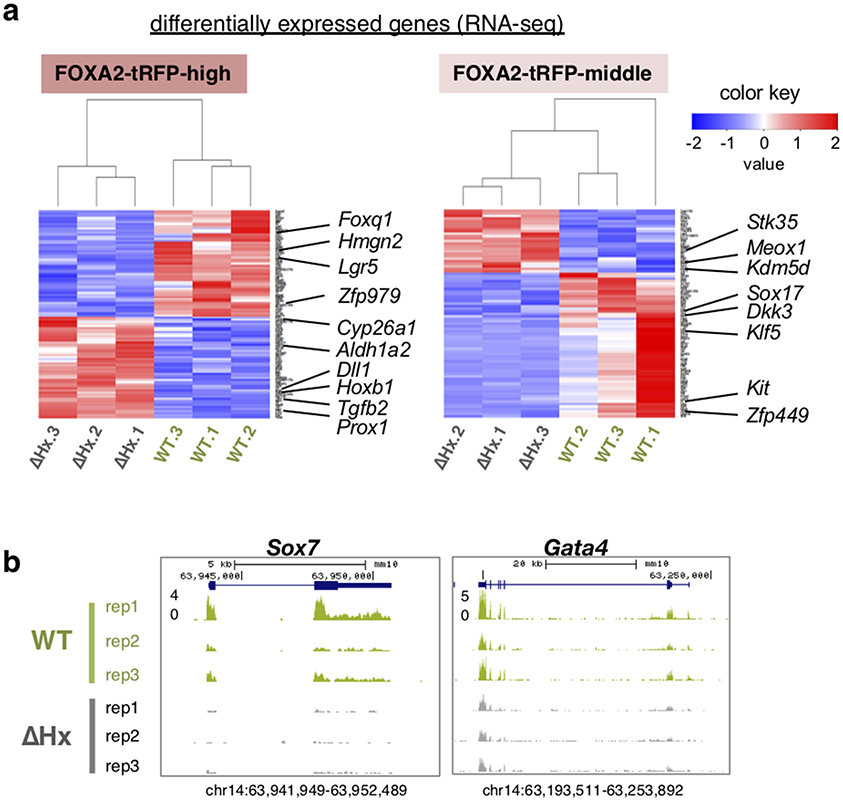
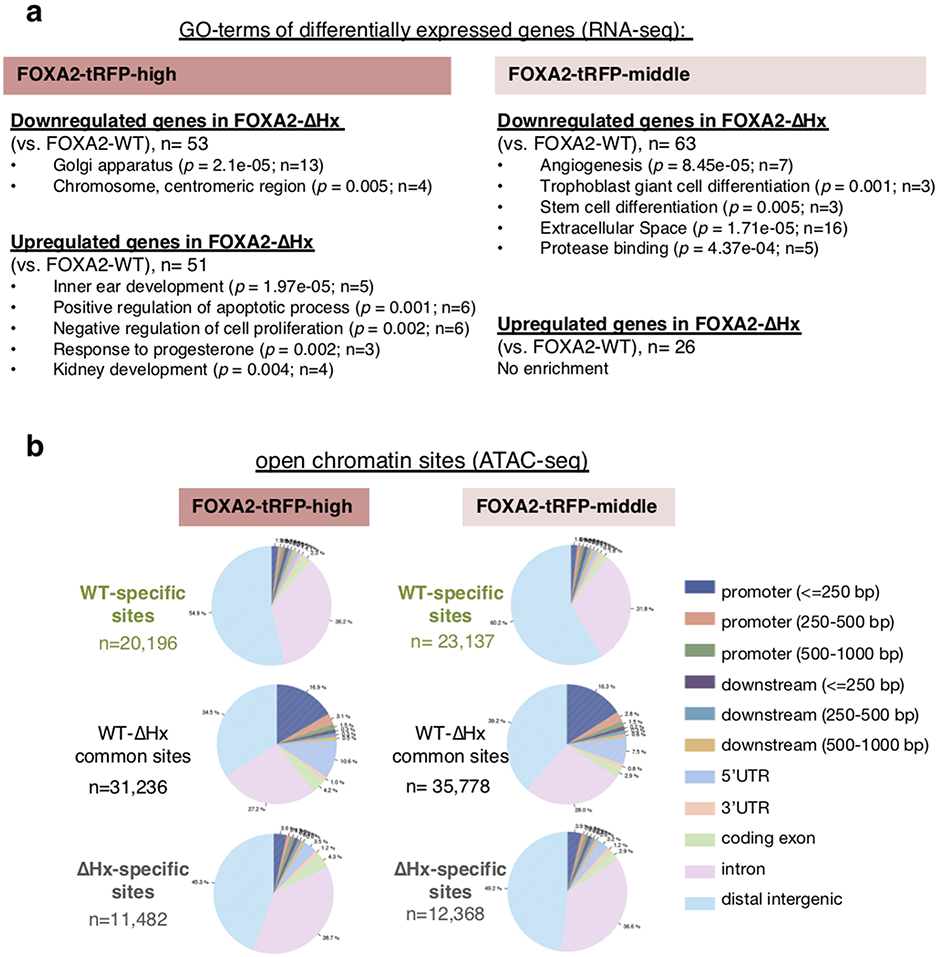
The Foxa2-ΔHx mutant affects distinct gene categories in FOXA2-high (node/notochord/head process cells) and FOXA2-middle (endoderm) populations in E7.5 embryos, including major effectors of embryonic development. The downregulated genes in the FOXA2-high-mutant population are mainly related to basic cell components, whereas those in the FOXA2-middle-mutant are related to cell differentiation, including Klf5 and Sox17 (Fig. 5a, Extended Data Figs. 7a and 9a, and Supplementary Table 1). Although they were not statistically significant due to deviations among replicates, Sox7 and Gata4 were downregulated in the FOXA2-high-mutant population (Extended Data Fig. 7b and Supplementary Table 1). Sox17 and Sox7 are expressed in endoderm and endothelial cells, respectively, with Sox17 knockout mouse embryos exhibiting severe defects in gut tube formation42 and Sox7 knockout mouse embryos exhibiting embryonic growth retardation and abnormal vascularization of the yolk sac43, consistent with the Foxa2-ΔHx phenotypes (Fig. 3b,g). Klf5 is essential for blastocyst development and normal self-renewal44,45. Gata4 is expressed in endodermal tissues and heart, and its knockout embryos exhibit defects in ventral morphogenesis and heart tube formation46,47, consistent with heart tube defects seen in Foxa2-ΔHx embryos (Fig. 3f).
Figure 5 ∣. Deletion of α-helical region of Foxa2 affects gene expression and the accessible chromatin landscape in E7.5 embryos.
a, The MA-plots depict the log2 fold changes (y-axis) over the means of normalized counts for all the genes in the RNA-seq DESeq dataset in E7.5 FOXA2-tRFP-high cells and FOXA2-tRFP-middle cells. Numbers of genes and points are colored red if the adjusted P-value (by one-sided Wald test with FDR correction at 10%) is less than 0.1. n = 3 biologically independent RNA-seq datasets per group (see Extended Data Fig. 7a for heatmaps showing differentially expressed genes for individual replicates). b, The heatmaps show the ATAC-seq signal at “wild-type (Foxa2WT-tRFP /WT-tRFP)-specific”, “ΔHx (Foxa2ΔHx-tRFP/ΔHx-tRFP)-specific”, and “wild-type and ΔHx common” open chromatin sites in E7.5 FOXA2-tRFP-high cells and FOXA2-tRFP-middle cells. De novo motifs enriched at each category are indicated next to the heatmaps (see Extended Data Fig. 8b for statistics of the motif analysis). c, RNA-seq and ATAC-seq tracks of from E7.5 wild-type (Foxa2WT-tRFP /WT-tRFP ) (green) and ΔHx (Foxa2ΔHx-tRFP/ΔHx-tRFP) (gray) embryos at down-regulated genes (Gprc5a and Zfp984) and an up-regulated gene (Gm14403). d, Scatter plot of ATAC-seq signal of wild-type (Foxa2WT-tRFP /WT-tRFP ) against ΔHx (Foxa2ΔHx-tRFP/ΔHx-tRFP) at open chromatin sites associated with down-regulated genes (blue circles) and up-regulated genes (red circles) in ΔHx.
The upregulated genes in Foxa2-ΔHx embryos are related to negative regulators of cell proliferation in the FOXA2-high population and alternative fate differentiation in the both FOXA2-high and -middle populations (Fig. 5a, Extended Data Figs. 7a and 9a, and Supplementary Table 1). Foxa2 is normally expressed in the anterior of E7.5 embryos (Fig. 3c), whereas the upregulated genes in Foxa2-ΔHx embryos—Hoxb1 and Meox1, and Notch and RA signaling related factors, Dll1, Aldh1a, and Cyp26a1—are normally expressed in posterior of E7.5 embryos and/or are essential for caudal body patterning48-53 (Fig. 5a and Extended Data Fig. 7a). Another upregulated gene, Tgfb2, is essential various aspects of embryonic development54 (Fig. 5a and Extended Data Fig. 7a). Upregulation of these genes is consistent with the abnormal body patterning and developmental arrest in Foxa2-ΔHx embryos (Fig. 3c-e). Altogether, the FOXA2 α-helix helps induce endodermal differentiation in the FOXA2-middle population and prevents alternative cell fates in the FOXA2-middle and -high populations.
Deletion of α-helical region of FOXA2 alters the accessible chromatin landscape in E7.5 embryos.
ATAC-seq analysis55 revealed a marked effect of Foxa2-ΔHx on chromatin accessibility. At E7.5, Foxa2-ΔHx embryos lost 20,196 open chromatin sites in FOXA2-high cells and 23,591 open chromatin sites in FOXA2-middle cells (Fig. 5b). The Foxa2-WT-specific open chromatin sites, which lost accessibility in Foxa2-ΔHx embryos, were enriched with de novo motifs for FOX and lineage-related factors LHX and TBX/EOMES for FOXA2-high cells, and HNF1 and GATA for FOXA2-middle cells (Fig. 5b and Extended Data Fig. 8b). More than 90% of Foxa2-WT-specific and 85% of Foxa2-ΔHx-specific open chromatin sites lie outside of promoter regions (Extended Data Fig. 9b), consistent with Foxa2 targets seen in adult liver36,56. Interestingly, chromatin sites that became open in Foxa2-ΔHx (n = 11,482 for FOXA2-high cells, n = 12,368 for FOXA2-middle cells) were enriched for de novo motifs including FOXA, SOX, and MSX (Fig. 5b and Extended Data Fig. 8b). Among SOX family genes, Sox4 and Sox11 (SoxC) were expressed in both FOXA2-high and -middle populations, and SOX4 was reported to interact with co-repressor complex with EZH2 (polycomb regulator) and HDAC3 (histone deacetylase) 57 MSX1 functions as a repressor that recruits linker histone H1b, Groucho-related factors, and Polycomb to its binding sites58-60. We note that when FOXA1 recruits Groucho, it restricts local chromatin access22, and FOXA1 co-binds with repressors at silent genes in liver where local transcription is suppressed61. Thus, the Foxa2-ΔHx defect in chromatin opening could impair SOX4 and MSX1 from binding and inhibiting chromatin repression. ATAC peaks associated with differentially expressed genes tend to show correlative changes of their openness with down- and up-regulated genes (Fig. 5c,d). The chromatin sites that remained open in Foxa2-WT and -ΔHx were most enriched with ubiquitous transcription factors (SP1, E2F2, NFY), which preferentially bind to promoters, and less with FOXA motif (Fig. 5b and Extended Data Fig. 8b, “common sites”) and were over-represented by promoter regions (Extended Data Fig. 9b). In mammalian genomes, enhancers tend to be open in a tissue-specific manner, while promoters are more likely to be open in a ubiquitous fashion36; thus, promoter sites keep open states independent of FOXA2. In summary, many distal regulatory sites in the chromatin of the endoderm and node/notochord/head process are dependent upon accessibility via the histone-interacting, α-helical domain of FOXA2.
Discussion
The ability to target nucleosomal DNA allows pioneer factors to enable cooperative interactions with other transcription factors in silent chromatin, causing changes in gene expression networks for new cell fates. Yet it has not been clear whether chromatin opening in vivo is strictly dependent upon cooperating transcription factors and nucleosome remodelers62-64 or is dependent upon, in some cases, a chromatin opening ability that can be discerned for the pioneer transcription factor in vitro, independent of cofactors or nucleosome remodeling complexes8. In this paper, we discovered a histone-interacting, α-helical domain of FOXA1 that contributes to chromatin opening on compacted nucleosome arrays in vitro, targeting a specific nucleosome that harbors two enhancer binding sites for the factor24,65,66. Notably, the same FOXA2 α-helical domain contributes to opening chromatin at many thousands of sites in the early endoderm and node/notochord lineages for proper embryonic differentiation and growth. We conclude that the ability of a transcription factor to interact with core histones in nucleosome target sequences, separately from interacting with DNA, can be crucial for pioneer activity and proper embryonic development.
The occurrence of motifs for other cell type-determining factors with the FOXA2-opened sites in embryos (Fig. 5b), along with functional assessments of FOXA2-targeted chromatin in endoderm differentiation from embryonic stem cells67, indicates that FOXA2-mediated chromatin opening in vivo is likely a cooperative event with other transcription factors. Indeed, the original discovery of FOXA factors binding to the Alb enhancer in undifferentiated embryonic endoderm, by in vivo footprinting, revealed co-occupancy with GATA transcription factors68,69, and recombinant FOXA1 was later found to enhance GATA4 binding to dinucleosomes in vitro70. However, that GATA4 could target a central nucleosome on a compacted nucleosome array and elicit nuclease sensitivity on its own, albeit more weakly than FOXA18, indicates that there are chromatin dynamics elicited by transcription factors that can only be seen on complex chromatin substrates and not on isolated nucleosomes or dinucleosomes. We speculate that many pioneer factors will be found to interact with core histones and that such interactions will enable cooperative events in chromatin, as for FOXA1. Indeed, the transcription factor EBF1 opens chromatin during B cell development, and chromatin opening requires a C-terminal domain separate from its DNA binding domain71.
Recent studies reveal that pioneer factor binding to closed chromatin in vivo is a fast step, with resultant open chromatin states with co-bound factors being a slow step11,72-74. Thus, there remains a gap in understanding how the open chromatin states that are elicited on compacted nucleosome arrays in vitro relate to opening of chromatin in the complex environment of the nucleus. The difference could relate to the more diverse and physically compacted chromatin states in vivo, as seen by the differential ability of transcription factors to target repressive H3K27me375 and H3K9me376 domains, in addition to unmodified and closed chromatin domains. Biophysical and in vivo studies are revealing details by which transcription factor binding to nucleosomes can result in partial unwrapping of the DNA, with the factor still bound to nucleosomal sequences77-80. In summary, there appear to be additional steps between the initial slow scanning of pioneer factors in chromatin81, sampling of cell-specific and non-specific target sites82, and when they enable cooperative events with other transcription factors and chromatin remodelers11,35,74,82-85. It will take more complex chromatin templates in vitro to understand the mechanisms of chromatin opening, as it is possible for nucleosome arrays to be compacted with linker histone, which in vivo can be displaced by FOXA1 and FOXA236, as well as with co-repressors that compact the chromatin further22.
High-throughput screens for nucleosome binding are revealing significant numbers of transcription factors that can target binding sites on recombinant nucleosomes that lack pre-existing histone modifications86,87. Nucleosome binding is enabled when a transcription factor recognizes a DNA sequence via a short α−helix in the DNA binding domain87, which is a separate from the histone interaction and chromatin opening function of the α-helical domain in the C-terminal region of FOXA1 and FOXA2 described here. Based on our study, further analysis of histone interactions and understanding how they enable chromatin opening, as well as how they may enable engagement with different types of silent chromatin domains, will bring us closer to being able to control cell fates at will.
Online methods
FOXA1-core histone crosslinking analysis.
In brief, recombinant FOXA1 was incubated with core histone octamers, which dissociate into dimers and tetramers at the salt concentrations used, crosslinked with formaldehyde, and crosslinked and control bands were analyzed by MALDI-TOF spectrometry. FOXA1 and octamers at 0.25 nM each were incubated in 90 μl of 150 mM KCl; 20 mM HEPES, pH 7.6; 0.1%Tween 20; 0.5 mM EDTA; 0.5 mM EGTA; 10% glycerol for 2 h at room temperature. Formaldehyde (10 μl of a 10% solution) was added and mixed for 1 min. The mixture was precipitated with 5 volumes of acetone and incubated overnight, with occasional mixing. Precipitates were spun in a microfuge at 4 °C for 20 min and the pellets resuspended into SDS-PAGE running buffer. SDS-PAGE loading buffer was added, heated to 95 °C for 5 min, spun briefly, then run on an SDS-PAGE for 2 h. The gel was stained with Coomassie blue, destained, and the bands were excised for trypsinization and MALDI-TOF analysis. Spectra were evaluated by quantitation of signals and displayed in MoverZ.
FOXA sequence homology analysis.
The non-redundant database was filtered to contain sequences only from eumetazoans (animals, no invertebrates) and the substitution matrix was set to BLOSUM45 to allow for more distal matches. Sequence hits were filtered using an expected value cutoff of 1E-10 and a bit score (normalized sequence similarity) of 100 or better. In each species, the best match by bit score was obtained. FOXA1 and FOXA2 “hits” (the matching part of the sequence in each species) were then loaded into the multiple sequence alignment tool CLUSTAL OMEGA to produce a phylogeny. Obvious clades on the dendrogram were examined and a representative from each was selected. Finally, a list of 19 species, mostly mammalian, was created for Extended Data Figure 3. Additionally, Drosophila Fkh1 was added to the list for an out-group contrast. The hits from these species were re-uploaded to CLUSTAL OMEGA and the alignment was produced. The alignment is split into FOXA1, FOXA2, FOXA3, and Fkh1 hits, and the hits are sorted by protein similarity within each group.
Peptides and circular dichroism (CD) spectroscopy.
Synthetic peptides FCIC-1 (NH-SSEQQHKLDFKAYEQALQYS-OH) and FCIC-2 (NH-SSEQQHKLDFKPYEQPLQYS-OH) were purchased from AnaSpec, Inc. (San Jose, CA). Peptides were purified to >98% by reverse-phase HPLC. The mass of the peptides, measured by matrix-assisted laser desorption mass spectrometry, was within 1.6 and 0.4 Da of the theoretical mass for FCIC-1 and FCIC-2, respectively. Because of the limited solubility of FCIC-1 at neutral pH, stock solutions of 163 μM FCIC-1 and 170 μM FCIC-2 were prepared by dissolving the lyophilized peptides in a dilute solution of sodium hydroxide at pH 10. For CD measurements in the absence and presence of trifluoroethanol (TFE), 240 μl of stock solution was mixed with 60 μl of a water/TFE mixture to yield final TFE concentrations in the range from 0 to 20% (by volume), which enhances secondary structure in aqueous solutions. The pH was adjusted to 8.2 by adding small amounts of HCl. Final peptide concentrations were 130 and 136 μM for FCIC-1 and FCIC-2, respectively. CD spectra were acquired at 20 °C on an Aviv 62A spectropolarimeter (Aviv, Lakewood, NJ), using 1 mm quartz cuvettes. Each CD spectrum is an average of five scans recorded in the far-UV region (190-260 nm) with a band pass of 2 nm. Peptide concentration was determined by measuring tyrosine absorbance at 275 nm in acidified stock solutions, using an extinction coefficient of 2,800 M−1 cm−1. In the absence of TFE (filled circles in Fig. 1c), both peptides exhibit a strong negative band near 200 nm and a minor shoulder near 225 nm characteristic of a largely disordered (random coil) conformation. Addition of TFE to FCIC-1 results in pronounced spectral changes, including a large increase in ellipticity below 200 nm and a growing negative band in the 215-230 nm range. These changes are consistent with a solvent-induced increase in α-helix content from less than 2% in water to about 10% at the highest TFE concentration measured (20% by volume), assuming a molar mean-residue ellipticity of −34,100 mdeg cm−2 dmol−1 for a fully α-helical peptide88. By contrast, addition of TFE has little or no effect on the far-UV spectrum of the control peptide, FCIC-2. The fact that the control peptide remains unstructured even in the presence of TFE indicates that any tendency of the peptide to form helical secondary structure is completely disrupted by the two Ala-Pro substitutions.
Core histone pulldown assay.
Recombinant wild-type FOXA1 and mutants thereof were produced in E. coli, purified to homogeneity, and used in a pulldown assay with recombinant core histones as described previously8.
Chromatin accessibility assay on compacted nucleosome arrays.
Recombinant mutant FOXA1 proteins were produced as described21,89, added to end-labeled, linker histone-compacted nucleosome arrays, digested with DNase, and analyzed as described8,90.
Cell culture and transient transfection of siRNA and plasmids.
H2.35 is a temperature-sensitive mouse liver cell line that maintained in an undifferentiated state at the permissive temperature (33 °C) and expresses various liver genes at the restrictive temperature (39 °C). H2.35 cells were maintained at 33 °C in the low-glucose DMEM (Invitrogen #11885-084) with 4% fetal bovine serum and 0.2 μM dexamethasone. For the FOXA1 knockdown, H2.35 were plated with a mixture of FoxA siRNA (Thermo, #s67625 and #s67627) and Lipofectamine RNAiMAX (Invitrogen, 13778) and cultured at 33 °C. 12 h after the siRNA transfection, the cells were transfected with a FOXA1 expression vector by Lipofectamine LTX (Invitrogen #15338-100) and cultured at 33 °C for 6 h. The transfected cells were then moved to 39 °C and cultured for 3 days for RNA and protein extraction.
Creating Foxa2WT-tagRFP and Foxa2ΔHx-tagRFP knock-in alleles in mice.
All procedures were in accordance with the NIH Guide for the Care and Use of Laboratory Animals and were approved by an IACUC committee at University of Pennsylvania. Foxa2WT-tagRFP/WT and Foxa2ΔHx-tagRFP/WT mice were generated by recombinase-mediated cassette exchange (RMCE) gene targeting in embryonic stem cells (Extended Data Fig. 3a)39. For the Foxa2WT-tagRFP allele, the stop codon of Foxa2 was removed and a flexible linker (SGGGGS GGGGS GGGGS GGGGS)40 plus tagRFP91 was inserted following the Foxa2 coding sequence. For the Foxa2ΔHx-tagRFP allele, a 10-amino acid of the Foxa2 α-helix region (LKAYEQVMHY) was removed from Foxa2WT-tagRFP allele. These knock-in mice were maintained on a C57Bl6/J x CD-1 mixed background. The PCR primers for genotyping Foxa2WT-tagRFP and Foxa2ΔHx-tagRFP knock-in alleles (generating 231-bp product) and non-modified allele (generating 197-bp product) are listed below:
lox2272-F: 5’-AGT GTT GTC TTC TGC CTT TGA G-3’
lox2272-R: 5’-GCT TAC CTT AGT CTC GGT CTT GG-3’
The PCR primers for genotyping Foxa2WT-tagRFP allele (generating 300-bp product) and FoxA2ΔHx-tagRFP (generating 270-bp product) are listed below:
tRFP-F: 5’-GCT CTT CGC CCT TAG ACA CC-3’
tRFP-R: 5’-ATC AGC CCC ACA AAA TGG AC-3’
Because none of the E7.5 embryonic phenotypes investigated in this study is evidently sex biased, embryos were not sexed, and a mixed population of male and female embryos was analyzed for RNA-seq and ATAC-seq.
Image data acquisition.
Widefield fluorescence images of Foxa2WT-tagRFP and Foxa2ΔHx-tagRFP embryos were acquired on a Nikon ECLIPSE TE2000-U Microscopy and a CoolSNAP EZ CCD camera.
Fluorescence activated cell sorting (FACS) of mouse embryo cells.
Females of 3-5 weeks old Foxa2WT-tagRFP/WT and Foxa2ΔHx-tagRFP/WT were superovulated by intraperitoneal injection of 7.5 IU pregnant mare serum gonadotropin (PMSG) (Prospec, #HOR-272) and, 48 h later, followed by a second injection of 7.5 IU human chorionic gonadotropin (HCG) (Sigma, #G1063-1VL) and then bred to males of same genotype. E7.5 mouse embryos were dissected into phenol red-free DMEM/F12 (Invitrogen, # 11039-021) supplemented with 5% fetal bovine serum (FBS). Extra-embryonic portion was removed and kept for PCR genotyping. tagRFP intensity of embryos was evaluated by taking a fluorescence image (Nikon TE2000-U) in order to distinguish Foxa2WT-tagRFP and Foxa2ΔHx-tagRFP homozygous embryos from heterozygous and wild-type embryos. About 10 embryos of homozygous (for sorting), heterozygous (for setting a FACS gate), or wild-type (for setting a FACS gate) were washed with PBS, dissociated with 200 μl of 0.05% Trypsin-EDTA (Invitrogen, #25300054) for 5 min at 37 °C, and then stopped with 200 μl of DMEM/F12 supplemented with 20% FBS. The embryos were pipetted up and down to obtain single cell suspension, spun down to remove supernatant, and resuspended in DMEM/F12 supplemented with 10% FBS. The cell suspensions were filtered through 35-μm filter cap (BD Falcon #352253) and transferred to FACS tubes (BD Falcon #352063). Based on tagRFP intensity of wild-type and heterozygous embryos, three sorting gates were set: “FOXA2-tagRFP-negative” and “FOXA2-tagRFP-middle”, which were gated by avoiding autofluorescence of WT and including up to maximum tagRFP intensity of heterozygous (Foxa2tagRFP/WT) cells expressed, and “FOXA2-tagRFP-high”, which exhibited higher tagRFP signal than heterozygous cells did (Extended Data Fig. 6b). These three populations of homozygous embryos were isolated on a BD Influx Cell Sorter.
RNA-seq.
Three biological replicates of total RNA from 2,500-5,000 embryonic cells was isolated using the RNeasy Micro kit (QIAGEN, #74004) and genomic DNA was digested on column with the addition of RNase-free DNase I. The RNA was eluted from the columns using RNase-free water. RNA-seq libraries with the RNA equivalent of 1,000 cells were generated by SMART-Seq2 method as previously described92. The RNA-seq libraries were quantified using the NEBNext Library Quant Kit for Illumina (New England Biolabs, #E7630S) and the size distribution of the libraries was validated using the High Sensitivity DNA Analysis Kit (Agilent, #5067-4626). The libraries were pooled and single-end sequenced on an Illumina NextSeq 500 with 75-bp read length.
Alignment and processing RNA-seq data.
RNA-seq reads were mapped to the mouse mm10 genome with STAR-2.5.2a using the parameters --outFilterMultimapNmax 20 --alignSJoverhangMin 8 --alignSJDBoverhangMin 1 --outFilterMismatchNmax 999 --alignIntronMin 20 --alignIntronMax 100000093. After alighment, the number of reads per transcript were estimated using HTSeq-0.6.194, and DESeq295 was used to normalize read counts and call differentially expressed genes. Gene ontology enrichment analyses were performed using DAVID Bioinformatics Resources 6.896.
ATAC-seq.
ATAC-seq from two biological replicates was performed essentially as previously described55 with the following differences: in total, 2,000-5,000 embryonic cells were used per ATAC-seq library and the transposition reaction was done in 5 μl instead of 50 μl reaction. Also, the QIAGEN MinElute purification before PCR was eliminated and instead the 5 μl reaction was taken immediately after transposition directly into the 50 μl PCR. The ATAC-seq libraries were quantified using the NEBNext Library Quant Kit for Illumina (New England Biolabs, #E7630S) and the size distribution of the libraries was validated using the High Sensitivity DNA Analysis Kit (Agilent, #5067-4626). The libraries were pooled and paired-end sequenced on an Illumina NextSeq 500 with 2 x 38-bp read lengths.
Alignment and processing ATAC-seq data.
Paired-end ATAC-seq reads were mapped to the mouse mm10 genome with STAR-2.5.2a using the parameters --outFilterMultimapNmax 20 --outFilterMismatchNmax 999 --alignMatesGapMax 1000000 --alignIntronMax 193. Reads mapping to the mitochondria, unmapped contigs, and chromosome Y, and mate-pairs longer than 2 kb, and possible PCR duplicates were removed. We used MACS297 to call peaks on replicate-pooled tags with the parameters --nomodel --nolambda --keep-dup all --call-summits. We extracted peaks with FDR < 0.01 and filtered out the peaks that were overlapped with the consensus excludable ENCODE blacklist and mitochondrial homologs55. WT-specific and ΔHx-specific peaks were identified using BEDtools intersect -wa -v while common peaks were identified using BEDtools intersect’s default behavior (reporting regions shared between peaks in both conditions). Peaks which were exact duplicates were removed from the common peaks for HOMER analysis. HOMER-v4.9 findMotifsGenome.pl script was used for de novo motif analysis98 with parameters -size 200 -mask.
Quantification and statistical analysis.
To check the significance of all comparisons, the Wilcoxon rank sum test was used to calculate P-values for data used to generate box plots. Differential expression was analyzed using DESeq2 (Wald test) with FDR correction at 10%. Gene Ontology enrichment analysis was performed using DAVID (EASE/Fisher's exact test) with FDR correction at 10%.
Reporting Summary.
Further information on research design is available in the Nature Research Reporting Summary linked to this paper.
DATA AVAILABILITY
Genomic data have been deposited in the Gene Expression Omnibus database under accession number GSE134465.
Extended Data
Extended Data Fig. 1. The FOXA α-helix binds core histones.
a, Schematic of crosslinking of histone octamers used as input and FOXA1. SDS-PAGE analysis of FOXA1 or FOXA1 crosslinked to core histones, stained with Coomassie blue. Crosslinked products of a mobility expected for FOXA1 and core histone together are noted as band A and band B. The full blot gel is presented in the Source Data files. b, Underlined sequences are identified by peptide mass matching while the subset highlighted by green are used for relative peptide quantification in Extended Data Figure 2. c, Strategy to map candidate interaction sites, explaining how crosslinked peptides gain a much greater mass and become depleted from the m/z spectrum.
Extended Data Fig. 2. Mass spectrometry identification of FOXA1 peptides depleted by crosslinking to core histones.
Relative quantification of FOXA1 peptides in crosslinked bands A and B shown in Extended Data Figure 1a. The integrated intensities of ions corresponding to peptides YPHAKPPYSYISLITMAIQQAPSK and ASQLEGAPAPGPAASPQTLDHSGATATGGASELK were used for normalizing tabulated intensities of other FOXA1 peptide ions. Those peptide intensities found unaltered in bands A and B (Extended Data Figure 1a) are shown in the blue panel while those whose intensities changed in the FOXA1:Histone x-linked bands are shown in the red panel, and noted by red arrows, as discussed in the main text. Lower right, quantitation of peptide signals of aa415-443 over control peptide signals of aa313-246 within the same respective spectrum, demonstrating a diminution of aa415-442 in band A due to blockage at K414.
Extended Data Fig. 3. Amino acid sequence comparison of FOXA family C-terminal regions.
a, A putative α-helical region is conserved in FOXA1 and FOXA2 homologs. Conserved regions II and III are highlighted in teal and the α-helical region around K414 (orange) is highlighted in green. b, FOXA2 wild-type (WT) protein and delta-helix (ΔHx) mutant bound to Sepharose beads in a pulldown assay to assess binding to histone octamers. The bar graph represents mean +/− s.e.m. of four replicates. P values are from a one-sided paired t-test, comparing the ratio of the core histones H3/H2A/H2B as a group and H4 to the recovered amount of full length FOXA2 in the same lane (n = 4 experiments; *, P < 0.05 different from WT). Dashed lines indicate partial FOXA2 degradation products from the C-terminus of the 6X-his tagged FOXA2 proteins, which were tagged on the N-terminus. The full gel is presented in the Source Data files.
Extended Data Fig. 4. Deficiency in activation of endogenous FOXA1 liver target genes by FOXA-ΔHx and FOXA1-PP mutant proteins.
a, Schematic of functional assay for FOXA1 wild-type and mutants in H2.35 liver cells. b, Apoa1 and Ttr1 expression analysis by RT-qPCR relative to expression levels in the control. Results shown as mean +/− s.e.m. of four biological replicates. P values are from two-sided Student's t-test. c, Western blot analysis of two biological replicates for endogenous and exogenous FOXA proteins, demonstrating similar amounts of FOXA-ΔHx and FOXA1-PP mutant proteins as FOXA1-WT, and thus indicating an intrinsic deficiency in the mutants' abilities to restore expression of endogenous liver genes in a Foxa1 knock-down background. Two experiments were repeated independently with similar results. Full blots are presented in the Source Data files.
Extended Data Fig. 5. Gene targeting at the mouse Foxa2 locus.
a, Generation of Foxa2WT-tRFP and Foxa2ΔHx-tRFP knock-in alleles with targeting and exchange cassettes. b, Frequency of genotypes resulting from heterozygous intercrosses of Foxa2WT-tRFP/WT at embryonic stages. c, Box and whisker plots show stage distribution at wild-type, heterozygous, and homozygous of Foxa2WT-tRFP and Foxa2ΔHx-tRFP embryos at E8.5. The bottom and top of the boxes correspond to the 25th and 75th percentiles, and the internal band is the 50th percentile (median). The ends of the whiskers represent 1.5 times the IQR. The points represent outliers. The indicated P-values are obtained by one-sided Wilcoxon rank sum test.
Extended Data Fig. 6. FACS gating to sort FOXA2-tRFP positive and negative cells in E7.5 embryos.
a, Bright field images of Foxa2ΔHx-tRFP/WT and Foxa2ΔHx-tRFP/ΔHx-tRFP (with a gross phenotype) littermate at E12.5 from heterozygous intercrosses. Images are representative of the numbers of embryos indicated in Figure 3a. b, Representative FACS pattern of FOXA-tRFP-high (P5 gate), -middle (P4 gate), and -negative (P3 gate) cells from Foxa2tRFP/tRFP E7.5 embryos. Foxa2WT/WT and Foxa2tRFP/WT samples were loaded only for setting the gates, but not for the sorting. The FOXA2-tRFP-middle (P4 gate) was set by avoiding autofluorescence and including up to the maximum tRFP intensity of heterozygous (Foxa2tRFP/WT) cells expressed. The FOXA2-tagRFP-high (P5 gate) exhibited a higher tagRFP signal than heterozygous cells. The FACS experiments were repeated more than 40 times independently with similar results.
Extended Data Fig. 7. Deletion of α-helical region of FOXA2 alters gene expression in E7.5 embryos.
a, Heatmaps show DESeq adjusted RNA-seq counts for all differentially expressed genes with adjusted p-value < 0.1 (by one-sided Wald test with FDR correction at 10%). The individual replicates of wild-type (Foxa2WT-tRFP /WT-tRFP) and ΔHx (Foxa2ΔHx-tRFP/ΔHx-tRFP) in FOXA2-tRFP-high and -middle cells were presented. n = 3 biologically independent RNA-seq datasets per group. b, RNA-seq tracks of each biological replicate of FOXA2-tRFP-mid cells from E7.5 Foxa2WT/WT (green) and Foxa2ΔHx-tRFP/ΔHx-tRFP (gray) embryos at down-regulated gene loci in Foxa2ΔHx-tRFP/ΔHx-tRFP.
Extended Data Fig. 8. Deletion of α-helical region of FOXA2 alters the accessible chromatin sites in E7.5 embryos.
a, de novo motif enrichment analysis at differential open chromatin sites (ATAC-seq peaks) between FOXA2[WT]-tRFP-high cells and FOXA2[WT]-tRFP-middle cells. P-value (by one-sided Monte Carlo simulation with FDR controlled at 5%) and % targets are indicated in parentheses. n = 2 biologically independent ATAC-seq datasets per group. b, de novo motif enrichment analysis at differential open chromatin sites (ATAC-seq peaks) of “wild-type (Foxa2WT-tRFP /WT-tRFP)-specific”, “ΔHx (Foxa2ΔHx-tRFP/ΔHx-tRFP)-specific”, and “wild-type and ΔHx common” open chromatin sites in E7.5 FOXA2-tRFP-high cells and FOXA2-tRFP-middle cells. P-value (by one-sided Monte Carlo simulation with FDR controlled at 5%) and % targets are indicated in parentheses. n = 2 biologically independent ATAC-seq datasets per group.
Extended Data Fig. 9. Deletion of α-helical region of FOXA2 alters gene expression and accessible chromatin landscapes in E7.5 embryos.
a, GO term enrichment analysis of downregulated and upregulated genes in FOXA2-tRFP-high and FOXA2-tRFP-middle cells. P-value (by one-sided EASE/Fisher's exact test) and gene count are indicated in parentheses. n = 3 biologically independent RNA-seq datasets per group. b, The distribution of WT-specific, ΔHx-specific, and WT-ΔHx common open chromatin sites at non-overlapped genomic features.
Supplementary Material
Acknowledgements
We thank Roland Dunbrack (Fox Chase Cancer Center) for secondary structure analysis, Charles Ducker for crosslinking studies, Susan Hipkens for mouse ES cell culture and gene targeting in the Transgenic Core of Vanderbilt University, Ryan McCarthy for data review, and the UPenn Flow Cytometry and Cell Sorting Facility. M.I. was supported by postdoctoral fellowships from JSPS, Naito, Astellas, and Uehara foundations. P.S. was supported by SAF2016-75531-R (MICINN/FEDER, UE) and B2017/BMD-3724 (Comunidad de Madrid). The research was supported by NIH grant GM36477 to K.S.Z.
Footnotes
Competing interests
The authors declare no competing financial interests.
References
- 1.Kundaje A et al. Integrative analysis of 111 reference human epigenomes. Nature 518, 317–30 (2015). [DOI] [PMC free article] [PubMed] [Google Scholar]
- 2.Perez-Lluch S et al. Absence of canonical marks of active chromatin in developmentally regulated genes. Nat Genet 47, 1158–67 (2015). [DOI] [PMC free article] [PubMed] [Google Scholar]
- 3.Ho JW et al. Comparative analysis of metazoan chromatin organization. Nature 512, 449–52 (2014). [DOI] [PMC free article] [PubMed] [Google Scholar]
- 4.Ernst J et al. Mapping and analysis of chromatin state dynamics in nine human cell types. Nature 473, 43–9 (2011). [DOI] [PMC free article] [PubMed] [Google Scholar]
- 5.Gaffney DJ et al. Controls of nucleosome positioning in the human genome. PLoS Genet 8, e1003036 (2012). [DOI] [PMC free article] [PubMed] [Google Scholar]
- 6.Lidor Nili E et al. p53 binds preferentially to genomic regions with high DNA-encoded nucleosome occupancy. Genome Res 20, 1361–8 (2010). [DOI] [PMC free article] [PubMed] [Google Scholar]
- 7.Tillo D et al. High nucleosome occupancy is encoded at human regulatory sequences. PLoS One 5, e9129 (2010). [DOI] [PMC free article] [PubMed] [Google Scholar]
- 8.Cirillo L et al. Opening of compacted chromatin by early developmental transcription factors HNF3 (FOXA) and GATA-4. Molecular Cell 9, 279–289 (2002). [DOI] [PubMed] [Google Scholar]
- 9.Iwafuchi-Doi M & Zaret KS Pioneer transcription factors in cell reprogramming. Genes Dev 28, 2679–92 (2014). [DOI] [PMC free article] [PubMed] [Google Scholar]
- 10.Soufi A et al. Pioneer transcription factors target partial DNA motifs on nucleosomes to initiate reprogramming. Cell 161, 555–568 (2015). [DOI] [PMC free article] [PubMed] [Google Scholar]
- 11.Mayran A et al. Pioneer factor Pax7 deploys a stable enhancer repertoire for specification of cell fate. Nat Genet 50, 259–269 (2018). [DOI] [PubMed] [Google Scholar]
- 12.Carroll JS et al. Chromosome-wide mapping of estrogen receptor binding reveals long-range regulation requiring the forkhead protein FoxA1. Cell 122, 33–43 (2005). [DOI] [PubMed] [Google Scholar]
- 13.Golson ML & Kaestner KH Fox transcription factors: from development to disease. Development 143, 4558–4570 (2016). [DOI] [PMC free article] [PubMed] [Google Scholar]
- 14.Ang S-L et al. The formation and maintenance of the definitive endoderm lineage in the mouse: involvement of HNF3/forkhead proteins. Development 119, 1301–1315 (1993). [DOI] [PubMed] [Google Scholar]
- 15.Sasaki H & Hogan BLM Differential expression of multiple fork head related genes during gastrulation and pattern formation in the mouse embryo. Development 118, 47–59 (1993). [DOI] [PubMed] [Google Scholar]
- 16.Monaghan AP, Kaestner KH, Grau E & Schütz G Postimplantation expression patterns indicate a role for the mouse forkhead/HNF-3α, β, and γ genes in determination of the definitive endoderm, chordamesoderm and neuroectoderm. Development 119, 567–578 (1993). [DOI] [PubMed] [Google Scholar]
- 17.Ang S-L & Rossant J HNF-3β is essential for node and notochord formation in mouse development. Cell 78, 561–574 (1994). [DOI] [PubMed] [Google Scholar]
- 18.Weinstein DC et al. The winged-helix transcription factor HNF-3β is required for notochord development in the mouse embryo. Cell 78, 575–588 (1994). [DOI] [PubMed] [Google Scholar]
- 19.Hsu H-T, Chen H-M, Yang Z, Wang J, Lee NK, Burger A, Zaret K, Liu T, Levine E, Mango SE Recruitment of RNA polymerase II by the pioneer transcription factor PHA-4. Science 348, 1372–1376 (2015). [DOI] [PMC free article] [PubMed] [Google Scholar]
- 20.Mango SE, Lambie EJ & Kimble J The Pha-4 gene is required to generate the pharyngeal primordium of Caenorhabditis elegans. Development 120, 3019–3031 (1994). [DOI] [PubMed] [Google Scholar]
- 21.Cirillo LA et al. Binding of the winged-helix transcription factor HNF3 to a linker histone site on the nucleosome. EMBO J. 17, 244–254 (1998). [DOI] [PMC free article] [PubMed] [Google Scholar]
- 22.Sekiya T & Zaret KS Repression by Groucho/TLE/Grg proteins: genomic site recruitment generates compacted chromatin in vitro and impairs activator binding in vivo. Mol Cell 28, 291–303 (2007). [DOI] [PMC free article] [PubMed] [Google Scholar]
- 23.Simpson RT, Thoma F & Brubaker JM Chromatin reconstituted from tandemly repeated cloned DNA fragments and core histones: a model system for study of higher order structure. Cell 42, 799–808 (1985). [DOI] [PubMed] [Google Scholar]
- 24.McPherson CE, Shim EY, Friedman DS & Zaret KS An active tissue-specific enhancer and bound transcription factors existing in a precisely positioned nucleosomal array. Cell 75, 387–98 (1993). [DOI] [PubMed] [Google Scholar]
- 25.Chaya D, Hayamizu T, Bustin M & Zaret KS Transcription factor FoxA (HNF3) on a nucleosome at an enhancer complex in liver chromatin. J. Biol. Chem 276, 44385–44389 (2001). [DOI] [PubMed] [Google Scholar]
- 26.Fletcher TM & Hansen JC The nucleosomal array: structure/function relationships. Crit Rev Eukaryot Gene Expr 6, 149–88 (1996). [DOI] [PubMed] [Google Scholar]
- 27.Hill DA & Imbalzano AN Human SWI/SNF nucleosome remodeling activity is partially inhibited by linker histone H1. Biochemistry 39, 11649–56 (2000). [DOI] [PubMed] [Google Scholar]
- 28.Horn PJ et al. Phosphorylation of linker histones regulates ATP-dependent chromatin remodeling enzymes. Nat Struct Biol 9, 263–7 (2002). [DOI] [PubMed] [Google Scholar]
- 29.Ramachandran A, Omar M, Cheslock P & Schnitzler GR Linker histone H1 modulates nucleosome remodeling by human SWI/SNF. J Biol Chem 278, 48590–601 (2003). [DOI] [PubMed] [Google Scholar]
- 30.Lai E et al. HNF-3A, a hepatocyte-enriched transcription factor of novel structure is regulated transcriptionally. Genes Dev 4, 1427–1436 (1990). [DOI] [PubMed] [Google Scholar]
- 31.Qian X & Costa RH Analysis of hepatocyte nuclear factor-3 beta protein domains required for transcriptional activation and nuclear targeting. Nucleic Acids Res 23, 1184–91 (1995). [DOI] [PMC free article] [PubMed] [Google Scholar]
- 32.Lai E, Clark KL, Burley SK & Darnell JE Jr. Hepatocyte nuclear factor 3/fork head or "winged helix" proteins: A family of transcription factors of diverse biologic function. Proc Natl Acad Sci USA 90, 10421–10423 (1993). [DOI] [PMC free article] [PubMed] [Google Scholar]
- 33.Pani L et al. Hepatocyte nuclear factor 3β contains two transcriptional activation domains, one of which is novel and conserved with the Drosophila fork head protein. Mol Cell Biol 12, 3723–3732 (1992). [DOI] [PMC free article] [PubMed] [Google Scholar]
- 34.Barozzi I et al. Coregulation of transcription factor binding and nucleosome occupancy through DNA features of mammalian enhancers. Mol Cell 54, 844–57 (2014). [DOI] [PMC free article] [PubMed] [Google Scholar]
- 35.Ballare C et al. Nucleosome-driven transcription factor binding and gene regulation. Mol Cell 49, 67–79 (2013). [DOI] [PubMed] [Google Scholar]
- 36.Iwafuchi-Doi M et al. The pioneer transcription factor FoxA maintains an accessible nucleosome configuration at enhancers for tissue-specific gene activation. Molecular Cell In press(2016). [DOI] [PMC free article] [PubMed]
- 37.Clark KL, Halay ED, Lai E & Burley SK Co-crystal structure of the HNF3/fork head DNA recognition motif resembles histone H5. Nature 364, 412–420 (1993). [DOI] [PubMed] [Google Scholar]
- 38.Zaret K Early liver differentiation: genetic potentiation and multilevel growth control. Curr Opin Genet Dev 8, 526–31 (1998). [DOI] [PubMed] [Google Scholar]
- 39.Chen SX et al. Quantification of factors influencing fluorescent protein expression using RMCE to generate an allelic series in the ROSA26 locus in mice. Dis Model Mech 4, 537–47 (2011). [DOI] [PMC free article] [PubMed] [Google Scholar]
- 40.Arai R, Wriggers W, Nishikawa Y, Nagamune T & Fujisawa T Conformations of variably linked chimeric proteins evaluated by synchrotron X-ray small-angle scattering. Proteins 57, 829–38 (2004). [DOI] [PubMed] [Google Scholar]
- 41.Yoshiba S & Hamada H Roles of cilia, fluid flow, and Ca2+ signaling in breaking of left-right symmetry. Trends Genet 30, 10–7 (2014). [DOI] [PubMed] [Google Scholar]
- 42.Kanai-Azuma M et al. Depletion of definitive gut endoderm in Sox17-null mutant mice. Development 129, 2367–2379 (2002). [DOI] [PubMed] [Google Scholar]
- 43.Wat MJ et al. Mouse model reveals the role of SOX7 in the development of congenital diaphragmatic hernia associated with recurrent deletions of 8p23.1. Hum Mol Genet 21, 4115–25 (2012). [DOI] [PMC free article] [PubMed] [Google Scholar]
- 44.Shindo T et al. Kruppel-like zinc-finger transcription factor KLF5/BTEB2 is a target for angiotensin II signaling and an essential regulator of cardiovascular remodeling. Nat Med 8, 856–63 (2002). [DOI] [PubMed] [Google Scholar]
- 45.Ema M et al. Kruppel-like factor 5 is essential for blastocyst development and the normal self-renewal of mouse ESCs. Cell Stem Cell 3, 555–67 (2008). [DOI] [PubMed] [Google Scholar]
- 46.Kuo CT et al. GATA4 transcription factor is required for ventral morphogenesis and heart tube formation. Genes Dev. 11, 1048–1060 (1997). [DOI] [PubMed] [Google Scholar]
- 47.Molkentin JD, Lin Q, Duncan SA & Olson EN Requirement of the transcription factor GATA4 for heart tube formation and ventral morphogenesis. Genes Dev. 11, 1061–1072 (1997). [DOI] [PubMed] [Google Scholar]
- 48.Forlani S, Lawson KA & Deschamps J Acquisition of Hox codes during gastrulation and axial elongation in the mouse embryo. Development 130, 3807–19 (2003). [DOI] [PubMed] [Google Scholar]
- 49.Candia AF et al. Mox-1 and Mox-2 define a novel homeobox gene subfamily and are differentially expressed during early mesodermal patterning in mouse embryos. Development 116, 1123–36 (1992). [DOI] [PubMed] [Google Scholar]
- 50.Bettenhausen B, Hrabe de Angelis M, Simon D, Guenet JL & Gossler A Transient and restricted expression during mouse embryogenesis of Dll1, a murine gene closely related to Drosophila Delta. Development 121, 2407–18 (1995). [DOI] [PubMed] [Google Scholar]
- 51.Hochgreb T et al. A caudorostral wave of RALDH2 conveys anteroposterior information to the cardiac field. Development 130, 5363–74 (2003). [DOI] [PubMed] [Google Scholar]
- 52.Abu-Abed S et al. The retinoic acid-metabolizing enzyme, CYP26A1, is essential for normal hindbrain patterning, vertebral identity, and development of posterior structures. Genes Dev 15, 226–40 (2001). [DOI] [PMC free article] [PubMed] [Google Scholar]
- 53.Sakai Y et al. The retinoic acid-inactivating enzyme CYP26 is essential for establishing an uneven distribution of retinoic acid along the anterio-posterior axis within the mouse embryo. Genes Dev 15, 213–25 (2001). [DOI] [PMC free article] [PubMed] [Google Scholar]
- 54.Sanford LP et al. TGFbeta2 knockout mice have multiple developmental defects that are non-overlapping with other TGFbeta knockout phenotypes. Development 124, 2659–70 (1997). [DOI] [PMC free article] [PubMed] [Google Scholar]
- 55.Buenrostro JD, Wu B, Chang HY & Greenleaf WJ ATAC-seq: A Method for Assaying Chromatin Accessibility Genome-Wide. Curr Protoc Mol Biol 109, 21.291–9 (2015). [DOI] [PMC free article] [PubMed] [Google Scholar]
- 56.Li Z, Schug J, Tuteja G, White P & Kaestner KH The nucleosome map of the mammalian liver. Nat Struct Mol Biol 18, 742–6 (2011). [DOI] [PMC free article] [PubMed] [Google Scholar]
- 57.Koumangoye RB et al. SOX4 interacts with EZH2 and HDAC3 to suppress microRNA-31 in invasive esophageal cancer cells. Mol Cancer 14, 24 (2015). [DOI] [PMC free article] [PubMed] [Google Scholar]
- 58.Lee H, Habas R & Abate-Shen C MSX1 cooperates with histone H1b for inhibition of transcription and myogenesis. Science 304, 1675–8 (2004). [DOI] [PubMed] [Google Scholar]
- 59.Wang J et al. The Msx1 Homeoprotein Recruits Polycomb to the Nuclear Periphery during Development. Dev Cell 21, 575–88 (2011). [DOI] [PMC free article] [PubMed] [Google Scholar]
- 60.Rave-Harel N, Miller NL, Givens ML & Mellon PL The Groucho-related gene family regulates the gonadotropin-releasing hormone gene through interaction with the homeodomain proteins MSX1 and OCT1. J Biol Chem 280, 30975–83 (2005). [DOI] [PMC free article] [PubMed] [Google Scholar]
- 61.Watts JA et al. Study of FoxA pioneer factor at silent genes reveals Rfx-repressed enhancer at Cdx2 and a potential indicator of esophageal adenocarcinoma development. PLoS Genet 7, e1002277 (2011). [DOI] [PMC free article] [PubMed] [Google Scholar]
- 62.Sandoval GJ et al. Binding of TMPRSS2-ERG to BAF Chromatin Remodeling Complexes Mediates Prostate Oncogenesis. Mol Cell 71, 554–566.e7 (2018). [DOI] [PMC free article] [PubMed] [Google Scholar]
- 63.Barisic D, Stadler MB, Iurlaro M & Schubeler D Mammalian ISWI and SWI/SNF selectively mediate binding of distinct transcription factors. Nature 569, 136–140 (2019). [DOI] [PMC free article] [PubMed] [Google Scholar]
- 64.Hoffman JA, Trotter KW, Ward JM & Archer TK BRG1 governs glucocorticoid receptor interactions with chromatin and pioneer factors across the genome. Elife 7(2018). [DOI] [PMC free article] [PubMed] [Google Scholar]
- 65.Liu JK, DiPersio CM & Zaret KS Extracellular signals that regulate liver transcription factors during hepatic differentiation in vitro. Mol Cell Biol 11, 773–84 (1991). [DOI] [PMC free article] [PubMed] [Google Scholar]
- 66.Jackson DA et al. Modulation of liver-specific transcription by interactions between hepatocyte nuclear factor 3 and nuclear factor 1 binding DNA in close apposition. Mol. Cell. Biol 13, 2401–2410 (1993). [DOI] [PMC free article] [PubMed] [Google Scholar]
- 67.Meers MP, Janssens DH & Henikoff S Pioneer Factor-Nucleosome Binding Events during Differentiation Are Motif Encoded. Mol Cell (2019). [DOI] [PMC free article] [PubMed]
- 68.Gualdi R et al. Hepatic specification of the gut endoderm in vitro: cell signaling and transcriptional control. Genes Dev 10, 1670–82 (1996). [DOI] [PubMed] [Google Scholar]
- 69.Bossard P & Zaret KS GATA transcription factors as potentiators of gut endoderm differentiation. Development 125, 4909–4917 (1998). [DOI] [PubMed] [Google Scholar]
- 70.Cirillo LA & Zaret KS An early developmental transcription factor complex that is more stable on nucleosome core particles than on free DNA. Mol Cell 4, 961–9 (1999). [DOI] [PubMed] [Google Scholar]
- 71.Boller S et al. Pioneering Activity of the C-Terminal Domain of EBF1 Shapes the Chromatin Landscape for B Cell Programming. Immunity 44, 527–541 (2016). [DOI] [PubMed] [Google Scholar]
- 72.Li R et al. Dynamic EBF1 occupancy directs sequential epigenetic and transcriptional events in B-cell programming. Genes Dev 32, 96–111 (2018). [DOI] [PMC free article] [PubMed] [Google Scholar]
- 73.van Oevelen C et al. C/EBPalpha Activates Pre-existing and De Novo Macrophage Enhancers during Induced Pre-B Cell Transdifferentiation and Myelopoiesis. Stem Cell Reports 5, 232–47 (2015). [DOI] [PMC free article] [PubMed] [Google Scholar]
- 74.Sardina JL et al. Transcription Factors Drive Tet2-Mediated Enhancer Demethylation to Reprogram Cell Fate. Cell Stem Cell 23, 905–906 (2018). [DOI] [PMC free article] [PubMed] [Google Scholar]
- 75.Johnson JL et al. Lineage-Determining Transcription Factor TCF-1 Initiates the Epigenetic Identity of T Cells. Immunity 48, 243–257.e10 (2018). [DOI] [PMC free article] [PubMed] [Google Scholar]
- 76.Imbeault M, Helleboid PY & Trono D KRAB zinc-finger proteins contribute to the evolution of gene regulatory networks. Nature 543, 550–554 (2017). [DOI] [PubMed] [Google Scholar]
- 77.Sai li, E.B.Z., Li Zhao, Shixin Liu. Nonreciprocal and Conditional Cooperativity Directs the Pioneer Activity of Pluripotency Transcription Factors. bioRxiv, 40 (2019). [DOI] [PMC free article] [PubMed] [Google Scholar]
- 78.Yan C, Chen H & Bai L Systematic Study of Nucleosome-Displacing Factors in Budding Yeast. Mol Cell 71, 294–305 e4 (2018). [DOI] [PMC free article] [PubMed] [Google Scholar]
- 79.Henikoff S & Ramachandran S Pioneers Invade the Nucleosomal Landscape. Mol Cell 71, 193–194 (2018). [DOI] [PubMed] [Google Scholar]
- 80.Brahma S & Henikoff S RSC-Associated Subnucleosomes Define MNase-Sensitive Promoters in Yeast. Mol Cell 73, 238–249.e3 (2019). [DOI] [PMC free article] [PubMed] [Google Scholar]
- 81.Sekiya T, Muthurajan UM, Luger K, Tulin AV & Zaret KS Nucleosome-binding affinity as a primary determinant of the nuclear mobility of the pioneer transcription factor FoxA. Genes Dev 23, 804–9 (2009). [DOI] [PMC free article] [PubMed] [Google Scholar]
- 82.Donaghey J et al. Genetic determinants and epigenetic effects of pioneer factor occupancy. Nature Genetics (2018). [DOI] [PMC free article] [PubMed] [Google Scholar]
- 83.Hurtado A, Holmes KA, Ross-Innes CS, Schmidt D & Carroll JS FOXA1 is a key determinant of estrogen receptor function and endocrine response. Nat Genet 43, 27–33 (2011). [DOI] [PMC free article] [PubMed] [Google Scholar]
- 84.Jozwik KM & Carroll JS Pioneer factors in hormone-dependent cancers. Nat Rev Cancer 12, 381–5 (2012). [DOI] [PubMed] [Google Scholar]
- 85.Lupien M et al. FoxA1 translates epigenetic signatures into enhancer-driven lineage-specific transcription. Cell 132, 958–70 (2008). [DOI] [PMC free article] [PubMed] [Google Scholar]
- 86.Zhu F et al. The interaction landscape between transcription factors and the nucleosome. Nature 562, 76–81 (2018). [DOI] [PMC free article] [PubMed] [Google Scholar]
- 87.Fernandez Garcia M et al. Structural Features of Transcription Factors Associating with Nucleosome Binding. Mol Cell (2019). [DOI] [PMC free article] [PubMed]
- 88.Scholtz JM & Baldwin RL The mechanism of alpha-helix formation by peptides. Annu Rev Biophys Biomol Struct 21, 95–118 (1992). [DOI] [PubMed] [Google Scholar]
- 89.Zaret KS & Stevens K Expression of a highly unstable and insoluble transcription factor in Escherichia coli: purification and characterization of the fork head homolog HNF3 alpha. Protein Expr Purif 6, 821–825 (1995). [DOI] [PubMed] [Google Scholar]
- 90.Cuesta I, Zaret KS & Santisteban P The forkhead factor FoxE1 binds to the thyroperoxidase promoter during thyroid cell differentiation and modifies compacted chromatin structure. Mol Cell Biol 27, 7302–14 (2007). [DOI] [PMC free article] [PubMed] [Google Scholar]
- 91.Merzlyak EM et al. Bright monomeric red fluorescent protein with an extended fluorescence lifetime. Nat Methods 4, 555–7 (2007). [DOI] [PubMed] [Google Scholar]
- 92.Picelli S et al. Full-length RNA-seq from single cells using Smart-seq2. Nat Protoc 9, 171–81 (2014). [DOI] [PubMed] [Google Scholar]
- 93.Dobin A et al. STAR: ultrafast universal RNA-seq aligner. Bioinformatics 29, 15–21 (2013). [DOI] [PMC free article] [PubMed] [Google Scholar]
- 94.Love MI, Anders S, Kim V & Huber W RNA-Seq workflow: gene-level exploratory analysis and differential expression. F1000Res 4, 1070 (2015). [DOI] [PMC free article] [PubMed] [Google Scholar]
- 95.Love MI, Huber W & Anders S Moderated estimation of fold change and dispersion for RNA-seq data with DESeq2. Genome Biol 15, 550 (2014). [DOI] [PMC free article] [PubMed] [Google Scholar]
- 96.Huang da W, Sherman BT & Lempicki RA Bioinformatics enrichment tools: paths toward the comprehensive functional analysis of large gene lists. Nucleic Acids Res 37, 1–13 (2009). [DOI] [PMC free article] [PubMed] [Google Scholar]
- 97.Zhang Y et al. Model-based analysis of ChIP-Seq (MACS). Genome Biol 9, R137 (2008). [DOI] [PMC free article] [PubMed] [Google Scholar]
- 98.Heinz S et al. Simple combinations of lineage-determining transcription factors prime cis-regulatory elements required for macrophage and B cell identities. Mol Cell 38, 576–89 (2010). [DOI] [PMC free article] [PubMed] [Google Scholar]
Associated Data
This section collects any data citations, data availability statements, or supplementary materials included in this article.
Supplementary Materials
Data Availability Statement
Genomic data have been deposited in the Gene Expression Omnibus database under accession number GSE134465.


