

Abstract
Osteosarcoma is the most common primary malignant bone tumor in adolescents. While chemotherapy combined with surgery can improve the prognosis of some patients, chemo-resistance is still a huge obstacle in osteosarcoma treatment. Accumulating evidence demonstrates that circular RNAs (circRNAs) are involved in cancer progression and metastasis, but their specific role in osteosarcoma remains mostly undescribed. In this study, we performed circRNA deep sequencing and identified 88 distinct circRNAs from a human osteosarcoma cell lines group (143B, HOS, SJSA, and U2OS) and the human osteoblast hFOB 1.19 (control). We found that circCAMSAP1, also named hsa_circ_0004338, is significantly upregulated in human osteosarcoma tissues and cell lines, and it is positively correlated with osteosarcoma development. Silencing of circCAMSAP1 effectively suppresses osteosarcoma cell growth, apoptosis, migration, and invasion. Furthermore, we validated that circCAMSAP1 functions in osteosarcoma tumorigenesis through a circCAMSAP1/miR-145-5p/friend leukemia virus integration 1 (FLI1) pathway. FLI1 promotes osteosarcoma tumorigenesis and miR-145-5p suppresses FLI translation. circCAMSAP1 directly sequesters miR-145-5p in the cytoplasm and inhibits its activity to suppress osteosarcoma tumorigenesis. Moreover, the regulatory role of circCAMSAP1 upregulation was examined and validated in rats. In summary, our findings provide evidence that circCAMSAP1 act as a “microRNA sponge” and suggest a new therapeutic target of human osteosarcoma.
Graphical Abstract
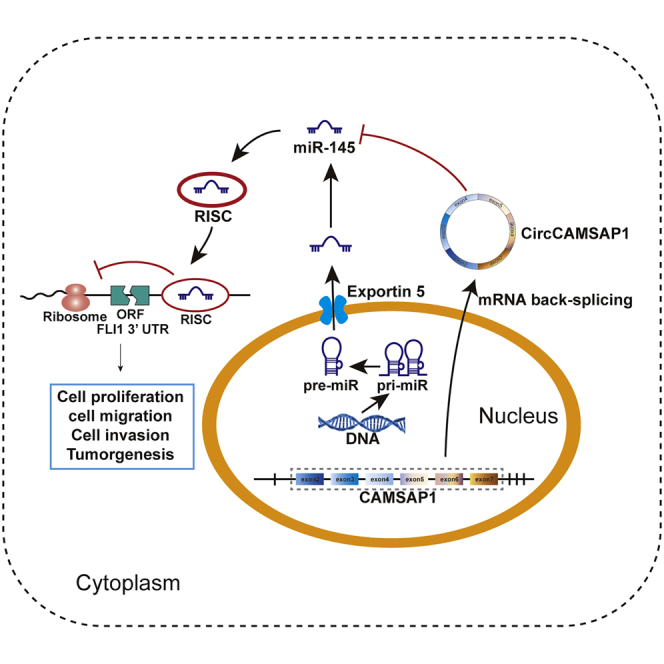
Osteosarcoma is the most common primary malignant bone tumor in adolescents. This study aims to explore the roles of circular RNA circCAMSAP1 in osteosarcoma and explore the underlying mechanisms. We showed that circCAMSAP1 is positively correlated with osteosarcoma tumorigenesis, and we validated that circCAMSAP1 functions through a circCAMSAP1/miR-145-5p/FLI1 pathway.
Introduction
Osteosarcoma (OS) is the most common form of bone cancer among adolescents and adults, with a tendency of rapid progression and a high metastatic potential.1 It is reported that the 5-year survival rate of localized osteosarcoma is 69%, while for metastatic osteosarcoma the rate dropped to only 15%–30%.2,3 Every year osteosarcoma contributes to a large share of cancer-associated deaths worldwide.4 Although new surgery approaches and neoadjuvant chemotherapy are widely used to treat osteosarcoma, the effectiveness of these therapies remains unsatisfied. Neither the short- or long-term survival rate of osteosarcoma has seen little change during the last three decades. At present, almost 80% of osteosarcoma can spread to lungs and is related with a poor prognosis.5 Unfortunately, with a complex karyotype and a high level of genomic and chromosomal instability, osteosarcoma is much more difficult to treat than other sarcomas characterized by specific chromosome translocations.6 Therefore, much remains to be developed for osteosarcoma treatment.
Circular RNAs (circRNAs) have gradually drawn the attention of researchers worldwide. Being widely expressed in eukaryotic cells, circRNAs are formed during back-splicing or exon skipping, and they have covalently closed-loop structures without 5′→3′ polarity.7, 8, 9 Due to their relatively low expression, circRNAs were largely ignored in recent decades and were previously considered as byproducts or transcriptional errors. Thanks to recent research, circRNAs have been shown to play an important part in gene regulation, neural development, carcinogenesis, and intestinal self-renewal.10, 11, 12, 13 Additionally, growing evidence indicates that circRNAs can influence carcinogenesis in osteosarcoma.14, 15, 16, 17, 18 Previous studies reported that circRNAs acted as competing endogenous RNAs (ceRNAs) by turning into “microRNA (miRNA) sponges,” i.e., miRNA inhibitors.19,20
As a member of the erythroblast transformation-specific (ETS) transcription factor family, the friend leukemia virus integration 1 (FLI1) gene plays a pivotal part in cellular development, hematopoiesis, and oncogenesis by functioning either as a transcriptional activator or repressor, and it is correlated with a poor survival in some cancers.21, 22, 23, 24, 25 Previous studies further demonstrated that FLI1 promoted tumorigenesis by activating the miR-17-92 pathway or miR-145-5p pathway in small cell lung cancer cells or osteosarcoma cells.25,26
In this study, by performing RNA sequencing (RNA-seq) analyses, we detected and characterized a circRNA (has_circ_0004338, termed circCAMSAP1) in osteosarcoma and systemically investigated its role in vitro and in animal models of osteosarcoma.
Results
circCAMSAP1 is relatively highly expressed in osteosarcoma tissues and cell lines and predominantly localized in cytoplasm
To generate a circRNA profiling database, we performed RNA-seq analyses of ribosomal RNA-depleted total RNA from the human osteosarcoma cell lines group (143B, HOS, SJSA, and U2OS) and the human osteoblast hFOB 1.19 (control). A total of 11,583 circRNAs were identified by both CIRI2 and CIRCexplorer. Differentially expressed circRNAs were sorted by their fold change (FC ≥ 2.0, false discovery rate [FDR] < 0.05), and a heatmap was drawn to show the 88 differentially expressed circRNAs (Figure 1A). To validate the RNA sequencing results, we performed quantitative real-time PCR analysis to identify the four most differentially expressed circRNAs (Table S2) and confirmed one upregulated circRNA (CIRI_circ_8222, whose circBase ID is hsa_circ_0004338) (Figure S1). This circRNA is derived from the human CAMSAP1 gene locus, also named as circCAMSAP1. To investigate the role of circCAMSAP1 in osteosarcoma development, we tested the expression level of circCAMSAP1 in 10 pairs of chondroma and osteosarcoma tissues and in osteosarcoma cell lines (143B, HOS, U2OS, and SJSA). Using quantitative real-time PCR, we verified with specially designed divergent primers that circCAMSAP1 existed in osteosarcoma tissues and cell lines. We found that circCAMSAP1 was upregulated in osteosarcoma tissues and cell lines (Figures 1B and 1C). In addition, we verified the difference of circCAMSAP1 expression between chondroma and osteosarcoma tissues by an RNA fluorescence in situ hybridization (FISH) assay (Figure 1D). By comparing CAMSAP1 mRNA sequences with the expected sequences of circCAMSAP1 acquired from circBase, we determined that circCAMSAP1 was looped and comprised of exons 2–7 of its parental gene. We then confirmed the head-to-tail splicing via Sanger sequencing (Figure 1E). However, head-to-tail splicing can be produced by genomic rearrangement or trans-splicing. To rule out these two possibilities, we designed convergent primers for CAMSAP1 mRNA and divergent primers for circCAMSAP1. Previous study considered circRNAs as stable nucleic acids.27
Figure 1.

circCAMSAP1 is relatively highly expressed in osteosarcoma tissues and cells and predominantly localized in cytoplasm
(A) Heatmap and hierarchical clustering analysis based on osteosarcoma cell lines and hFOB 1.19. (B) The expression of circCAMSAP1 in human osteosarcoma and chondroma tissue was detected by real-time PCR. Data are represented as mean ± SEM (n = 10). ∗∗p < 0.01. (C) The expression levels of circCAMSAP1 in hFOB 1.19 and osteosarcoma cell lines (143B, HOS, U2OS, and SJSA) were detected by real-time PCR. Data are represented as mean ± SEM (n = 3). ∗∗p < 0.01, ∗∗∗p < 0.001. (D) The expression of circCAMSAP1 in human osteosarcoma and chondroma tissue was detected by RNA fluorescence in situ hybridization (FISH). Scale bars, 50 μm. (E) Schematic illustration shows the CAMSAP1 exon 2–7 circularization forming circCAMSAP1 (left arrow). The presence of circCAMSAP1 was validated by real-time PCR, followed by Sanger sequencing. Right arrow represents “head-to-tail” circCAMSAP1 splicing sites. (F) The expression of circCAMSAP1 and CAMSAP1 mRNA in 143B and HOS cells treated with or without RNase R was detected by real-time PCR. The relative levels of circCAMSAP1 and CAMSAP1 mRNA were normalized to the value measured in the mock treatment. Data are represented as mean ± SD (n = 3). ∗∗∗p < 0.001. (G) The presence of circCAMSAP1 was validated in 143B and HOS osteosarcoma cell lines by real-time PCR. Divergent primers were amplified circCAMSAP1 in cDNA, but not in genomic DNA. GAPDH was used as a negative control. (H) RNA FISH with junction-specific probes demonstrated the cellular localization of circCAMSAP1. circCAMSAP1 probes were labeled with Alexa Fluor 488, and nuclei were stained with DAPI. Scale bars, 50 μm. p values were determined by a Student’s t test.
Using quantitative real-time PCR, we verified that circCAMSAP1 was resistant to RNase R, while the expression of CAMSAP1 mRNA was significantly reduced with RNase R treatment (Figure 1F). We extracted cDNA and genomic DNA from the HOS and 143B cell lines and used them as quantitative real-time PCR templates. The results showed that circCAMSAP1 was only amplified by divergent primers in cDNA, whereas no amplification product was detected in genomic DNA (Figure 1G). To demonstrate the cellular localization of circCAMSAP1, we conducted an RNA FISH assay. The junction probe detected abundant cytoplasmic circCAMSAP1 expression in 143B and HOS cells (Figure 1H).
circCAMSAP1 regulated migration, invasion, and proliferation of osteosarcoma cells in vitro
To explore the function of circCAMSAP1 in osteosarcoma cells, we transfected small interfering RNA (siRNA) specifically designed to target the junction of circCAMSAP1 into 143B and HOS cells and established effective transfectants. The expression of circCAMSAP1 was significantly decreased in these effective transfectants, and the expression of CAMSAP1 mRNA stayed largely unchanged (Figure 2A). Decreased expression of circCAMSAP1 significantly increased the proportion of apoptotic cells in 143B and HOS cells (Figure 2B). A wound healing assay demonstrated that knockdown of circCAMSAP1 significantly inhibited cell migration in 143B and HOS cells (Figure 2C). Consistently, knockdown of circCAMSAP1 also suppressed migration and invasion of osteosarcoma cell lines in Transwell migration and Matrigel invasion assays (Figures 2D and 2E). Considering the toxicity of the transfection system, we compared the viability of cells cultured with or without transfection reagent before determining the cell viability in comparison to control cells. The results showed that the transfection reagent had little impact on cell viability (Figure S2A). With circCAMSAP1 knocked down, the viability of 143B and HOS cells was significantly reduced compared with their control cells (Figures 2F and 2G). Meanwhile, using a plate colony formation assay, we found that the number of colonies was substantially reduced in the circCAMSAP1-siRNA group, indicating that knockdown of circCAMSAP1 suppressed the colony formation ability of 143B and HOS cells (Figure 2H). Additionally, circCAMSAP1 overexpression promoted the viability and migration ability of osteosarcoma cells (Figures S2B–S2D). These findings indicated that circCAMSAP1 regulated migration, invasion, and proliferation of osteosarcoma cells in vitro.
Figure 2.

circCAMSAP1 regulates migration, invasion, and proliferation of osteosarcoma cells in vitro
(A) The expression levels of circCAMSAP1 and CAMSAP1 mRNA in 143B and HOS cell lines after transfection of small interfering RNA (siRNA) or negative control (NC)-siRNA, detected by real-time PCR. Data are represented as mean ± SEM (n = 3). ∗∗∗p < 0.001. (B) Downregulation of circCAMSAP1 resulted in more apoptotic 143B and HOS cells than those transfected with the NC-siRNA. Apoptosis rates were determined with annexin V-FITC/PI staining. Data are represented as mean ± SEM (n = 3). ∗p < 0.05, ∗∗p < 0.01. (C) circCAMSAP1 knockdown suppressed cell migration ability, as demonstrated by the wound healing assay in 143B and HOS cell lines. Data are represented as mean ± SEM of three independent experiments. ∗∗p < 0.01, ∗∗∗p < 0.001. (D) Cell migration ability of 143B and HOS cell lines after transfection of siRNA or NC-siRNA was analyzed with the Transwell migration assay. Data are represented as mean ± SEM of three independent experiments. ∗∗p < 0.01, ∗∗∗p < 0.001. (E) Cell invasion ability of 143B and HOS cell lines after transfection of siRNA or NC-siRNA was analyzed with the Transwell Matrigel invasion assay. Data are represented as mean ± SEM of three independent experiments. ∗p < 0.05, ∗∗p < 0.01, ∗∗∗p < 0.001. (F and G) circCAMSAP1 knockdown suppressed cell proliferation, as demonstrated by the CCK-8 assay in 143B and HOS cell lines. Data are represented mean ± SEM (n = 3). ∗p < 0.05. (H) circCAMSAP1 knockdown suppressed cell growth, as demonstrated by the colony formation assay in 143B and HOS cell lines. Data are represented as mean ± SEM of three independent experiments. ∗p < 0.05, ∗∗p < 0.01, ∗∗∗p < 0.001. p values were determined by a Student’s t test.
circCAMSAP1 abundantly sponges miR-145-5p in osteosarcoma cells
Current studies have revealed that some circRNAs have been verified as miRNA sponges, harboring multiple miRNAs and functioning as miRNA inhibitors.19,20,28,29 To address whether circCAMSAP1 could sponge miRNAs in osteosarcoma cells, we found six candidates by overlapping the prediction results of miRNA recognition elements in circCAMSAP1 sequence by using miRanda, TargetScan, CircInteractome, and RNAhybrid (Figure 3A). The levels of the six candidate miRNAs were determined by three methods. First, we designed primers for each candidate miRNA and tested the level of each candidate by real-time PCR in 143B, HOS, and hFOB 1.19 (the negative control) cell lines. As shown in Figure 3B, two miRNAs were relatively lowly expressed in 143B and HOS cell lines compared with hFOB 1.19. Next, a pull-down assay was performed, and Figures 3C and 3D show that miR-145-5p was pulled down by circCAMSAP1. Furthermore, we mutated each of the six miRNA predicted target sites using a luciferase reporter including circCAMSAP1 in 3′ untranslated regions (UTRs). Compared with the control, only miR-145-5p reduced the luciferase reporter activity significantly (Figure 3E). Because miR-145-5p decreased luciferase activity to the greatest extent, and circCAMSAP1 contained an miR-145-5p 7-mer-m8 binding site (Figure 3F, upper panel), we transfected miR-145-5p mimics into HEK293T cells and observed that the luciferase activities of the wild-type (WT) reporter were significantly reduced compared with the mutant (Mut) reporter (Figure 3F, lower panel). Moreover, the RNA FISH assay revealed that circCAMSAP1 interacted with miR-145-5p in the cytoplasm of osteosarcoma cells and tissues (Figure 3G). These results demonstrated that circCAMSAP1 could directly bind to miR-145-5p in 143B and HOS cells.
Figure 3.

circCAMSAP1 abundantly sponges miR-145-5p in osteosarcoma cells
(A) Schematic illustration showing the overlapping results of the target miRNAs of circCAMSAP1 as predicted by miRanda, TargetScan, RNAhybrid, and CircInteractome. (B) The relative level of six miRNA candidates in the hFOB 1.19, 143B, and HOS lysates was detected by real-time PCR. Data are represented as mean ± SEM (n = 3). ∗p < 0.05, ∗∗p < 0.01, ∗∗∗p < 0.001. (C and D) Lysates prepared from 143B and HOS cells were subjected to an RNA pull-down assay and tested with quantitative real-time PCR. Relative levels of circCAMSAP1 were normalized to the levels of input. n = 3. ∗p < 0.05 versus control (lacZ) probe. (E) Luciferase reporter assay for the luciferase activity of LUC-circCAMSAP1 or LUC-circCAMSAP1 mutant in HEK293T cells co-transfected with miRNA mimics. Data are represented as mean ± SD for three experiments. ∗∗p < 0.01. (F) Upper panel: schematic illustration demonstrates complementary to the miR-145-5p seed sequence with circCAMSAP1. Lowercase letters indicate mutated nucleotides. Lower panel: HEK293T cells were co-transfected with miR-145-5p mimics and a luciferase reporter construct containing wild-type (WT) or mutated circCAMSAP1. Data are represented as mean ± SD (n = 3). ∗∗p < 0.01. (G) RNA FISH images demonstrate the co-localization of circCAMSAP1 and miR-145-5p in 143B and HOS cell lines and osteosarcoma tissue samples. circCAMSAP1 probes were labeled with Alexa Fluor 488; miR-145-5p probes were labeled with Cy3. Nuclei were stained with DAPI. Scale bars, 200 and 50 μm. p values were determined by a Student’s t test.
miR-145-5p is downregulated in osteosarcoma tissues and cell lines and inhibits cell migration, invasion, and proliferation in vitro
It has been reported that miR-145-5p can inhibit migration, invasion, and proliferation in osteosarcoma.30 Using real-time PCR and FISH, we found that miR-145-5p was downregulated in human osteosarcoma tissues compared with chondroma tissues (Figures 4A and 4B). miR-145-5p was also downregulated in osteosarcoma cell lines compared with hFOB 1.19 (Figure 4C). To investigate the function of miR-145-5p in osteosarcoma cell lines, we performed miRNA overexpression and inhibition experiments. The expression of miR-145-5p was significantly increased after being transfected with miR-145-5p mimics, and the expression of miR-145-5p was significantly decreased after being transfected with miR-145-5p inhibitor (Figure 4D). Overexpression of miR-145-5p significantly promoted the proportion of apoptotic cells in 143B and HOS cells (Figures 4E and 4F). The viability of 143B and HOS cells whose miR-145-5p was overexpressed was significantly reduced compared with their control cells (Figures 4G and 4H). Meanwhile, the Transwell and wound healing assays demonstrated that overexpression of miR-145-5p significantly inhibited cell migration and invasion in 143B and HOS cells (Figures 4I and 4K). Consistently, miR-145-5p overexpression also suppressed colony formation compared with control cells (Figure 4M). Due to dicer-like activity, miRNAs could downregulate levels of circRNAs and thus confound results. Therefore, we performed the miRNA overexpression experiment, and the relative level of circCAMSAP1 was not influenced by the overexpression of miR-145-5p (Figure S3A). To clarify the effect of miR-145-5p mimics on osteosarcoma, we treated osteosarcoma cells with different doses of miR-145-5p mimics. Results showed that miR-145-5p mimics suppressed the viability and migration ability of osteosarcoma cells in a dose-dependent manner (Figures S3B–S3D). In contrast, transfection of miR-145-5p inhibitor promoted migration, invasion, and colony formation, and it suppressed the cell apoptosis of 143B and HOS cells (Figures 4H, 4J, 4L, and 4N). These results revealed that miR-145-5p was able to remarkably inhibit the migration, invasion, and proliferation of osteosarcoma cells in vitro.
Figure 4.

miR-145-5p is downregulated in osteosarcoma cells and inhibits cell migration, invasion, and proliferation in vitro
(A) miR-145-5p was downregulated in human osteosarcoma tissue compared with chondroma tissue, as detected by real-time PCR. Data are represented as mean ± SEM (n = 10). ∗p < 0.05. (B) RNA FISH images demonstrated that miR-145 expression was lower in human osteosarcoma tissue than in chondroma tissue. miR-145-5p probes were labeled with Cy3. Nuclei were stained with DAPI. Scale bars, 100 and 50 μm. (C) miR-145-5p was downregulated in osteosarcoma cell lines (143B, HOS, and U2OS) compared with hFOB 1.19, detected by real-time PCR. Data are represented as mean ± SEM (n = 10). ∗p < 0.05, ∗∗p < 0.01, ∗∗∗p < 0.001. (D) The expression of miR-145-5p in 143B and HOS cell lines was detected by real-time PCR. Data are represented as mean ± SEM (n = 3). ∗p < 0.05, ∗∗p < 0.01, ∗∗∗p < 0.001. (E and F) 143B and HOS cells were transfected with miR-145-5p mimic or inhibitor, and apoptosis rates were determined with annexin V-FITC/PI staining. The percentage of apoptosis cells is shown as mean ± SEM from three independent experiments. ∗p < 0.05, ∗∗p < 0.01. (G and H) miR-145-5p mimic/inhibitor can suppress/promote 143B and HOS cell line proliferation, as determined by the CCK-8 assay. Data are represented as mean ± SEM (n = 3). ∗p < 0.05, ∗∗p < 0.01, ∗∗∗p < 0.001. (I and J) Cell migration and invasion of HOS and 143B cells, transfected with miR-145-5p mimic or inhibitor, were evaluated by Transwell migration and Matrigel invasion assays. Data are represented as mean ± SEM (n = 3). ∗p < 0.05, ∗∗p < 0.01, ∗∗∗p < 0.001. (K and L) miR-145-5p mimic or inhibitor regulated cell migration ability, as demonstrated by the wound healing assay in 143B and HOS cell lines. Data are represented as mean ± SEM of three independent experiments. ∗p < 0.05, ∗∗p < 0.01. (M and N) miR-145-5p overexpression or knockdown regulated cell growth, as determined by the colony formation assay. Data are represented mean ± SEM of three independent experiments. ∗p < 0.05, ∗∗p < 0.01, ∗∗∗p < 0.001. p values were determined by a Student’s t test.
miR-145-5p targets FLI1 in osteosarcoma cells
To illuminate the function of miR-145-5p in osteosarcoma, we used TargetScan and the PicTar algorithm to predict potential targets of miR-145-5p, and four candidate tumor-associated genes (FLI1, TPT1, FSCN-1, and MYO5a) were selected. Next, we investigated whether miR-145-5p could directly bind the mRNAs of these candidate genes. We designed primers for each candidate gene, and the mRNA levels of four candidate genes were detected by real-time PCR. As shown in Figure 5A, the FLI1 mRNA was relatively highly expressed in four osteosarcoma cell lines compared with hFOB 1.19, i.e., the negative control. Consistently, FLI1 mRNA levels were higher in osteosarcoma than in chondroma tissues (Figure 5B). Furthermore, we observed that FLI1 was overexpressed in osteosarcoma tissues compared with chondroma tissues from our immunohistochemistry results (Figure 5C).
Figure 5.

miR-145-5p targets FLI1 in osteosarcoma cells and tissues
(A) Relative expression mRNA levels of four gene candidates in osteosarcoma cell lines (143B, HOS, U2OS, and SJSA) compared with hFOB 1.19, as detected by real-time PCR. Data are represented as mean ± SEM (n = 10). ∗p < 0.05, ∗∗p < 0.01, ∗∗∗p < 0.001. (B) FLI1 expression levels were upregulated in human osteosarcoma tissue compared with chondroma tissues, as detected by real-time PCR. Data are represented as mean ± SEM (n = 10). ∗∗p < 0.01. (C) FLI1 expression was higher in human osteosarcoma than in chondroma tissue. Representative images are shown. Scale bars, 100 μm. (D) Upper panel: schematic illustration demonstrates complementary to the miR-145-5p-5p seed sequence with FLI1. Lowercase letters indicate mutated nucleotides. Lower panel: HEK293T cells were co-transfected with miR-145-5p mimics and a luciferase reporter construct containing WT or mutated FLI1. Data are represented as mean ± SEM (n = 3). ∗p < 0.05, ∗∗p < 0.01. (E) Quantitative real-time PCR analysis of FLI1 mRNA levels in RNA sample by miR-145-5p miRNA pull-down. Data are represented as mean ± SEM (n = 3). ∗∗∗p < 0.001. (F and G) miR-145-5p inhibition increased FLI1 and c-Myc and decreased IGFBP3 protein (E) and mRNA levels (F), and miR-145-5p overexpression reduced FLI1 and c-Myc and increased IGFBP3 protein (E) and mRNA levels (F). ∗p < 0.05, ∗∗p < 0.01, ∗∗∗p < 0.001. (H) Knockdown of FLI1 promoted apoptosis in 143B and HOS cells. Apoptosis rates were determined by annexin V-FITC/PI staining. Data are represented as mean ± SEM (n = 3). ∗∗∗p < 0.001. p values were determined by a Student’s t test.
To corroborate whether FLI1 is a direct target of miR-145-5p, we constructed a luciferase reporter including the 3′ UTR of FLI1 as a WT reporter (Figure 5D, upper panel). To verify specificity, we constructed a mutated form of the FLI1 3′ UTR, in which the binding-site of miR-145-5p was eliminated. The luciferase activities were significantly reduced when HEK293T cells were co-transfected with the WT reporter and miR-145-5p mimics, indicating that miR-145-5p specifically regulated FLI1 expression (Figure 5D, lower panel). Furthermore, a miR-145-5p pull-down assay showed that biotinylated miR-145-5p mimic enriched FLI1 mRNA, suggesting that FLI1 is the target gene of miR-145-5p (Figure 5E). Additionally, transfection of miR-145-5p mimics affected endogenous FLI1 protein and mRNA levels, as well as the FLI1-targeted genes c-Myc and IGFBP3 (Figures 5F and 5G). Moreover, reducing endogenous miR-145-5p levels (using miR-145-5p inhibitor) had an opposite effect in both cell lines (Figures 5F and 5G). These results indicated that miR-145-5p targeted FLI1 in osteosarcoma. Consistent with previous studies of miR-145,26 we found that miR-145-5p targeted FLI1 and acted as a tumor suppressor by directly reducing expression of FLI1.
To explore the function of FLI1 in osteosarcoma cells, we transfected FLI1-siRNA into 143B and HOS cells to knock down FLI1 expression and established effective transfectants. The expression of FLI1 was significantly decreased after being transfected with FLI1-siRNA (Figure S4A). Decreased expression of FLI1 significantly increased the proportion of apoptotic cells in 143B and HOS cells (Figure 5H). With FLI1 knocked down, the viability of 143B and HOS cells was significantly reduced compared with their control cells (Figures S4B and S4C). Consistently, knockdown of FLI1 also suppressed migration and invasion of osteosarcoma cell lines in Transwell migration and Matrigel invasion assays (Figures S4D and S4E). A wound healing assay demonstrated that knockdown of FLI1 significantly inhibited cell migration in 143B and HOS cells (Figure S4F). FLI1 knockdown also suppressed colony formation compared with control cells (Figure S4G). These findings indicated that FLI1 plays an important role in osteosarcoma cells in vitro.
Overexpression of FLI1 reverses miR-145-induced attenuation of cell migration, invasion, and proliferation in osteosarcoma cells
We further investigated whether miR-145-5p suppressed migration and invasion of osteosarcoma cells via inhibiting FLI1. FLI1 overexpression reduced the high apoptosis rates caused by miR-145-5p mimics (Figure 6A). Meanwhile, the increased level of FLI1 abrogated the inhibition of migration and invasion abilities of osteosarcoma cells induced by miR-145-5p overexpression (Figures 6B and 6D) and the inhibition of growth (Figure 6C) and colony formation (Figure 6E). These results support that miR-145-5p targeted FLI1 and mediated the tumor-suppressive function of miR-145-5p.
Figure 6.

Overexpression of FLI1 reverses miR-145-5p-mimic-induced attenuation of cell migration, invasion, and proliferation in osteosarcoma cells
(A) 143B and HOS cells were co-transfected with miR-145-5p and FLI1 plasmids or control vector, and apoptosis rates were determined with annexin V-FITC/PI staining. The percentage of apoptosis cells is shown as mean ± SEM from three independent experiments. ∗∗∗p < 0.001. (B) Cell migration and invasion of HOS and 143B cells, co-transfected with miR-145-5p and FLI1 plasmids or control vector, were evaluated by Transwell migration and Matrigel invasion assays. Data are represented as mean ± SEM (n = 3). ∗p < 0.05, ∗∗∗p < 0.001. (C) Proliferation of osteosarcoma cells, co-transfected with miR-145-5p and FLI1 plasmids or control vector, were determined by the CCK-8 assay. Data are represented as mean ± SEM (n = 3). ∗p < 0.05, ∗∗p < 0.01. (D) FLI1 overexpression promoted the migration ability of miR-145-5p overexpression cells, as demonstrated by the wound healing assay in 143B and HOS cell lines. Data are represented as mean ± SEM of three independent experiments. ∗p < 0.05, ∗∗p < 0.01, ∗∗∗p < 0.001. (E) FLI1 overexpression promoted the growth of miR-145-5p overexpression cells, as determined by the colony formation assay. Data are represented as mean ± SEM of three independent experiments. ∗∗∗p < 0.001. p values were determined by a Student’s t test.
Knockdown of miR-145-5p reverses shCircCAMSAP1-induced attenuation of cell migration, invasion, and proliferation in osteosarcoma cells
In osteosarcoma cells with an effective knockdown of circCAMSAP1, the expression level of FLI1 was significantly decreased. To verify whether circCAMSAP1 promoted cell migration, invasion, and proliferation in osteosarcoma cells via interacting with miR-145-5p, we co-transfected a circCAMSAP1 knockdown construct (short hairpin RNA [shRNA] against circCAMSAP1 [shCircCAMSAP1]) and a miR-145-5p sponge into osteosarcoma cells. First, however, we wanted to test whether the shRNA against circCAMSAP1 increases the levels of miR-145-5p. The results of quantitative real-time PCR showed that shRNA would not influence the level of miR-145-5p (Figure 7A). Next, our results showed that both the protein and mRNA expression levels of FLI1 and target genes c-Myc and IGFBP3 were significantly increased in the osteosarcoma cell lines co-transfected with shCircCAMSAP1 and the miR-145-5p sponge compared with shCircCAMSAP1 alone (Figures 7B and 7C). Growth rates of osteosarcoma cells were rescued when co-transfected with circCAMSAP1-siRNA and miR-145-5p inhibitor (Figure 7D). Meanwhile, knockdown of both circCAMSAP1 and miR-145-5p also resulted in a lower apoptotic rate than in the circCAMSAP1 inhibition group (Figure 7E). Furthermore, Transwell migration and Matrigel invasion assays together with wound healing assays indicated that the osteosarcoma cells co-transfected with shCircCAMSAP1 and a miR-145-5p sponge increased invasion and migration capabilities compared with shCircCAMSAP1-transfected cells (Figures 7F and 7H). Consistently, knockdown of both circCAMSAP1 and miR-145-5p also rescued colony formation capabilities compared with the circCAMSAP1 inhibition group (Figure 7G). In summary, our results suggest that circCAMSAP1 promotes cell migration, invasion, and proliferation in osteosarcoma cells by sponging miR-145-5p and subsequently induces FLI1 expression in vitro.
Figure 7.

Knockdown of miR-145-5p reverses shCircCAMSAP1-induced attenuation of cell migration, invasion, and proliferation in osteosarcoma cells
(A) 143B and HOS cells were transfected with control vector or shCircCAMSAP1, respectively. The relative level of miR-145-5p was detected by quantitative real-time PCR analysis. Data are represented as mean ± SEM (n = 3). (B) The protein expression of FLI1, c-Myc, and IGFBP3 in 143B and HOS cells was detected by western blot analysis. Cells were co-transfected with shCircCAMSAP1 and miR-145-5p sponge or control vector. (C) The mRNA expression of FLI1, c-Myc, and IGFBP3 in 143B and HOS cells was detected by quantitative real-time PCR analysis. Cells were transfected with control vector and shCircCAMSAP1 with or without miR-145-5p sponge. Data are represented as mean ± SEM (n = 3). ∗p < 0.05, ∗∗p < 0.01, ∗∗∗p < 0.001. (D) Proliferation of osteosarcoma cells, co-transfected with control vector and shCircCAMSAP1 with or without miR-145-5p sponge, were determined by a CCK-8 assay. Data are represented as mean ± SEM (n = 3). ∗∗p < 0.01. (E) 143B and HOS cells were co-transfected with control vector and shCircCAMSAP1 with or without miR-145-5p sponge, and apoptosis rates were determined with annexin V-FITC/PI staining. The percentage of apoptosis cells is shown as the mean ± SEM from three independent experiments. ∗∗p < 0.01, ∗∗∗p < 0.001. (F) Cell migration and invasion of 143B and HOS cells, co-transfected with control vector and shCircCAMSAP1 with or without miR-145-5p sponge, were evaluated by Transwell migration and Matrigel invasion assays. Data represent the mean ± SEM (n = 3). ∗p < 0.05, ∗∗p < 0.01, ∗∗∗p < 0.001. (G) miR-145-5p knockdown promoted the growth of circCAMSAP1 knockdown cells, as determined by the colony formation assay. Data represent the mean ± SEM of three independent experiments. ∗∗∗p < 0.001. (H) miR-145-5p knockdown promoted the migration ability of circCAMSAP1 knockdown cells, as demonstrated by the wound healing assay in 143B and HOS cell lines. Data represent the mean ± SEM of three independent experiments. ∗∗p < 0.01, ∗∗∗p < 0.001. p values were determined by a Student’s t test.
Knockdown of circCAMSAP1 suppresses tumorigenesis in vivo
Next, we investigated the effect of circCAMSAP1 and miR-145-5p on regulating tumor growth in vivo. 143B cells stably transfected with shCircCAMSAP1, shCircCAMSAP1 and miR-145-5p sponge, or the control vector were subcutaneously injected into nude mice. shCircCAMSAP1 transfectants had a decreased growth rate and tumor weight compared with the vector group, while cells deficient in circCAMSAP1 and miR-145-5p had a similar growth rate and tumor weight compared with the vector group (Figures 8A–8D).
Figure 8.

Knockdown of circCAMSAP1 suppresses tumorigenesis in vivo
(A and B) Nude mice were injected with 5 × 10⁶ 143B stable cells. Tumors were dissected and photographed after 5 weeks. (C) miR-145-5p knockdown promoted the tumor growth rate of circCAMSAP1 knockdown cells, and tumor volumes were evaluated by the equation v = ab2/2. Data represent the mean ± SEM (n = 6). ∗p < 0.05. (D) Average tumor weight in each group at the end of the experiment (day 35). Data represent the mean ± SEM (n = 6). ∗p < 0.05, ∗∗p < 0.01. (E) Histological analysis of tumor tissues by hematoxylin and eosin staining. FLI1, cleaved caspase-3, c-Myc, IGF1, and IGFBP3 expression levels were examined by immunohistochemistry. Scale bars, 100 μm. (F) Western blot analysis of FLI1, c-Myc, and IGFBP3 in tumors from xenograft mice. (G) Quantitative real-time PCR analysis of FLI1, c-Myc and IGFBP3 expression in tumors from xenograft mice. ∗∗p < 0.01, ∗∗∗p < 0.001. (H) Schematic illustration of the circCAMSAP1/miR-145-5p/FLI1 axis. p values were determined by a Student’s t test.
In xenograft tumor tissues, immunohistochemical staining showed that the expression of FLI1 was inhibited by shCircCAMSAP1, which corresponded to the reduction in the level of FLI1 protein and mRNA (Figures 8E–8G). Immunohistochemical staining also showed that the expression levels of cleaved caspase-3 and IGFBP3 were promoted, and the expression levels of FLI1 and c-Myc were inhibited (Figure 8E). Inhibition of miR-145-5p reversed this effect (Figures 8E–8G). Moreover, Kaplan-Meier survival curves of The Cancer Genome Atlas (TCGA) sarcoma dataset showed that the patients with a high expression of FLI1 had a lower 10-year overall survival rate, while the patients with a high expression of miR-145-5p had a higher 10-year overall survival rate (Figure S5). These results suggest that circCAMSAP1 and miR-145-5p could be valuable markers to predict the prognosis of patients with osteosarcoma.
Discussion
circRNA is an abundant, stable, and conserved type of noncoding RNA and was once regarded as a byproduct of biological processes. Evidence has shown that circRNAs are related with the progression and metastasis of various cancers, including liver,31,32 brain,33 lung,34 bladder,35 and breast cancer.36 By performing RNA-seq analyses of ribosomal RNA-depleted total RNA from the human osteosarcoma cell lines group and the human osteoblast hFOB 1.19 (control), we generated a circRNA profiling database. From sequencing data, 11,583 circRNAs were identified. Differentially expressed circRNAs were sorted by their FC (FC ≥ 2.0, FDR < 0.05), and a heatmap was made to show the 88 differentially expressed circRNAs. We identified and selected one circRNA derived from the human CAMSAP1 gene locus, termed hsa_circ_0004338 (also named as circCAMSAP1), which was the most significantly upregulated circRNA.
The CAMSAP1 gene encodes a cytoskeleton-associated protein expressed in mammalian astrocytes and neurons.37 Previous studies have shown the important role of CAMSAP1 in brain cancer and its correlation with the prognosis of patients with laryngeal squamous cell carcinoma (LSCC).38 Additionally, CAMSAP1, expressed on mature astrocytes in the adult brain, has also been recognized as a new marker for astrocytic lineage cells.39 Although hsa_circ_0001900 (originating from exon 2 to 3 of the CAMSAP1 gene, also named circCAMSAP1) has been verified to play important roles in colorectal cancer,40 the role of hsa_circ_0004338 (the circCAMSAP1 of this study) remains uninvestigated, either in pathological or biological processes. In the present study, we verified that circCAMSAP1, upregulated in osteosarcoma tissues with a predominantly cytoplasmic localization, was derived from exon 1 to 7 of the CAMSAP1 gene and formed a single-stranded continuous loop structure by joining the 3′ and 5′ terminal splice sites. These features indicate that circCAMSAP1 is formed by “direct splicing” and is stably expressed in different cell lines and tissues.8 The circCAMSAP1 expression has been identified to be generally upregulated in osteosarcoma compared with chondroma, indicating that circCAMSAP1 might be a crucial event in osteosarcoma tumorigenesis and metastasis.
Recent studies have demonstrated that circRNAs have multiple functions, among which the miRNA sponge was mostly reported.41, 42, 43, 44 These circRNAs harbor several miRNA binding sites and can sponge certain miRNAs with a high efficiency. Due to the dynamic interaction between circRNAs and miRNAs, this type of regulation is overly complex. In our study, six potential miRNAs with several circCAMSAP1 binding sites were identified by computational algorithms. Luciferase activity assays can efficiently identify the precise and authentic interactions between circRNAs and miRNAs.28 We found that miR-145-5p not only had a high binding ability to circCAMSAP1 in 143B and HOS cells, but it also showed pivotal functions in osteosarcoma progression and metastasis. In addition, our study revealed that circCAMSAP1 exerted its regulatory functions through harboring miR-145-5p to rescue the expression of FLI1. FLI1 was first identified as an ETS family member protein that plays a vital role in retroviral-mediated acute leukemias.45 Accumulating evidence suggested that FLI1 also accelerated the metastasis of nasopharyngeal carcinoma (NPC),46 breast cancer,47 and small cell lung cancer,48 among others. Meanwhile, FLI1 has been well documented to act as an oncogene in Ewing sarcoma.49 In this study, we verified FLI1 as a driver gene in osteosarcoma through loss-of-function experiments in vivo and in vitro. We demonstrated that inactivation of FLI1 might be a consequence of constitutive suppression of circCAMSAP1. We demonstrated that FLI1 could enhance the expression of c-Myc and inhibit the expression of IGFBP3. c-Myc can promote osteosarcoma proliferation and cell survival, while IGFBP3 can inhibit both. Therefore, by enhancing the transcriptional activity of FLI1 and sponging miR-145-5p, circCAMSAP1 promotes both the progression and metastasis of osteosarcoma. Therefore, we propose the circCAMSAP1/miR-145-5p/FLI1 axis as a potential target for osteosarcoma treatment (Figure 8H). However, in addition to FLI1, we do not deny the existence of other key gene targets for circCAMSAP1, which may play an important role in the initiation and development of osteosarcoma.
Materials and methods
Clinical samples
Slices of formalin-fixed and paraffin-embedded primary osteosarcoma and chondroma tissues were obtained from biopsies in each of 10 patients before administration of neo-adjuvant chemotherapy. Osteosarcoma and chondroma biopsies were histologically characterized by pathologists according to the criteria defined by the World Health Organization. Written informed consent was obtained from each patient before entering this study, and all study protocols were approved by the Ethics Committee of Sir Run Run Shaw Hospital (reference letter no. 20180226-35).
Cell culture and treatment
Human osteosarcoma cell lines (HOS, 143B, and U2OS) and human fetal osteoblast cell line hFOB 1.19 were obtained from the FuHeng Cell Center (Shanghai, China). The osteosarcoma cell lines were authenticated by ShangHai Biowing Applied Biotechnology, performing a STR profiling analysis, as described by Capes-Davis and according to the American National Standards Institute (ANSI) standard (ASN-0002) set forth by the ATCC Standards Development Organization. Mycoplasma testing was performed using the Venor GeM mycoplasma detection kit (Minerva Biolabs, Berlin, Germany). Human cell line hFOB 1.19 was cultured in Dulbecco’s modified Eagle’s medium (DMEM)-F12 medium (Invitrogen, Karlsruhe, Germany), and human osteosarcoma cell lines HOS, 143B, and U2OS were cultured in DMEM (Gibco, Life Technologies, Darmstadt, Germany), supplemented with 10% (v/v) heat-inactivated fetal bovine serum (Invitrogen) and 1% (v/v) penicillin/streptomycin (Invitrogen), under adherent conditions at 37°C in a humidified incubator with 5% CO2/95% air.
RNA sample treatment, RNA sequencing, and data analysis
The total RNA samples of the human osteosarcoma cell lines group (143B, HOS, SJSA, and U2OS) and the human osteoblast hFOB 1.19 (control) were treated with a RiboZero rRNA removal kit (Epicenter, WI, USA) for deleting rRNA, according to the manufacturer’s instructions. Next, the rRNA-depleted and RNase R digested-RNA samples were fragmented and reverse-transcripted with random primer. The PCR amplification products of cDNA were purified, and then the libraries were quality controlled and sequenced by HiSeq 2000 (Illumina, San Diego, CA, USA). Then, we obtained reference genomes (GRCH38/hg38) from the University of California Santa Cruz (UCSC) genome browser (http://genome.ucsc.edu/). In a first step, fastp (https://github.com/OpenGene/fastp) was used to remove the reads that contained adaptor contamination, low quality bases, and undetermined bases from FASTQ reads. BWA50 was used to map reads to hg38 (the human genome). CIRI251 and CIRCexplorer52 were used for identification of back-splicing reads, and subsequent de novo assembly of the mapped reads to circRNAs. Only circRNAs identified by both algorithms were treated as valid candidates. All samples generated unique circRNAs. To evaluate expression levels of circRNAs, we normalized the back-spliced reads (evidence for circRNA) by read length and number of mapped reads (spliced reads per billion mapping [SRPBM]53), which permits quantitative comparison of back-splicing from different RNA-seq data. The differentially expressed circRNAs were selected using the R package edgeR with the significance threshold set as |log2 (FC)| >1 or less than −1 and the p value <0.05. The detailed information is listed in Table S2.
Cell transfection and viral infection
siRNA oligonucleotides toward circCAMSAP1 and control siRNA were purchased from RiboBio. miRNA mimics/inhibitors and scramble mimics/inhibitors were purchased from GenePharma (Shanghai, China). All oligonucleotides were carried out with a final concentration of 50 nM using Lipofectamine RNAiMAX reagent (Invitrogen, Carlsbad, CA, USA) following the manufacturer’s protocol. Briefly, the cells were seeded in 6-, 24-, or 96-well plates at 50% confluence the day before transient transfection into the osteosarcoma cell lines.
Lentiviral infection was used to establish stable transfectants. Briefly, HEK293T cells were co-transfected with packaging plasmids and viral vectors using Lipofectamine 3000 (Life Technologies, Germany) according to the manufacturer’s protocol. 48 h after transfection, culture medium was full of lentivirus and was collected (filtered through a 0.45-μm filter) for infection. Next, osteosarcoma cells were infected with lentivirus supplemented with 5 μg/mL Polybrene at a multiplicity of infection of 20. 36 h after infection, cells were selected with 2 μg/mL puromycin in culture medium.
Luciferase activity assays
Cells were seeded in 24-well plates at a density of 1 × 10⁵ cells per well 24 h before transfection. The cells were co-transfected with a mixture of 50 ng of firefly luciferase (FL) reporter vectors, 5 ng of Renilla luciferase (RL) reporter vectors (pRL-TK), and miRNA mimics (Life Technologies, Germany) at the indicated concentration. Cell lysates were prepared 48 h after transfection, and luciferase activity was measured using the Dual-Luciferase reporter assay (Promega, Madison, WI, USA). Luciferase activities were measured through firefly luciferase activity normalized to Renilla luciferase activity. Experiments were independently repeated three times.
Biotinylated RNA pull-down assay
RNA pull-down uses specific biotinylated probes that hybridize to target RNAs (mRNAs or miRNAs); these can then be pulled down, reverse transcribed to cDNA, and identified by quantitative real-time PCR. The biotinylated RNA pull-down kit (BersinBio) was used for the RNA pull-down experiment. A total of 107 143B or HOS cells were washed with PBS and cross-linked by ultraviolet irradiation at 254 nm. Cells were lysed with 1 mL of lysis buffer and fully homogenized with a 0.4-mm syringe. The RNA pull-down was used on cell lysates using streptavidin-coated magnetic beads.54,55 One biotinylated antisense probe (0.2 nmol) targeting the adaptor sequence or LacZ probes (control probes) was added to the circCAMSAP1 pull-down system. The probes were denatured at 65°C for 10 min and hybridized at room temperature for 2 h before adding 200 μL of streptavidin-coated magnetic beads. Non-specifically bound RNAs were removed by washing, and TRIzol reagent was used to recover miRNAs specifically interacting with circCAMSAP1. The abundance of miRNAs was evaluated by quantitative real-time PCR analysis. A total of 107 143B or HOS cells, transfected with a biotinylated-miR-145-5p mimic (WT or mutants) or control mimic (100 nmol/L each, for 36 h), were trypsinized and homogenized using the lysis buffer from Beyotime (Wuxi, China). The RNA pull-down was performed on cell lysates using streptavidin-coated magnetic beads.55 The bound mRNA was purified utilizing an RNeasy mini kit (QIAGEN, Shanghai, China), and FLI1 mRNA expression in the bound fractions was examined by qPCR and normalized to the “input” controls.
Apoptosis assay
48 h after transient transfection, according to the annexin V-propidium iodide (PI) apoptosis detection kit I (BD Pharmingen, CA, USA) protocol, cells were harvested and re-suspended with 500 μL of binding buffer. The cell suspension was incubated with 5 μL of annexin V-fluorescein isothiocyanate (FITC) and 5 μL of PI buffer at room temperature for 20 min. The stained cells were analyzed on a flow cytometer (BD Biosciences, NJ, USA) and data were analyzed via FlowJo (FlowJo, Ashland, OR, USA). Apoptotic cells were quantified by the apoptosis ratio. The experiment was repeated three times.
Transwell migration and invasion assay
The migration and Matrigel invasion assays were conducted by using a Transwell chamber (for migration assay) or a Transwell pre-coated Matrigel chamber (for invasion assay) according to the manufacturer’s protocol (BD Biosciences, Bedford, MA, USA). After transfection or infection, 100 μL of serum-free DMEM containing cells (5 × 10⁴ for migration, 1 × 10⁵ for invasion) was added to the upper chamber, and 600 μL of DMEM with 10% FBS was put into the lower chamber. The cells were incubated for 24 h. The cells were imaged and counted for at least three random fields under a microscope at ×10 magnification.
Western blot analysis
Western blotting was performed according to protocol. Briefly, cells were lysed in radioimmunoprecipitation assay (RIPA) buffer. Cellular proteins were collected and subjected to 10% SDS-PAGE and then transferred onto PVDF membranes (Amersham Pharmacia Biotech, Piscataway, NJ, USA). The membranes were then incubated with specific primary antibodies. Anti-FLI1 and anti-GAPDH were purchased from Abcam. This was followed by incubation with horseradish peroxidase-conjugated anti-rabbit IgG antibodies from Abcam, and antigen-antibody complexes were detected using enhanced chemiluminescence (ECL, Amersham, Piscataway, NJ, USA).
Reverse transcription and quantitative real-time PCR
Total RNA was extracted from cultured cells, fresh osteosarcoma tissues, and xenograft mouse tumors with TRIzol reagent (Ambion) according to the manufacturer’s protocol. miRNA cDNA was synthesized using a miRNA cDNA synthesis kit (CoWin Biosciences). Quantitative real-time PCR was performed with UltraSYBR mixture (CoWin Biosciences) with a StepOne Plus real-time PCR system (Applied Biosystems). Expression of U6 was used as an endogenous control. The expression of GAPDH was used as an internal control and oligo(dT) was used as the primer for FLI1 and GAPDH reverse transcription. PCR efficiencies were calculated with a relative standard curve derived from a complementary DNA mixture that gave regression coefficients >0.95. The thermal profile for the qPCR was 95°C for 10 min, followed by 40 cycles of 95°C for 15 s, and 60°C for 1 min on a StepOne Plus real-time PCR system (Applied Biosystems). All qPCR experiments were performed in triplicate.
Immunohistochemistry
Immunohistochemical staining was performed as previously described,56 with antibodies specific for FLI1 and cleaved caspase-3 (1:200 dilution, Proteintech). Section thickness was 5 μm as sliced by an ultra-thin semiautomatic microtome (Leica Ultracut UCT, Leica Microsystems, Austria) in the pathology laboratory. The immunoreactivity in each tissue section was assessed by at least two pathologists. The degree of positivity was determined according to the percentage of positive tumor cells.
RNA in situ hybridization
Cy3-labeled circCAMSAP1 probes and Alexa Fluor 488-labeled miR-145-5p probes were designed and synthesized by Servicebio (Wuhan, China), and the probes sequences are available upon request. The signals of the probes were detected by a FISH kit (RiboBio, Guangzhou, China) according to the manufacturer’s instructions. The images were acquired on a Nikon A1Si laser scanning confocal microscope (Nikon Instruments, Japan).
Wound healing assay
After transfection or infection, HOS and 143B cells were cultured in six-well plates and scraped with the tip of 200-μL pipette tips (time 0 h). Cell migration was imaged using an Olympus IX81 inverted microscope (Olympus, Melville, NY, USA) in 10 high-power fields at 0 and 24 h after injury. Remodeling was measured as diminishing distance across the induced injury, normalized to the 0 h control, and expressed as relative migration.
Proliferation assay (CCK-8)
Before analysis of cell proliferation, 143B and HOS cells were seeded in 96-well plates (Costar) in triplicate at a density of 3 × 10³ cells per well containing 100 μL of DMEM supplemented with 10% FBS. A Cell Counting Kit-8 (CCK-8, Dojindo, Kumamoto, Japan) was added to the wells at 0, 24, 48, and 72 h post-transfection, and cells were diluted in normal culture medium at 37°C. The absorbance values of optical density (OD) in each well were measured with a microplate reader set at 450 nm (OD450). All experiments were performed three times, and the average percentages of cells are shown.
Colony formation assay
Approximately 1 × 10³ cells of respective treated HOS or 143B cells were plated in six-well plates. Cells were fixed with methanol and stained with 0.1% crystal violet after 14 days. Clones containing more than 50 cells were counted manually. The experiments were repeated three times to obtain the average colony formation rate.
Animal experiments
All animal experiments were approved by the Ethics Committee of Sir Run Run Shaw Hospital. All experiments strictly followed the Guide for the Care and Use of Laboratory Animals published by National Institutes of Health. For the xenograft tumor model assay, nude mice (nu/nu, 4-week-old males) were randomly divided into three groups (n = 6 for each group). Stable 143B cells (5 × 10⁶ cells per injection point) were injected subcutaneously. Tumor volumes were calculated by the following equation: volume (mm3) = (tumor length × tumor width2)/2. Five weeks later, mice were sacrificed and measured for tumor weight and tumor volume, and were fixed in 4% paraformaldehyde for immunohistochemical staining, western blot, and quantitative real-time PCR.
Statistical analysis
Unless otherwise stated, all data are shown as mean ± standard error of the mean (SEM). Statistical analyses were performed using SPSS 22.0 statistical software. Statistical significance (p < 0.05) was determined by a Student’s t test, unless otherwise stated.
Acknowledgments
This work was supported by the National Key R&D Program of China (no. 2018YFC1105200); the Primary Research and Development Plan in Zhejiang Province (no. 2018C03060); the National Natural Science Foundation of China (grant nos. 81972504, 81802680, and 82072960); the Natural Science Foundation of Zhejiang Province (grant nos. Z15H060002, LY16H060004, LY16H060002, and LY19H160058); and by the Medical Science and Technology Project of Zhejiang Province of China (grant no. 2017179447).
Author contributions
S.F. and S.S. conceived the study and carried out its design. Z.C.,Y.M., Q.W., T.Y., and Y.H. performed the experiments. Z.C., S.S., Y.M., T.Y., G.L., and Y.H. conducted the statistical analyses. Z.C. wrote the paper and S.F. revised the paper. All authors read and approved the final manuscript.
Declaration of interests
The authors declare no competing interests.
Footnotes
Supplemental Information can be found online at https://doi.org/10.1016/j.omtn.2020.12.013.
Contributor Information
Jiying Wang, Email: wangjiying@zju.edu.cn.
Jianjun Ma, Email: sealteam@zju.edu.com.
Shunwu Fan, Email: 0099203@zju.edu.cn.
Supplemental information
References
- 1.Chou A.J., Geller D.S., Gorlick R. Therapy for osteosarcoma: where do we go from here? Paediatr. Drugs. 2008;10:315–327. doi: 10.2165/00148581-200810050-00005. [DOI] [PubMed] [Google Scholar]
- 2.Kaste S.C., Pratt C.B., Cain A.M., Jones-Wallace D.J., Rao B.N. Metastases detected at the time of diagnosis of primary pediatric extremity osteosarcoma at diagnosis: imaging features. Cancer. 1999;86:1602–1608. doi: 10.1002/(sici)1097-0142(19991015)86:8<1602::aid-cncr31>3.0.co;2-r. [DOI] [PubMed] [Google Scholar]
- 3.Tang N., Song W.X., Luo J., Haydon R.C., He T.C. Osteosarcoma development and stem cell differentiation. Clin. Orthop. Relat. Res. 2008;466:2114–2130. doi: 10.1007/s11999-008-0335-z. [DOI] [PMC free article] [PubMed] [Google Scholar]
- 4.Provisor A.J., Ettinger L.J., Nachman J.B., Krailo M.D., Makley J.T., Yunis E.J., Huvos A.G., Betcher D.L., Baum E.S., Kisker C.T., Miser J.S. Treatment of nonmetastatic osteosarcoma of the extremity with preoperative and postoperative chemotherapy: a report from the Children’s Cancer Group. J. Clin. Oncol. 1997;15:76–84. doi: 10.1200/JCO.1997.15.1.76. [DOI] [PubMed] [Google Scholar]
- 5.Bielack S.S., Hecker-Nolting S., Blattmann C., Kager L. Advances in the management of osteosarcoma. F1000Res. 2016;5:2767. doi: 10.12688/f1000research.9465.1. [DOI] [PMC free article] [PubMed] [Google Scholar]
- 6.Martin J.W., Squire J.A., Zielenska M. The genetics of osteosarcoma. Sarcoma. 2012;2012:627254. doi: 10.1155/2012/627254. [DOI] [PMC free article] [PubMed] [Google Scholar]
- 7.Salzman J., Gawad C., Wang P.L., Lacayo N., Brown P.O. Circular RNAs are the predominant transcript isoform from hundreds of human genes in diverse cell types. PLoS ONE. 2012;7:e30733. doi: 10.1371/journal.pone.0030733. [DOI] [PMC free article] [PubMed] [Google Scholar]
- 8.Jeck W.R., Sharpless N.E. Detecting and characterizing circular RNAs. Nat. Biotechnol. 2014;32:453–461. doi: 10.1038/nbt.2890. [DOI] [PMC free article] [PubMed] [Google Scholar]
- 9.Jeck W.R., Sorrentino J.A., Wang K., Slevin M.K., Burd C.E., Liu J., Marzluff W.F., Sharpless N.E. Circular RNAs are abundant, conserved, and associated with ALU repeats. RNA. 2013;19:141–157. doi: 10.1261/rna.035667.112. [DOI] [PMC free article] [PubMed] [Google Scholar]
- 10.Guarnerio J., Bezzi M., Jeong J.C., Paffenholz S.V., Berry K., Naldini M.M., Lo-Coco F., Tay Y., Beck A.H., Pandolfi P.P. Oncogenic role of fusion-circRNAs derived from cancer-associated chromosomal translocations. Cell. 2016;165:289–302. doi: 10.1016/j.cell.2016.03.020. [DOI] [PubMed] [Google Scholar]
- 11.You X., Vlatkovic I., Babic A., Will T., Epstein I., Tushev G., Akbalik G., Wang M., Glock C., Quedenau C. Neural circular RNAs are derived from synaptic genes and regulated by development and plasticity. Nat. Neurosci. 2015;18:603–610. doi: 10.1038/nn.3975. [DOI] [PMC free article] [PubMed] [Google Scholar]
- 12.Li Z., Huang C., Bao C., Chen L., Lin M., Wang X., Zhong G., Yu B., Hu W., Dai L. Exon-intron circular RNAs regulate transcription in the nucleus. Nat. Struct. Mol. Biol. 2015;22:256–264. doi: 10.1038/nsmb.2959. [DOI] [PubMed] [Google Scholar]
- 13.Zhu P., Zhu X., Wu J., He L., Lu T., Wang Y., Liu B., Ye B., Sun L., Fan D. IL-13 secreted by ILC2s promotes the self-renewal of intestinal stem cells through circular RNA circPan3. Nat. Immunol. 2019;20:183–194. doi: 10.1038/s41590-018-0297-6. [DOI] [PubMed] [Google Scholar]
- 14.Ji X., Shan L., Shen P., He M. Circular RNA circ_001621 promotes osteosarcoma cells proliferation and migration by sponging miR-578 and regulating VEGF expression. Cell Death Dis. 2020;11:18. doi: 10.1038/s41419-019-2204-y. [DOI] [PMC free article] [PubMed] [Google Scholar] [Retracted]
- 15.Li L., Guo L., Yin G., Yu G., Zhao Y., Pan Y. Upregulation of circular RNA circ_0001721 predicts unfavorable prognosis in osteosarcoma and facilitates cell progression via sponging miR-569 and miR-599. Biomed. Pharmacother. 2019;109:226–232. doi: 10.1016/j.biopha.2018.10.072. [DOI] [PubMed] [Google Scholar]
- 16.Zhang Z., Zhao M., Wang G. hsa_circ_0051079 functions as an oncogene by regulating miR-26a-5p/TGF-β1 in osteosarcoma. Cell Biosci. 2019;9:94. doi: 10.1186/s13578-019-0355-2. [DOI] [PMC free article] [PubMed] [Google Scholar]
- 17.Zhou X., Natino D., Qin Z., Wang D., Tian Z., Cai X., Wang B., He X. Identification and functional characterization of circRNA-0008717 as an oncogene in osteosarcoma through sponging miR-203. Oncotarget. 2017;9:22288–22300. doi: 10.18632/oncotarget.23466. [DOI] [PMC free article] [PubMed] [Google Scholar]
- 18.Xi Y., Fowdur M., Liu Y., Wu H., He M., Zhao J. Differential expression and bioinformatics analysis of circRNA in osteosarcoma. Biosci. Rep. 2019;39 doi: 10.1042/BSR20181514. BSR20181514. [DOI] [PMC free article] [PubMed] [Google Scholar]
- 19.Memczak S., Jens M., Elefsinioti A., Torti F., Krueger J., Rybak A., Maier L., Mackowiak S.D., Gregersen L.H., Munschauer M. Circular RNAs are a large class of animal RNAs with regulatory potency. Nature. 2013;495:333–338. doi: 10.1038/nature11928. [DOI] [PubMed] [Google Scholar]
- 20.Hansen T.B., Jensen T.I., Clausen B.H., Bramsen J.B., Finsen B., Damgaard C.K., Kjems J. Natural RNA circles function as efficient microRNA sponges. Nature. 2013;495:384–388. doi: 10.1038/nature11993. [DOI] [PubMed] [Google Scholar]
- 21.Cui J.W., Vecchiarelli-Federico L.M., Li Y.J., Wang G.J., Ben-David Y. Continuous Fli-1 expression plays an essential role in the proliferation and survival of F-MuLV-induced erythroleukemia and human erythroleukemia. Leukemia. 2009;23:1311–1319. doi: 10.1038/leu.2009.20. [DOI] [PubMed] [Google Scholar]
- 22.Spyropoulos D.D., Pharr P.N., Lavenburg K.R., Jackers P., Papas T.S., Ogawa M., Watson D.K. Hemorrhage, impaired hematopoiesis, and lethality in mouse embryos carrying a targeted disruption of the Fli1 transcription factor. Mol. Cell. Biol. 2000;20:5643–5652. doi: 10.1128/mcb.20.15.5643-5652.2000. [DOI] [PMC free article] [PubMed] [Google Scholar]
- 23.Truong A.H.L., Ben-David Y. The role of Fli-1 in normal cell function and malignant transformation. Oncogene. 2000;19:6482–6489. doi: 10.1038/sj.onc.1204042. [DOI] [PubMed] [Google Scholar]
- 24.Oikawa T. ETS transcription factors: possible targets for cancer therapy. Cancer Sci. 2004;95:626–633. doi: 10.1111/j.1349-7006.2004.tb03320.x. [DOI] [PMC free article] [PubMed] [Google Scholar]
- 25.Li L., Song W., Yan X., Li A., Zhang X., Li W., Wen X., Zhou L., Yu D., Hu J.F., Cui J. Friend leukemia virus integration 1 promotes tumorigenesis of small cell lung cancer cells by activating the miR-17-92 pathway. Oncotarget. 2017;8:41975–41987. doi: 10.18632/oncotarget.16715. [DOI] [PMC free article] [PubMed] [Google Scholar]
- 26.Wu P., Liang J., Yu F., Zhou Z., Tang J., Li K. miR-145 promotes osteosarcoma growth by reducing expression of the transcription factor friend leukemia virus integration 1. Oncotarget. 2016;7:42241–42251. doi: 10.18632/oncotarget.9948. [DOI] [PMC free article] [PubMed] [Google Scholar]
- 27.Suzuki H., Zuo Y., Wang J., Zhang M.Q., Malhotra A., Mayeda A. Characterization of RNase R-digested cellular RNA source that consists of lariat and circular RNAs from pre-mRNA splicing. Nucleic Acids Res. 2006;34:e63. doi: 10.1093/nar/gkl151. [DOI] [PMC free article] [PubMed] [Google Scholar]
- 28.Li Y., Zheng F., Xiao X., Xie F., Tao D., Huang C., Liu D., Wang M., Wang L., Zeng F., Jiang G. circHIPK3 sponges miR-558 to suppress heparanase expression in bladder cancer cells. EMBO Rep. 2017;18:1646–1659. doi: 10.15252/embr.201643581. [DOI] [PMC free article] [PubMed] [Google Scholar]
- 29.Liu G., Huang K., Jie Z., Wu Y., Chen J., Chen Z., Fang X., Shen S. circFAT1 sponges miR-375 to promote the expression of Yes-associated protein 1 in osteosarcoma cells. Mol. Cancer. 2018;17:170. doi: 10.1186/s12943-018-0917-7. [DOI] [PMC free article] [PubMed] [Google Scholar]
- 30.Magalhães M., Almeida M., Tavares-da-Silva E., Roleira F.M.F., Varela C., Jorge J., Gonçalves A.C., Carvalho R.A., Veiga F., Santos A.C., Figueiras A. miR-145-loaded micelleplexes as a novel therapeutic strategy to inhibit proliferation and migration of osteosarcoma cells. Eur. J. Pharm. Sci. 2018;123:28–42. doi: 10.1016/j.ejps.2018.07.021. [DOI] [PubMed] [Google Scholar]
- 31.Zhu Y.J., Zheng B., Luo G.J., Ma X.K., Lu X.Y., Lin X.M., Yang S., Zhao Q., Wu T., Li Z.X. Circular RNAs negatively regulate cancer stem cells by physically binding FMRP against CCAR1 complex in hepatocellular carcinoma. Theranostics. 2019;9:3526–3540. doi: 10.7150/thno.32796. [DOI] [PMC free article] [PubMed] [Google Scholar]
- 32.Wang Y.-G., Wang T., Ding M., Xiang S.-H., Shi M., Zhai B. hsa_circ_0091570 acts as a ceRNA to suppress hepatocellular cancer progression by sponging hsa-miR-1307. Cancer Lett. 2019;460:128–138. doi: 10.1016/j.canlet.2019.06.007. [DOI] [PubMed] [Google Scholar]
- 33.Meng Q., Li S., Liu Y., Zhang S., Jin J., Zhang Y., Guo C., Liu B., Sun Y. Circular RNA circSCAF11 accelerates the glioma tumorigenesis through the miR-421/SP1/VEGFA Axis. Mol. Ther. Nucleic Acids. 2019;17:669–677. doi: 10.1016/j.omtn.2019.06.022. [DOI] [PMC free article] [PubMed] [Google Scholar]
- 34.Chen X.Y., Mao R., Su W.M., Yang X., Geng Q.Q., Guo C.F., Wang Z.W., Wang J., Kresty L.A., Beer D.G. Circular RNA circHIPK3 modulates autophagy via MIR124-3p-STAT3-PRKAA/AMPKα signaling in STK11 mutant lung cancer. Autophagy. 2020;16:659–671. doi: 10.1080/15548627.2019.1634945. [DOI] [PMC free article] [PubMed] [Google Scholar]
- 35.Lu Q., Liu T., Feng H., Yang R., Zhao X., Chen W., Jiang B., Qin H., Guo X., Liu M. Circular RNA circSLC8A1 acts as a sponge of miR-130b/miR-494 in suppressing bladder cancer progression via regulating PTEN. Mol. Cancer. 2019;18:111. doi: 10.1186/s12943-019-1040-0. [DOI] [PMC free article] [PubMed] [Google Scholar]
- 36.Zeng K., He B., Yang B.B., Xu T., Chen X., Xu M., Liu X., Sun H., Pan Y., Wang S. The pro-metastasis effect of circANKS1B in breast cancer. Mol. Cancer. 2018;17:160. doi: 10.1186/s12943-018-0914-x. [DOI] [PMC free article] [PubMed] [Google Scholar]
- 37.Yamamoto M., Yoshimura K., Kitada M., Nakahara J., Seiwa C., Ueki T., Shimoda Y., Ishige A., Watanabe K., Asou H. A new monoclonal antibody, A3B10, specific for astrocyte-lineage cells recognizes calmodulin-regulated spectrin-associated protein 1 (Camsap1) J. Neurosci. Res. 2009;87:503–513. doi: 10.1002/jnr.21853. [DOI] [PubMed] [Google Scholar]
- 38.Sun X., Wang Z.M., Song Y., Tai X.H., Ji W.Y., Gu H. MicroRNA-126 modulates the tumor microenvironment by targeting calmodulin-regulated spectrin-associated protein 1 (Camsap1) Int. J. Oncol. 2014;44:1678–1684. doi: 10.3892/ijo.2014.2321. [DOI] [PubMed] [Google Scholar]
- 39.Yoshioka N., Asou H., Hisanaga S., Kawano H. The astrocytic lineage marker calmodulin-regulated spectrin-associated protein 1 (Camsap1): phenotypic heterogeneity of newly born Camsap1-expressing cells in injured mouse brain. J. Comp. Neurol. 2012;520:1301–1317. doi: 10.1002/cne.22788. [DOI] [PubMed] [Google Scholar]
- 40.Zhou C., Liu H.S., Wang F.W., Hu T., Lian Z.X., Lan N., He X.W., Zheng X.B., Wu X.J., Xie D. circCAMSAP1 promotes tumor growth in colorectal cancer via the miR-328-5p/E2F1 axis. Mol. Ther. 2020;28:914–928. doi: 10.1016/j.ymthe.2019.12.008. [DOI] [PMC free article] [PubMed] [Google Scholar]
- 41.Li B., Li X. Overexpression of hsa_circ_0007534 predicts unfavorable prognosis for osteosarcoma and regulates cell growth and apoptosis by affecting AKT/GSK-3β signaling pathway. Biomed. Pharmacother. 2018;107:860–866. doi: 10.1016/j.biopha.2018.08.086. [DOI] [PubMed] [Google Scholar]
- 42.Li S., Pei Y., Wang W., Liu F., Zheng K., Zhang X. Circular RNA 0001785 regulates the pathogenesis of osteosarcoma as a ceRNA by sponging miR-1200 to upregulate HOXB2. Cell Cycle. 2019;18:1281–1291. doi: 10.1080/15384101.2019.1618127. [DOI] [PMC free article] [PubMed] [Google Scholar]
- 43.Wu Y., Xie Z., Chen J., Chen J., Ni W., Ma Y., Huang K., Wang G., Wang J., Ma J. Circular RNA circTADA2A promotes osteosarcoma progression and metastasis by sponging miR-203a-3p and regulating CREB3 expression. Mol. Cancer. 2019;18:73. doi: 10.1186/s12943-019-1007-1. [DOI] [PMC free article] [PubMed] [Google Scholar]
- 44.Yin Q., Wang J., Fu Q., Gu S., Rui Y. circRUNX2 through has-miR-203 regulates RUNX2 to prevent osteoporosis. J. Cell. Mol. Med. 2018;22:6112–6121. doi: 10.1111/jcmm.13888. [DOI] [PMC free article] [PubMed] [Google Scholar]
- 45.Prasad D.D.K., Rao V.N., Reddy E.S.P. Structure and expression of human Fli-1 gene. Cancer Res. 1992;52:5833–5837. [PubMed] [Google Scholar]
- 46.Liang X., Shi D., Yun J., Mao Y., Ouyang P., Su Z., Fu J., Hou J., Deng W., Xie F., X L Friend leukemia virus integration 1 expression has prognostic significance in nasopharyngeal carcinoma. Transl. Oncol. 2014;7:493–502. doi: 10.1016/j.tranon.2014.04.015. [DOI] [PMC free article] [PubMed] [Google Scholar]
- 47.Yan X., Yu Y., Li L., Chen N., Song W., He H., Dong J., Liu X., Cui J., X Y Friend leukemia virus integration 1 is a predictor of poor prognosis of breast cancer and promotes metastasis and cancer stem cell properties of breast cancer cells. Cancer Med. 2018;7:3548–3560. doi: 10.1002/cam4.1589. [DOI] [PMC free article] [PubMed] [Google Scholar]
- 48.Li L., Li W., Chen N., Zhao H., Xu G., Zhao Y., Pan X., Zhang X., Zhou L., Yu D. FLI1 exonic circular RNAs as a novel oncogenic driver to promote tumor metastasis in small cell lung cancer. Clin. Cancer Res. 2019;25:1302–1317. doi: 10.1158/1078-0432.CCR-18-1447. [DOI] [PubMed] [Google Scholar]
- 49.May W.A., Gishizky M.L., Lessnick S.L., Lunsford L.B., Lewis B.C., Delattre O., Zucman J., Thomas G., Denny C.T., WA M. Ewing sarcoma 11;22 translocation produces a chimeric transcription factor that requires the DNA-binding domain encoded by FLI1 for transformation. Proc. Natl. Acad. Sci. USA. 1993;90:5752–5756. doi: 10.1073/pnas.90.12.5752. [DOI] [PMC free article] [PubMed] [Google Scholar]
- 50.Li H., Durbin R. Fast and accurate short read alignment with Burrows-Wheeler transform. Bioinformatics. 2009;25:1754–1760. doi: 10.1093/bioinformatics/btp324. [DOI] [PMC free article] [PubMed] [Google Scholar]
- 51.Gao Y., Wang J., Zhao F. CIRI: an efficient and unbiased algorithm for de novo circular RNA identification. Genome Biol. 2015;16:4. doi: 10.1186/s13059-014-0571-3. [DOI] [PMC free article] [PubMed] [Google Scholar]
- 52.Dong R., Ma X.K., Chen L.L., Yang L. Genome-wide annotation of circRNAs and their alternative back-splicing/splicing with CIRCexplorer pipeline. Methods Mol. Biol. 2019;1870:137–149. doi: 10.1007/978-1-4939-8808-2_10. [DOI] [PubMed] [Google Scholar]
- 53.Zheng Q., Bao C., Guo W., Li S., Chen J., Chen B., Luo Y., Lyu D., Li Y., Shi G. Circular RNA profiling reveals an abundant circHIPK3 that regulates cell growth by sponging multiple miRNAs. Nat. Commun. 2016;7:11215. doi: 10.1038/ncomms11215. [DOI] [PMC free article] [PubMed] [Google Scholar]
- 54.Shen S., Wu Y., Chen J., Xie Z., Huang K., Wang G., Yang Y., Ni W., Chen Z., Shi P. circSERPINE2 protects against osteoarthritis by targeting miR-1271 and ETS-related gene. Ann. Rheum. Dis. 2019;78:826–836. doi: 10.1136/annrheumdis-2018-214786. [DOI] [PMC free article] [PubMed] [Google Scholar]
- 55.Wang R., Zhang S., Chen X., Li N., Li J., Jia R., Pan Y., Liang H. circNT5E acts as a sponge of miR-422a to promote glioblastoma tumorigenesis. Cancer Res. 2018;78:4812–4825. doi: 10.1158/0008-5472.CAN-18-0532. [DOI] [PubMed] [Google Scholar]
- 56.Shen S., Huang K., Wu Y., Ma Y., Wang J., Qin F., Ma J. A miR-135b-TAZ positive feedback loop promotes epithelial-mesenchymal transition (EMT) and tumorigenesis in osteosarcoma. Cancer Lett. 2017;407:32–44. doi: 10.1016/j.canlet.2017.08.005. [DOI] [PubMed] [Google Scholar]
Associated Data
This section collects any data citations, data availability statements, or supplementary materials included in this article.