

Abstract
To enhance understanding of polycystic ovary syndrome (PCOS) at the molecular level; this investigation intends to examine the genes and pathways associated with PCOS by using an integrated bioinformatics analysis. Based on the expression profiling by high throughput sequencing data GSE84958 derived from the Gene Expression Omnibus (GEO) database, the differentially expressed genes (DEGs) between PCOS samples and normal controls were identified. We performed a functional enrichment analysis. A protein-protein interaction (PPI) network, miRNA- target genes and TF - target gene networks, were constructed and visualized, with which the hub gene nodes were identified. Validation of hub genes was performed by using receiver operating characteristic (ROC) and RT-PCR. Small drug molecules were predicted by using molecular docking. A total of 739 DEGs were identified, of which 360 genes were up regulated and 379 genes were down regulated. GO enrichment analysis revealed that up regulated genes were mainly involved in peptide metabolic process, organelle envelope and RNA binding and the down regulated genes were significantly enriched in plasma membrane bounded cell projection organization, neuron projection and DNA-binding transcription factor activity, RNA polymerase II-specific. REACTOME pathway enrichment analysis revealed that the up regulated genes were mainly enriched in translation and respiratory electron transport and the down regulated genes were mainly enriched in generic transcription pathway and transmembrane transport of small molecules. The top 10 hub genes (SAA1, ADCY6, POLR2K, RPS15, RPS15A, CTNND1, ESR1, NEDD4L, KNTC1 and NGFR) were identified from PPI network, miRNA - target gene network and TF - target gene network. The modules analysis showed that genes in modules were mainly associated with the transport of respiratory electrons and signaling NGF, respectively. We find a series of crucial genes along with the pathways that were most closely related with PCOS initiation and advancement. Our investigations provide a more detailed molecular mechanism for the progression of PCOS, detail information on the potential biomarkers and therapeutic targets.
Keywords: polycystic ovary syndrome, expression profiling by high throughput sequencing, biomarkers, pathway enrichment analysis, differentially expressed gene
Introduction
Polycystic ovary syndrome (PCOS) is one of the most prevalent endocrine disorder around the world, with an estimated about one in 15 women worldwide [1]. PCOS exposes patients to a major psychosocial burden and is characterized by hyperandrogenism and chronic anovulation [2]. Diabetes, heart disease, obesity, non-alcoholic fatty liver disease and hypertension are the risk factors associated with PCOS [3–7]. Therefore, it is of prime importance to identify the etiological factors, molecular mechanisms, and pathways to discover novel diagnostic markers, prognostic markers and therapeutic targets for PCOS.
Numerous research strategies have recently investigated the molecular mechanisms of PCOS. High-throughput RNA sequencing technology has received extensive attention among these research strategies and has generated significant advances in the field of endocrine disorder with marked clinical applications ranging from molecular diagnosis to molecular classification, patient stratification to prognosis prediction, and discovery of new drug targets to response prediction [8]. In addition, gene expression profiling investigation on PCOS have been performed using high-throughput RNA sequencing, and several key genes and diagnostic biomarkers have been diagnosed for this syndrome, including the profiling of many of differentially expressed genes (DEGs) associated in different pathways, biological processes, or molecular functions [9]. Integrated bioinformatics analyses of expression profiling by high throughput sequencing data derived from different investigation of PCOS could help identify the novel diagnostic markers, prognostic markers and further demonstrate their related functions and potential therapeutic targets in PCOS.
Therefore, in the current investigation, the dataset (GSE84958) was then retrieved from the publicly available Gene Expression Omnibus database (GEO, http://www.ncbi.nlm.nih.gov/geo/) [10] to identify DEGs and the associated biological processes PCOS using comprehensive bioinformatics analyses. The DEGs were subjected to functional enrichment and pathway analyses; moreover, a protein-protein interaction (PPI) network, miRNAs - target gene regulatory network and TFs - target gene regulatory network were constructed to screen for key genes, miRNA and TFs. The aim of this investigation was to identify key genes and pathways in PCOS using bioinformatics analysis, and then to explore the molecular mechanisms of PCOS and categorize new potential diagnostic therapeutic biomarkers of PCOS. We anticipated that these investigations will provide further understanding of PCOS pathogenesis and advancement at the molecular level.
Materials and Methods
RNA sequencing data
Expression profiling by high throughput sequencing dataset GSE84958 was downloaded from NCBI-GEO, a public database of next-generation sequencing, to filter the DEGs between PCOS and normal control. The expression profiling by high throughput sequencing GSE84958 was based on GPL16791 platforms (Illumina HiSeq 2500 (Homo sapiens)) and consisted of 30 PCOS samples and 23 normal control.
Identification of DEGs
The limma [11] in R bioconductor package was used to analyze the DEGs between PCOS samples and normal control samples in the expression profiling by high throughput sequencing data of GSE84958. The adjusted P-value and [logFC] were calculated. The Benjamini & Hochberg false discovery rate method was used as a correction factor for the adjusted P-value in limma [12]. The statistically significant DEGs were identified according to P<0.05, and [logFC] > 2.5 for up regulated genes and [logFC] < -1.5 for down regulated genes. All results of DEGs were downloaded in text format, hierarchical clustering analysis being conducted.
GO and pathway enrichment of DEGs in PCOS
To reflect gene functions, GO (http://geneontology.org/) [13] has been used in three terms: biological processes (BP), cellular component (CC) and molecular function (MF). ToppGene (ToppFun) (https://toppgene.cchmc.org/enrichment.jsp) [14] is an online database offering a comprehensive collection of resources for functional annotation to recognize the biological significance behind a broad list of genes. The functional enrichment analyses of DEGs, including GO analysis and REACTOME (https://reactome.org/) [15] pathway enrichment analysis, were performed using ToppGene in the present study, using the cut-off criterion P-value<0.05 and gene enrichment count>2.
PPI networks construction and module analysis
The Search Tool for the Retrieval of Interacting Genes/Proteins (STRING: http://string-db.org/) is online biological database and website designed to evaluate PPI information [16] Proteins associated with DEGs were selected based on information in the STRING database (PPI score >0.7), and then PPI networks were constructed using Cytoscape software (http://cytoscape.org/) [17]. In this investigation, node degree [18], betweenness centrality [19], stress centrality [20] and closeness centrality [21], these constitutes a fundamental parameters in network theory, were adopted to calculate the nodes in a network. The topological properties of hub genes were calculated using Cytoscape plugin Network Analyzer. The PEWCC1 (http://apps.cytoscape.org/apps/PEWCC1) [22], a plugin for Cytoscape, was used to screen the modules of the PPI network. The criteria were set as follows: degree cutoff=2, node score cutoff=0.2, k-core=2 and maximum depth=100. Moreover, the GO and pathway enrichment analysis were performed for DEGs in these modules.
Construction of miRNA - target regulatory network
Furthermore, the target genes of the significant target genes were predicted by using miRNet database (https://www.mirnet.ca/) [23], when the miRNAs shared a common target gene. Finally, the miRNA - target genes regulatory network depicted interactions between miRNAs and their potential targets in PCOS were visualized by using Cytoscape.
Construction of TF - target regulatory network
Furthermore, the target genes of the significant target genes were predicted by using TF database (https://www.mirnet.ca/) [23], when the TFs shared common target genes. Finally, the TF- target genes regulatory network depicted interactions between TFs and their potential targets in PCOS were visualized by using Cytoscape.
Receiver operating characteristic (ROC) curve analysis
The ROC curve was used to evaluate classifiers in bioinformatics applications. To further assess the predictive accuracy of the hub genes, ROC analysis was performed to discriminate PCOS from normal control. ROC curves for hub genes were generated using pROC in R [24] based on the obtained hub genes and their expression profiling by high throughput sequencing data. The area under the ROC curve (AUC) was determined and used to compare the diagnostic value of hub genes.
Validation of the expression levels of candidate genes by RT-PCR
Total RNA was extracted from PCOS (UWB1.289 (ATCC® CRL-2945™)) and normal ovarian cell line (MES-OV (ATCC® CRL-3272™)) using TRI Reagent® (Sigma, USA). The Reverse transcription cDNA kit (Thermo Fisher Scientific, Waltham, MA, USA) and 7 Flex real-time PCR system (Thermo Fisher Scientific, Waltham, MA, USA) were used for reverse transcription and real-time quantitative reverse transcriptase polymerase chain reaction (qRT-PCR) assay. Polymerase chain reaction primer sequences are listed in Table 1. β-actin was used as an internal control for quantification. The relative expression levels of target transcripts were calculated using the 2-∆∆Ct method [25]. The thermocycling conditions used for RT-PCR were as follows: initial denaturation at 95°C for 15 min, followed by 40 cycles at 95°C for 10 sec, 60°C for 20 sec and 72°C for 20 sec.
Table 1.
Primers used for quantitative PCR
| Primer sequence (5'→3') | ||
|---|---|---|
| Gene | Forward | Reverse |
| SAA1 | TCGTTCCTTGGCGAGGCTTTTG | AGGTCCCCTTTTGGCAGCATCA |
| ADCY6 | CTCCTGGTCCCTAAAGTGGAT | GGAGGCAGCTCATATAGCGG |
| POLR2K | GGAGAGTGTCACACAGAAAATGA | TCGAGCATCAAAAACGACCAAT |
| RPS15 | CCCGAGATGATCGGCCACTA | CCATGCTTTACGGGCTTGTAG |
| RPS15A | CTCCAAAGTCATCGTCCGGTT | TGAGTTGCACGTCAAATCTGG |
| CTNND1 | GTGACAACACGGACAGTACAG | TTCTTGCGGAAATCACGACCC |
| ESR1 | CCCACTCAACAGCGTGTCTC | CGTCGATTATCTGAATTTGGCCT |
| NEDD4L | GACATGGAGCATGGATGGGAA | GTTCGGCCTAAATTGTCCACT |
| KNTC1 | ACCTGAGTGTCGGTTCAAGAA | CACTGATTGGTCGGCTACAATAA |
| NGFR | CCTACGGCTACTACCAGGATG | CACACGGTGTTCTGCTTGT |
Molecular docking studies
Surflex-docking studies of the standard drug molecule used in polycystic ovary syndrome were used on over expressed genes and were collected from PDB data bank using perpetual SYBYL-X 2.0 software. Using ChemDraw Software, all the drug molecules were illustrated, imported and saved in sdf. templet using open babel free software. The protein structures of POLR2K (), RPS15, RPS15 alpha and SAA1 of their co-crystallised protein of PDB code 1LE9, 3OW2, 1G1X and 4IP8 respectively were extracted from Protein Data Bank [26–28]. Gasteiger Huckel (GH) charges were applied along with the TRIPOS force field to all the drug molecules and is standard for the structure optimization process. In addition, energy minimization was achieved using MMFF94s and MMFF94 algorithm methods. The protein preparation was carried out after incorporation of protein. The co-crystallized ligand was extracted from the crystal structure and all water molecules; more hydrogen was added and the side chain was set. For energy minimisation, the TRIPOS force field was used. The interaction efficiency of the compounds with the receptor was represented in kcal / mol units by the Surflex-Dock score. The interaction between the protein and the ligand, the best pose was incorporated into the molecular area. The visualization of ligand interaction with receptor is done by using discovery studio visualizer.
Results
Identification of DEGs
Expression profiling by high throughput sequencing dataset was obtained from the National Center for Biotechnology Information GEO database containing PCOS samples and normal control samples: GSE84958. Then, the R package named “limma” was processed for analysis with adjusted P < 0.05, and [logFC] > 2.5 for up regulated genes and [logFC] < -1.5 for down regulated genes. All DEGs were displayed in volcano maps (Fig. 1). A total of 739 DEGs including 360 up regulated and 379 down regulated genes (Table 2) were identified in PCOS samples compared to normal control samples. The results are shown in the heatmap (Fig. 2).
Fig. 1.

Volcano plot of differentially expressed genes. Genes with a significant change of more than two-fold were selected. Green dot represented up regulated significant genes and red dot represented down regulated significant genes
Table 2.
The statistical metrics for key differentially expressed genes (DEGs)
| Gene Symbol | logFC | p Value | adj. P.Val | t value | Regulation | Gene Name |
|---|---|---|---|---|---|---|
| SAA2 | 4.381364 | 3.5E-07 | 0.00095 | 5.718643 | Up | serum amyloid A2 |
| PLOD2 | 4.201209 | 5.64E-07 | 0.001025 | 5.593469 | Up | procollagen-lysine,2-oxoglutarate 5-dioxygenase 2 |
| ABI3BP | 4.13442 | 2.07E-07 | 0.000779 | 5.856015 | Up | ABI family member 3 binding protein |
| RPPH1 | 4.09338 | 7.43E-06 | 0.002243 | 4.901502 | Up | ribonuclease P RNA component H1 |
| C7orf50 | 4.074966 | 4.01E-07 | 0.00095 | 5.683289 | Up | chromosome 7 open reading frame 50 |
| RMRP | 3.989952 | 7.74E-06 | 0.002243 | 4.890252 | Up | RNA component of mitochondrial RNA processing endoribonuclease |
| BNIP3 | 3.899781 | 2.99E-07 | 0.00095 | 5.760151 | Up | BCL2 interacting protein 3 |
| POLE4 | 3.874065 | 6.35E-07 | 0.001025 | 5.562056 | Up | DNA polymerase epsilon 4, accessory subunit |
| RHBDD2 | 3.854997 | 4.02E-06 | 0.001884 | 5.068914 | Up | rhomboid domain containing 2 |
| F13A1 | 3.806046 | 1.82E-06 | 0.001545 | 5.283097 | Up | coagulation factor XIII A chain |
| SIVA1 | 3.784719 | 7.02E-07 | 0.001025 | 5.535746 | Up | SIVA1 apoptosis inducing factor |
| TMEM54 | 3.721 | 1.5E-09 | 1.98E-05 | 7.116347 | Up | transmembrane protein 54 |
| SBDS | 3.630263 | 1.28E-05 | 0.002885 | 4.75139 | Up | SBDS ribosome maturation factor |
| CERS2 | 3.600241 | 1.32E-06 | 0.001336 | 5.368773 | Up | ceramide synthase 2 |
| PLA2G2A | 3.575964 | 6.92E-07 | 0.001025 | 5.539611 | Up | phospholipase A2 group IIA |
| SAA1 | 3.551756 | 0.000565 | 0.017754 | 3.640098 | Up | serum amyloid A1 |
| PHB2 | 3.526406 | 1.39E-05 | 0.003049 | 4.728928 | Up | prohibitin 2 |
| LSM14A | 3.514098 | 2.94E-06 | 0.001776 | 5.153832 | Up | LSM14A mRNA processing body assembly factor |
| MRPL20 | 3.513535 | 4.93E-05 | 0.005042 | 4.370518 | Up | mitochondrial ribosomal protein L20 |
| NEDD8 | 3.493441 | 7.9E-06 | 0.002265 | 4.884608 | Up | NEDD8 ubiquitin like modifier |
| LRRC59 | 3.487927 | 5.07E-08 | 0.000334 | 6.219575 | Up | leucine rich repeat containing 59 |
| NAA38 | 3.483141 | 0.000119 | 0.008042 | 4.113375 | Up | N (alpha)-acetyltransferase 38, NatC auxiliary subunit |
| R3HDM4 | 3.472879 | 0.000181 | 0.009987 | 3.989599 | Up | R3H domain containing 4 |
| PI4KB | 3.463829 | 2.36E-05 | 0.003497 | 4.579687 | Up | phosphatidylinositol 4-kinase beta |
| RPS27L | 3.462436 | 6.2E-05 | 0.005556 | 4.304481 | Up | ribosomal protein S27 like |
| UBL5 | 3.458582 | 4.83E-05 | 0.005015 | 4.376605 | Up | ubiquitin like 5 |
| S100A1 | 3.431536 | 0.000323 | 0.013388 | 3.813673 | Up | S100 calcium binding protein A1 |
| TEAD3 | 3.414631 | 1.1E-08 | 9.64E-05 | 6.611182 | Up | TEA domain transcription factor 3 |
| PRELID1 | 3.395554 | 1.51E-05 | 0.003137 | 4.706077 | Up | PRELI domain containing 1 |
| SNCG | 3.381526 | 0.001426 | 0.0285 | 3.342577 | Up | synuclein gamma |
| NDUFAF3 | 3.380114 | 3.84E-05 | 0.00453 | 4.442043 | Up | NADH:ubiquinoneoxidoreductase complex assembly factor 3 |
| LOC101926960 | 3.379084 | 8.99E-05 | 0.006783 | 4.196554 | Up | uncharacterized LOC101926960 |
| MRAP | 3.376232 | 0.000186 | 0.010117 | 3.981504 | Up | melanocortin 2 receptor accessory protein |
| EIF1AX | 3.363678 | 3.15E-05 | 0.004025 | 4.498903 | Up | eukaryotic translation initiation factor 1A X-linked |
| FIS1 | 3.36153 | 0.000316 | 0.01319 | 3.819875 | Up | fission, mitochondrial 1 |
| LSM4 | 3.342924 | 2.22E-06 | 0.001669 | 5.229869 | Up | LSM4 homolog, U6 small nuclear RNA and mRNA degradation associated |
| MRPL24 | 3.341155 | 8.03E-05 | 0.006322 | 4.229412 | Up | mitochondrial ribosomal protein L24 |
| ZNF32 | 3.328313 | 2.03E-06 | 0.001623 | 5.253128 | Up | zinc finger protein 32 |
| SAP18 | 3.320223 | 3.41E-05 | 0.004196 | 4.47629 | Up | Sin3A associated protein 18 |
| ZFAND6 | 3.310728 | 6.93E-05 | 0.005946 | 4.272145 | Up | zinc finger AN1-type containing 6 |
| PLCG2 | 3.309309 | 2.45E-05 | 0.003542 | 4.570246 | Up | phospholipase C gamma 2 |
| COA4 | 3.297112 | 1.12E-06 | 0.001179 | 5.412446 | Up | cytochrome c oxidase assembly factor 4 homolog |
| GTF3A | 3.27873 | 0.000407 | 0.015016 | 3.742231 | Up | general transcription factor IIIA |
| SMIM19 | 3.278578 | 1.23E-05 | 0.002829 | 4.763305 | Up | small integral membrane protein 19 |
| DYNLL2 | 3.274028 | 1.21E-05 | 0.002818 | 4.76751 | Up | dynein light chain LC8-type 2 |
| WSB2 | 3.272902 | 0.000138 | 0.008726 | 4.070129 | Up | WD repeat and SOCS box containing 2 |
| MMAB | 3.272634 | 2.33E-05 | 0.003497 | 4.583501 | Up | metabolism of cobalamin associated B |
| COX5B | 3.250497 | 8.68E-05 | 0.006676 | 4.206576 | Up | cytochrome c oxidase subunit 5B |
| ZNF706 | 3.247455 | 1.57E-05 | 0.003137 | 4.695098 | Up | zinc finger protein 706 |
| SUMO3 | 3.244703 | 1.07E-05 | 0.002689 | 4.799887 | Up | small ubiquitin like modifier 3 |
| ZHX1 | 3.244233 | 2.98E-05 | 0.003952 | 4.514129 | Up | zinc fingers and homeoboxes 1 |
| DCAF6 | 3.218358 | 7.16E-05 | 0.005962 | 4.263031 | Up | DDB1 and CUL4 associated factor 6 |
| NDUFA2 | 3.202606 | 0.00011 | 0.007611 | 4.136503 | Up | NADH:ubiquinoneoxidoreductase subunit A2 |
| COMT | 3.194553 | 7.49E-06 | 0.002243 | 4.899155 | Up | catechol-O-methyltransferase |
| USP24 | 3.193685 | 7.7E-06 | 0.002243 | 4.891689 | Up | ubiquitin specific peptidase 24 |
| CLEC3B | 3.192924 | 0.000932 | 0.023147 | 3.480824 | Up | C-type lectin domain family 3 member B |
| S100A16 | 3.181908 | 2.08E-05 | 0.00341 | 4.615343 | Up | S100 calcium binding protein A16 |
| PIH1D1 | 3.168542 | 3.25E-06 | 0.001776 | 5.126645 | Up | PIH1 domain containing 1 |
| PEX2 | 3.15767 | 6.91E-05 | 0.005946 | 4.273176 | Up | peroxisomal biogenesis factor 2 |
| BCCIP | 3.156384 | 5.08E-06 | 0.002061 | 5.005401 | Up | BRCA2 and CDKN1A interacting protein |
| UCHL1 | 3.144433 | 0.000603 | 0.018411 | 3.61943 | Up | ubiquitin C-terminal hydrolase L1 |
| CCND2 | 3.137527 | 0.000795 | 0.021152 | 3.531905 | Up | cyclin D2 |
| MTDH | 3.134009 | 8.58E-05 | 0.006622 | 4.210031 | Up | metadherin |
| ATP6V1D | 3.1239 | 0.0001 | 0.007145 | 4.164159 | Up | ATPase H+ transporting V1 subunit D |
| BOD1 | 3.11664 | 6.28E-06 | 0.002168 | 4.947675 | Up | biorientation of chromosomes in cell division 1 |
| MRPL12 | 3.114756 | 7.59E-05 | 0.006143 | 4.245866 | Up | mitochondrial ribosomal protein L12 |
| FOXN3 | 3.113552 | 0.000114 | 0.007817 | 4.126313 | Up | forkhead box N3 |
| POLR3GL | 3.098647 | 0.000131 | 0.008485 | 4.084894 | Up | RNA polymerase III subunit G like |
| ALKBH7 | 3.098442 | 0.000306 | 0.012934 | 3.830063 | Up | alkB homolog 7 |
| CDV3 | 3.096327 | 0.000108 | 0.007553 | 4.141317 | Up | CDV3 homolog |
| ZSCAN16-AS1 | 3.095847 | 7.34E-07 | 0.001025 | 5.523754 | Up | ZSCAN16 antisense RNA 1 |
| S100A13 | 3.091633 | 5.32E-05 | 0.005263 | 4.348914 | Up | S100 calcium binding protein A13 |
| GFPT1 | 3.085405 | 5.33E-05 | 0.005263 | 4.348282 | Up | glutamine--fructose-6-phosphate transaminase 1 |
| CCSER2 | 3.079066 | 3.98E-05 | 0.004552 | 4.431771 | Up | coiled-coil serine rich protein 2 |
| PET100 | 3.05957 | 0.000152 | 0.009259 | 4.041067 | Up | PET100 cytochrome c oxidase chaperone |
| POLR2J | 3.05183 | 0.000358 | 0.014077 | 3.781554 | Up | RNA polymerase II subunit J |
| SF3B6 | 3.047526 | 0.000179 | 0.009929 | 3.992753 | Up | splicing factor 3b subunit 6 |
| TSPAN17 | 3.044512 | 7.59E-06 | 0.002243 | 4.895829 | Up | tetraspanin 17 |
| ECSIT | 3.043372 | 1.61E-05 | 0.003137 | 4.688241 | Up | ECSIT signaling integrator |
| TMED4 | 3.041199 | 2.05E-05 | 0.00341 | 4.620554 | Up | transmembrane p24 trafficking protein 4 |
| ROMO1 | 3.039801 | 0.000339 | 0.013645 | 3.798806 | Up | reactive oxygen species modulator 1 |
| SCARNA2 | 3.037947 | 0.000602 | 0.018408 | 3.619837 | Up | small Cajal body-specific RNA 2 |
| RDX | 3.036218 | 1.11E-05 | 0.002709 | 4.790401 | Up | radixin |
| ATP6AP2 | 3.032219 | 0.000537 | 0.01724 | 3.656205 | Up | ATPase H+ transporting accessory protein 2 |
| MRPS6 | 3.031793 | 0.001246 | 0.026775 | 3.386766 | Up | mitochondrial ribosomal protein S6 |
| MAD2L1BP | 3.030044 | 1.83E-05 | 0.003308 | 4.651088 | Up | MAD2L1 binding protein |
| NNAT | 3.01612 | 0.001284 | 0.027046 | 3.376953 | Up | neuronatin |
| SNX8 | 3.011952 | 2.11E-05 | 0.00341 | 4.611584 | Up | sorting nexin 8 |
| ITGAV | 3.006812 | 0.000168 | 0.009643 | 4.011701 | Up | integrin subunit alpha V |
| TBCA | 3.005083 | 8.86E-05 | 0.006772 | 4.200708 | Up | tubulin folding cofactor A |
| SNAPIN | 3.00314 | 6.24E-05 | 0.005556 | 4.30272 | Up | SNAP associated protein |
| TIMM8B | 2.999367 | 0.000105 | 0.007409 | 4.149862 | Up | translocase of inner mitochondrial membrane 8 homolog B |
| TADA3 | 2.994876 | 4.72E-05 | 0.005 | 4.38301 | Up | transcriptional adaptor 3 |
| HLA-DPB1 | 2.992346 | 0.000391 | 0.014705 | 3.754948 | Up | major histocompatibility complex, class II, DP beta 1 |
| MGP | 2.989607 | 0.000677 | 0.019612 | 3.583067 | Up | matrix Gla protein |
| LAMTOR4 | 2.985466 | 0.000916 | 0.022949 | 3.486633 | Up | late endosomal/lysosomal adaptor, MAPK and MTOR activator 4 |
| BTF3L4 | 2.981702 | 8.91E-05 | 0.006776 | 4.199218 | Up | basic transcription factor 3 like 4 |
| TMX2 | 2.979038 | 0.000153 | 0.009259 | 4.040171 | Up | thioredoxin related transmembrane protein 2 |
| CFL2 | 2.977258 | 3.16E-05 | 0.004025 | 4.497382 | Up | cofilin 2 |
| FAM149A | 2.975549 | 6.83E-05 | 0.005946 | 4.276377 | Up | family with sequence similarity 149 member A |
| DTYMK | 2.966972 | 0.000289 | 0.012546 | 3.847791 | Up | deoxythymidylate kinase |
| MT1X | 2.96256 | 0.000442 | 0.015758 | 3.716594 | Up | metallothionein 1X |
| TSG101 | 2.95913 | 0.00027 | 0.012156 | 3.868591 | Up | tumor susceptibility 101 |
| CPED1 | 2.957683 | 0.000497 | 0.016679 | 3.680123 | Up | cadherin like and PC-esterase domain containing 1 |
| EXOC5 | 2.949442 | 0.000271 | 0.012156 | 3.867668 | Up | exocyst complex component 5 |
| BCYRN1 | 2.947993 | 1.57E-05 | 0.003137 | 4.695075 | Up | brain cytoplasmic RNA 1 |
| ANXA4 | 2.947244 | 2.18E-05 | 0.00341 | 4.602361 | Up | annexin A4 |
| DPP7 | 2.946214 | 8.92E-05 | 0.006776 | 4.198665 | Up | dipeptidyl peptidase 7 |
| SYVN1 | 2.942727 | 6.24E-05 | 0.005556 | 4.302587 | Up | synoviolin 1 |
| NDUFA13 | 2.941729 | 0.000735 | 0.020483 | 3.556961 | Up | NADH:ubiquinoneoxidoreductase subunit A13 |
| C9orf16 | 2.940481 | 0.000406 | 0.014994 | 3.743119 | Up | chromosome 9 open reading frame 16 |
| AMDHD2 | 2.940188 | 2.53E-05 | 0.00358 | 4.5612 | Up | amidohydrolase domain containing 2 |
| KLHL12 | 2.939522 | 2.85E-05 | 0.003867 | 4.527463 | Up | kelch like family member 12 |
| EIF2D | 2.938722 | 0.000261 | 0.011982 | 3.878331 | Up | eukaryotic translation initiation factor 2D |
| NDUFB2 | 2.935453 | 7.75E-05 | 0.006191 | 4.239855 | Up | NADH:ubiquinoneoxidoreductase subunit B2 |
| GLRX3 | 2.93158 | 0.001019 | 0.024195 | 3.452028 | Up | glutaredoxin 3 |
| THRSP | 2.927803 | 0.00402 | 0.04933 | 2.990471 | Up | thyroid hormone responsive |
| SLC25A11 | 2.925157 | 0.000548 | 0.017445 | 3.649379 | Up | solute carrier family 25 member 11 |
| NDFIP1 | 2.924945 | 8E-05 | 0.006317 | 4.230473 | Up | Nedd4 family interacting protein 1 |
| UBAC1 | 2.919604 | 0.000143 | 0.008978 | 4.058832 | Up | UBA domain containing 1 |
| SETD3 | 2.915915 | 0.000233 | 0.011326 | 3.913355 | Up | SET domain containing 3, actin histidinemethyltransferase |
| UQCRH | 2.914264 | 0.000206 | 0.010586 | 3.950821 | Up | ubiquinol-cytochrome c reductase hinge protein |
| LMBRD1 | 2.91352 | 0.000153 | 0.009259 | 4.039227 | Up | LMBR1 domain containing 1 |
| C1S | 2.913138 | 9.66E-05 | 0.007077 | 4.175345 | Up | complement C1s |
| YIPF6 | 2.909794 | 0.000398 | 0.014783 | 3.74923 | Up | Yip1 domain family member 6 |
| COX4I1 | 2.908785 | 0.000397 | 0.014772 | 3.749898 | Up | cytochrome c oxidase subunit 4I1 |
| NBN | 2.90833 | 3.91E-06 | 0.001884 | 5.076794 | Up | nibrin |
| TAF7 | 2.908109 | 0.000345 | 0.013777 | 3.793503 | Up | TATA-box binding protein associated factor 7 |
| ANAPC13 | 2.904023 | 0.002551 | 0.038877 | 3.147704 | Up | anaphase promoting complex subunit 13 |
| LYVE1 | 2.902347 | 0.001203 | 0.026382 | 3.398322 | Up | lymphatic vessel endothelial hyaluronan receptor 1 |
| PSMD14 | 2.901936 | 0.000247 | 0.011699 | 3.89503 | Up | proteasome 26S subunit, non-ATPase 14 |
| FAM32A | 2.900891 | 0.000535 | 0.01724 | 3.657406 | Up | family with sequence similarity 32 member A |
| UROS | 2.900315 | 0.00024 | 0.011528 | 3.904656 | Up | uroporphyrinogen III synthase |
| OST4 | 2.898201 | 0.002022 | 0.034115 | 3.226353 | Up | oligosaccharyltransferase complex subunit 4, non-catalytic |
| RBBP7 | 2.897646 | 0.000946 | 0.023286 | 3.476066 | Up | RB binding protein 7, chromatin remodeling factor |
| PRG4 | 2.897614 | 4.83E-05 | 0.005015 | 4.376505 | Up | proteoglycan 4 |
| COX7A2 | 2.896609 | 0.000818 | 0.021597 | 3.522952 | Up | cytochrome c oxidase subunit 7A2 |
| HMGCL | 2.895335 | 0.000179 | 0.009929 | 3.993321 | Up | 3-hydroxy-3-methylglutaryl-CoA lyase |
| FAM3A | 2.894614 | 8.47E-05 | 0.006573 | 4.213715 | Up | family with sequence similarity 3 member A |
| BAK1 | 2.892595 | 2.69E-05 | 0.00371 | 4.543614 | Up | BCL2 antagonist/killer 1 |
| ELOVL6 | 2.8913 | 7.93E-05 | 0.006283 | 4.232941 | Up | ELOVL fatty acid elongase 6 |
| CHCHD2 | 2.888344 | 0.000193 | 0.010317 | 3.970255 | Up | coiled-coil-helix-coiled-coil-helix domain containing 2 |
| PRMT1 | 2.886326 | 0.000236 | 0.01142 | 3.909722 | Up | protein arginine methyltransferase 1 |
| HCFC1R1 | 2.88509 | 0.000187 | 0.010126 | 3.979988 | Up | host cell factor C1 regulator 1 |
| RPS8 | 2.88263 | 0.000763 | 0.02086 | 3.545152 | Up | ribosomal protein S8 |
| JMJD8 | 2.880095 | 0.000466 | 0.016117 | 3.700249 | Up | jumonji domain containing 8 |
| VPS28 | 2.868412 | 0.00038 | 0.014539 | 3.763185 | Up | VPS28 subunit of ESCRT-I |
| EIF5 | 2.867934 | 0.00037 | 0.014306 | 3.772157 | Up | eukaryotic translation initiation factor 5 |
| ADCY6 | 2.866913 | 0.000145 | 0.009003 | 4.055897 | Up | adenylatecyclase 6 |
| NDUFC2 | 2.865496 | 0.001531 | 0.029477 | 3.319099 | Up | NADH:ubiquinoneoxidoreductase subunit C2 |
| PIGS | 2.862467 | 0.002273 | 0.036573 | 3.186856 | Up | phosphatidylinositol glycan anchor biosynthesis class S |
| C1QA | 2.861687 | 0.000816 | 0.021594 | 3.523683 | Up | complement C1q A chain |
| FDX1 | 2.861442 | 0.000394 | 0.014749 | 3.752127 | Up | ferredoxin 1 |
| RBX1 | 2.85968 | 0.000974 | 0.023505 | 3.466607 | Up | ring-box 1 |
| TRIB1 | 2.8594 | 3.17E-05 | 0.004025 | 4.496868 | Up | tribblespseudokinase 1 |
| COX6B1 | 2.858458 | 0.000469 | 0.01616 | 3.698433 | Up | cytochrome c oxidase subunit 6B1 |
| MDFI | 2.857869 | 0.000277 | 0.012363 | 3.860877 | Up | MyoD family inhibitor |
| RASD1 | 2.855883 | 0.00079 | 0.021079 | 3.533796 | Up | ras related dexamethasone induced 1 |
| SLC40A1 | 2.854864 | 0.003422 | 0.045502 | 3.046747 | Up | solute carrier family 40 member 1 |
| POLR2K | 2.854222 | 0.001838 | 0.032468 | 3.258347 | Up | RNA polymerase II subunit K |
| CYB5B | 2.852742 | 9.79E-05 | 0.00709 | 4.171566 | Up | cytochrome b5 type B |
| C1orf115 | 2.850887 | 0.001855 | 0.03266 | 3.255182 | Up | chromosome 1 open reading frame 115 |
| EIF3L | 2.846772 | 0.000651 | 0.019135 | 3.595545 | Up | eukaryotic translation initiation factor 3 subunit L |
| TMEM219 | 2.834679 | 0.001098 | 0.025262 | 3.427919 | Up | transmembrane protein 219 |
| UQCR11 | 2.833847 | 0.000542 | 0.017312 | 3.652923 | Up | ubiquinol-cytochrome c reductase, complex III subunit XI |
| AGFG1 | 2.83177 | 8.83E-05 | 0.006771 | 4.201612 | Up | ArfGAP with FG repeats 1 |
| MRPS15 | 2.831483 | 0.000629 | 0.018848 | 3.606346 | Up | mitochondrial ribosomal protein S15 |
| UBE2E1 | 2.82743 | 0.00062 | 0.018805 | 3.610605 | Up | ubiquitin conjugating enzyme E2 E1 |
| NQO1 | 2.827398 | 3.12E-05 | 0.004025 | 4.50132 | Up | NAD(P) H quinone dehydrogenase 1 |
| MORF4L1 | 2.825223 | 0.000145 | 0.009003 | 4.055546 | Up | mortality factor 4 like 1 |
| TM7SF3 | 2.823384 | 0.0001 | 0.007145 | 4.165181 | Up | transmembrane 7 superfamily member 3 |
| RPL35A | 2.822157 | 0.000266 | 0.012089 | 3.87247 | Up | ribosomal protein L35a |
| TMEM160 | 2.812975 | 0.000317 | 0.01319 | 3.819678 | Up | transmembrane protein 160 |
| LSM3 | 2.809963 | 0.000282 | 0.012404 | 3.854606 | Up | LSM3 homolog, U6 small nuclear RNA and mRNA degradation associated |
| PHB | 2.808084 | 0.000258 | 0.011974 | 3.881731 | Up | prohibitin |
| MRPS21 | 2.805911 | 0.000295 | 0.012696 | 3.841189 | Up | mitochondrial ribosomal protein S21 |
| TMEM256 | 2.804853 | 0.003453 | 0.045785 | 3.04363 | Up | transmembrane protein 256 |
| MRPS12 | 2.804789 | 0.000223 | 0.011092 | 3.925752 | Up | mitochondrial ribosomal protein S12 |
| PLTP | 2.803513 | 0.000258 | 0.011965 | 3.882486 | Up | phospholipid transfer protein |
| TNPO2 | 2.794461 | 0.000852 | 0.022167 | 3.509567 | Up | transportin 2 |
| SKIL | 2.793991 | 1.01E-05 | 0.002625 | 4.815964 | Up | SKI like proto-oncogene |
| SEC11A | 2.784473 | 0.001174 | 0.026198 | 3.406284 | Up | SEC11 homolog A, signal peptidase complex subunit |
| RPS10 | 2.783754 | 0.000749 | 0.020638 | 3.550811 | Up | ribosomal protein S10 |
| APOD | 2.777795 | 0.00264 | 0.039615 | 3.136112 | Up | apolipoprotein D |
| RAB4A | 2.777311 | 0.000182 | 0.01001 | 3.987809 | Up | RAB4A, member RAS oncogene family |
| RBMX | 2.774453 | 6.17E-05 | 0.005556 | 4.306198 | Up | RNA binding motif protein X-linked |
| ARFIP2 | 2.772975 | 0.000459 | 0.016062 | 3.705244 | Up | ADP ribosylation factor interacting protein 2 |
| CPE | 2.770836 | 0.001392 | 0.028193 | 3.350337 | Up | carboxypeptidase E |
| TCTN3 | 2.770597 | 8.94E-05 | 0.006776 | 4.198026 | Up | tectonic family member 3 |
| YWHAH | 2.77017 | 0.000866 | 0.02234 | 3.504563 | Up | tyrosine 3-monooxygenase/tryptophan 5-monooxygenase activation protein eta |
| PLXNA1 | 2.769986 | 1.66E-05 | 0.003137 | 4.67951 | Up | plexin A1 |
| AK1 | 2.767903 | 0.000273 | 0.012251 | 3.864784 | Up | adenylate kinase 1 |
| ORMDL1 | 2.767548 | 7.27E-05 | 0.005968 | 4.258602 | Up | ORMDL sphingolipid biosynthesis regulator 1 |
| SLTM | 2.767084 | 0.000706 | 0.020072 | 3.569499 | Up | SAFB like transcription modulator |
| PSMC5 | 2.760402 | 0.00097 | 0.023505 | 3.468114 | Up | proteasome 26S subunit, ATPase 5 |
| UHMK1 | 2.759638 | 0.000128 | 0.008394 | 4.09178 | Up | U2AF homology motif kinase 1 |
| AIFM1 | 2.757223 | 7.05E-05 | 0.005956 | 4.267206 | Up | apoptosis inducing factor mitochondria associated 1 |
| TATDN1 | 2.756526 | 0.000672 | 0.019534 | 3.585379 | Up | TatDDNase domain containing 1 |
| COX6C | 2.753983 | 0.000372 | 0.014337 | 3.769771 | Up | cytochrome c oxidase subunit 6C |
| GIPC1 | 2.753721 | 0.000335 | 0.013596 | 3.802772 | Up | GIPC PDZ domain containing family member 1 |
| RPS21 | 2.753031 | 0.000158 | 0.009439 | 4.030076 | Up | ribosomal protein S21 |
| CCDC85B | 2.752819 | 0.001517 | 0.029361 | 3.322182 | Up | coiled-coil domain containing 85B |
| UAP1 | 2.74977 | 0.001158 | 0.026017 | 3.410666 | Up | UDP-N-acetylglucosaminepyrophosphorylase 1 |
| POFUT1 | 2.742386 | 0.000309 | 0.012965 | 3.827384 | Up | protein O-fucosyltransferase 1 |
| C3AR1 | 2.736533 | 2.1E-05 | 0.00341 | 4.613724 | Up | complement C3a receptor 1 |
| SRP72 | 2.734833 | 5.43E-05 | 0.005283 | 4.342922 | Up | signal recognition particle 72 |
| ABHD17A | 2.734708 | 0.001052 | 0.024558 | 3.441677 | Up | abhydrolase domain containing 17A |
| TOMM7 | 2.730177 | 0.001231 | 0.026634 | 3.390625 | Up | translocase of outer mitochondrial membrane 7 |
| ANP32B | 2.728749 | 0.00161 | 0.030287 | 3.302334 | Up | acidic nuclear phosphoprotein 32 family member B |
| TMEM230 | 2.728085 | 0.001136 | 0.025784 | 3.416807 | Up | transmembrane protein 230 |
| NABP2 | 2.7271 | 0.000369 | 0.014306 | 3.772639 | Up | nucleic acid binding protein 2 |
| CDC27 | 2.726993 | 0.001334 | 0.027538 | 3.364495 | Up | cell division cycle 27 |
| FAM20B | 2.723814 | 0.000841 | 0.021962 | 3.513811 | Up | FAM20B glycosaminoglycan xylosylkinase |
| ETF1 | 2.7213 | 0.000538 | 0.01724 | 3.655315 | Up | eukaryotic translation termination factor 1 |
| GRHPR | 2.720938 | 0.000857 | 0.022226 | 3.507777 | Up | glyoxylate and hydroxypyruvatereductase |
| DERL2 | 2.720492 | 0.000154 | 0.009266 | 4.038321 | Up | derlin 2 |
| RPL36A | 2.720487 | 0.000898 | 0.02272 | 3.492922 | Up | ribosomal protein L36a |
| C19orf53 | 2.718168 | 0.000499 | 0.016701 | 3.678807 | Up | chromosome 19 open reading frame 53 |
| GTF2A2 | 2.716967 | 0.000389 | 0.014658 | 3.756692 | Up | general transcription factor IIA subunit 2 |
| GADD45B | 2.716143 | 0.000261 | 0.011982 | 3.878655 | Up | growth arrest and DNA damage inducible beta |
| CDIPT | 2.714923 | 0.00013 | 0.00844 | 4.088275 | Up | CDP-diacylglycerol--inositol 3-phosphatidyltransferase |
| COX6A1 | 2.712855 | 0.000535 | 0.01724 | 3.657442 | Up | cytochrome c oxidase subunit 6A1 |
| SRSF6 | 2.711655 | 0.000694 | 0.019868 | 3.575141 | Up | serine and arginine rich splicing factor 6 |
| SCARB1 | 2.709938 | 0.00054 | 0.017244 | 3.654526 | Up | scavenger receptor class B member 1 |
| ASAP3 | 2.709641 | 3.15E-05 | 0.004025 | 4.498522 | Up | ArfGAP with SH3 domain, ankyrin repeat and PH domain 3 |
| RNASE1 | 2.702048 | 0.00234 | 0.037096 | 3.177048 | Up | ribonuclease A family member 1, pancreatic |
| NAPRT | 2.701 | 0.000937 | 0.023198 | 3.479213 | Up | nicotinatephosphoribosyltransferase |
| UQCRQ | 2.698312 | 0.000786 | 0.021056 | 3.535632 | Up | ubiquinol-cytochrome c reductase complex III subunit VII |
| COX7C | 2.697196 | 0.000888 | 0.022598 | 3.496307 | Up | cytochrome c oxidase subunit 7C |
| PSMB1 | 2.694976 | 0.000391 | 0.014705 | 3.754384 | Up | proteasome 20S subunit beta 1 |
| ECH1 | 2.694774 | 0.002021 | 0.034115 | 3.226513 | Up | enoyl-CoA hydratase 1 |
| RPS15A | 2.694313 | 0.000873 | 0.022405 | 3.502067 | Up | ribosomal protein S15a |
| ERH | 2.693982 | 9.3E-05 | 0.006902 | 4.186545 | Up | ERH mRNA splicing and mitosis factor |
| PSMD3 | 2.69342 | 0.000362 | 0.014114 | 3.77823 | Up | proteasome 26S subunit, non-ATPase 3 |
| MRPS24 | 2.689672 | 2.97E-06 | 0.001776 | 5.150884 | Up | mitochondrial ribosomal protein S24 |
| HSD17B10 | 2.689486 | 0.000184 | 0.010093 | 3.984586 | Up | hydroxysteroid 17-beta dehydrogenase 10 |
| ICMT | 2.68742 | 0.001623 | 0.030348 | 3.299776 | Up | isoprenylcysteine carboxyl methyltransferase |
| COX8A | 2.68611 | 0.00082 | 0.021597 | 3.521817 | Up | cytochrome c oxidase subunit 8A |
| RPS23 | 2.683611 | 0.001311 | 0.027304 | 3.370125 | Up | ribosomal protein S23 |
| TMEM165 | 2.683585 | 0.000309 | 0.012965 | 3.827632 | Up | transmembrane protein 165 |
| TMEM97 | 2.683426 | 1.54E-06 | 0.001401 | 5.327084 | Up | transmembrane protein 97 |
| COX7A2L | 2.680847 | 0.0015 | 0.029177 | 3.325736 | Up | cytochrome c oxidase subunit 7A2 like |
| FAM89B | 2.67751 | 0.003528 | 0.046326 | 3.036153 | Up | family with sequence similarity 89 member B |
| SMAD5 | 2.676775 | 0.0005 | 0.016701 | 3.678519 | Up | SMAD family member 5 |
| CCNC | 2.675154 | 0.002737 | 0.040448 | 3.123787 | Up | cyclin C |
| CDC42EP2 | 2.672348 | 0.000165 | 0.009593 | 4.016925 | Up | CDC42 effector protein 2 |
| UQCRC1 | 2.67139 | 3.96E-05 | 0.004552 | 4.433447 | Up | ubiquinol-cytochrome c reductase core protein 1 |
| COPS7A | 2.671383 | 0.001825 | 0.032315 | 3.260743 | Up | COP9 signalosome subunit 7A |
| CCDC80 | 2.670347 | 0.003064 | 0.042867 | 3.085018 | Up | coiled-coil domain containing 80 |
| PSMB4 | 2.669349 | 0.000572 | 0.017831 | 3.636053 | Up | proteasome 20S subunit beta 4 |
| EIF6 | 2.664726 | 0.000227 | 0.011159 | 3.920651 | Up | eukaryotic translation initiation factor 6 |
| PFDN5 | 2.657659 | 0.001117 | 0.025474 | 3.422216 | Up | prefoldin subunit 5 |
| AFF1 | 2.657404 | 0.00036 | 0.014077 | 3.78051 | Up | AF4/FMR2 family member 1 |
| UQCRFS1 | 2.656808 | 0.000434 | 0.01563 | 3.722419 | Up | ubiquinol-cytochrome c reductase, Rieske iron-sulfur polypeptide 1 |
| TYROBP | 2.652926 | 0.0038 | 0.047966 | 3.010176 | Up | TYRO protein tyrosine kinase binding protein |
| ANAPC5 | 2.650988 | 0.000463 | 0.016091 | 3.702541 | Up | anaphase promoting complex subunit 5 |
| TRMT112 | 2.643049 | 0.001145 | 0.025902 | 3.414206 | Up | tRNAmethyltransferase subunit 11-2 |
| ARF5 | 2.641389 | 0.002168 | 0.035481 | 3.202951 | Up | ADP ribosylation factor 5 |
| POLR1D | 2.64106 | 0.000197 | 0.010419 | 3.963486 | Up | RNA polymerase I and III subunit D |
| SNX9 | 2.639558 | 0.000559 | 0.017629 | 3.643451 | Up | sorting nexin 9 |
| NDUFS5 | 2.634939 | 0.000625 | 0.018808 | 3.608112 | Up | NADH:ubiquinoneoxidoreductase subunit S5 |
| KDSR | 2.634609 | 0.00089 | 0.022598 | 3.495893 | Up | 3-ketodihydrosphingosine reductase |
| KRTCAP2 | 2.634197 | 0.001854 | 0.032651 | 3.255495 | Up | keratinocyte associated protein 2 |
| RPAIN | 2.632929 | 0.00075 | 0.020638 | 3.55055 | Up | RPA interacting protein |
| OXCT1 | 2.63204 | 0.003122 | 0.043255 | 3.078538 | Up | 3-oxoacid CoA-transferase 1 |
| CAPNS1 | 2.631695 | 0.000733 | 0.020454 | 3.557742 | Up | calpain small subunit 1 |
| SERPINH1 | 2.631035 | 0.000261 | 0.011982 | 3.878996 | Up | serpin family H member 1 |
| TNIP2 | 2.630856 | 0.000242 | 0.011614 | 3.901038 | Up | TNFAIP3 interacting protein 2 |
| RASSF3 | 2.62826 | 0.004015 | 0.049293 | 2.990897 | Up | Ras association domain family member 3 |
| RPL27 | 2.626854 | 0.001008 | 0.024036 | 3.455675 | Up | ribosomal protein L27 |
| ARHGAP12 | 2.624075 | 0.0007 | 0.019959 | 3.572316 | Up | Rho GTPase activating protein 12 |
| PRPF31 | 2.623671 | 0.000129 | 0.008399 | 4.090841 | Up | pre-mRNA processing factor 31 |
| KLB | 2.623223 | 0.001365 | 0.027884 | 3.356946 | Up | klotho beta |
| TMX4 | 2.618625 | 0.00108 | 0.024945 | 3.433183 | Up | thioredoxin related transmembrane protein 4 |
| NQO2 | 2.617727 | 0.002855 | 0.041527 | 3.109292 | Up | N-ribosyldihydronicotinamide:quinonereductase 2 |
| NME2 | 2.617495 | 0.002462 | 0.038092 | 3.159908 | Up | NME/NM23 nucleoside diphosphate kinase 2 |
| SLC25A26 | 2.616798 | 1.27E-05 | 0.002881 | 4.754142 | Up | solute carrier family 25 member 26 |
| TOMM5 | 2.615408 | 0.003222 | 0.043977 | 3.067588 | Up | translocase of outer mitochondrial membrane 5 |
| ETFB | 2.614762 | 0.001976 | 0.033674 | 3.234172 | Up | electron transfer flavoprotein subunit beta |
| MOAP1 | 2.614239 | 0.000133 | 0.008495 | 4.081606 | Up | modulator of apoptosis 1 |
| NACC1 | 2.613132 | 1.23E-05 | 0.002829 | 4.761618 | Up | nucleus accumbens associated 1 |
| NAGLU | 2.612492 | 0.000258 | 0.011965 | 3.882494 | Up | N-acetyl-alpha-glucosaminidase |
| XRCC5 | 2.611431 | 0.000462 | 0.016091 | 3.703217 | Up | X-ray repair cross complementing 5 |
| RPL35 | 2.610712 | 0.000229 | 0.011194 | 3.918588 | Up | ribosomal protein L35 |
| KRCC1 | 2.608947 | 9.22E-05 | 0.006864 | 4.189205 | Up | lysine rich coiled-coil 1 |
| PSMB7 | 2.608925 | 0.001141 | 0.025828 | 3.415417 | Up | proteasome 20S subunit beta 7 |
| RPS29 | 2.608914 | 0.001176 | 0.026198 | 3.405623 | Up | ribosomal protein S29 |
| SNRPD2 | 2.604428 | 0.000499 | 0.016701 | 3.679267 | Up | small nuclear ribonucleoprotein D2 polypeptide |
| RSL24D1 | 2.604123 | 0.001206 | 0.026399 | 3.397372 | Up | ribosomal L24 domain containing 1 |
| RBM3 | 2.602465 | 0.000751 | 0.020661 | 3.549857 | Up | RNA binding motif protein 3 |
| RPL14 | 2.598328 | 0.002801 | 0.041085 | 3.115761 | Up | ribosomal protein L14 |
| DBI | 2.593769 | 0.001225 | 0.026608 | 3.392185 | Up | diazepam binding inhibitor, acyl-CoA binding protein |
| RPL13A | 2.592976 | 0.000949 | 0.023287 | 3.474966 | Up | ribosomal protein L13a |
| NAB1 | 2.591638 | 0.000791 | 0.021082 | 3.533288 | Up | NGFI-A binding protein 1 |
| STX10 | 2.590276 | 0.003718 | 0.047358 | 3.01781 | Up | syntaxin 10 |
| SLC35E1 | 2.589777 | 0.000244 | 0.011642 | 3.898916 | Up | solute carrier family 35 member E1 |
| GCHFR | 2.586356 | 0.00154 | 0.029477 | 3.317136 | Up | GTP cyclohydrolase I feedback regulator |
| WIPI1 | 2.586044 | 0.001049 | 0.024512 | 3.442577 | Up | WD repeat domain, phosphoinositide interacting 1 |
| TMEM50A | 2.586036 | 0.001551 | 0.029566 | 3.314827 | Up | transmembrane protein 50A |
| NELFB | 2.585911 | 0.000623 | 0.018805 | 3.609156 | Up | negative elongation factor complex member B |
| MRPL9 | 2.582693 | 0.000637 | 0.019003 | 3.60222 | Up | mitochondrial ribosomal protein L9 |
| DIP2C | 2.577846 | 1.51E-06 | 0.001401 | 5.333124 | Up | disco interacting protein 2 homolog C |
| PFDN1 | 2.577843 | 0.001923 | 0.033201 | 3.243123 | Up | prefoldin subunit 1 |
| PCYT2 | 2.574996 | 0.000343 | 0.013741 | 3.795229 | Up | phosphate cytidylyltransferase 2, ethanolamine |
| RPL29 | 2.574629 | 0.000911 | 0.022881 | 3.488378 | Up | ribosomal protein L29 |
| RPL30 | 2.574242 | 0.000917 | 0.022969 | 3.486043 | Up | ribosomal protein L30 |
| EMC4 | 2.572361 | 0.00205 | 0.034257 | 3.221746 | Up | ER membrane protein complex subunit 4 |
| RPL24 | 2.571676 | 0.002479 | 0.038185 | 3.157525 | Up | ribosomal protein L24 |
| RPS15 | 2.570516 | 0.001711 | 0.031119 | 3.282153 | Up | ribosomal protein S15 |
| SMARCD2 | 2.569052 | 0.000525 | 0.017152 | 3.66321 | Up | SWI/SNF related, matrix associated, actin dependent regulator of chromatin, subfamily d, member 2 |
| C9orf78 | 2.568679 | 9.48E-05 | 0.007003 | 4.180864 | Up | chromosome 9 open reading frame 78 |
| BLOC1S1 | 2.568295 | 0.001664 | 0.03072 | 3.291398 | Up | biogenesis of lysosomal organelles complex 1 subunit 1 |
| ATP9A | 2.567757 | 0.000243 | 0.011614 | 3.900357 | Up | ATPase phospholipid transporting 9A (putative) |
| MS4A4A | 2.566919 | 5.96E-05 | 0.005493 | 4.316129 | Up | membrane spanning 4-domains A4A |
| AFAP1L1 | 2.565706 | 0.002187 | 0.035677 | 3.199902 | Up | actin filament associated protein 1 like 1 |
| CDKN2B | 2.565157 | 0.000599 | 0.018321 | 3.621709 | Up | cyclin dependent kinase inhibitor 2B |
| IFI27 | 2.563118 | 0.00371 | 0.047358 | 3.01863 | Up | interferon alpha inducible protein 27 |
| MED4 | 2.555663 | 0.001188 | 0.026311 | 3.402174 | Up | mediator complex subunit 4 |
| DPH5 | 2.553328 | 3.71E-05 | 0.004462 | 4.452413 | Up | diphthamide biosynthesis 5 |
| WIZ | 2.550083 | 0.000617 | 0.018752 | 3.612543 | Up | WIZ zinc finger |
| PEX19 | 2.549485 | 0.003066 | 0.042867 | 3.084727 | Up | peroxisomal biogenesis factor 19 |
| RABGEF1 | 2.547097 | 0.001793 | 0.032062 | 3.266518 | Up | RAB guanine nucleotide exchange factor 1 |
| SLC9A3R1 | 2.544376 | 0.000906 | 0.022852 | 3.490141 | Up | SLC9A3 regulator 1 |
| ANO6 | 2.541247 | 0.00097 | 0.023505 | 3.468073 | Up | anoctamin 6 |
| RPLP0 | 2.539879 | 0.000147 | 0.009101 | 4.051259 | Up | ribosomal protein lateral stalk subunit P0 |
| EZH1 | 2.538446 | 0.000787 | 0.021056 | 3.535293 | Up | enhancer of zeste 1 polycomb repressive complex 2 subunit |
| PSKH1 | 2.53776 | 0.001027 | 0.024288 | 3.449585 | Up | protein serine kinase H1 |
| RPL34 | 2.53733 | 0.000646 | 0.0191 | 3.597964 | Up | ribosomal protein L34 |
| NDUFS4 | 2.53691 | 0.000267 | 0.012096 | 3.871781 | Up | NADH:ubiquinoneoxidoreductase subunit S4 |
| BANF1 | 2.535865 | 0.000572 | 0.017831 | 3.636063 | Up | barrier to autointegration factor 1 |
| MRPL54 | 2.533785 | 0.000952 | 0.023287 | 3.473973 | Up | mitochondrial ribosomal protein L54 |
| CKS1B | 2.533771 | 0.000911 | 0.022881 | 3.488195 | Up | CDC28 protein kinase regulatory subunit 1B |
| TMEM184B | 2.532583 | 1.67E-05 | 0.003137 | 4.676649 | Up | transmembrane protein 184B |
| PSMD10 | 2.530765 | 0.00053 | 0.01724 | 3.660242 | Up | proteasome 26S subunit, non-ATPase 10 |
| RPS5 | 2.529965 | 0.000597 | 0.018297 | 3.622831 | Up | ribosomal protein S5 |
| CUL4A | 2.529656 | 0.001663 | 0.03072 | 3.291653 | Up | cullin 4A |
| MFAP5 | 2.527961 | 0.000821 | 0.021597 | 3.521542 | Up | microfibril associated protein 5 |
| SNTA1 | 2.526907 | 0.000372 | 0.014337 | 3.770146 | Up | syntrophin alpha 1 |
| RPS20 | 2.52651 | 0.002839 | 0.041407 | 3.111181 | Up | ribosomal protein S20 |
| RSL1D1 | 2.524784 | 0.000405 | 0.014978 | 3.743879 | Up | ribosomal L1 domain containing 1 |
| RPS24 | 2.523665 | 0.002187 | 0.035677 | 3.200019 | Up | ribosomal protein S24 |
| ICAM2 | 2.52328 | 0.00175 | 0.031637 | 3.274701 | Up | intercellular adhesion molecule 2 |
| B4GALT2 | 2.522208 | 0.001703 | 0.031013 | 3.283844 | Up | beta-1,4-galactosyltransferase 2 |
| NUDT16 | 2.521704 | 0.001545 | 0.029527 | 3.315981 | Up | nudix hydrolase 16 |
| PFN2 | 2.519815 | 0.001062 | 0.024764 | 3.438594 | Up | profilin 2 |
| RAB10 | 2.519714 | 0.003057 | 0.04281 | 3.085745 | Up | RAB10, member RAS oncogene family |
| SF3B5 | 2.519177 | 0.003604 | 0.046771 | 3.028686 | Up | splicing factor 3b subunit 5 |
| TCEAL8 | 2.516685 | 0.003486 | 0.04603 | 3.040293 | Up | transcription elongation factor A like 8 |
| CD99L2 | 2.51621 | 0.001957 | 0.03358 | 3.23728 | Up | CD99 molecule like 2 |
| SUCLG1 | 2.514671 | 0.001177 | 0.026198 | 3.405243 | Up | succinate-CoA ligase alpha subunit |
| LAMA2 | 2.514019 | 0.000535 | 0.01724 | 3.657403 | Up | laminin subunit alpha 2 |
| EIF3E | 2.511931 | 0.000766 | 0.020887 | 3.543592 | Up | eukaryotic translation initiation factor 3 subunit E |
| BCL7B | 2.511858 | 0.000361 | 0.014084 | 3.779795 | Up | BAF chromatin remodeling complex subunit BCL7B |
| SEPHS2 | 2.511732 | 0.000202 | 0.010561 | 3.955986 | Up | selenophosphatesynthetase 2 |
| LOXL2 | 2.511606 | 0.000883 | 0.022598 | 3.498175 | Up | lysyl oxidase like 2 |
| PMM1 | 2.511461 | 0.00143 | 0.02855 | 3.341501 | Up | phosphomannomutase 1 |
| DNPH1 | 2.50873 | 0.002905 | 0.041811 | 3.103319 | Up | 2'-deoxynucleoside 5'-phosphate N-hydrolase 1 |
| RARRES2 | 2.504265 | 0.003791 | 0.047902 | 3.011021 | Up | retinoic acid receptor responder 2 |
| COA3 | 2.50271 | 0.001102 | 0.025262 | 3.426827 | Up | cytochrome c oxidase assembly factor 3 |
| MRPS34 | 2.502001 | 0.000919 | 0.022981 | 3.485574 | Up | mitochondrial ribosomal protein S34 |
| SLC30A7 | -3.56691 | 4.14E-07 | 0.00095 | -5.67461 | Down | solute carrier family 30 member 7 |
| VTI1A | -3.31043 | 1.05E-07 | 0.000478 | -6.03155 | Down | vesicle transport through interaction with t-SNAREs 1A |
| ERG | -3.30133 | 2.32E-05 | 0.003497 | -4.58491 | Down | ETS transcription factor ERG |
| ZFYVE1 | -3.18784 | 1.03E-06 | 0.001179 | -5.43378 | Down | zinc finger FYVE-type containing 1 |
| AAK1 | -3.1737 | 2.73E-06 | 0.001776 | -5.17359 | Down | AP2 associated kinase 1 |
| URB2 | -3.16731 | 8.19E-07 | 0.00108 | -5.49481 | Down | URB2 ribosome biogenesis homolog |
| IGIP | -3.12032 | 5.55E-05 | 0.005363 | -4.33643 | Down | IgA inducing protein |
| ITIH4 | -2.9168 | 3.51E-06 | 0.001852 | -5.10571 | Down | inter-alpha-trypsin inhibitor heavy chain 4 |
| LOC646214 | -2.85088 | 0.000346 | 0.013805 | -3.79234 | Down | p21 protein (Cdc42/Rac)-activated kinase 2 pseudogene |
| ZNF486 | -2.84793 | 1.14E-05 | 0.002738 | -4.78297 | Down | zinc finger protein 486 |
| TET3 | -2.81596 | 1.11E-06 | 0.001179 | -5.41343 | Down | tetmethylcytosinedioxygenase 3 |
| HECW2 | -2.8127 | 3.17E-05 | 0.004025 | -4.49639 | Down | HECT, C2 and WW domain containing E3 ubiquitin protein ligase 2 |
| LPXN | -2.80145 | 3.07E-06 | 0.001776 | -5.14246 | Down | leupaxin |
| GOSR1 | -2.79883 | 1.73E-05 | 0.003174 | -4.66687 | Down | golgi SNAP receptor complex member 1 |
| PDPR | -2.78381 | 4.99E-05 | 0.005058 | -4.36736 | Down | pyruvate dehydrogenase phosphatase regulatory subunit |
| TNKS | -2.74917 | 9.17E-05 | 0.006848 | -4.19071 | Down | tankyrase |
| ECD | -2.73445 | 0.000348 | 0.013823 | -3.79107 | Down | ecdysoneless cell cycle regulator |
| ABCC5 | -2.72387 | 1.16E-05 | 0.002752 | -4.77862 | Down | ATP binding cassette subfamily C member 5 |
| STXBP5 | -2.71632 | 0.000176 | 0.009858 | -3.99744 | Down | syntaxin binding protein 5 |
| WDR19 | -2.69898 | 0.000615 | 0.018721 | -3.61344 | Down | WD repeat domain 19 |
| SARM1 | -2.69717 | 1.19E-09 | 1.98E-05 | -7.17529 | Down | sterile alpha and TIR motif containing 1 |
| TRAF5 | -2.66677 | 0.000107 | 0.007492 | -4.14579 | Down | TNF receptor associated factor 5 |
| SYNE2 | -2.663 | 5.87E-05 | 0.005493 | -4.32047 | Down | spectrin repeat containing nuclear envelope protein 2 |
| CFP | -2.6567 | 0.000675 | 0.019585 | -3.58386 | Down | complement factor properdin |
| ANKRD20A9P | -2.64322 | 0.001714 | 0.031148 | -3.28161 | Down | ankyrin repeat domain 20 family member A9, pseudogene |
| FAT4 | -2.63099 | 0.000494 | 0.016631 | -3.68187 | Down | FAT atypical cadherin 4 |
| HIVEP1 | -2.62581 | 8.18E-05 | 0.006387 | -4.22422 | Down | HIVEP zinc finger 1 |
| SNAP47 | -2.61436 | 0.000216 | 0.010911 | -3.93599 | Down | synaptosome associated protein 47 |
| DMRT2 | -2.61357 | 0.000161 | 0.009544 | -4.02349 | Down | doublesex and mab-3 related transcription factor 2 |
| GEMIN5 | -2.60553 | 3.51E-05 | 0.004269 | -4.46757 | Down | gem nuclear organelle associated protein 5 |
| LOC643406 | -2.59315 | 0.000435 | 0.015643 | -3.72139 | Down | uncharacterized LOC643406 |
| OBSCN | -2.58615 | 0.000237 | 0.011453 | -3.90744 | Down | obscurin, cytoskeletal calmodulin and titin-interacting RhoGEF |
| ATP13A1 | -2.57902 | 6.26E-05 | 0.005556 | -4.3019 | Down | ATPase 13A1 |
| LOC105372795 | -2.56184 | 2.46E-06 | 0.001776 | -5.2015 | Down | uncharacterized LOC105372795 |
| PXMP4 | -2.55289 | 0.000508 | 0.016883 | -3.67316 | Down | peroxisomal membrane protein 4 |
| FAS | -2.51889 | 0.000221 | 0.011049 | -3.92874 | Down | Fas cell surface death receptor |
| MGAM | -2.5179 | 0.001226 | 0.026608 | -3.39213 | Down | maltase-glucoamylase |
| ERCC6L2 | -2.49433 | 0.000462 | 0.016091 | -3.70269 | Down | ERCC excision repair 6 like 2 |
| MFAP3 | -2.48427 | 9.78E-05 | 0.00709 | -4.17183 | Down | microfibril associated protein 3 |
| TPD52 | -2.48206 | 0.001319 | 0.027418 | -3.36809 | Down | tumor protein D52 |
| PPP1R3B | -2.47428 | 0.001536 | 0.029477 | -3.31797 | Down | protein phosphatase 1 regulatory subunit 3B |
| PTGDR | -2.46695 | 4.33E-07 | 0.00095 | -5.66312 | Down | prostaglandin D2 receptor |
| AHSP | -2.45099 | 4.99E-06 | 0.002061 | -5.01026 | Down | alpha hemoglobin stabilizing protein |
| ODF2 | -2.44884 | 0.000531 | 0.01724 | -3.65942 | Down | outer dense fiber of sperm tails 2 |
| MAU2 | -2.44852 | 0.002675 | 0.039958 | -3.1315 | Down | MAU2 sister chromatid cohesion factor |
| PTOV1-AS2 | -2.44504 | 8.73E-06 | 0.002428 | -4.85721 | Down | PTOV1 antisense RNA 2 |
| SLCO4A1 | -2.42489 | 9.04E-05 | 0.006791 | -4.19486 | Down | solute carrier organic anion transporter family member 4A1 |
| RAP1GAP2 | -2.41727 | 0.000428 | 0.015491 | -3.72656 | Down | RAP1 GTPase activating protein 2 |
| GUSBP11 | -2.41706 | 1.72E-05 | 0.003165 | -4.66966 | Down | GUSB pseudogene 11 |
| CHST14 | -2.40289 | 6.43E-06 | 0.002175 | -4.94093 | Down | carbohydrate sulfotransferase 14 |
| SMYD4 | -2.3923 | 0.000889 | 0.022598 | -3.49612 | Down | SET and MYND domain containing 4 |
| CACNA2D4 | -2.38689 | 1.62E-05 | 0.003137 | -4.6856 | Down | calcium voltage-gated channel auxiliary subunit alpha2delta 4 |
| ERO1A | -2.3862 | 0.001273 | 0.026966 | -3.37975 | Down | endoplasmic reticulum oxidoreductase 1 alpha |
| ATRNL1 | -2.37103 | 1.84E-05 | 0.003308 | -4.64955 | Down | attractin like 1 |
| ATL1 | -2.37076 | 0.000548 | 0.017445 | -3.64947 | Down | atlastinGTPase 1 |
| EPHB4 | -2.36058 | 0.000451 | 0.015882 | -3.71047 | Down | EPH receptor B4 |
| AOC4P | -2.35367 | 3.9E-06 | 0.001884 | -5.07705 | Down | amine oxidase copper containing 4, pseudogene |
| SLC25A13 | -2.34818 | 0.000134 | 0.008515 | -4.07881 | Down | solute carrier family 25 member 13 |
| FAM13B | -2.34187 | 0.003334 | 0.044854 | -3.05577 | Down | family with sequence similarity 13 member B |
| TRAK1 | -2.33457 | 0.000883 | 0.022598 | -3.49834 | Down | trafficking kinesin protein 1 |
| ABI3 | -2.3343 | 0.000274 | 0.012278 | -3.8636 | Down | ABI family member 3 |
| SEMA6B | -2.33392 | 4.57E-05 | 0.004952 | -4.39248 | Down | semaphorin 6B |
| METTL21A | -2.33362 | 0.002789 | 0.040954 | -3.11724 | Down | methyltransferase like 21A |
| ZNF778 | -2.33087 | 3.93E-06 | 0.001884 | -5.07521 | Down | zinc finger protein 778 |
| PDE4B | -2.32078 | 0.000786 | 0.021056 | -3.5357 | Down | phosphodiesterase 4B |
| NDC1 | -2.31958 | 0.000208 | 0.010631 | -3.94732 | Down | NDC1 transmembranenucleoporin |
| SLC9A7 | -2.31311 | 0.001151 | 0.025956 | -3.41266 | Down | solute carrier family 9 member A7 |
| NLGN2 | -2.31264 | 7.89E-05 | 0.006274 | -4.23441 | Down | neuroligin 2 |
| IKZF4 | -2.30922 | 0.000113 | 0.007788 | -4.12818 | Down | IKAROS family zinc finger 4 |
| MAST3 | -2.3067 | 0.001042 | 0.024428 | -3.44474 | Down | microtubule associated serine/threonine kinase 3 |
| SAP25 | -2.30632 | 0.000324 | 0.013394 | -3.81298 | Down | Sin3A associated protein 25 |
| ZNF213-AS1 | -2.30592 | 3.03E-06 | 0.001776 | -5.14592 | Down | ZNF213 antisense RNA 1 (head to head) |
| ADAMTS13 | -2.30408 | 2.03E-06 | 0.001623 | -5.25359 | Down | ADAM metallopeptidase with thrombospondin type 1 motif 13 |
| CDH19 | -2.30007 | 9.85E-06 | 0.002623 | -4.82394 | Down | cadherin 19 |
| DOCK9 | -2.28015 | 0.002517 | 0.038469 | -3.15239 | Down | dedicator of cytokinesis 9 |
| PARP10 | -2.27632 | 0.003654 | 0.047012 | -3.0239 | Down | poly (ADP-ribose) polymerase family member 10 |
| LOC648987 | -2.27592 | 2.87E-06 | 0.001776 | -5.16 | Down | uncharacterized LOC648987 |
| GIMAP8 | -2.27461 | 0.001512 | 0.029333 | -3.32309 | Down | GTPase, IMAP family member 8 |
| COL8A1 | -2.27216 | 0.00307 | 0.042867 | -3.08427 | Down | collagen type VIII alpha 1 chain |
| MYO7A | -2.26997 | 5.89E-06 | 0.002131 | -4.96524 | Down | myosin VIIA |
| SLC25A35 | -2.26394 | 4.18E-05 | 0.004645 | -4.41821 | Down | solute carrier family 25 member 35 |
| ESR1 | -2.25478 | 0.000772 | 0.020954 | -3.54124 | Down | estrogen receptor 1 |
| FAM71F2 | -2.25074 | 5.55E-06 | 0.002118 | -4.98153 | Down | family with sequence similarity 71 member F2 |
| ZNF493 | -2.24829 | 0.000671 | 0.019525 | -3.58587 | Down | zinc finger protein 493 |
| CEP135 | -2.24319 | 1.89E-05 | 0.003342 | -4.64292 | Down | centrosomal protein 135 |
| CEP126 | -2.24051 | 0.001032 | 0.024341 | -3.44789 | Down | centrosomal protein 126 |
| ASTN2 | -2.23592 | 0.001156 | 0.026012 | -3.41115 | Down | astrotactin 2 |
| IPP | -2.22612 | 0.000101 | 0.007163 | -4.16214 | Down | intracisternal A particle-promoted polypeptide |
| TANGO6 | -2.2248 | 0.000418 | 0.015262 | -3.73417 | Down | transport and golgi organization 6 homolog |
| ZXDC | -2.22107 | 0.001926 | 0.033211 | -3.24265 | Down | ZXD family zinc finger C |
| TMCO4 | -2.21386 | 0.000912 | 0.022891 | -3.48775 | Down | transmembrane and coiled-coil domains 4 |
| WSCD1 | -2.20938 | 1.36E-05 | 0.003004 | -4.73545 | Down | WSC domain containing 1 |
| PLXNB3 | -2.20331 | 0.000194 | 0.010359 | -3.96765 | Down | plexin B3 |
| SPAST | -2.19723 | 0.003713 | 0.047358 | -3.01835 | Down | spastin |
| LRSAM1 | -2.19647 | 0.00028 | 0.012403 | -3.85725 | Down | leucine rich repeat and sterile alpha motif containing 1 |
| BANP | -2.19578 | 0.002678 | 0.039958 | -3.13116 | Down | BTG3 associated nuclear protein |
| SCAF4 | -2.1951 | 0.001471 | 0.028954 | -3.33217 | Down | SR-related CTD associated factor 4 |
| SDCCAG8 | -2.19392 | 0.001272 | 0.026966 | -3.38007 | Down | serologically defined colon cancer antigen 8 |
| KCNQ1OT1 | -2.19178 | 0.002417 | 0.037819 | -3.16609 | Down | KCNQ1 opposite strand/antisense transcript 1 |
| CD82 | -2.18167 | 0.001254 | 0.026814 | -3.38461 | Down | CD82 molecule |
| KIAA0754 | -2.17697 | 0.000994 | 0.023761 | -3.46018 | Down | KIAA0754 |
| PTPRN2 | -2.17646 | 0.00099 | 0.023704 | -3.46132 | Down | protein tyrosine phosphatase receptor type N2 |
| MYLK-AS1 | -2.16901 | 0.000153 | 0.009259 | -4.03959 | Down | MYLK antisense RNA 1 |
| PLXDC1 | -2.16377 | 0.001307 | 0.027262 | -3.37099 | Down | plexin domain containing 1 |
| TDRD5 | -2.15738 | 4.87E-05 | 0.005015 | -4.37413 | Down | tudor domain containing 5 |
| LCAT | -2.15173 | 0.000278 | 0.012383 | -3.85932 | Down | lecithin-cholesterol acyltransferase |
| PRDM11 | -2.15109 | 6.78E-07 | 0.001025 | -5.54474 | Down | PR/SET domain 11 |
| RASIP1 | -2.14799 | 0.000745 | 0.02059 | -3.55262 | Down | Ras interacting protein 1 |
| SPN | -2.14456 | 0.002682 | 0.039958 | -3.13065 | Down | sialophorin |
| SHISA9 | -2.14372 | 0.00386 | 0.048313 | -3.0047 | Down | shisa family member 9 |
| ANKRD6 | -2.14267 | 0.003628 | 0.046875 | -3.0264 | Down | ankyrin repeat domain 6 |
| MAK | -2.13779 | 2.41E-05 | 0.003515 | -4.57405 | Down | male germ cell associated kinase |
| EPHA4 | -2.13565 | 0.000848 | 0.022087 | -3.51135 | Down | EPH receptor A4 |
| UBR5-AS1 | -2.12673 | 2.81E-05 | 0.003842 | -4.53078 | Down | UBR5 antisense RNA 1 |
| CTC1 | -2.12661 | 0.003144 | 0.043426 | -3.07609 | Down | CST telomere replication complex component 1 |
| NPHP4 | -2.12045 | 7.65E-05 | 0.006152 | -4.24347 | Down | nephrocystin 4 |
| RFX3 | -2.11961 | 0.000286 | 0.012464 | -3.85121 | Down | regulatory factor X3 |
| PLD1 | -2.10857 | 0.000478 | 0.016343 | -3.69227 | Down | phospholipase D1 |
| ZNF474 | -2.10767 | 3.19E-06 | 0.001776 | -5.13193 | Down | zinc finger protein 474 |
| LCK | -2.10338 | 0.000224 | 0.011092 | -3.92537 | Down | LCK proto-oncogene, Src family tyrosine kinase |
| ZCCHC4 | -2.10229 | 0.002042 | 0.034193 | -3.22302 | Down | zinc finger CCHC-type containing 4 |
| PRPS2 | -2.09872 | 0.001319 | 0.027418 | -3.3681 | Down | phosphoribosyl pyrophosphate synthetase 2 |
| TAF4B | -2.09126 | 0.000171 | 0.009664 | -4.00627 | Down | TATA-box binding protein associated factor 4b |
| CDC42BPA | -2.08947 | 0.001389 | 0.028155 | -3.3511 | Down | CDC42 binding protein kinase alpha |
| LINC01230 | -2.0891 | 0.00033 | 0.013567 | -3.80731 | Down | long intergenic non-protein coding RNA 1230 |
| CPAMD8 | -2.08813 | 0.000302 | 0.012829 | -3.83385 | Down | C3 and PZP like alpha-2-macroglobulin domain containing 8 |
| PARP9 | -2.08698 | 0.001921 | 0.033188 | -3.24363 | Down | poly (ADP-ribose) polymerase family member 9 |
| ZFYVE27 | -2.08654 | 0.000479 | 0.016343 | -3.69181 | Down | zinc finger FYVE-type containing 27 |
| IWS1 | -2.08516 | 0.002881 | 0.041667 | -3.10619 | Down | interacts with SUPT6H, CTD assembly factor 1 |
| MMRN1 | -2.08143 | 0.000451 | 0.015882 | -3.7104 | Down | multimerin 1 |
| ST20-AS1 | -2.07521 | 6.76E-06 | 0.00223 | -4.92723 | Down | ST20 antisense RNA 1 |
| CALCR | -2.07464 | 5.03E-05 | 0.005083 | -4.36486 | Down | calcitonin receptor |
| KAT7 | -2.06821 | 0.003226 | 0.043983 | -3.06718 | Down | lysine acetyltransferase 7 |
| ARHGAP22 | -2.05873 | 4.78E-06 | 0.002061 | -5.02181 | Down | Rho GTPase activating protein 22 |
| TMEM199 | -2.05777 | 0.002257 | 0.036467 | -3.18933 | Down | transmembrane protein 199 |
| NTN1 | -2.05766 | 0.000168 | 0.009643 | -4.01109 | Down | netrin 1 |
| LAMA5 | -2.05607 | 0.002141 | 0.035221 | -3.20706 | Down | laminin subunit alpha 5 |
| SPNS3 | -2.05195 | 2.18E-05 | 0.00341 | -4.60239 | Down | sphingolipid transporter 3 (putative) |
| NEDD4L | -2.04969 | 0.001542 | 0.029477 | -3.31678 | Down | NEDD4 like E3 ubiquitin protein ligase |
| BSN | -2.04855 | 2.9E-05 | 0.003871 | -4.52186 | Down | bassoon presynaptic cytomatrix protein |
| TMED8 | -2.04722 | 7.63E-06 | 0.002243 | -4.89431 | Down | transmembrane p24 trafficking protein family member 8 |
| STRBP | -2.04479 | 0.003521 | 0.046281 | -3.03684 | Down | spermatid perinuclear RNA binding protein |
| ATP13A4 | -2.04282 | 5.91E-05 | 0.005493 | -4.3185 | Down | ATPase 13A4 |
| KLC2 | -2.03984 | 0.001017 | 0.024181 | -3.45276 | Down | kinesin light chain 2 |
| RLF | -2.03665 | 0.001889 | 0.032833 | -3.2492 | Down | rearranged L-myc fusion |
| TTF1 | -2.03264 | 0.002608 | 0.03937 | -3.14019 | Down | transcription termination factor 1 |
| TMEM79 | -2.0311 | 5.41E-05 | 0.005279 | -4.34419 | Down | transmembrane protein 79 |
| ZCCHC2 | -2.02905 | 0.002297 | 0.036735 | -3.18334 | Down | zinc finger CCHC-type containing 2 |
| ANKRD13B | -2.02722 | 0.001008 | 0.024036 | -3.45558 | Down | ankyrin repeat domain 13B |
| IFT122 | -2.02015 | 0.002868 | 0.041571 | -3.10772 | Down | intraflagellar transport 122 |
| MAP 3K14 | -2.01534 | 0.003484 | 0.046026 | -3.0405 | Down | mitogen-activated protein kinase kinasekinase 14 |
| SPATA6L | -2.01191 | 3.29E-05 | 0.004116 | -4.48594 | Down | spermatogenesis associated 6 like |
| SCOC-AS1 | -2.01128 | 0.00093 | 0.023147 | -3.48171 | Down | SCOC antisense RNA 1 |
| LMO7 | -2.00579 | 0.000573 | 0.017831 | -3.63573 | Down | LIM domain 7 |
| MEX3B | -1.99674 | 2.01E-05 | 0.00341 | -4.6259 | Down | mex-3 RNA binding family member B |
| IQCK | -1.99382 | 0.00025 | 0.011782 | -3.89149 | Down | IQ motif containing K |
| GPATCH1 | -1.9934 | 0.000126 | 0.008296 | -4.09746 | Down | G-patch domain containing 1 |
| HPS4 | -1.98942 | 0.002434 | 0.037832 | -3.16378 | Down | HPS4 biogenesis of lysosomal organelles complex 3 subunit 2 |
| FGFR3 | -1.98496 | 1.56E-05 | 0.003137 | -4.6955 | Down | fibroblast growth factor receptor 3 |
| GABRA4 | -1.98306 | 0.000116 | 0.007921 | -4.1216 | Down | gamma-aminobutyric acid type A receptor alpha4 subunit |
| TMEM116 | -1.97917 | 0.000648 | 0.0191 | -3.5967 | Down | transmembrane protein 116 |
| CTU1 | -1.97326 | 4.92E-06 | 0.002061 | -5.01408 | Down | cytosolic thiouridylase subunit 1 |
| PPIEL | -1.9687 | 0.002144 | 0.035221 | -3.20669 | Down | peptidylprolylisomerase E like pseudogene |
| FUT11 | -1.965 | 0.000688 | 0.019806 | -3.57787 | Down | fucosyltransferase 11 |
| TOP3A | -1.96066 | 0.00295 | 0.04205 | -3.098 | Down | DNA topoisomerase III alpha |
| C22orf34 | -1.95954 | 0.000251 | 0.011782 | -3.89083 | Down | chromosome 22 open reading frame 34 |
| ASIC3 | -1.95737 | 4.65E-05 | 0.005 | -4.38764 | Down | acid sensing ion channel subunit 3 |
| SNPH | -1.95235 | 0.002152 | 0.035284 | -3.20546 | Down | syntaphilin |
| ZNF547 | -1.95217 | 0.000487 | 0.016474 | -3.68677 | Down | zinc finger protein 547 |
| FEZ1 | -1.94468 | 0.000873 | 0.022405 | -3.50206 | Down | fasciculation and elongation protein zeta 1 |
| ENTPD5 | -1.94339 | 0.000264 | 0.012058 | -3.87463 | Down | ectonucleoside triphosphate diphosphohydrolase 5 (inactive) |
| LOC729683 | -1.94235 | 2.6E-05 | 0.00365 | -4.55269 | Down | uncharacterized LOC729683 |
| S1PR5 | -1.94099 | 8.19E-05 | 0.006387 | -4.22381 | Down | sphingosine-1-phosphate receptor 5 |
| ZNF300P1 | -1.93492 | 0.000171 | 0.009664 | -4.00596 | Down | zinc finger protein 300 pseudogene 1 |
| UNC13C | -1.93485 | 0.000438 | 0.015649 | -3.7196 | Down | unc-13 homolog C |
| LOC101928370 | -1.93447 | 2.11E-06 | 0.001634 | -5.24334 | Down | uncharacterized LOC101928370 |
| ZNF555 | -1.92846 | 0.000376 | 0.014411 | -3.76684 | Down | zinc finger protein 555 |
| GADD45G | -1.92497 | 0.001994 | 0.03385 | -3.23101 | Down | growth arrest and DNA damage inducible gamma |
| KCNC1 | -1.92247 | 2.19E-05 | 0.00341 | -4.60096 | Down | potassium voltage-gated channel subfamily C member 1 |
| CARD14 | -1.91822 | 6.28E-06 | 0.002168 | -4.9474 | Down | caspase recruitment domain family member 14 |
| STK36 | -1.91359 | 0.003625 | 0.046875 | -3.0267 | Down | serine/threonine kinase 36 |
| TRIB3 | -1.91164 | 0.00031 | 0.012992 | -3.82577 | Down | tribblespseudokinase 3 |
| ZNF124 | -1.9092 | 0.000271 | 0.012156 | -3.86767 | Down | zinc finger protein 124 |
| MPZL3 | -1.90884 | 0.000298 | 0.012703 | -3.83854 | Down | myelin protein zero like 3 |
| TOR4A | -1.90324 | 0.00029 | 0.012546 | -3.84663 | Down | torsin family 4 member A |
| MIR3916 | -1.90072 | 4.48E-06 | 0.002039 | -5.03938 | Down | microRNA 3916 |
| ZNF334 | -1.89919 | 6.18E-06 | 0.002168 | -4.9521 | Down | zinc finger protein 334 |
| TTLL3 | -1.89535 | 0.000105 | 0.007409 | -4.1499 | Down | tubulin tyrosine ligase like 3 |
| ZKSCAN3 | -1.89411 | 0.001595 | 0.030071 | -3.30542 | Down | zinc finger with KRAB and SCAN domains 3 |
| PAPLN | -1.88842 | 0.001527 | 0.029477 | -3.31986 | Down | papilin, proteoglycan like sulfated glycoprotein |
| KNTC1 | -1.88703 | 0.000207 | 0.01061 | -3.94852 | Down | kinetochore associated 1 |
| SLC1A7 | -1.88316 | 0.000163 | 0.009559 | -4.01961 | Down | solute carrier family 1 member 7 |
| BCL9 | -1.87682 | 0.00158 | 0.029935 | -3.30857 | Down | BCL9 transcription coactivator |
| ZNF496 | -1.87502 | 0.00041 | 0.015068 | -3.74029 | Down | zinc finger protein 496 |
| LNX2 | -1.87272 | 0.003479 | 0.045998 | -3.04098 | Down | ligand of numb-protein X 2 |
| DNAJC18 | -1.8714 | 0.000203 | 0.010561 | -3.95515 | Down | DnaJ heat shock protein family (Hsp40) member C18 |
| ZNF114 | -1.86888 | 6.34E-05 | 0.0056 | -4.29807 | Down | zinc finger protein 114 |
| VWA3B | -1.86543 | 3.01E-05 | 0.003964 | -4.51187 | Down | von Willebrand factor A domain containing 3B |
| ARNTL2 | -1.86522 | 0.002029 | 0.034127 | -3.22522 | Down | aryl hydrocarbon receptor nuclear translocator like 2 |
| NGFR | -1.85434 | 0.000295 | 0.012696 | -3.84106 | Down | nerve growth factor receptor |
| CLEC1A | -1.85306 | 0.001166 | 0.026095 | -3.40829 | Down | C-type lectin domain family 1 member A |
| ZNF687 | -1.85305 | 0.003658 | 0.047012 | -3.02347 | Down | zinc finger protein 687 |
| ZNF69 | -1.85271 | 2.47E-05 | 0.003545 | -4.56704 | Down | zinc finger protein 69 |
| MTF1 | -1.85038 | 0.000974 | 0.023505 | -3.46684 | Down | metal regulatory transcription factor 1 |
| ZNF154 | -1.84509 | 0.00012 | 0.008053 | -4.11197 | Down | zinc finger protein 154 |
| SLAMF6 | -1.84139 | 0.00019 | 0.010241 | -3.9745 | Down | SLAM family member 6 |
| TMEM255B | -1.8379 | 5.28E-05 | 0.005263 | -4.35097 | Down | transmembrane protein 255B |
| HLA-H | -1.83482 | 0.002773 | 0.040755 | -3.11929 | Down | major histocompatibility complex, class I, H (pseudogene) |
| KBTBD7 | -1.82918 | 0.000254 | 0.011836 | -3.88686 | Down | kelch repeat and BTB domain containing 7 |
| CDC20B | -1.82896 | 6.91E-05 | 0.005946 | -4.2731 | Down | cell division cycle 20B |
| SLC44A5 | -1.82893 | 1.48E-05 | 0.003137 | -4.71193 | Down | solute carrier family 44 member 5 |
| MEN1 | -1.8227 | 0.001593 | 0.030071 | -3.30582 | Down | menin 1 |
| SCNN1D | -1.82156 | 0.003912 | 0.048656 | -3.00003 | Down | sodium channel epithelial 1 delta subunit |
| PFAS | -1.81549 | 0.002896 | 0.041776 | -3.10436 | Down | phosphoribosylformylglycinamidine synthase |
| EVA1C | -1.81455 | 0.001419 | 0.028438 | -3.34407 | Down | eva-1 homolog C |
| TIAM2 | -1.80764 | 6.94E-05 | 0.005946 | -4.27171 | Down | TIAM Rac1 associated GEF 2 |
| HLA-F-AS1 | -1.80482 | 0.002916 | 0.041853 | -3.10204 | Down | HLA-F antisense RNA 1 |
| TRAPPC9 | -1.80093 | 0.00091 | 0.022881 | -3.48851 | Down | trafficking protein particle complex 9 |
| APCDD1L | -1.80071 | 1.64E-05 | 0.003137 | -4.68254 | Down | APC down-regulated 1 like |
| CYTIP | -1.79864 | 0.001215 | 0.026482 | -3.39492 | Down | cytohesin 1 interacting protein |
| NUTM1 | -1.79716 | 2.14E-05 | 0.00341 | -4.60821 | Down | NUT midline carcinoma family member 1 |
| ARHGAP39 | -1.79263 | 0.000319 | 0.013245 | -3.81744 | Down | Rho GTPase activating protein 39 |
| SPTB | -1.79073 | 0.001482 | 0.028982 | -3.32988 | Down | spectrin beta, erythrocytic |
| ZNF469 | -1.78919 | 7.59E-05 | 0.006143 | -4.24571 | Down | zinc finger protein 469 |
| AZIN1-AS1 | -1.78541 | 1.92E-05 | 0.003347 | -4.63776 | Down | AZIN1 antisense RNA 1 |
| BCL2L11 | -1.78395 | 0.001862 | 0.032689 | -3.25392 | Down | BCL2 like 11 |
| CLDN1 | -1.78076 | 0.000331 | 0.013573 | -3.80619 | Down | claudin 1 |
| ZNF836 | -1.77956 | 6.7E-06 | 0.00223 | -4.92984 | Down | zinc finger protein 836 |
| APBA1 | -1.77749 | 0.002859 | 0.041537 | -3.10878 | Down | amyloid beta precursor protein binding family A member 1 |
| C8orf37 | -1.77616 | 0.000155 | 0.009321 | -4.03521 | Down | chromosome 8 open reading frame 37 |
| LOC391322 | -1.77531 | 9.16E-06 | 0.00249 | -4.84394 | Down | D-dopachrometautomerase-like |
| SPATA2L | -1.77449 | 0.002137 | 0.035219 | -3.2077 | Down | spermatogenesis associated 2 like |
| GLIS1 | -1.7719 | 2.07E-05 | 0.00341 | -4.61666 | Down | GLIS family zinc finger 1 |
| LOC389765 | -1.76734 | 7.38E-07 | 0.001025 | -5.5224 | Down | kinesin family member 27 pseudogene |
| DENND2C | -1.76558 | 1.69E-05 | 0.003137 | -4.67437 | Down | DENN domain containing 2C |
| MFAP3L | -1.76481 | 0.003083 | 0.042962 | -3.08279 | Down | microfibril associated protein 3 like |
| TREML1 | -1.76402 | 5.96E-05 | 0.005493 | -4.31615 | Down | triggering receptor expressed on myeloid cells like 1 |
| DNHD1 | -1.76398 | 0.001285 | 0.027046 | -3.37662 | Down | dynein heavy chain domain 1 |
| SETD6 | -1.75933 | 5.78E-05 | 0.005462 | -4.32489 | Down | SET domain containing 6, protein lysine methyltransferase |
| TTC34 | -1.75712 | 4.74E-05 | 0.005 | -4.38193 | Down | tetratricopeptide repeat domain 34 |
| SARDH | -1.74727 | 0.000444 | 0.015767 | -3.71564 | Down | sarcosine dehydrogenase |
| ZNF385C | -1.74659 | 5.06E-06 | 0.002061 | -5.00645 | Down | zinc finger protein 385C |
| NEXN-AS1 | -1.74174 | 0.001791 | 0.03205 | -3.26688 | Down | NEXN antisense RNA 1 |
| CDHR3 | -1.741 | 5.08E-05 | 0.00511 | -4.36224 | Down | cadherin related family member 3 |
| SPRYD4 | -1.7362 | 0.00381 | 0.048018 | -3.00934 | Down | SPRY domain containing 4 |
| ZSCAN25 | -1.73514 | 0.000224 | 0.011092 | -3.92529 | Down | zinc finger and SCAN domain containing 25 |
| FAM157C | -1.73405 | 3.95E-05 | 0.004552 | -4.43393 | Down | family with sequence similarity 157 member C |
| ARSG | -1.73192 | 0.000264 | 0.012045 | -3.8757 | Down | arylsulfatase G |
| GLI2 | -1.72398 | 8.75E-06 | 0.002428 | -4.85662 | Down | GLI family zinc finger 2 |
| NSUN7 | -1.72112 | 0.000383 | 0.014539 | -3.76087 | Down | NOP2/Sun RNA methyltransferase family member 7 |
| BMP3 | -1.71974 | 0.00051 | 0.016932 | -3.67185 | Down | bone morphogenetic protein 3 |
| PPT2 | -1.71813 | 1.01E-05 | 0.002625 | -4.81647 | Down | palmitoyl-protein thioesterase 2 |
| CCNJL | -1.7168 | 0.00297 | 0.042241 | -3.0957 | Down | cyclin J like |
| C3orf70 | -1.71506 | 1.17E-05 | 0.002752 | -4.77652 | Down | chromosome 3 open reading frame 70 |
| FBF1 | -1.71426 | 0.002996 | 0.042479 | -3.09265 | Down | Fas binding factor 1 |
| SEC14L2 | -1.70866 | 7.5E-05 | 0.006105 | -4.24929 | Down | SEC14 like lipid binding 2 |
| YPEL4 | -1.70708 | 0.000495 | 0.016631 | -3.68141 | Down | yippee like 4 |
| PCDH11Y | -1.70054 | 0.00111 | 0.025344 | -3.42438 | Down | protocadherin 11 Y-linked |
| AFAP1L2 | -1.68648 | 4.19E-05 | 0.004645 | -4.41718 | Down | actin filament associated protein 1 like 2 |
| ZNF674-AS1 | -1.6796 | 0.001198 | 0.026347 | -3.39966 | Down | ZNF674 antisense RNA 1 (head to head) |
| KCNQ4 | -1.67351 | 1.12E-05 | 0.002709 | -4.78912 | Down | potassium voltage-gated channel subfamily Q member 4 |
| SULT1B1 | -1.67126 | 9.73E-05 | 0.00709 | -4.17312 | Down | sulfotransferase family 1B member 1 |
| MORN1 | -1.66843 | 0.000538 | 0.01724 | -3.6552 | Down | MORN repeat containing 1 |
| PCDH17 | -1.66757 | 7.41E-05 | 0.006068 | -4.25287 | Down | protocadherin 17 |
| FOXP2 | -1.66727 | 0.000941 | 0.023272 | -3.47788 | Down | forkhead box P2 |
| XYLB | -1.66722 | 0.001703 | 0.031013 | -3.28371 | Down | xylulokinase |
| CTNNA3 | -1.66694 | 0.000163 | 0.009544 | -4.02144 | Down | catenin alpha 3 |
| NLRP6 | -1.66633 | 0.000524 | 0.017152 | -3.66377 | Down | NLR family pyrin domain containing 6 |
| SLC16A13 | -1.66401 | 0.000624 | 0.018805 | -3.60875 | Down | solute carrier family 16 member 13 |
| GLI3 | -1.6638 | 0.003245 | 0.044179 | -3.06511 | Down | GLI family zinc finger 3 |
| SYNJ2 | -1.66358 | 0.000209 | 0.010651 | -3.94618 | Down | synaptojanin 2 |
| C2orf15 | -1.6617 | 0.000283 | 0.012404 | -3.85419 | Down | chromosome 2 open reading frame 15 |
| SCIMP | -1.65716 | 0.002226 | 0.036099 | -3.19403 | Down | SLP adaptor and CSK interacting membrane protein |
| KIR2DL4 | -1.6566 | 0.000227 | 0.01115 | -3.92146 | Down | killer cell immunoglobulin like receptor, two Ig domains and long cytoplasmic tail 4 |
| FHL3 | -1.65441 | 0.00305 | 0.042759 | -3.08659 | Down | four and a half LIM domains 3 |
| OVGP1 | -1.65215 | 1.12E-06 | 0.001179 | -5.41243 | Down | oviductal glycoprotein 1 |
| N4BP3 | -1.65201 | 0.000581 | 0.017987 | -3.63113 | Down | NEDD4 binding protein 3 |
| ELOVL7 | -1.64755 | 3.88E-05 | 0.00453 | -4.43907 | Down | ELOVL fatty acid elongase 7 |
| ESRG | -1.64744 | 0.001428 | 0.028535 | -3.34192 | Down | embryonic stem cell related |
| ACTA2-AS1 | -1.64552 | 0.000128 | 0.008394 | -4.09176 | Down | ACTA2 antisense RNA 1 |
| CNKSR3 | -1.64218 | 7.19E-05 | 0.005962 | -4.26146 | Down | CNKSR family member 3 |
| ZNF347 | -1.63729 | 0.002754 | 0.040644 | -3.12164 | Down | zinc finger protein 347 |
| SGMS1-AS1 | -1.6362 | 3.3E-06 | 0.001776 | -5.12249 | Down | SGMS1 antisense RNA 1 |
| ZKSCAN2 | -1.63535 | 4.67E-05 | 0.005 | -4.38616 | Down | zinc finger with KRAB and SCAN domains 2 |
| AMIGO1 | -1.63486 | 0.000936 | 0.023198 | -3.47947 | Down | adhesion molecule with Ig like domain 1 |
| ZC3H10 | -1.63262 | 0.001463 | 0.028876 | -3.33409 | Down | zinc finger CCCH-type containing 10 |
| MUC17 | -1.62593 | 0.000109 | 0.007553 | -4.14108 | Down | mucin 17, cell surface associated |
| ZNF559-ZNF177 | -1.62399 | 6.21E-05 | 0.005556 | -4.30427 | Down | ZNF559-ZNF177 readthrough |
| NUTM2D | -1.62355 | 0.000228 | 0.011159 | -3.92008 | Down | NUT family member 2D |
| ABCB4 | -1.62247 | 3.99E-06 | 0.001884 | -5.07099 | Down | ATP binding cassette subfamily B member 4 |
| LOC100652768 | -1.61749 | 0.000307 | 0.012935 | -3.82956 | Down | uncharacterized LOC100652768 |
| C8orf58 | -1.61509 | 5.62E-06 | 0.002118 | -4.97786 | Down | chromosome 8 open reading frame 58 |
| WRAP73 | -1.61325 | 4.07E-06 | 0.001884 | -5.06554 | Down | WD repeat containing, antisense to TP73 |
| SLC24A4 | -1.61174 | 2.06E-05 | 0.00341 | -4.61911 | Down | solute carrier family 24 member 4 |
| LENG8-AS1 | -1.61071 | 2.39E-05 | 0.003497 | -4.57709 | Down | LENG8 antisense RNA 1 |
| C2orf66 | -1.60563 | 1.03E-05 | 0.002643 | -4.81096 | Down | chromosome 2 open reading frame 66 |
| SMIM10L2A | -1.60523 | 9.09E-05 | 0.006806 | -4.19335 | Down | small integral membrane protein 10 like 2A |
| CYP1B1-AS1 | -1.60433 | 0.000107 | 0.007513 | -4.14419 | Down | CYP1B1 antisense RNA 1 |
| CTNND1 | -1.60088 | 0.000109 | 0.007568 | -4.13895 | Down | catenin delta 1 |
| ADCY10P1 | -1.60028 | 4.19E-05 | 0.004645 | -4.4176 | Down | ADCY10 pseudogene 1 |
| LOC100130298 | -1.59936 | 3.39E-05 | 0.004196 | -4.47779 | Down | hCG1816373-like |
| FLJ42627 | -1.59816 | 0.001285 | 0.027046 | -3.37677 | Down | uncharacterized LOC645644 |
| CRISPLD1 | -1.59815 | 0.000698 | 0.019931 | -3.57312 | Down | cysteine rich secretory protein LCCL domain containing 1 |
| MESTIT1 | -1.59755 | 1.51E-06 | 0.001401 | -5.33225 | Down | MEST intronic transcript 1, antisense RNA |
| ASPG | -1.59743 | 0.001369 | 0.027894 | -3.35594 | Down | asparaginase |
| PRICKLE2-AS1 | -1.59631 | 0.000336 | 0.013596 | -3.80182 | Down | PRICKLE2 antisense RNA 1 |
| LINC00865 | -1.59557 | 2.66E-05 | 0.00371 | -4.54615 | Down | long intergenic non-protein coding RNA 865 |
| LINC01001 | -1.59556 | 1.77E-06 | 0.001545 | -5.29009 | Down | long intergenic non-protein coding RNA 1001 |
| GRK4 | -1.59417 | 1.69E-05 | 0.003137 | -4.67411 | Down | G protein-coupled receptor kinase 4 |
| ZNF300 | -1.59305 | 5.6E-05 | 0.005391 | -4.33388 | Down | zinc finger protein 300 |
| CADM3-AS1 | -1.59265 | 7.19E-05 | 0.005962 | -4.26163 | Down | CADM3 antisense RNA 1 |
| SIT1 | -1.59069 | 0.000397 | 0.014772 | -3.75003 | Down | signaling threshold regulating transmembrane adaptor 1 |
| LINC01138 | -1.59045 | 0.001479 | 0.028971 | -3.33042 | Down | long intergenic non-protein coding RNA 1138 |
| DNAH5 | -1.5878 | 0.000268 | 0.012109 | -3.87093 | Down | dynein axonemal heavy chain 5 |
| FAM155B | -1.58584 | 2.87E-05 | 0.003871 | -4.52525 | Down | family with sequence similarity 155 member B |
| SLC5A4 | -1.58234 | 3.27E-06 | 0.001776 | -5.12479 | Down | solute carrier family 5 member 4 |
| ZNF573 | -1.58059 | 6.33E-06 | 0.002168 | -4.94541 | Down | zinc finger protein 573 |
| RCAN3 | -1.5793 | 2.89E-05 | 0.003871 | -4.52291 | Down | RCAN family member 3 |
| DNAH3 | -1.57822 | 0.000296 | 0.012696 | -3.83989 | Down | dynein axonemal heavy chain 3 |
| UBXN10 | -1.57771 | 1.9E-05 | 0.003343 | -4.64092 | Down | UBX domain protein 10 |
| CLEC4A | -1.57555 | 0.003924 | 0.048741 | -2.99895 | Down | C-type lectin domain family 4 member A |
| RFFL | -1.57423 | 0.000171 | 0.009664 | -4.00626 | Down | ring finger and FYVE like domain containing E3 ubiquitin protein ligase |
| TMEM130 | -1.57294 | 0.000437 | 0.015643 | -3.72015 | Down | transmembrane protein 130 |
| KCNMB4 | -1.57256 | 0.003907 | 0.048656 | -3.0005 | Down | potassium calcium-activated channel subfamily M regulatory beta subunit 4 |
| LINC00924 | -1.57057 | 0.000165 | 0.009593 | -4.01761 | Down | long intergenic non-protein coding RNA 924 |
| EREG | -1.57034 | 0.000125 | 0.008283 | -4.09939 | Down | epiregulin |
| URAD | -1.56639 | 0.000704 | 0.020012 | -3.5708 | Down | ureidoimidazoline (2-oxo-4-hydroxy-4-carboxy-5-) decarboxylase |
| SLC22A15 | -1.56367 | 0.000564 | 0.017736 | -3.64079 | Down | solute carrier family 22 member 15 |
| ADRA2B | -1.56339 | 0.000592 | 0.018192 | -3.62512 | Down | adrenoceptor alpha 2B |
| CDH26 | -1.56317 | 0.00033 | 0.013567 | -3.80719 | Down | cadherin 26 |
| ZNF596 | -1.5628 | 0.000227 | 0.01115 | -3.92153 | Down | zinc finger protein 596 |
| NYAP1 | -1.55572 | 3.9E-05 | 0.004533 | -4.43763 | Down | neuronal tyrosine phosphorylated phosphoinositide-3-kinase adaptor 1 |
| SFRP5 | -1.55537 | 0.000468 | 0.016151 | -3.699 | Down | secreted frizzled related protein 5 |
| LOC101929574 | -1.55461 | 0.001368 | 0.027894 | -3.35602 | Down | uncharacterized LOC101929574 |
| RNF207 | -1.54999 | 7.31E-06 | 0.002243 | -4.90599 | Down | ring finger protein 207 |
| NRL | -1.54936 | 2.58E-05 | 0.003634 | -4.55549 | Down | neural retina leucine zipper |
| ANGPTL6 | -1.54763 | 0.00025 | 0.011782 | -3.89133 | Down | angiopoietin like 6 |
| ALOX15 | -1.54749 | 0.000145 | 0.009003 | -4.0563 | Down | arachidonate 15-lipoxygenase |
| CHEK2 | -1.54682 | 0.001992 | 0.03385 | -3.23132 | Down | checkpoint kinase 2 |
| ZNF543 | -1.54508 | 0.00303 | 0.042657 | -3.08876 | Down | zinc finger protein 543 |
| ZNF717 | -1.54439 | 0.000156 | 0.009363 | -4.03319 | Down | zinc finger protein 717 |
| FASLG | -1.54428 | 0.001265 | 0.026877 | -3.38181 | Down | Fas ligand |
| LILRA3 | -1.5435 | 1.84E-05 | 0.003308 | -4.65038 | Down | leukocyte immunoglobulin like receptor A3 |
| NEK10 | -1.54346 | 0.00012 | 0.008053 | -4.11146 | Down | NIMA related kinase 10 |
| MIR1914 | -1.543 | 0.000489 | 0.016519 | -3.68532 | Down | microRNA 1914 |
| BATF3 | -1.54097 | 0.000518 | 0.017057 | -3.667 | Down | basic leucine zipper ATF-like transcription factor 3 |
| AVIL | -1.54065 | 0.000332 | 0.013573 | -3.80487 | Down | advillin |
| KLK10 | -1.54034 | 7.07E-05 | 0.005956 | -4.26664 | Down | kallikrein related peptidase 10 |
| ZNF689 | -1.53954 | 0.003253 | 0.04422 | -3.06429 | Down | zinc finger protein 689 |
| MKLN1-AS | -1.53911 | 0.00209 | 0.0347 | -3.2153 | Down | MKLN1 antisense RNA |
| LOC100128398 | -1.53652 | 0.002092 | 0.034722 | -3.21487 | Down | uncharacterized LOC100128398 |
| LRP1-AS | -1.53646 | 4.89E-05 | 0.005015 | -4.37323 | Down | LRP1 antisense RNA |
| NPIPA1 | -1.5363 | 0.003113 | 0.043191 | -3.07949 | Down | nuclear pore complex interacting protein family member A1 |
| NLRP2 | -1.53625 | 0.00031 | 0.012977 | -3.82661 | Down | NLR family pyrin domain containing 2 |
| MMEL1 | -1.5346 | 0.000336 | 0.013596 | -3.80163 | Down | membrane metalloendopeptidase like 1 |
| SPDYE5 | -1.53457 | 0.000116 | 0.007921 | -4.12051 | Down | speedy/RINGO cell cycle regulator family member E5 |
| CCL28 | -1.5342 | 5.69E-05 | 0.005435 | -4.32942 | Down | C-C motif chemokine ligand 28 |
| KLHDC1 | -1.53297 | 0.000501 | 0.016732 | -3.67754 | Down | kelch domain containing 1 |
| FRMPD1 | -1.53279 | 4.28E-05 | 0.004701 | -4.41134 | Down | FERM and PDZ domain containing 1 |
| LINC00211 | -1.53271 | 0.00019 | 0.010241 | -3.97414 | Down | long intergenic non-protein coding RNA 211 |
| ATP6V1G2 | -1.53264 | 0.000799 | 0.021227 | -3.53045 | Down | ATPase H+ transporting V1 subunit G2 |
| PRIMA1 | -1.53113 | 0.000786 | 0.021056 | -3.53546 | Down | proline rich membrane anchor 1 |
| NPTX1 | -1.52859 | 0.000253 | 0.011808 | -3.88811 | Down | neuronal pentraxin 1 |
| LOC101928107 | -1.5272 | 0.0003 | 0.012783 | -3.83612 | Down | uncharacterized LOC101928107 |
| GFRA3 | -1.5245 | 8.59E-06 | 0.002428 | -4.86161 | Down | GDNF family receptor alpha 3 |
| LOC101929595 | -1.51972 | 1.12E-05 | 0.002709 | -4.78841 | Down | uncharacterized LOC101929595 |
| FLJ37453 | -1.51859 | 7.55E-06 | 0.002243 | -4.8971 | Down | uncharacterized LOC729614 |
| MACC1 | -1.51799 | 0.000573 | 0.017831 | -3.6354 | Down | MET transcriptional regulator MACC1 |
| LINC00607 | -1.51637 | 2.68E-05 | 0.00371 | -4.5447 | Down | long intergenic non-protein coding RNA 607 |
| FAM86B1 | -1.5153 | 0.000332 | 0.013573 | -3.80528 | Down | family with sequence similarity 86 member B1 |
| MIR4477B | -1.51191 | 2.05E-05 | 0.00341 | -4.62019 | Down | microRNA 4477b |
| CNNM2 | -1.50798 | 0.001668 | 0.03072 | -3.29062 | Down | cyclin and CBS domain divalent metal cation transport mediator 2 |
| SKA1 | -1.50659 | 0.00086 | 0.02226 | -3.50665 | Down | spindle and kinetochore associated complex subunit 1 |
| ABRACL | -1.50603 | 0.001136 | 0.025784 | -3.41701 | Down | ABRA C-terminal like |
| LINC00954 | -1.50484 | 0.000652 | 0.019135 | -3.59472 | Down | long intergenic non-protein coding RNA 954 |
| ZBP1 | -1.50412 | 0.002141 | 0.035221 | -3.20719 | Down | Z-DNA binding protein 1 |
| ZNF528 | -1.50042 | 0.000464 | 0.016097 | -3.70168 | Down | zinc finger protein 528 |
| ACTG1P4 | -1.50023 | 0.000252 | 0.011803 | -3.88932 | Down | actin gamma 1 pseudogene 4 |
| MYO10 | -1.50014 | 0.003103 | 0.043113 | -3.08058 | Down | myosin X |
Fig. 2.

Heat map of differentially expressed genes. Legend on the top left indicate log fold change of genes. (A1 – A2 = normal control samples; B1 – B30 = PCOS samples)
GO and pathway enrichment of DEGs in PCOS
The top 739 DEGs were chosen to perform GO and REACTOME pathway enrichment analyses. Gene Ontology (GO) analysis identified that the DEGs were significantly enriched in BP, including the peptide metabolic process, intracellular protein transport, plasma membrane bounded cell projection organization and cell morphogenesis (Table 3). In terms of CC, DEGs were mainly enriched in organelle envelope, catalytic complex, neuron projection and cell junction were the most significantly enriched GO term (Table 3). In addition, MF demonstrated that the DEGs were enriched in the RNA binding, transcription factor binding, DNA-binding transcription factor activity, RNA polymerase II-specific and ATP binding (Table 3). REACTOME pathway enrichment analysis was used to screen the signaling pathways for differential genes. These DEGs were mainly involved in the translation, respiratory electron transport, generic transcription pathway and transmembrane transport of small molecules (Table 4).
Table 3.
The enriched GO terms of the up and down regulated differentially expressed genes
| GO ID | CATEGORY | GO Name | P Value | FDR B&H | FDR B&Y | Bonferroni | Gene Count | Gene |
|---|---|---|---|---|---|---|---|---|
| Up regulated genes | ||||||||
| GO:0006518 | BP | peptide metabolic process | 1.51E-13 | 2.66E-11 | 2.37E-10 | 6.37E-10 | 52 | RPL24,RPL27,RPL30,RPL29,RPL34,RPL35A,RPL36A,RPLP0,MRPL12,MRPS12,RPS5,RPS8,ETF1,RPS10,EIF3E,RPS15,RPS15A,SRP72,RPS20,RPS21,RPS23,RPS24,RPS29,EIF6,EIF3L,MRPS21,MRPL24,MRPL20,COA3,RBM3,TRMT112,MRPL54,CPE,RPL14,RPS27L,EIF2D,DPH5,EIF1AX,ATP6AP2,ZNF706,SEC11A,MRPS24,UHMK1,EIF5,MRPS15,MRPS6,MRPS34,LSM14A,RPL35,RPL13A,MRPL9,RSL24D1 |
| GO:0006886 | BP | intracellular protein transport | 6.75E-12 | 8.16E-10 | 7.28E-09 | 2.86E-08 | 66 | GIPC1,SNAPIN,RPL24,TCTN3,RPL27,RPL30,RPL29,RPL34,ROMO1,RPL35A,RPL36A,RPLP0,RPS5,RPS8,RPS10,RPS15,RPS15A,PHB2,SRP72,RPS20,HMGCL,RPS21,RPS23,RPS24,RPS29,ARFIP2,TOMM5,EIF6,RAB10,ATP6V1D,SNX8,PEX19,AGFG1,PEX2,ZFAND6,RABGEF1,SNX9,RAB4A,PMM1,TOMM7,SRSF6,ANP32B,RPAIN,TNPO2,DERL2,FIS1,RPL14,APOD,ECH1,IFI27,YWHAH,TMED4,ARF5,NDUFA13,EXOC5,EIF2D,UBL5,TIMM8B,ICMT,UHMK1,DYNLL2,VPS28,RPL35,SYVN1,RPL13A,STX10 |
| GO:0031967 | CC | organelle envelope | 2.36E-19 | 1.71E-17 | 1.20E-16 | 1.47E-16 | 72 | ROMO1,PRELID1,MRPL12,MRPS12,PET100,BAK1,PHB2,LRRC59,HMGCL,GCHFR,COA4,NDUFA2,SLC25A26,BLOC1S1,ECSIT,SUCLG1,NDUFB2,TOMM5,NDUFC2,BANF1,MOAP1,NDUFS4,NDUFS5,PHB,BNIP3,PI4KB,FDX1,MRPS21,AGFG1,SLC25A11,TMEM97,UQCRC1,UQCRFS1,UQCRH,UQCR11,NME2,MRPL24,CERS2,MRPL20,TOMM7,COA3,COX4I1,COX5B,DTYMK,ANXA4,COX6A1,NDUFAF3,COX6B1,MRPL54,COX6C,COX7A2,COX7C,COX8A,FIS1,IFI27,MAD2L1BP,CCND2,NDUFA13,CYB5B,TMEM256,TIMM8B,AIFM1,MRPS24,MRPS15,CHCHD2,MRPS6,MRPS34,COX7A2L,UQCRQ,HSD17B10,MTDH,MRPL9 |
| GO:1902494 | CC | catalytic complex | 1.31E-12 | 5.84E-11 | 4.09E-10 | 8.17E-10 | 67 | PRPF31,DCAF6,ERH,SAP18,OST4,PSMB1,PSMB4,ETFB,PSMB7,PSMC5,PSMD3,PSMD10,NDUFA2,EZH1,SUCLG1,NDUFB2,NDUFC2,NDUFS4,NDUFS5,LSM3,CKS1B,TSPAN17,SLC9A3R1,UBE2E1,RBMX,MORF4L1,PEX2,AK1,PRMT1,UQCRC1,UQCRFS1,UQCRH,TAF7,ANAPC5,TADA3,ANAPC13,RBX1,CUL4A,POLR3GL,RBBP7,PIGS,POLR2J,POLR2K,DERL2,BCCIP,POLE4,NAA38,CCNC,CCND2,RMRP,NDUFA13,POLR1D,GTF2A2,ORMDL1,SEC11A,SF3B6,DYNLL2,SMARCD2,UQCRQ,HSD17B10,KLHL12,SYVN1,CDC27,PSMD14,SNRPD2,RPPH1,KRTCAP2 |
| GO:0003723 | MF | RNA binding | 1.66E-10 | 4.49E-08 | 3.30E-07 | 1.45E-07 | 76 | RPL24,PRPF31,RPL27,RPL30,RPL29,RPL34,RPL35A,RPL36A,ERH,RPLP0,MRPL12,MRPS12,SAP18,RSL1D1,RPS5,RPS8,ETF1,RPS10,EIF3E,RPS15,RPS15A,SRP72,RPS20,LRRC59,RPS21,RPS23,RPS24,SUCLG1,EIF6,LSM3,RBMX,EIF3L,MRPS21,NQO1,AGFG1,LSM4,PRMT1,SLC25A11,TBCA,MRPL20,NUDT16,SRSF6,S100A16,GLRX3,RBBP7,RBM3,MRPL54,NELFB,BCCIP,RDX,RPL14,C7orf50,XRCC5,SERPINH1,RPS27L,EIF2D,GTF3A,FAM32A,EIF1AX,SBDS,SF3B6,MRPS24,UHMK1,EIF5,MRPS15,SLTM,MRPS6,LSM14A,HSD17B10,RPL35,RPL13A,SNRPD2,MTDH,MRPL9,SF3B5,RSL24D1 |
| GO:0008134 | MF | transcription factor binding | 1.05E-02 | 1.83E-01 | 1.00E+00 | 1.00E+00 | 23 | NAB1,PHB2,PSMC5,FAM89B,NBN,PSMD10,MDFI,TAF7,SETD3,TADA3,RBX1,WIPI1,ANXA4,TEAD3,IFI27,YWHAH,GTF2A2,MED4,ICMT,CHCHD2,HSD17B10,MTDH,TRIB1 |
| Down regulated genes | ||||||||
| GO:0120036 | BP | plasma membrane bounded cell projection organization | 7.28E-05 | 2.19E-02 | 1.94E-01 | 2.91E-01 | 49 | EPHB4,STK36,MAK,SPAST,ZFYVE27,TTLL3,MYO7A,MYO10,SDCCAG8,SPTB,SARM1,RAP1GAP2,NPHP4,GFRA3,AMIGO1,HECW2,GLI2,GLI3,SYNE2,WRAP73,NGFR,NTN1,NLGN2,FGFR3,PLD1,CEP126,NYAP1,DNAH5,UBXN10,PLXNB3,SEMA6B,FAT4,NPTX1,NEDD4L,STXBP5,FBF1,LAMA5,RFFL,ODF2,FAS,RFX3,ATL1,TRAK1,WDR19,FEZ1,AVIL,CEP135,IFT122,EPHA4 |
| GO:0000902 | BP | cell morphogenesis | 3.10E-03 | 1.93E-01 | 1.00E+00 | 1.00E+00 | 31 | EPHB4,CDH26,SPAST,ZFYVE27,MYO7A,MYO10,CDHR3,SPTB,SARM1,GFRA3,AMIGO1,HECW2,GLI2,GLI3,NGFR,NTN1,FGFR3,NYAP1,PLXNB3,SEMA6B,NPTX1,NEDD4L,STXBP5,LAMA5,CDH19,ATL1,TRAK1,WDR19,FEZ1,C8orf37,EPHA4 |
| GO:0043005 | CC | neuron projection | 3.65E-05 | 7.26E-03 | 5.00E-02 | 2.00E-02 | 46 | EPHB4,MAK,PDE4B,SNPH,SPAST,ZFYVE27,MYO7A,MYO10,ESR1,SDCCAG8,SARM1,RAP1GAP2,N4BP3,NPHP4,SNAP47,TIAM2,AMIGO1,KCNC1,PTPRN2,SYNJ2,NGFR,NLGN2,BSN,NPTX1,CALCR,PLXDC1,STXBP5,ERO1A,GRK4,AAK1,APBA1,KLC2,VTI1A,FAS,ATL1,TRAK1,WDR19,SHISA9,FEZ1,KCNQ4,AVIL,UNC13C,IFT122,CTNND1,EPHA4,GABRA4 |
| GO:0030054 | CC | cell junction | 3.04E-03 | 8.34E-02 | 5.74E-01 | 1.00E+00 | 34 | CDH26,SNPH,CDHR3,SDCCAG8,SARM1,OBSCN,NPHP4,ABCB4,ARHGAP22,RASIP1,PTPRN2,SYNE2,LPXN,NGFR,NLGN2,FGFR3,BSN,FHL3,CDC42BPA,PLXDC1,STXBP5,FBF1,LCK,CDH19,CLDN1,PRIMA1,SHISA9,LMO7,CTNNA3,UNC13C,C8orf37,CTNND1,EPHA4,GABRA4 |
| GO:0000981 | MF | DNA-binding transcription factor activity, RNA polymerase II-specific | 9.75E-04 | 3.67E-01 | 1.00E+00 | 7.35E-01 | 43 | ZNF717,ZXDC,HIVEP1,ERG,ZNF154,ESR1,ZSCAN25,ARNTL2,ZNF836,ZNF469,ZNF547,GLI2,GLI3,ZNF347,ZNF778,BATF3,TET3,ZNF687,ZNF114,MACC1,ZNF555,ZNF493,FOXP2,NRL,ZNF596,ZNF689,ZNF300,ZKSCAN2,RFX3,ZNF496,IKZF4,RLF,KAT7,DMRT2,ZNF334,MTF1,ZKSCAN3,ZNF559-ZNF177,ZNF69,ZNF528,ZNF543,GLIS1,ZNF124 |
| GO:0005524 | MF | ATP binding | 2.83E-02 | 4.14E-01 | 1.00E+00 | 1.00E+00 | 34 | EPHB4,PRPS2,STK36,MAK,CNNM2,SPAST,TTLL3,MYO7A,MYO10,NEK10,OBSCN,PFAS,TOR4A,ABCB4,FGFR3,XYLB,DNAH5,DNHD1,ATP13A4,DNAH3,CDC42BPA,ATP13A1,GRK4,MAP 3K14,AAK1,ABCC5,LCK,NLRP2,NLRP6,TRIB3,CHEK2,ERCC6L2,MAST3,EPHA4 |
BP Biological Process, CC Cellular Component and MF Molecular Functions
Table 4.
The enriched pathway terms of the up and down regulated differentially expressed genes
| Pathway ID | Pathway Name | P-value | FDR B&H | FDR B&Y | Bonferroni | Gene Count | Geness |
|---|---|---|---|---|---|---|---|
| Up regulated genes | |||||||
| 1268678 | Translation | 8.83E-20 | 4.54E-17 | 3.26E-16 | 6.54E-17 | 30 | RPL24,RPL27,RPL30,RPL29,RPL34,RPL35A,RPL36A,RPLP0,RPS5,RPS8,ETF1,RPS10,EIF3E,RPS15,RPS15A,SRP72,RPS20,RPS21,RPS23,RPS24,RPS29,EIF3L,TRMT112,RPL14,RPS27L,EIF1AX,SEC11A,EIF5,RPL35,RPL13A |
| 1270128 | Respiratory electron transport | 2.39E-16 | 1.27E-14 | 9.10E-14 | 1.77E-13 | 22 | ETFB,NDUFA2,ECSIT,NDUFB2,NDUFC2,NDUFS4,NDUFS5,UQCRC1,UQCRFS1,UQCRH,UQCR11,COX4I1,COX5B,COX6A1,NDUFAF3,COX6B1,COX6C,COX7C,COX8A,NDUFA13,COX7A2L,UQCRQ |
| 1268677 | Metabolism of proteins | 6.29E-10 | 1.46E-08 | 1.05E-07 | 4.66E-07 | 72 | B4GALT2,RPL24,RPL27,RPL30,RPL29,UAP1,RPL34,RPL35A,RPL36A,RPLP0,RPS5,PSMB1,RPS8,ETF1,RPS10,PSMB4,ETFB,EIF3E,PSMB7,RPS15,RPS15A,PSMC5,SRP72,PSMD3,RPS20,PFDN1,RPS21,RPS23,PFDN5,PSMD10,RPS24,COA4,RPS29,TOMM5,GFPT1,NEDD8,RAB10,SAA1,UBE2E1,UCHL1,EIF3L,TADA3,RAB4A,TBCA,PMM1,TOMM7,WIPI1,TRMT112,TNIP2,PIGS,AMDHD2,USP24,DERL2,CPE,RPL14,RPS27L,ARF5,EXOC5,TIMM8B,DPH5,ICMT,EIF1AX,ATP6AP2,SEC11A,DYNLL2,EIF5,CHCHD2,SUMO3,RPL35,SYVN1,RPL13A,PSMD14 |
| 1269649 | Gene Expression | 1.72E-09 | 3.85E-08 | 2.77E-07 | 1.27E-06 | 77 | CDKN2B,RPL24,PRPF31,RPL27,RPL30,RPL29,RPL34,RPL35A,RPL36A,PRELID1,TMEM219,RPLP0,SAP18,RPS5,PSMB1,RPS8,ETF1,RPS10,PSMB4,EIF3E,PSMB7,RPS15,RPS15A,PSMC5,NBN,SRP72,PSMD3,RPS20,RPS21,RPS23,PSMD10,RPS24,RPS29,LSM3,RBMX,EIF3L,NABP2,LSM4,PRMT1,TAF7,SRSF6,POLR3GL,RBBP7,COX4I1,TRMT112,COX5B,COX6A1,COX6B1,POLR2J,POLR2K,NELFB,COX6C,COX7C,COX8A,RPL14,TEAD3,SKIL,YWHAH,RPS27L,CCNC,POLR1D,GTF2A2,MED4,GTF3A,LAMTOR4,EIF1AX,ZNF706,SEC11A,SF3B6,EIF5,COX7A2L,HSD17B10,RPL35,RPL13A,PSMD14,SNRPD2,SF3B5 |
| 1269852 | Autodegradation of Cdh1 by Cdh1:APC/C | 1.22E-06 | 2.58E-05 | 1.86E-04 | 9.04E-04 | 10 | PSMB1,PSMB4,PSMB7,PSMC5,PSMD3,PSMD10,UBE2E1,ANAPC5,CDC27,PSMD14 |
| 1268843 | Mitochondrial translation initiation | 2.55E-06 | 4.96E-05 | 3.57E-04 | 1.89E-03 | 11 | MRPL12,MRPS12,MRPS21,MRPL24,MRPL20,MRPL54,MRPS24,MRPS15,MRPS6,MRPS34,MRPL9 |
| Down regulated genes | |||||||
| 1269650 | Generic Transcription Pathway | 1.96E-04 | 1.10E-01 | 7.63E-01 | 1.10E-01 | 29 | ZNF717,ZNF486,ZNF154,ESR1,ZSCAN25,MEN1,ZNF547,BANP,ZNF347,ZNF778,TAF4B,ZNF114,ZNF573,ZNF555,ZNF493,NEDD4L,ZNF596,ZNF689,ZNF300,RFFL,FAS,ZNF496,ZNF334,ZKSCAN3,CHEK2,ZNF528,ZNF543,TOP3A,ZNF124 |
| 1269903 | Transmembrane transport of small molecules | 2.80E-02 | 7.66E-01 | 1.00E+00 | 1.00E+00 | 18 | ATP6V1G2,SLC22A15,SLCO4A1,ASIC3,ABCB4,SLC24A4,SLC44A5,SCNN1D,SLC9A7,ATP13A4,NEDD4L,ATP13A1,ABCC5,SLC1A7,SLC5A4,SLC30A7,NDC1,GABRA4 |
| 1268846 | Cilium Assembly | 3.71E-02 | 7.66E-01 | 1.00E+00 | 1.00E+00 | 7 | SDCCAG8,NPHP4,FBF1,ODF2,WDR19,CEP135,IFT122 |
| 1269957 | Metabolism of carbohydrates | 1.11E-01 | 7.66E-01 | 1.00E+00 | 1.00E+00 | 8 | PRPS2,CHST14,XYLB,MGAM,ABCC5,SLC5A4,NDC1,SLC25A13 |
| 1269443 | Signalling by NGF | 1.63E-01 | 7.66E-01 | 1.00E+00 | 1.00E+00 | 11 | EREG,SPTB,OBSCN,KBTBD7,GFRA3,TIAM2,NGFR,FGFR3,BCL2L11,LCK,TRIB3 |
| 1269171 | Adaptive Immune System | 1.86E-01 | 7.66E-01 | 1.00E+00 | 1.00E+00 | 17 | EREG,LRSAM1,HLA-H,RAP1GAP2,KBTBD7,SLAMF6,HECW2,FGFR3,KIR2DL4,TREML1,LILRA3,NEDD4L,MAP 3K14,KLC2,LCK,TRIB3,LMO7 |
PPI networks construction and module Analysis
Following the analysis based on the PPI networks, 4141 nodes and 14853 edges were identified in Cytoscape (Fig. 3a). The genes with higher scores were the hub genes, as the genes of node degree, betweenness centrality, stress centrality, closeness centrality may be linked with PCOS. The top 10 hub genes were SAA1, ADCY6, POLR2K, RPS15, RPS15A, ESR1, LCK, S1PR5, CCL28 and CTNND1 and are listed in Table 5. Enrichment analysis demonstrated that module 1 (Fig. 3b) and module 2 (Fig. 3c) might be associated with respiratory electron transport, organelle envelope, catalytic complex, gene expression, signaling by NGF and neuron projection.
Fig. 3.

PPI network and the most significant modules of DEGs. a The PPI network of DEGs was constructed using Cytoscape. b The most significant module was obtained from PPI network with 26 nodes and 160 edges for up regulated genes. c The most significant module was obtained from PPI network with 26 nodes and 71 edges for up regulated genes. Up regulated genes are marked in green; down regulated genes are marked in red
Table 5.
Topology table for up and down regulated genes
| Regulation | Node | Degree | Betweenness | Stress | Closeness |
|---|---|---|---|---|---|
| Up | SAA1 | 315 | 0.10107 | 69407430 | 0.321603 |
| Up | ADCY6 | 312 | 0.072777 | 44726506 | 0.302897 |
| Up | POLR2K | 236 | 0.037471 | 28379862 | 0.302013 |
| Up | RPS15 | 212 | 0.008152 | 26431684 | 0.308863 |
| Up | RPS15A | 211 | 0.007809 | 26602340 | 0.309741 |
| Up | RPS5 | 209 | 0.007859 | 26492428 | 0.309463 |
| Up | RPL13A | 207 | 0.007846 | 22124842 | 0.309533 |
| Up | RPS23 | 205 | 0.005989 | 23951504 | 0.308794 |
| Up | RPLP0 | 205 | 0.00818 | 22450450 | 0.310438 |
| Up | RPL35 | 203 | 0.006165 | 21837168 | 0.309417 |
| Up | RPS20 | 202 | 0.005559 | 24073032 | 0.308564 |
| Up | RPS29 | 198 | 0.004498 | 20672292 | 0.308426 |
| Up | RBX1 | 197 | 0.044386 | 26711280 | 0.318217 |
| Up | POLR2J | 192 | 0.020679 | 20252592 | 0.293659 |
| Up | RPL30 | 187 | 0.006891 | 19563996 | 0.308265 |
| Up | RPS8 | 177 | 0.004042 | 18164736 | 0.30678 |
| Up | RPL35A | 174 | 0.003759 | 16445648 | 0.30783 |
| Up | RPS24 | 174 | 0.003192 | 15939464 | 0.304838 |
| Up | RPL24 | 173 | 0.003533 | 16772430 | 0.306803 |
| Up | C3AR1 | 172 | 0.003177 | 5121210 | 0.274955 |
| Up | RPL34 | 172 | 0.004039 | 16061864 | 0.30719 |
| Up | RPL29 | 171 | 0.00494 | 18453558 | 0.307647 |
| Up | RPS21 | 170 | 0.002685 | 15196960 | 0.304636 |
| Up | SNRPD2 | 168 | 0.03814 | 33998368 | 0.309486 |
| Up | RPS10 | 164 | 0.002949 | 14807414 | 0.306055 |
| Up | RPL14 | 163 | 0.00328 | 15070824 | 0.306826 |
| Up | RPL27 | 160 | 0.002277 | 14404254 | 0.305716 |
| Up | PSMC5 | 145 | 0.016771 | 20051716 | 0.327066 |
| Up | PSMD14 | 138 | 0.008797 | 20693344 | 0.312311 |
| Up | RBBP7 | 136 | 0.039699 | 19307334 | 0.314733 |
| Up | PSMD3 | 132 | 0.006138 | 19507196 | 0.312264 |
| Up | SRSF6 | 130 | 0.01551 | 18603044 | 0.305242 |
| Up | PSMB4 | 128 | 0.006024 | 19460760 | 0.31217 |
| Up | PSMB1 | 126 | 0.005935 | 19159108 | 0.312736 |
| Up | PSMD10 | 125 | 0.006564 | 19293068 | 0.313162 |
| Up | PSMB7 | 121 | 0.004879 | 18406276 | 0.311911 |
| Up | CDC27 | 121 | 0.014082 | 17205180 | 0.314709 |
| Up | PLCG2 | 119 | 0.031441 | 10514426 | 0.284595 |
| Up | UBE2E1 | 111 | 0.01698 | 18575766 | 0.315597 |
| Up | MRPL24 | 111 | 0.004006 | 3985902 | 0.27419 |
| Up | SEC11A | 107 | 0.005316 | 8457436 | 0.302168 |
| Up | EIF3E | 105 | 0.00271 | 6755804 | 0.298099 |
| Up | EIF1AX | 105 | 0.00175 | 6248608 | 0.298099 |
| Up | ETF1 | 104 | 0.003209 | 7817310 | 0.300348 |
| Up | SF3B5 | 104 | 0.003133 | 6307886 | 0.271298 |
| Up | EIF5 | 103 | 0.002157 | 5951468 | 0.298056 |
| Up | MRPS12 | 103 | 0.001566 | 3803642 | 0.27381 |
| Up | RPS27L | 103 | 0.003987 | 8037762 | 0.3043 |
| Up | RBMX | 102 | 0.006533 | 8629778 | 0.302543 |
| Up | SF3B6 | 101 | 0.007747 | 10034416 | 0.30272 |
| Up | RPL36A | 101 | 0.001189 | 3109720 | 0.271102 |
| Up | RSL24D1 | 100 | 0.010421 | 6175826 | 0.267684 |
| Up | ANAPC5 | 100 | 0.005802 | 14180882 | 0.312854 |
| Up | ITGAV | 98 | 0.047765 | 36204220 | 0.313518 |
| Up | SRP72 | 98 | 0.001539 | 6042806 | 0.299696 |
| Up | NME2 | 94 | 0.034644 | 15645818 | 0.312029 |
| Up | YWHAH | 93 | 0.030402 | 22230232 | 0.316369 |
| Up | MRPS15 | 86 | 0.001926 | 2385992 | 0.260394 |
| Up | UQCRQ | 83 | 0.003421 | 1615130 | 0.240866 |
| Up | CCNC | 83 | 0.010303 | 8511008 | 0.281231 |
| Up | UQCRC1 | 82 | 0.02328 | 14231790 | 0.289875 |
| Up | MED4 | 80 | 0.018252 | 17775072 | 0.301683 |
| Up | UQCRFS1 | 78 | 0.001699 | 1157234 | 0.244233 |
| Up | CCND2 | 77 | 0.023553 | 14830028 | 0.314399 |
| Up | MRPL12 | 77 | 0.002782 | 2194820 | 0.259789 |
| Up | POLR1D | 75 | 0.0061 | 4678140 | 0.274081 |
| Up | UQCRH | 72 | 0.001221 | 959168 | 0.244147 |
| Up | KLHL12 | 68 | 0.003828 | 3608276 | 0.303719 |
| Up | SLC9A3R1 | 63 | 0.021981 | 10906810 | 0.303987 |
| Up | XRCC5 | 63 | 0.016826 | 12450448 | 0.298895 |
| Up | EIF6 | 62 | 0.005109 | 3166876 | 0.251672 |
| Up | GTF3A | 61 | 0.016181 | 6249890 | 0.308426 |
| Up | MRPS6 | 60 | 6.26E-04 | 932952 | 0.249563 |
| Up | PLA2G2A | 59 | 0.016536 | 3353206 | 0.267442 |
| Up | NDUFC2 | 58 | 0.009137 | 6243750 | 0.288562 |
| Up | TAF7 | 58 | 0.008456 | 6200048 | 0.248053 |
| Up | NDUFA13 | 58 | 0.010438 | 6851160 | 0.289086 |
| Up | TSG101 | 57 | 0.016521 | 11031600 | 0.306145 |
| Up | SAP18 | 57 | 0.012307 | 5315482 | 0.302256 |
| Up | NDUFS4 | 56 | 0.001242 | 656204 | 0.239889 |
| Up | SMAD5 | 56 | 0.020424 | 14462992 | 0.296201 |
| Up | RSL1D1 | 56 | 0.011475 | 16770568 | 0.229134 |
| Up | NDUFA2 | 54 | 7.42E-04 | 556554 | 0.239861 |
| Up | NBN | 54 | 0.015436 | 11207188 | 0.30323 |
| Up | NEDD8 | 53 | 0.011483 | 3600034 | 0.320831 |
| Up | PRMT1 | 52 | 0.012592 | 15575898 | 0.301332 |
| Up | MORF4L1 | 51 | 0.010667 | 4279006 | 0.296795 |
| Up | CUL4A | 50 | 0.007675 | 2678820 | 0.299544 |
| Up | LAMA2 | 49 | 0.007709 | 8570206 | 0.278844 |
| Up | COX6A1 | 48 | 0.001525 | 801088 | 0.240334 |
| Up | AK1 | 46 | 0.003174 | 1615960 | 0.250894 |
| Up | COX5B | 42 | 0.001215 | 595708 | 0.239861 |
| Up | TADA3 | 40 | 0.010349 | 2368830 | 0.281307 |
| Up | SUMO3 | 40 | 0.011044 | 5466788 | 0.300348 |
| Up | CDKN2B | 36 | 0.006521 | 2033654 | 0.280983 |
| Up | SERPINH1 | 36 | 0.01212 | 7196482 | 0.29909 |
| Up | MRPL20 | 34 | 0.002069 | 1471944 | 0.293201 |
| Up | COMT | 34 | 0.015004 | 4152910 | 0.286109 |
| Up | LSM4 | 34 | 0.007332 | 2056240 | 0.254456 |
| Up | EXOC5 | 33 | 0.00443 | 1785404 | 0.263041 |
| Up | SYVN1 | 32 | 0.012143 | 5434366 | 0.291078 |
| Up | BAK1 | 31 | 0.006508 | 1183542 | 0.267425 |
| Up | RAB10 | 30 | 0.008921 | 6109230 | 0.296328 |
| Up | PFDN5 | 29 | 0.010966 | 3969486 | 0.290567 |
| Up | SCARB1 | 28 | 0.010079 | 5204710 | 0.299544 |
| Up | COX6C | 27 | 4.36E-04 | 219006 | 0.232011 |
| Up | COX4I1 | 26 | 6.32E-04 | 186792 | 0.232493 |
| Up | EZH1 | 26 | 0.001591 | 543666 | 0.245377 |
| Up | SUCLG1 | 26 | 0.008369 | 8540110 | 0.200727 |
| Up | OXCT1 | 25 | 0.007475 | 2818178 | 0.199778 |
| Up | PHB | 24 | 0.005122 | 2747910 | 0.293388 |
| Up | BANF1 | 20 | 0.005143 | 1975740 | 0.295651 |
| Up | BCCIP | 20 | 0.003654 | 1838164 | 0.269444 |
| Up | RDX | 18 | 0.004798 | 4656272 | 0.29563 |
| Up | CFL2 | 15 | 0.005519 | 1602836 | 0.286624 |
| Up | ARF5 | 12 | 0.004972 | 1234824 | 0.284419 |
| Up | UCHL1 | 12 | 0.001629 | 954606 | 0.29618 |
| Up | PFN2 | 11 | 0.003745 | 1598036 | 0.28734 |
| Up | NDUFB2 | 8 | 0 | 0 | 0.225404 |
| Up | COX6B1 | 8 | 0 | 0 | 0.225073 |
| Up | COX7A2L | 8 | 0 | 0 | 0.225073 |
| Up | COX7C | 8 | 0 | 0 | 0.225073 |
| Up | PRPF31 | 8 | 1.73E-04 | 119394 | 0.213127 |
| Up | COX8A | 8 | 0 | 0 | 0.225073 |
| Up | NDUFS5 | 8 | 0 | 0 | 0.225404 |
| Up | PHB2 | 8 | 0.001363 | 712242 | 0.308449 |
| Up | ETFB | 4 | 0 | 0 | 0.224963 |
| Up | NELFB | 3 | 2.95E-04 | 570978 | 0.27419 |
| Up | CKS1B | 3 | 6.28E-06 | 1544 | 0.254284 |
| Up | ANAPC13 | 3 | 0 | 0 | 0.245741 |
| Up | GTF2A2 | 3 | 0 | 0 | 0.236342 |
| Up | POLE4 | 3 | 2.39E-04 | 114402 | 0.254863 |
| Up | TYROBP | 2 | 0 | 0 | 0.248948 |
| Up | DCAF6 | 2 | 0 | 0 | 0.241724 |
| Up | SKIL | 2 | 0 | 0 | 0.239764 |
| Up | S100A16 | 2 | 0 | 0 | 0.172622 |
| Up | HMGCL | 2 | 0 | 0 | 0.172622 |
| Up | ARHGAP12 | 2 | 7.30E-07 | 10130 | 0.210056 |
| Up | STX10 | 2 | 0 | 0 | 0.222748 |
| Up | UQCR11 | 2 | 0 | 0 | 0.194129 |
| Up | GADD45B | 1 | 0 | 0 | 0.188748 |
| Up | PFDN1 | 1 | 0 | 0 | 0.225159 |
| Up | CDIPT | 1 | 0 | 0 | 0.221556 |
| Up | TOMM7 | 1 | 0 | 0 | 0.211009 |
| Up | MRPS24 | 1 | 0 | 0 | 0.206607 |
| Up | SBDS | 1 | 0 | 0 | 0.201078 |
| Up | COPS7A | 1 | 0 | 0 | 0.230512 |
| Up | DERL2 | 1 | 0 | 0 | 0.225466 |
| Up | DTYMK | 1 | 0 | 0 | 0.237835 |
| Up | NDFIP1 | 1 | 0 | 0 | 0.237726 |
| Up | BTF3L4 | 1 | 0 | 0 | 0.213292 |
| Up | AFAP1L1 | 1 | 0 | 0 | 0.195053 |
| Up | ATP6V1D | 1 | 0 | 0 | 0.235992 |
| Up | LSM3 | 1 | 0 | 0 | 0.202852 |
| Up | ARFIP2 | 1 | 0 | 0 | 0.22145 |
| Up | F13A1 | 1 | 0 | 0 | 0.201558 |
| Up | ABI3BP | 1 | 0 | 0 | 0.18668 |
| Up | NDUFAF3 | 1 | 0 | 0 | 0.193485 |
| Up | APOD | 1 | 0 | 0 | 0.201401 |
| Up | UBL5 | 1 | 0 | 0 | 0.242915 |
| Up | MFAP5 | 1 | 0 | 0 | 0.160727 |
| Up | RAB4A | 1 | 0 | 0 | 0.234402 |
| Up | SNAPIN | 1 | 0 | 0 | 0.232493 |
| Up | UROS | 1 | 0 | 0 | 0.212264 |
| Up | PLTP | 1 | 0 | 0 | 0.201401 |
| Up | VPS28 | 1 | 0 | 0 | 0.234402 |
| Up | EIF3L | 1 | 0 | 0 | 0.229656 |
| Up | NUDT16 | 1 | 0 | 0 | 0.237835 |
| Up | BLOC1S1 | 1 | 0 | 0 | 0.256919 |
| Down | ESR1 | 250 | 0.13227 | 1.07E+08 | 0.34572 |
| Down | LCK | 209 | 0.099202 | 95979964 | 0.328259 |
| Down | S1PR5 | 174 | 0.006652 | 8092966 | 0.28169 |
| Down | CCL28 | 174 | 0.003314 | 5208440 | 0.274992 |
| Down | CTNND1 | 106 | 0.042469 | 42968374 | 0.310275 |
| Down | KNTC1 | 101 | 0.02909 | 80024314 | 0.25565 |
| Down | NGFR | 100 | 0.036602 | 63182380 | 0.318388 |
| Down | TIAM2 | 95 | 0.021154 | 62011932 | 0.265317 |
| Down | OBSCN | 86 | 0.010365 | 36096562 | 0.247534 |
| Down | PLD1 | 73 | 0.033394 | 17246708 | 0.30421 |
| Down | CALCR | 71 | 0.002592 | 2172836 | 0.25466 |
| Down | PTGDR | 70 | 0.002067 | 1966748 | 0.255524 |
| Down | FASLG | 69 | 0.019813 | 7248566 | 0.301244 |
| Down | NEDD4L | 68 | 0.023391 | 18526624 | 0.311841 |
| Down | GLI3 | 68 | 0.017183 | 7308126 | 0.2879 |
| Down | CEP135 | 65 | 0.013666 | 21907982 | 0.267857 |
| Down | SDCCAG8 | 65 | 0.013666 | 21907982 | 0.267857 |
| Down | ARHGAP39 | 61 | 0.006186 | 28702190 | 0.252655 |
| Down | TNKS | 60 | 0.004206 | 3754360 | 0.297842 |
| Down | CHEK2 | 60 | 0.016237 | 7288936 | 0.307601 |
| Down | GLI2 | 58 | 0.012509 | 5073890 | 0.282922 |
| Down | ENTPD5 | 57 | 0.005964 | 2743528 | 0.250015 |
| Down | FAM13B | 56 | 0.004818 | 23506158 | 0.251122 |
| Down | ARHGAP22 | 56 | 0.004818 | 23506158 | 0.251122 |
| Down | LAMA5 | 52 | 0.00723 | 12112106 | 0.258896 |
| Down | SYNJ2 | 52 | 0.010084 | 13175450 | 0.253879 |
| Down | BCL2L11 | 52 | 0.016836 | 10636772 | 0.313969 |
| Down | ALOX15 | 49 | 0.008753 | 5227944 | 0.244161 |
| Down | FGFR3 | 49 | 0.011331 | 25238840 | 0.255587 |
| Down | GEMIN5 | 47 | 0.001525 | 2623902 | 0.254973 |
| Down | FAS | 47 | 0.009545 | 4674560 | 0.293347 |
| Down | PDE4B | 46 | 0.005717 | 3857072 | 0.252024 |
| Down | KCNC1 | 45 | 0.011352 | 17732982 | 0.215233 |
| Down | TAF4B | 45 | 0.004747 | 2685668 | 0.266101 |
| Down | TOP3A | 45 | 0.011616 | 46078906 | 0.231272 |
| Down | TTF1 | 43 | 0.001327 | 799808 | 0.270889 |
| Down | KCNQ4 | 42 | 0.027528 | 31515762 | 0.226874 |
| Down | MUC17 | 42 | 0.019711 | 25257640 | 0.157086 |
| Down | NTN1 | 40 | 0.012007 | 10110832 | 0.266152 |
| Down | COL8A1 | 38 | 0.013121 | 17046748 | 0.212558 |
| Down | MMRN1 | 38 | 0.011827 | 11815884 | 0.252424 |
| Down | EPHA4 | 38 | 0.003668 | 1364992 | 0.273358 |
| Down | MEN1 | 35 | 0.006804 | 6211974 | 0.272297 |
| Down | GOSR1 | 34 | 0.008526 | 3939382 | 0.285714 |
| Down | SKA1 | 32 | 0.002897 | 9913724 | 0.243129 |
| Down | VTI1A | 31 | 0.007925 | 4181998 | 0.286386 |
| Down | SYNE2 | 30 | 0.007519 | 9249888 | 0.228212 |
| Down | ITIH4 | 26 | 0.007262 | 1264158 | 0.272297 |
| Down | LCAT | 26 | 0.005782 | 971078 | 0.252178 |
| Down | TRIB3 | 24 | 0.002492 | 6242350 | 0.248261 |
| Down | TRAF5 | 24 | 0.00684 | 5476244 | 0.212395 |
| Down | DNAH3 | 24 | 0.007222 | 8565654 | 0.215524 |
| Down | PFAS | 24 | 0.014988 | 8957870 | 0.288321 |
| Down | SNPH | 24 | 0.00801 | 15545944 | 0.224536 |
| Down | GADD45G | 20 | 0.003326 | 13947820 | 0.23265 |
| Down | SFRP5 | 20 | 0.006774 | 5015824 | 0.211927 |
| Down | SPTB | 20 | 0.0063 | 11636704 | 0.233978 |
| Down | KAT7 | 18 | 0.003392 | 3121342 | 0.235683 |
| Down | EPHB4 | 18 | 0.001434 | 905566 | 0.260034 |
| Down | DNAH5 | 17 | 0.002849 | 3119232 | 0.205745 |
| Down | HIVEP1 | 17 | 0.005211 | 11367638 | 0.232859 |
| Down | DNAJC18 | 16 | 0.004758 | 4513144 | 0.228489 |
| Down | SCNN1D | 16 | 0.001683 | 759732 | 0.291057 |
| Down | ZBP1 | 16 | 0.0032 | 6672792 | 0.233555 |
| Down | RAP1GAP2 | 15 | 0.003133 | 3581154 | 0.225872 |
| Down | SARDH | 15 | 0.005309 | 5233702 | 0.183926 |
| Down | PRPS2 | 15 | 0.006081 | 1607396 | 0.285281 |
| Down | MYO10 | 15 | 0.004221 | 1310316 | 0.235723 |
| Down | ABCB4 | 14 | 5.59E-04 | 1308566 | 0.227248 |
| Down | SPN | 13 | 0.003074 | 2890384 | 0.244522 |
| Down | ERO1A | 13 | 0.004612 | 1425588 | 0.287161 |
| Down | LPXN | 13 | 0.002728 | 4156340 | 0.242304 |
| Down | CD82 | 12 | 0.001605 | 269660 | 0.279107 |
| Down | CFP | 12 | 0.004063 | 2388686 | 0.220588 |
| Down | CDC20B | 12 | 7.24E-04 | 204270 | 0.243429 |
| Down | EREG | 11 | 0.00292 | 4060738 | 0.221568 |
| Down | GABRA4 | 11 | 0.004826 | 844010 | 0.188362 |
| Down | STK36 | 10 | 5.16E-06 | 1410 | 0.231582 |
| Down | CLDN1 | 10 | 0.002949 | 1746194 | 0.196311 |
| Down | SCAF4 | 10 | 0.003013 | 2202372 | 0.198039 |
| Down | MFAP3 | 9 | 0.003861 | 3290616 | 0.191498 |
| Down | PPT2 | 9 | 0.003141 | 1767236 | 0.210548 |
| Down | NPHP4 | 9 | 0.003191 | 1398268 | 0.215199 |
| Down | ABI3 | 8 | 0.001847 | 2267982 | 0.229515 |
| Down | BATF3 | 8 | 6.07E-04 | 393104 | 0.226291 |
| Down | KLC2 | 8 | 0.00245 | 1875364 | 0.222485 |
| Down | GRK4 | 8 | 5.59E-04 | 417560 | 0.222533 |
| Down | ARNTL2 | 7 | 0.001968 | 1639758 | 0.209684 |
| Down | PPP1R3B | 7 | 0.002897 | 1494078 | 0.211732 |
| Down | IFT122 | 7 | 0.001127 | 614274 | 0.187492 |
| Down | AHSP | 7 | 0.002414 | 2877402 | 0.186226 |
| Down | ASIC3 | 7 | 0.001895 | 501964 | 0.235361 |
| Down | WDR19 | 7 | 0.001287 | 982818 | 0.187492 |
| Down | MGAM | 7 | 0.002455 | 406020 | 0.181388 |
| Down | STXBP5 | 6 | 0.00108 | 832104 | 0.196993 |
| Down | SLC30A7 | 6 | 0.002041 | 1162028 | 0.211776 |
| Down | NRL | 6 | 0.001496 | 1056416 | 0.226267 |
| Down | KCNMB4 | 5 | 0.001932 | 644596 | 0.189223 |
| Down | SPAST | 5 | 0.001932 | 3015012 | 0.17458 |
| Down | MTF1 | 5 | 8.87E-04 | 1194192 | 0.226862 |
| Down | FOXP2 | 5 | 0.001059 | 361276 | 0.219804 |
| Down | IWS1 | 4 | 4.91E-04 | 486888 | 0.21999 |
| Down | LRSAM1 | 4 | 4.66E-04 | 327264 | 0.292456 |
| Down | ECD | 4 | 3.00E-08 | 6 | 0.246517 |
| Down | RFX3 | 3 | 9.66E-04 | 260498 | 0.235696 |
| Down | IPP | 3 | 4.83E-04 | 255296 | 0.199412 |
| Down | ERG | 3 | 0.001157 | 1993680 | 0.288401 |
| Down | SLC9A7 | 2 | 4.83E-04 | 102030 | 0.189205 |
| Down | KBTBD7 | 2 | 4.83E-04 | 116108 | 0.284029 |
| Down | CARD14 | 2 | 2.67E-05 | 3564 | 0.219501 |
| Down | ANKRD6 | 2 | 3.60E-07 | 366 | 0.212744 |
| Down | ZFYVE1 | 2 | 4.83E-04 | 123952 | 0.234428 |
| Down | LNX2 | 1 | 0 | 0 | 0.215132 |
| Down | ATL1 | 1 | 0 | 0 | 0.148637 |
| Down | LMO7 | 1 | 0 | 0 | 0.195467 |
Construction of miRNA - target regulatory network
After combining the results of miRNA-target genes with the interactive network of miRNAs, 281 hub genes were selected and 2138 were miRNAs. The genes and miRNAs are shown in Fig. 4a. Specifically, 97 miRNAs (ex, hsa-mir-8067) that regulate RPL13A, 95 miRNAs (ex, hsa-mir-4518) that regulate RPS15A, 71 miRNAs (ex, hsa-mir-3685) that regulate RPLP0, 65 miRNAs (ex, hsa-mir-1202) that regulates ADCY6, 48 miRNAs (ex, hsa-mir-4461) that regulate RPS29, 129 miRNAs (ex, hsa-mir-8082) that regulate CTNND1, 98 miRNAs (ex, hsa-mir-4422) that regulate ESR1, 76 miRNAs (ex, hsa-mir-548am-5p) that regulate NEDD4L, 62 miRNAs (ex, hsa-mir-6886-3p) that regulate KNTC1 and 56 miRNAs (ex, hsa-mir-9500) that regulate NGFR were detected (Table 6).
Fig. 4.

a Target gene - miRNA regulatory network between target genes and miRNAs. b Target gene - TF regulatory network between target genes and TFs. Up regulated genes are marked in green; down regulated genes are marked in red; The purple color diamond nodes represent the key miRNAs; the blue color triangle nodes represent the key TFs.
Table 6.
miRNA - target gene and TF - target gene interaction
| Regulation | Target Genes | Degree | MicroRNA | Regulation | Target Genes | Degree | TF |
|---|---|---|---|---|---|---|---|
| Up | RPL13A | 97 | hsa-mir-8067 | Up | RBX1 | 15 | PER3 |
| Up | RPS15A | 95 | hsa-mir-4518 | Up | RPS15 | 13 | CTCF |
| Up | RPLP0 | 71 | hsa-mir-3685 | Up | RPS20 | 12 | E2F7 |
| Up | ADCY6 | 65 | hsa-mir-1202 | Up | ADCY6 | 11 | LMO2 |
| Up | RPS29 | 48 | hsa-mir-4461 | Up | POLR2K | 9 | POLR2H |
| Up | RPL30 | 47 | hsa-mir-6811-5p | Up | RPS15A | 8 | FOXF2 |
| Up | RPL35 | 44 | hsa-mir-2278 | Up | RPL35 | 8 | MYB |
| Up | RPS23 | 40 | hsa-mir-4282 | Up | RPS23 | 5 | USF1 |
| Up | SAA1 | 33 | hsa-mir-4701-3p | Up | RPL13A | 5 | NFYA |
| Up | RPS5 | 29 | hsa-mir-1301-3p | Up | RPS29 | 5 | JUN |
| Up | RBX1 | 29 | hsa-mir-5187-3p | Up | POLR2J | 5 | POLR2C |
| Up | RPS20 | 26 | hsa-mir-708-5p | Up | RPL30 | 4 | IRF7 |
| Up | RPS15 | 23 | hsa-mir-1260b | Up | RPLP0 | 3 | SMAD3 |
| Up | POLR2K | 13 | hsa-mir-5680 | Up | RPS5 | 3 | GABPA |
| Up | POLR2J | 9 | hsa-mir-129-2-3p | Up | SAA1 | 2 | CEBPB |
| Down | CTNND1 | 129 | hsa-mir-8082 | Up | PHB2 | 1 | PHB2 |
| Down | ESR1 | 98 | hsa-mir-4422 | Down | ESR1 | 122 | NCOA2 |
| Down | NEDD4L | 76 | hsa-mir-548am-5p | Down | LCK | 21 | EBF1 |
| Down | KNTC1 | 62 | hsa-mir-6886-3p | Down | GLI3 | 18 | SMAD2 |
| Down | NGFR | 56 | hsa-mir-9500 | Down | NEDD4L | 17 | JUND |
| Down | TIAM2 | 49 | hsa-mir-3679-5p | Down | CALCR | 15 | FOXO3 |
| Down | GLI3 | 33 | hsa-mir-1913 | Down | NGFR | 10 | POU2F1 |
| Down | FASLG | 25 | hsa-mir-7849-3p | Down | FASLG | 8 | DAXX |
| Down | PLD1 | 22 | hsa-mir-3200-3p | Down | CTNND1 | 7 | GATA1 |
| Down | OBSCN | 19 | hsa-mir-3657 | Down | KNTC1 | 5 | SP1 |
| Down | CALCR | 12 | hsa-mir-4735-5p | Down | PLD1 | 4 | E2F1 |
| Down | PTGDR | 11 | hsa-mir-4477b | Down | TIAM2 | 4 | FOXD1 |
| Down | CCL28 | 8 | hsa-mir-770-5p | Down | GLI2 | 1 | GLI3 |
| Down | LCK | 6 | hsa-mir-520c-3p | Down | ERG | 1 | ESR1 |
| Down | S1PR5 | 4 | hsa-mir-31-5p | Down | PTGDR | 1 | RORA |
| Down | CCL28 | 1 | FOS | ||||
| Down | OBSCN | 1 | CUX1 |
Construction of TF - target regulatory network
After combining the results of TF-target genes with the interactive network of TFs, 455 hub genes were selected and 274 were TFs. The genes and TFs are shown in Fig. 4b. Specifically, 15 TFs (ex, PER3) that regulate RBX1, 13 TFs (ex, CTCF) that regulate RPS15, 12 TFs (ex, E2F7) that regulate RPS20, 11 TFs (ex, LMO2) that regulate ADCY6, 9 TFs (ex, POLR2H) that regulate POLR2K, 122 TFs (ex, NCOA2) that regulate ESR1, 21 miRNAs (ex, EBF1) that regulate LCK, 18 TFs (ex, SMAD2) that regulate GLI3, 17 TFs (ex, JUND) that regulate NEDD4L, and 15 TFs (ex, FOXO3) that regulate CALCR were detected (Table 6).
Receiver operating characteristic (ROC) curve analysis
Moreover, ROC curve analysis using “pROC” packages was performed to calculate the capacity of ten hub genes to distinguish PCOS from normal control. SAA1, ADCY6, POLR2K, RPS15, RPS15A, CTNND1, ESR1, NEDD4L, KNTC1 and NGFR all exhibited excellent diagnostic efficiency (AUC > 0.7) (Fig. 5).
Fig. 5.

ROC curve validated the sensitivity, specificity of hub genes as a predictive biomarker for PCOS prognosis. a SAA1, b ADCY6, c POLR2K, d RPS15, e RPS15A, f ESR1, g LCK, h S1PR5, i CCL28, j CTNND1
Validation of the expression levels of hub genes by RT-PCR
Aiming to further verify the expression patterns of selected hub genes, real-time PCR, which allows quantitative analysis of hub gene expression, was applied. The results showed that the relative expression levels of 10 hub genes including SAA1, ADCY6, POLR2K, RPS15, RPS15A, CTNND1, ESR1, NEDD4L, KNTC1 and NGFR were consistent with the expression profiling by high throughput sequencing (Fig. 6).
Fig. 6.

Validation of hub genes by RT- PCR. a SAA1, b ADCY6, c POLR2K, d RPS15, e RPS15A, f ESR1, g LCK, h S1PR5, i CCL28, j CTNND1
Molecular docking studies
In the present analysis, the docking simulations are performed to classify the active site conformation and significant interactions with the receptor binding sites responsible for complex stability. The over expressed genes is recognized in polycystic ovary syndrome and their x-ray crystallographic proteins structure are selected from PDB for docking studies. The standard drugs containing steroid nucleus are most commonly used either alone or in combination with other drugs. The docking studies of standard molecules containing the steroid ring have been carried out using Sybyl X 2.1 drug design software. The docking studies were performed to know the biding interaction of standard molecules on identified overexpressed genes of protein. The X- RAY crystallographic structure of one protein in each of four over expressed genes of POLR2K, RPS15, RPS15 and SAA1 of their co-crystallised protein of PDB code 1LE9, 3OW2, 1G1X and 4IP8 respectively were selected for the docking (Fig. 7). A total of three drug molecules of ethinylestradiol (ETE), levonorgestril (LNG) and desogestril (DSG) were docked with over expressed proteins to assess the binding affinity with proteins. The binding score greater than six are said to be good, all three drug molecules obtained binding score greater than 7 respectively. The molecules ETE obtained with a high binding score of 9.943 with SAA1 of PDB code 4IP8 and 8.260, 8.223 and 8.019 with 1G1X, 3OW2 and 1LE9. The LNG obtained highest binding score of 8.535 with SAA1 of PDB code 4IP8 and 8.351, 7.973 and 7.854 with RPS15, POLR2K and RPS15 alpha of PDB code 3OW2, 1LE9 and 1G1X respectively. DSG: highest with POLR2K of 8.273 with PDB code 1LE9, 8.158 with SAA1 of PDB code 4IP8, 7.745 with RPS15 alpha of PDB code 1G1X and obtained least binding score of 5.674 with RPS15 of PDB code 3OW2 respectively (Table 7). The molecule ETE and LNG has highest binding score its interaction with protein 4IP8 and hydrogen bonding and other bonding interactions with amino acids are depicted by 3D (Fig. 8) and 2D (Fig. 9)
Fig. 7.

Structures of Designed Molecules
Table 7.
Docking results of standard drugs on overexpressed proteins
| Sl. No/ Code | Over expressed gene: POLR2K | Over expressed gene: RPS15 | Over expressed gene: RPS15 alpha | Over expressed gene: SAA1 | ||||||||
|---|---|---|---|---|---|---|---|---|---|---|---|---|
| PDB: 1LE9 | PDB: 3OW2 | PDB: 1G1X | PDB: 4IP8 | |||||||||
| Total Score | Crash (-Ve) |
Polar | Total Score | Crash (-Ve) |
Polar | Total Score | Crash (-Ve) |
Polar | Total Score | Crash (-Ve) |
Polar | |
| ETE | 8.019 | -0.755 | 1.219 | 8.223 | -1.768 | 2.517 | 8.260 | -0.857 | 3.135 | 9.943 | -1.689 | 0.891 |
| LNG | 7.973 | -0.945 | 1.295 | 8.351 | -2.752 | 3.465 | 7.854 | -0.599 | 2.373 | 8.535 | -1.948 | 0.057 |
| DSG | 8.273 | -1.124 | 1.116 | 5.674 | -1.611 | 2.212 | 7.745 | -1.046 | 2.306 | 8.158 | -1.997 | 0.000 |
Fig. 8.

2D Binding of Molecule ETE with 4IP8
Fig. 9.
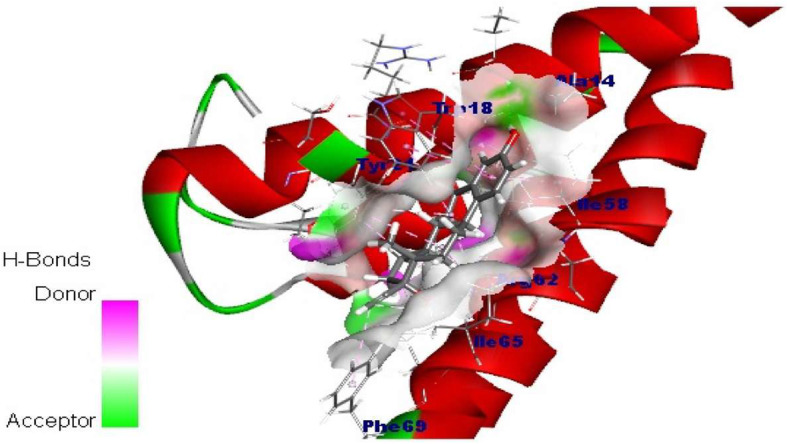
3D Binding of Molecule ETE with 4IP8
Discussion
PCOS is a most prevalent endocrine disorder with hyperandrogenism and chronic anovulation [29]. If not treated promptly and effectively, PCOS can seriously reduce the quality of life. There is no doubt that considerate syndrome at the molecular level will help to develop their diagnosis and treatment [30]. Up to now, various biomarkers have been identified to be linked with PCOS and might be selected as therapeutic targets, but the detailed mechanism of gene regulation leading to syndrome advancement remains elusive [31].
In our investigation, we aimed to identify biomarkers of PCOS and uncover their biological functions through bioinformatics analysis. Dataset GSE84958 was selected as expression profiling by high throughput sequencing dataset in our analysis. As a result, 360 up regulated and 379 down regulated genes at least 4-fold change between PCOS and normal control samples were screened out. ABI3BP protein expression in heart tissue was significantly related with cardiovascular disease [32], but this gene might be liable for progression of PCOS. Romo-Yáñez et al [33] have revealed the expression of BNIP3 was linked with diabetic in pregnancies, but this gene might be responsible for progression of PCOS. F13A1 is an essential regulatory factor to be associated in PCOS development [34]. An investigation has reported that the ITIH4 can promote non-alcoholic fatty liver disease [35], but this gene might be important for progression of PCOS. Da et al [36] have suggested that the TET3 is an important role in controlling type 2 diabetes progressions, but this gene might be key role in PCOS.
The GO and pathway enrichment analysis was of great importance for interpreting the molecular mechanisms of the key cellular activities in PCOS. RPS5 [37], RBM3 [38], BAK1 [39], NDUFC2 [40], NDUFS4 [41], NDUFS5 [42], UQCRFS1 [43], COX6B1 [44], NDUFA13 [45], PRMT1 [46], RDX (radixin) [47], EPHB4 [48], SYNE2 [49], DNAH5 [50], NEDD4L [51], PDE4B [52] and CTNND1 [53] plays a critical role in the process of cardiovascular disease, but these genes might be linked with development of PCOS. Ostergaard et al [54], Zi et al [55], Kunej et al [56], Van der Schueren et al [57], Jin et al [58], Emdad et al [59], Liu et al [60], Scherag et al [61], Shi and Long [62], Sharma et al [63], Parente et al [64], Saint-Laurent et al [65] and Lee [66] demonstrated that over expression of COA3, PHB (prohibitin), UQCRC1, COX4I1, IFI27, MTDH (metadherin), S100A16, SDCCAG8, GLI2, NTN1, NLGN2, FGFR3 and PTPRN2 could cause obesity, but these genes might be involved in progression of PCOS. Alsters et al [67], Lee et al [68], Shiffman et al [69], Yaghootkar et al [70], Rotroff et al [71], Cheng et al [72], Baig et al [73], Zhang et al [74], Lebailly et al [75], Ferris et al [76], Lempainen et al [77] and McCallum et al [78] presented that high expression of CPE (carboxypeptidase E), RPL13A, CERS2, CCND2, PRPF31, SARM1, PLD1, EPHA4, ARNTL2, BATF3, IKZF4 and MEN1 were associated with diabetes, but these genes might be linked with advancement of PCOS. Wang et al [79], Tian et al [80], Zhang et al [81] and Carr et al [82] demonstrated that over expression of ATP6AP2, FIS1, GRK4 and KCNQ4 were found to be substantially related to hypertension, but these genes might be essential for PCOS progression. Atiomo et al [83], Lara et al [84] and Douma et al [85] were reported that NQO1, NGFR (nerve growth factor receptor) and ESR1 could be an index for PCOS. Jin et al [86] presented that GLI3 was associated with non-alcoholic fatty liver disease, but this gene might be linked with development of PCOS.
In the present investigation, PPI network and its modules has been shown that significant amount of hub gene might be associated with progression of PCOS. Zhang et al [87] proposed that SAA1 was linked with progression of obesity, but this gene might be important for progression of PCOS. Deng et al [88] indicated that ADCY6 was responsible for development of cardiovascular disease, but this gene might be associated with advancement of PCOS. POLR2K, RPS15, RPS15A, ESR1, LCK (LCK proto-oncogene, Src family tyrosine kinase), S1PR5, CCL28, CTNND11, UQCRQ (ubiquinol-cytochrome c reductase complex III subunit VII), UQCRH (ubiquinol-cytochrome c reductase hinge protein), COX7C, COX6C, COX8A, COX5B, COX6A1, COX7A2L, ARHGAP39, OBSCN (obscurin, cytoskeletal calmodulin and titin-interacting RhoGEF) and TIAM2 might be novel biomarkers for PCOS.
MiRNA-target genes and TF-target genes regulatory networks revealed that the miRNAs, TF and target genes were might be involved in PCOS. Hsa-mir-6886-3p was liable for progression of hypertension [89], but this gene might be involved in progression of PCOS. Some investigations determined that expression of PER3 [90] and SMAD2 [91] were associated with diabetes, but these genes might be linked with advancement of PCOS. NCOA2 was found to be associated with advancement of obesity [92], but this gene might be involved in progression of PCOS. Recently, increasing evidence demonstrated that EBF1 was expressed in coronary artery disease [93], but this gene might be responsible for progression of PCOS. FOXO3 was involved in progression of PCOS [94]. RPLP0, RPS29, KNTC1, hsa-mir-8067, hsa-mir-4518, hsa-mir-3685, hsa-mir-1202, hsa-mir-4461, hsa-mir-8082, hsa-mir-4422, hsa-mir-548am-5p, hsa-mir-9500, RBX1, RPS20, CALCR (calcitonin receptor), CTCF (CCCTC-binding factor), E2F7, LMO2, POLR2H and JUND (jun D proto-oncogene) might be novel biomarkers for PCOS.
Among all three of molecules of ethinylestradiol, levonorgestrel and desogetril respectively, ethinylestradiolhas obtained highest binding score (c-score) of 9.943 with protein of PDB code 4IP8 and obtained 8.260, 8.223 and 8.019 with protein of PDB 1G1X, 3OW2 and 1LE9 respectively. The phenolic -OH group in ring A of ethinylestradiol formed favourable bonding interactions with ALA-14 of Chain A and pi-pi bonding interactions of alicyclic ring B TRP-18. Ethinylestradiol also formed alkyl and pi-alkyl interaction of ring B, C and D with TRP-18, ARG-62, TYR-21, PHE-69, ILE-65 and ILE-58. Ethinylestradiol also formed Van der Waals interactions with ACA-61, MET-17, MET-24 and GLN-66 respectively. It is assumed that the highest binding score (c-score) of ethinylestradiol is due to the presence of aromatic ring and the phenolic –OH group.
In conclusion, we used a series of bioinformatics analysis methods to find the crucial genes and pathways associated in PCOS initiation and development from expression profiling by high throughput sequencing containing PCOS samples and normal control samples. Our investigations provide a more specific molecular mechanism for the advancement of PCOS, detail information on the potential biomarkers and therapeutic targets. However, the interacting mechanism and function of genes need to be confirmed in further experiments.
Acknowledgement
We thank Wiebke Arlt, University of Birmingham, Institute of Metabolism and Systems Research (IMSR), Birmingham, United Kingdom, very much, the author who deposited their microarray dataset, GSE84958, into the public GEO database.
Informed consent
No informed consent because this study does not contain human or animals participants.
Authors’ contributions
Praveenkumar Devarbhavi - Investigation and resources. Lata Telang - Writing original draft and investigation. Basavaraj Vastrad - Writing original draft, and review and editing. Anandkumar Tengli - Investigation, and review and editing. Chanabasayya Vastrad - Software and investigation. Iranna Kotturshetti - Supervision and resources. The authors read and approved the final manuscript.
Availability of data and materials
The datasets supporting the conclusions of this article are available in the GEO (http://www.ncbi.nlm.nih.gov/geo) repository. [(GSE84958) (https://www.ncbi.nlm.nih.gov/geo/query/acc.cgi?acc=GSE84958)]
Ethics approval and consent to participate
This article does not contain any studies with human participants or animals performed by any of the authors.
Consent for publication
Not applicable.
Competing interests
The authors declare that they have no competing interests.
Footnotes
Publisher’s Note
Springer Nature remains neutral with regard to jurisdictional claims in published maps and institutional affiliations.
References
- 1.Meier RK. Polycystic Ovary Syndrome. Nurs Clin North Am. 2018;53(3):407–420. doi: 10.1016/j.cnur.2018.04.008. [DOI] [PubMed] [Google Scholar]
- 2.Belenkaia LV, Lazareva LM, Walker W, Lizneva DV, Suturina LV. Criteria, phenotypes and prevalence of polycystic ovary syndrome. Minerva Ginecol 2019;71(3):211-223. doi:10.23736/S0026-4784.19.04404-6 [DOI] [PubMed]
- 3.Escobar-Morreale HF, Roldán-Martín MB. Type 1 Diabetes and Polycystic Ovary Syndrome: Systematic Review and Meta-analysis. Diabetes Care. 2016;39(4):639–648. doi: 10.2337/dc15-2577. [DOI] [PubMed] [Google Scholar]
- 4.Oliver-Williams C, Vassard D, Pinborg A, Schmidt L. Risk of cardiovascular disease for women with polycystic ovary syndrome: results from a national Danish registry cohort study. Eur J Prev Cardiol. 2020:2047487320939674. 10.1177/2047487320939674. [DOI] [PubMed]
- 5.Lim SS, Norman RJ, Davies MJ, Moran LJ. The effect of obesity on polycystic ovary syndrome: a systematic review and meta-analysis. Obes Rev. 2013;14(2):95–109. doi: 10.1111/j.1467-789X.2012.01053.x. [DOI] [PubMed] [Google Scholar]
- 6.Wu J, Yao XY, Shi RX, Liu SF, Wang XY. A potential link between polycystic ovary syndrome and non-alcoholic fatty liver disease: an update meta-analysis. Reprod Health. 2018;15(1):77. doi: 10.1186/s12978-018-0519-2. [DOI] [PMC free article] [PubMed] [Google Scholar]
- 7.Joham AE, Boyle JA, Zoungas S, Teede HJ. Hypertension in Reproductive-Aged Women With Polycystic Ovary Syndrome and Association With Obesity. Am J Hypertens. 2015;28(7):847–851. doi: 10.1093/ajh/hpu251. [DOI] [PubMed] [Google Scholar]
- 8.Forlenza GP, Calhoun A, Beckman KB, Halvorsen T, Hamdoun E, Zierhut H, Sarafoglou K, Polgreen LE, Miller BS, Nathan B, et al. Next generation sequencing in endocrine practice. Mol Genet Metab. 2015;115(2-3):61–71. doi: 10.1016/j.ymgme.2015.05.002. [DOI] [PMC free article] [PubMed] [Google Scholar]
- 9.Wang LP, Peng XY, Lv XQ, Liu L, Li XL, He X, Lv F, Pan Y, Wang L, Liu KF, et al. High throughput circRNAs sequencing profile of follicle fluid exosomes of polycystic ovary syndrome patients. J Cell Physiol 2019. doi:10.1002/jcp.28201 [DOI] [PubMed]
- 10.Clough E, Barrett T. The Gene Expression Omnibus Database. Methods Mol Biol. 2016;1418:93–110. doi: 10.1007/978-1-4939-3578-9_5. [DOI] [PMC free article] [PubMed] [Google Scholar]
- 11.Ritchie ME, Phipson B, Wu D, Hu Y, Law CW, Shi W, Smyth GK. Limma powers differential expression analyses for RNA-sequencing and microarray studies. Nucleic Acids Res 2015;43(7):e47. doi:10.1093/nar/gkv007 [DOI] [PMC free article] [PubMed]
- 12.Ferreira JA. The Benjamini-Hochberg method in the case of discrete test statistics. Int J Biostat 2007;3(1):. doi:10.2202/1557-4679.1065 [DOI] [PubMed]
- 13.Thomas PD. The Gene Ontology and the Meaning of Biological Function. Methods Mol Biol. 2017;1446:15–24. doi: 10.1007/978-1-4939-3743-1_2. [DOI] [PMC free article] [PubMed] [Google Scholar]
- 14.Chen J, Bardes EE, Aronow BJ, Jegga AG. ToppGene Suite for gene list enrichment analysis and candidate gene prioritization. Nucleic Acids Res 2009;37(Web Server issue):W305-W311. doi:10.1093/nar/gkp427 [DOI] [PMC free article] [PubMed]
- 15.Fabregat A, Jupe S, Matthews L, Sidiropoulos K, Gillespie M, Garapati P, Haw R, Jassal B, Korninger F, May B, et al. The Reactome Pathway Knowledgebase. Nucleic Acids Res. 2018;46(D1):D649–D655. doi: 10.1093/nar/gkx1132. [DOI] [PMC free article] [PubMed] [Google Scholar]
- 16.Szklarczyk D, Franceschini A, Wyder S, Forslund K, Heller D, Huerta-Cepas J, Simonovic M, Roth A, Santos A, Tsafou KP, et al. STRING v10: protein-protein interaction networks, integrated over the tree of life. Nucleic Acids Res. 2015;43(Database issue):D447–D452. doi: 10.1093/nar/gku1003. [DOI] [PMC free article] [PubMed] [Google Scholar]
- 17.Shannon P, Markiel A, Ozier O, Baliga NS, Wang JT, Ramage D, Amin N, Schwikowski B. Ideker T Cytoscape: a software environment for integrated models of biomolecular interaction networks. Genome Res. 2003;13(11):2498–2504. doi: 10.1101/gr.1239303. [DOI] [PMC free article] [PubMed] [Google Scholar]
- 18.Przulj N, Wigle DA, Jurisica I. Functional topology in a network of protein interactions. Bioinformatics. 2004;20(3):340–348. doi: 10.1093/bioinformatics/btg415. [DOI] [PubMed] [Google Scholar]
- 19.Nguyen TP, Liu WC, Jordán F. Inferring pleiotropy by network analysis: linked diseases in the human PPI network. BMC Syst Biol 2011;5:179. Published 2011 Oct 31. doi:10.1186/1752-0509-5-179 [DOI] [PMC free article] [PubMed]
- 20.Shi Z, Zhang B. Fast network centrality analysis using GPUs. BMC Bioinformatics. 2011;12:149. doi: 10.1186/1471-2105-12-149. [DOI] [PMC free article] [PubMed] [Google Scholar]
- 21.Fadhal E, Gamieldien J, Mwambene EC. Protein interaction networks as metric spaces: a novel perspective on distribution of hubs. BMC Syst Biol. 2014;8:6. doi: 10.1186/1752-0509-8-6. [DOI] [PMC free article] [PubMed] [Google Scholar]
- 22.Zaki N, Efimov D, Berengueres J. Protein complex detection using interaction reliability assessment and weighted clustering coefficient. BMC Bioinformatics. 2013;14:163. doi: 10.1186/1471-2105-14. [DOI] [PMC free article] [PubMed] [Google Scholar]
- 23.Fan Y, Xia J. miRNet-Functional Analysis and Visual Exploration of miRNA-Target Interactions in a Network Context. Methods Mol Biol. 2018;1819:215–233. doi: 10.1007/978-1-4939-8618-7_10. [DOI] [PubMed] [Google Scholar]
- 24.Robin X, Turck N, Hainard A, Tiberti N, Lisacek F, Sanchez JC, Müller M. pROC: an open-source package for R and S+ to analyze and compare ROC curves. BMC Bioinformatics. 2011;12:77. doi: 10.1186/1471-2105-12-77. [DOI] [PMC free article] [PubMed] [Google Scholar]
- 25.Livak KJ, Schmittgen TD. Analysis of relative gene expression data using real-time quantitative PCR and the 2(-Delta Delta C(T)) Method. Methods. 2001;25(4):402–408. doi: 10.1006/meth.2001.1262. [DOI] [PubMed] [Google Scholar]
- 26.Shah KN, Patel SS. Phosphatidylinositide 3-kinase inhibition: A new potential target for the treatment of polycystic ovarian syndrome. Pharm Biol. 2016;54(6):975–983. doi: 10.3109/13880209.2015.1091482. [DOI] [PMC free article] [PubMed] [Google Scholar]
- 27.Wang Y, Fu X, Xu J, Wang Q, Kuang H. Systems pharmacology to investigate the interaction of berberine and other drugs in treating polycystic ovary syndrome. Sci Rep 2016;6:28089. Published 2016 Jun 16. doi:10.1038/srep28089 [DOI] [PMC free article] [PubMed]
- 28.Wu XK, Zhou SY, Liu JX, Pöllänen P, Sallinen K, Mäkinen M, Erkkola R. Selective ovary resistance to insulin signaling in women with polycystic ovary syndrome. Fertil Steril. 2003;80(4):954–965. doi: 10.1016/s0015-0282(03)01007-0. [DOI] [PubMed] [Google Scholar]
- 29.Polak K, Czyzyk A, Simoncini T, Meczekalski B. New markers of insulin resistance in polycystic ovary syndrome. J Endocrinol Invest. 2017;40(1):1–8. doi: 10.1007/s40618-016-0523-8. [DOI] [PMC free article] [PubMed] [Google Scholar]
- 30.Escobar-Morreale HF. Polycystic ovary syndrome: definition, aetiology, diagnosis and treatment. Nat Rev Endocrinol. 2018;14(5):270–284. doi: 10.1038/nrendo.2018.24. [DOI] [PubMed] [Google Scholar]
- 31.Carvalho LML, Ferreira CN, Sóter MO, Sales MF, Rodrigues KF, Martins SR, Candido AL, Reis FM, Silva IFO, Campos FMF, et al. Microparticles: Inflammatory and haemostatic biomarkers in Polycystic Ovary Syndrome. Mol Cell Endocrinol. 2017;443:155–162. doi: 10.1016/j.mce.2017.01.017. [DOI] [PubMed] [Google Scholar]
- 32.Delfín DA, DeAguero JL, McKown EN. The Extracellular Matrix Protein ABI3BP in Cardiovascular Health and Disease. Front Cardiovasc Med. 2019;6:23. doi: 10.3389/fcvm.2019.00023. [DOI] [PMC free article] [PubMed] [Google Scholar]
- 33.Romo-Yáñez J, Domínguez-Castro M, Flores-Reyes JS, Estrada-Juárez H, Mancilla-Herrera I, Hernández-Pineda J, Bazan-Tejeda ML, Aguinaga-Ríos M, Reyes-Muñoz E. Hyperglycemia differentially affects proliferation, apoptosis, and BNIP3 and p53 mRNA expression of human umbilical cord Wharton's jelly cells from non-diabetic and diabetic pregnancies. Biochem Biophys Res Commun. 2019;508(4):1149–1154. doi: 10.1016/j.bbrc.2018.12.037. [DOI] [PubMed] [Google Scholar]
- 34.Schweighofer N, Lerchbaum E, Trummer O, Schwetz V, Pilz S, Pieber TR, Obermayer-Pietsch B. Androgen levels and metabolic parameters are associated with a genetic variant of F13A1 in women with polycystic ovary syndrome. Gene. 2012;504(1):133–139. doi: 10.1016/j.gene.2012.04.050. [DOI] [PubMed] [Google Scholar]
- 35.Nakamura N, Hatano E, Iguchi K, Sato M, Kawaguchi H, Ohtsu I, Sakurai T, Aizawa N, Iijima H, Nishiguchi S, et al. Elevated levels of circulating ITIH4 are associated with hepatocellular carcinoma with nonalcoholic fatty liver disease: from pig model to human study. BMC Cancer. 2019;19(1):621. doi: 10.1186/s12885-019-5825-8. [DOI] [PMC free article] [PubMed] [Google Scholar]
- 36.Da Li, Cao T, Sun X, Jin S, Di Xie, Huang X, Yang X, Carmichael GG, Taylor HS, Diano S, et al. Hepatic TET3 contributes to type-2 diabetes by inducing the HNF4α fetal isoform. Nat Commun 2020;11(1):342. doi:10.1038/s41467-019-14185-z [DOI] [PMC free article] [PubMed]
- 37.Zhang X, Hu C, Zhang N, Wei WY, Li LL, Wu HM, Ma ZG, Tang QZ. Matrine attenuates pathological cardiac fibrosis via RPS5/p38 in mice. Acta Pharmacol Sin 2020. doi:10.1038/s41401-020-0473-8 [DOI] [PMC free article] [PubMed]
- 38.Rosenthal LM, Leithner C, Tong G, Streitberger KJ, Krech J, Storm C, Schmitt KRL. RBM3 and CIRP expressions in targeted temperature management treated cardiac arrest patients-A prospective single center study. PLoS One. 2019;14(12):e0226005. doi: 10.1371/journal.pone.0226005. [DOI] [PMC free article] [PubMed] [Google Scholar]
- 39.Hatchwell E. BAK1 gene variation and abdominal aortic aneurysms-variants are likely due to sequencing of a processed gene on chromosome 20. Hum Mutat. 2010;31(1):108–111. doi: 10.1002/humu.21147. [DOI] [PubMed] [Google Scholar]
- 40.Raffa S, Chin XLD, Stanzione R, Forte M, Bianchi F, Cotugno M, Marchitti S, Micaloni A, Gallo G, Schirone L, et al. The reduction of NDUFC2 expression is associated with mitochondrial impairment in circulating mononuclear cells of patients with acute coronary syndrome. Int J Cardiol. 2019;286:127–133. doi: 10.1016/j.ijcard.2019.02.027. [DOI] [PubMed] [Google Scholar]
- 41.Zhang H, Gong G, Wang P, Zhang Z, Kolwicz SC, Rabinovitch PS, Tian R, Wang W. Heart specific knockout of Ndufs4 ameliorates ischemia reperfusion injury. J Mol Cell Cardiol. 2018;123:38–45. doi: 10.1016/j.yjmcc.2018.08.022. [DOI] [PMC free article] [PubMed] [Google Scholar]
- 42.Iwahana T, Okada S, Kanda M, Oshima M, Iwama A, Matsumiya G, Kobayashi Y. Novel myocardial markers GADD45G and NDUFS5 identified by RNA-sequencing predicts left ventricular reverse remodeling in advanced non-ischemic heart failure: a retrospective cohort study. BMC Cardiovasc Disord. 2020;20(1):116. doi: 10.1186/s12872-020-01396-2. [DOI] [PMC free article] [PubMed] [Google Scholar]
- 43.Gusic M, Schottmann G, Feichtinger RG, Du C, Scholz C, Wagner M, Mayr JA, Lee CY, Yépez VA, Lorenz N, et al. Bi-Allelic UQCRFS1 Variants Are Associated with Mitochondrial Complex III Deficiency, Cardiomyopathy, and Alopecia Totalis. Am J Hum Genet. 2020;106(1):102–111. doi: 10.1016/j.ajhg.2019.12.005. [DOI] [PMC free article] [PubMed] [Google Scholar]
- 44.Abdulhag UN, Soiferman D, Schueler-Furman O, Miller C, Shaag A, Elpeleg O, Edvardson S, Saada A. Mitochondrial complex IV deficiency, caused by mutated COX6B1, is associated with encephalomyopathy, hydrocephalus and cardiomyopathy. Eur J Hum Genet. 2015;23(2):159–164. doi: 10.1038/ejhg.2014.85. [DOI] [PMC free article] [PubMed] [Google Scholar]
- 45.Hu H, Nan J, Sun Y, Zhu D, Xiao C, Wang Y, Zhu L, Wu Y, Zhao J, Wu R, et al. Electron leak from NDUFA13 within mitochondrial complex I attenuates ischemia-reperfusion injury via dimerized STAT3. Proc Natl Acad Sci U S A. 2017;114(45):11908–11913. doi: 10.1073/pnas.1704723114. [DOI] [PMC free article] [PubMed] [Google Scholar]
- 46.Pyun JH, Kim HJ, Jeong MH, Ahn BY, Vuong TA, Lee DI, Choi S, Koo SH, Cho H, Kang JS. Cardiac specific PRMT1 ablation causes heart failure through CaMKII dysregulation. Nat Commun. 2018;9(1):5107. doi: 10.1038/s41467-018-07606-y. [DOI] [PMC free article] [PubMed] [Google Scholar]
- 47.Cetinkaya A, Berge B, Sen-Hild B, Troidl K, Gajawada P, Kubin N, Valeske K, Schranz D, Akintürk H, Schönburg M, et al. Radixin Relocalization and Nonmuscle α-Actinin Expression Are Features of Remodeling Cardiomyocytes in Adult Patients with Dilated Cardiomyopathy. Dis Markers. 2020;2020:9356738. doi: 10.1155/2020/9356738. [DOI] [PMC free article] [PubMed] [Google Scholar]
- 48.Yang D, Jin C, Ma H, Huang M, Shi GP, Wang J, Xiang M. EphrinB2/EphB4 pathway in postnatal angiogenesis: a potential therapeutic target for ischemic cardiovascular disease. Angiogenesis. 2016;19(3):297–309. doi: 10.1007/s10456-016-9514-9. [DOI] [PubMed] [Google Scholar]
- 49.Chen S, Wang C, Wang X, Xu C, Wu M, Wang P, Tu X, Wang QK. Significant Association Between CAV1 Variant rs3807989 on 7p31 and Atrial Fibrillation in a Chinese Han Population. J Am Heart Assoc. 2015;4(5):e001980. doi: 10.1161/JAHA.115.001980. [DOI] [PMC free article] [PubMed] [Google Scholar]
- 50.Nöthe-Menchen T, Wallmeier J, Pennekamp P, Höben IM, Olbrich H, Loges NT, Raidt J, Dougherty GW, Hjeij R, Dworniczak B, et al. Randomization of left-right Asymmetry and Congenital Heart defects: the role of DNAH5 in humans and mice. Circ Genom Precis Med 2019;doi:10.1161/CIRCGEN.119.002686 [DOI] [PMC free article] [PubMed]
- 51.Dahlberg J, Sjögren M, Hedblad B, Engström G, Melander O. Genetic variation in NEDD4L, an epithelial sodium channel regulator, is associated with cardiovascular disease and cardiovascular death. J Hypertens. 2014;32(2):294–299. doi: 10.1097/HJH.0000000000000044. [DOI] [PubMed] [Google Scholar]
- 52.Karam S, Margaria JP, Bourcier A, Mika D, Varin A, Bedioune I, Lindner M, Bouadjel K, Dessillons M, Gaudin F, et al. Cardiac Overexpression of PDE4B Blunts β-Adrenergic Response and Maladaptive Remodeling in Heart Failure. Circulation. 2020;142(2):161–174. doi: 10.1161/CIRCULATIONAHA.119.042573. [DOI] [PubMed] [Google Scholar]
- 53.Alharatani R, Ververi A, Beleza-Meireles A, Ji W, Mis E, Patterson QT, Griffin JN, Bhujel N, Chang CA, Dixit A, et al. Novel truncating mutations in CTNND1 cause a dominant craniofacial and cardiac syndrome. Hum Mol Genet. 2020;29(11):1900–1921. doi: 10.1093/hmg/ddaa050. [DOI] [PMC free article] [PubMed] [Google Scholar]
- 54.Ostergaard E, Weraarpachai W, Ravn K, Born AP, Jønson L, Duno M, Wibrand F, Shoubridge EA, Vissing J. Mutations in COA3 cause isolated complex IV deficiency associated with neuropathy, exercise intolerance, obesity, and short stature. J Med Genet. 2015;52(3):203–207. doi: 10.1136/jmedgenet-2014-102914. [DOI] [PubMed] [Google Scholar]
- 55.Zi Xu YX, Ande SR, Mishra S. Prohibitin: A new player in immunometabolism and in linking obesity and inflammation with cancer. Cancer Lett. 2018;415:208–216. doi: 10.1016/j.canlet.2017.12.001. [DOI] [PubMed] [Google Scholar]
- 56.Kunej T, Wang Z, Michal JJ, Daniels TF, Magnuson NS, Jiang Z. Functional UQCRC1 polymorphisms affect promoter activity and body lipid accumulation. Obesity. 2007;15(12):2896–2901. doi: 10.1038/oby.2007.344. [DOI] [PubMed] [Google Scholar]
- 57.Van der Schueren B, Vangoitsenhoven R, Geeraert B, De Keyzer D, Hulsmans M, Lannoo M, Huber HJ, Mathieu C, Holvoet P. Low cytochrome oxidase 4I1 links mitochondrial dysfunction to obesity and type 2 diabetes in humans and mice. Int J Obes. 2015;39(8):1254–1263. doi: 10.1038/ijo.2015.58. [DOI] [PubMed] [Google Scholar]
- 58.Jin W, Jin W, Pan D. Ifi27 is indispensable for mitochondrial function and browning in adipocytes. Biochem Biophys Res Commun. 2018;501(1):273–279. doi: 10.1016/j.bbrc.2018.04.234. [DOI] [PubMed] [Google Scholar]
- 59.Emdad L, Das SK, Hu B, Kegelman T, Kang DC, Lee SG, Sarkar D, Fisher PB. AEG-1/MTDH/LYRIC: A Promiscuous Protein Partner Critical in Cancer, Obesity, and CNS Diseases. Adv Cancer Res. 2016;131:97–132. doi: 10.1016/bs.acr.2016.05.002. [DOI] [PubMed] [Google Scholar]
- 60.Liu Y, Zhang R, Xin J, Sun Y, Li J, Wei D, Zhao AZ. Identification of S100A16 as a novel adipogenesis promoting factor in 3T3-L1 cells. Endocrinology. 2011;152(3):903–911. doi: 10.1210/en.2010-1059. [DOI] [PubMed] [Google Scholar]
- 61.Scherag A, Kleber M, Boes T, Kolbe AL, Ruth A, Grallert H, Illig T, Heid IM, Toschke AM, Grau K, et al. SDCCAG8 obesity alleles and reduced weight loss after a lifestyle intervention in overweight children and adolescents. Obesity. 2012;20(2):466–470. doi: 10.1038/oby.2011.339. [DOI] [PubMed] [Google Scholar]
- 62.Shi Y, Long F. Hedgehog signaling via Gli2 prevents obesity induced by high-fat diet in adult mice. Elife. 2017;6:e31649. doi: 10.7554/eLife.31649. [DOI] [PMC free article] [PubMed] [Google Scholar]
- 63.Sharma M, Schlegel M, Brown EJ, Sansbury BE, Weinstock A, Afonso MS, Corr EM, van Solingen C, Shanley LC, Peled D, et al. Netrin-1 Alters Adipose Tissue Macrophage Fate and Function in Obesity. Immunometabolism 2019;1(2):e190010. doi:10.20900/immunometab20190010 [DOI] [PMC free article] [PubMed]
- 64.Parente DJ, Garriga C, Baskin B, Douglas G, Cho MT, Araujo GC, Shinawi M. Neuroligin 2 nonsense variant associated with anxiety, autism, intellectual disability, hyperphagia, and obesity. Am J Med Genet A. 2017;173(1):213–216. doi: 10.1002/ajmg.a.37977. [DOI] [PubMed] [Google Scholar]
- 65.Saint-Laurent C, Garcia S, Sarrazy V, Dumas K, Authier F, Sore S, Tran A, Gual P, Gennero I, Salles JP, et al. Early postnatal soluble FGFR3 therapy prevents the atypical development of obesity in achondroplasia. PLoS One. 2018;13(4):e0195876. doi: 10.1371/journal.pone.0195876. [DOI] [PMC free article] [PubMed] [Google Scholar]
- 66.Lee S. The association of genetically controlled CpG methylation (cg158269415) of protein tyrosine phosphatase, receptor type N2 (PTPRN2) with childhood obesity. Sci Rep. 2019;9(1):4855. doi: 10.1038/s41598-019-40486-w. [DOI] [PMC free article] [PubMed] [Google Scholar]
- 67.Alsters SI, Goldstone AP, Buxton JL, Zekavati A, Sosinsky A, Yiorkas AM, Holder S, Klaber RE, Bridges N, van Haelst MM, et al. Truncating Homozygous Mutation of Carboxypeptidase E (CPE) in a Morbidly Obese Female with Type 2 Diabetes Mellitus, Intellectual Disability and Hypogonadotrophic Hypogonadism. PLoS One. 2015;10(6):e0131417. doi: 10.1371/journal.pone.0131417. [DOI] [PMC free article] [PubMed] [Google Scholar]
- 68.Lee J, Harris AN, Holley CL, Mahadevan J, Pyles KD, Lavagnino Z, Scherrer DE, Fujiwara H, Sidhu R, Zhang J, et al. Rpl13a small nucleolar RNAs regulate systemic glucose metabolism. J Clin Invest. 2016;126(12):4616–4625. doi: 10.1172/JCI88069. [DOI] [PMC free article] [PubMed] [Google Scholar]
- 69.Shiffman D, Pare G, Oberbauer R, Louie JZ, Rowland CM, Devlin JJ, Mann JF, McQueen MJ. A gene variant in CERS2 is associated with rate of increase in albuminuria in patients with diabetes from ONTARGET and TRANSCEND. PLoS One. 2014;9(9):e106631. doi: 10.1371/journal.pone.0106631. [DOI] [PMC free article] [PubMed] [Google Scholar]
- 70.Yaghootkar H, Stancáková A, Freathy RM, Vangipurapu J, Weedon MN, Xie W, Wood AR, Ferrannini E, Mari A, Ring SM, et al. Association analysis of 29,956 individuals confirms that a low-frequency variant at CCND2 halves the risk of type 2 diabetes by enhancing insulin secretion. Diabetes. 2015;64(6):2279–2285. doi: 10.2337/db14-1456. [DOI] [PMC free article] [PubMed] [Google Scholar]
- 71.Rotroff DM, Yee SW, Zhou K, Marvel SW, Shah HS, Jack JR, Havener TM, Hedderson MM, Kubo M, Herman MA, et al. Genetic Variants in CPA6 and PRPF31 Are Associated With Variation in Response to Metformin in Individuals With Type 2 Diabetes. Diabetes. 2018;67(7):1428–1440. doi: 10.2337/db17-1164. [DOI] [PMC free article] [PubMed] [Google Scholar]
- 72.Cheng Y, Liu J, Luan Y, Liu Z, Lai H, Zhong W, Yang Y, Yu H, Feng N, Wang H, et al. Sarm1 Gene Deficiency Attenuates Diabetic Peripheral Neuropathy in Mice. Diabetes. 2019;68(11):2120–2130. doi: 10.2337/db18-1233. [DOI] [PMC free article] [PubMed] [Google Scholar]
- 73.Baig MH, Kausar MA, Husain FM, Shakil S, Ahmad I, Yadav BS, Saeed M. Interfering PLD1-PED/PEA15 interaction using self-inhibitory peptides: An in silico study to discover novel therapeutic candidates against type 2 diabetes. Saudi J Biol Sci. 2019;26(1):160–164. doi: 10.1016/j.sjbs.2018.08.020. [DOI] [PMC free article] [PubMed] [Google Scholar]
- 74.Zhang Z, Tremblay J, Raelson J, Sofer T, Du L, Fang Q, Argos M, Marois-Blanchet FC, Wang Y, Yan L, et al. EPHA4 regulates vascular smooth muscle cell contractility and is a sex-specific hypertension risk gene in individuals with type 2 diabetes. J Hypertens. 2019;37(4):775–789. doi: 10.1097/HJH.0000000000001948. [DOI] [PubMed] [Google Scholar]
- 75.Lebailly B, He C, Rogner UC. Linking the circadian rhythm gene Arntl2 to interleukin 21 expression in type 1 diabetes. Diabetes. 2014;63(6):2148–2157. doi: 10.2337/db13-1702. [DOI] [PubMed] [Google Scholar]
- 76.Ferris ST, Carrero JA, Mohan JF, Calderon B, Murphy KM, Unanue ER. A minor subset of Batf3-dependent antigen-presenting cells in islets of Langerhans is essential for the development of autoimmune diabetes. Immunity. 2014;41(4):657–669. doi: 10.1016/j.immuni.2014.09.012. [DOI] [PMC free article] [PubMed] [Google Scholar]
- 77.Lempainen J, Härkönen T, Laine A, Knip M. Ilonen J; Finnish Pediatric Diabetes Register. Associations of polymorphisms in non-HLA loci with autoantibodies at the diagnosis of type 1 diabetes: INS and IKZF4 associate with insulin autoantibodies. Pediatr Diabetes. 2013;14(7):490–496. doi: 10.1111/pedi.12046. [DOI] [PubMed] [Google Scholar]
- 78.McCallum RW, Parameswaran V, Burgess JR. Multiple endocrine neoplasia type 1 (MEN 1) is associated with an increased prevalence of diabetes mellitus and impaired fasting glucose. Clin Endocrinol. 2006;65(2):163–168. doi: 10.1111/j.1365-2265.2006.02563.x. [DOI] [PubMed] [Google Scholar]
- 79.Wang Y, Bao MH, Zhang QS, Li JM, Tang L. Association of ATP6AP2 Gene Polymorphisms with Essential Hypertension in a South Chinese Han Population. Asian Pac J Cancer Prev. 2015;16(17):8017–8018. doi: 10.7314/apjcp.2015.16.17.8017. [DOI] [PubMed] [Google Scholar]
- 80.Tian L, Neuber-Hess M, Mewburn J, Dasgupta A, Dunham-Snary K, Wu D, Chen KH, Hong Z, Sharp WW, Kutty S, et al. Ischemia-induced Drp1 and Fis1-mediated mitochondrial fission and right ventricular dysfunction in pulmonary hypertension. J Mol Med. 2017;95(4):381–393. doi: 10.1007/s00109-017-1522-8. [DOI] [PMC free article] [PubMed] [Google Scholar]
- 81.Zhang Y, Wang S, Huang H, Zeng A, Han Y, Zeng C, Zheng S, Ren H, Wang Y, Huang Y, et al. GRK4-mediated adiponectin receptor-1 phosphorylative desensitization as a novel mechanism of reduced renal sodium excretion in hypertension. Clin Sci. 2020;134(18):2453–2467. doi: 10.1042/CS20200671. [DOI] [PMC free article] [PubMed] [Google Scholar]
- 82.Carr G, Barrese V, Stott JB, Povstyan OV, Jepps TA, Figueiredo HB, Zheng D, Jamshidi Y, Greenwood IA. MicroRNA-153 targeting of KCNQ4 contributes to vascular dysfunction in hypertension. Cardiovasc Res. 2016;112(2):581–589. doi: 10.1093/cvr/cvw177. [DOI] [PMC free article] [PubMed] [Google Scholar]
- 83.Atiomo W, Shafiee MN, Chapman C, Metzler VM, Abouzeid J, Latif A, Chadwick A, Kitson S, Sivalingam VN, Stratford IJ, et al. Corrigendum: Expression of NAD(P) H quinone dehydrogenase 1 (NQO1) is increased in the endometrium of women with endometrial cancer and women with polycystic ovary syndrome. Clin Endocrinol. 2017;87(6):886. doi: 10.1111/cen.13515. [DOI] [PMC free article] [PubMed] [Google Scholar]
- 84.Lara HE, Dissen GA, Leyton V, Paredes A, Fuenzalida H, Fiedler JL, Ojeda SR. An increased intraovarian synthesis of nerve growth factor and its low affinity receptor is a principal component of steroid-induced polycystic ovary in the rat. Endocrinology. 2000;141(3):1059–1072. doi: 10.1210/endo.141.3.7395. [DOI] [PubMed] [Google Scholar]
- 85.Douma Z, Dallel M, Bahia W, Ben Salem A, Hachani B, Ali F, Almawi WY, Lautier C, Haydar S, Grigorescu F, Mahjoub T. Association of estrogen receptor gene variants (ESR1 and ESR2) with polycystic ovary syndrome in Tunisia. Gene 2020;741:144560. doi:10.1016/j.gene.2020.144560 [DOI] [PubMed]
- 86.Jin SS, Lin XF, Zheng JZ, Wang Q, Guan HQ. lncRNA NEAT1 regulates fibrosis and inflammatory response induced by nonalcoholic fatty liver by regulating miR-506/GLI3. Eur Cytokine Netw. 2019;30(3):98–106. doi: 10.1684/ecn.2019.0432. [DOI] [PubMed] [Google Scholar]
- 87.Zhang X, Tang QZ, Wan AY, Zhang HJ, Wei L. SAA1 gene variants and childhood obesity in China. Lipids Health Dis. 2013;12:161. doi: 10.1186/1476-511X-12-161. [DOI] [PMC free article] [PubMed] [Google Scholar]
- 88.Deng Y, Wang J, Xie G, Zeng X, Li H. Circ-HIPK3 Strengthens the Effects of Adrenaline in Heart Failure by MiR-17-3p - ADCY6 Axis. Int J Biol Sci. 2019;15(11):2484–2496. doi: 10.7150/ijbs.36149. [DOI] [PMC free article] [PubMed] [Google Scholar]
- 89.Miao R, Wang Y, Wan J, Leng D, Gong J, Li J, Zhang Y, Pang W, Zhai Z, Yang Y, Miao R, Wang Y, Wan J, et al. Microarray Analysis and Detection of MicroRNAs Associated with Chronic Thromboembolic Pulmonary Hypertension. Biomed Res Int. 2017;2017:8529796. doi: 10.1155/2017/8529796. [DOI] [PMC free article] [PubMed] [Google Scholar]
- 90.Karthikeyan R, Marimuthu G, Sooriyakumar M, BaHammam AS, Spence DW, Pandi-Perumal SR, Brown GM, Cardinali DP. Per3 length polymorphism in patients with type 2 diabetes mellitus. Horm Mol Biol Clin Investig. 2014;18(3):145–149. doi: 10.1515/hmbci-2013-0049. [DOI] [PubMed] [Google Scholar]
- 91.Lu Y, Habtetsion TG, Li Y, Zhang H, Qiao Y, Yu M, Tang Y, Zhen Q, Cheng Y, Liu Y. Association of NCOA2 gene polymorphisms with obesity and dyslipidemia in the Chinese Han population. Int J Clin Exp Pathol. 2015;8(6):7341–7349. [PMC free article] [PubMed] [Google Scholar]
- 92.Zhu Q, Chang A, Xu A, Luo K. The regulatory protein SnoN antagonizes activin/Smad2 protein signaling and thereby promotes adipocyte differentiation and obesity in mice. J Biol Chem. 2018;293(36):14100–14111. doi: 10.1074/jbc.RA118.003678. [DOI] [PMC free article] [PubMed] [Google Scholar]
- 93.Ying Y, Luo Y, Peng H. EBF1 gene polymorphism and its interaction with smoking and drinking on the risk of coronary artery disease for Chinese patients. Biosci Rep. 2018;38(3):BSR20180324. doi: 10.1042/BSR20180324. [DOI] [PMC free article] [PubMed] [Google Scholar]
- 94.Zhang S, Deng W, Liu Q, Wang P, Yang W, Ni W. Altered m6 A modification is involved in up-regulated expression of FOXO3 in luteinized granulosa cells of non-obese polycystic ovary syndrome patients. J Cell Mol Med. 2020;24(20):11874–11882. doi: 10.1111/jcmm.15807. [DOI] [PMC free article] [PubMed] [Google Scholar]
Associated Data
This section collects any data citations, data availability statements, or supplementary materials included in this article.
Data Availability Statement
The datasets supporting the conclusions of this article are available in the GEO (http://www.ncbi.nlm.nih.gov/geo) repository. [(GSE84958) (https://www.ncbi.nlm.nih.gov/geo/query/acc.cgi?acc=GSE84958)]