

Abstract
Dietary intake of linoleic acid (LA, 18:2ω−6) has risen dramatically in recent decades. Previous studies have suggested high intake of LA could increase tissue concentrations of ω−6-series eicosanoid metabolites, many of which pro-inflammatory and pro-tumorigenic, resulting in increased risks of developing inflammation and associated diseases. However, the effects of LA-rich diet on in vivo profiles of eicosanoids and development of inflammatory diseases are under-studied. Here we treated spontaneous colitis-prone (Il-10−/−) mice with a control diet (rich in saturated fatty acid, containing ~3 Cal% LA) or a LA-rich diet (containing ~9 Cal% LA) for 18 weeks, and analyzed the effects of the LA-rich diet on profiles of eicosanoids and development of spontaneous colitis. We found that treatment with the LA-rich diet increased tissue level of LA: the liver levels of LA were 5.8 ± 0.6% in control diet-treated mice versus 11.7 ± 0.7% in LA-rich diet-treated mice (P < 0.01). The plasma concentrations of a series of LA-derived metabolites, including 9-hydroxyoctadecadienoic acid (HODE), 9,10-dihydroxyoctadecenoic acid (DiHOME), 12,13-DiHOME, and 13-HODE were significantly increased by treatment with the LA-rich diet (P < 0.05). However, LA-rich diet had little effect on the severity of colitis in the treated Il-10−/− mice. These results suggest a limited role of increased consumption of dietary LA on promoting colitis in Il-10−/− model.
Keywords: linoleic acid, eicosanoids, colitis, Il-10−/− mice, colonic inflammation
Graphical Abstract

Introduction
Linoleic acid (LA, 18:2ω−6) is abundant in vegetable oils (such as corn and soybean oils), and dietary intake of LA has risen dramatically in recent decades1. The consumption of LA in the United States has increased from ~3 Cal% in 1909 to ~9 Cal% in 19991. Currently the average intake of LA is as high as ~12–17 grams/person/day in United States1. The effect of high consumption of LA on human health is controversial1,2. Notably, enzymatic metabolism of LA, as well as its downstream metabolite arachidonic acid (ARA, 20:4ω−6), leads to formation of ω−6-series eicosanoid metabolites, many of which have potent pro-inflammatory and pro-tumorigenic effects3. For example, the eicosanoids derived from metabolism of ARA, such as prostaglandin E2 (PGE2) and leukotriene B4 (LTB4) are pro-inflammatory and pro-tumorigenic3. These results suggest that increased dietary intake of LA could enhance tissue concentrations of ω−6-series eicosanoid metabolites, resulting in increased risks of inflammation and associated diseases. Some human and animal studies support that excess intake of dietary LA is associated with exaggerated colitis and colon cancer4–8. The European Prospective Investigation into Cancer and Nutrition (EPIC) study showed that high consumption of LA doubled the risks of colon inflammation, and could be responsible for ~30% of ulcerative colitis incidence8. However, the impact of excess intake of dietary LA on development of inflammatory diseases, notably colitis, remains under-studied, making it difficult to recommend optimal dietary intake of LA2.
To better understand the effects of LA-rich diet on profiles of eicosanoids in vivo and development of inflammatory diseases, here we treated spontaneous colitis-prone (Il-10−/−) mice with a control diet (rich in saturated fatty acid, containing ~3 Cal% LA, to mimic historical level of LA consumption in United States) or a LA-rich diet (containing ~9 Cal% LA, to mimic the current level of LA consumption in United States) for 18 weeks, and analyzed the effects of LA-rich diet on profiles of eicosanoids and development of spontaneous colitis in the treated mice.
Materials and methods
Chemicals
Activated charcoal, silicic acid, hematoxylin and eosin solutions were obtained from Sigma-Aldrich (St. Louis, MO). Hexane, TRIzol reagent, Tween 20, dithiothreitol (DTT), ethylenediaminetetraacetic acid (EDTA), hydrochloric acid and methanol were purchased from Thermo Fisher Scientific (Waltham, MA). Phosphate buffer saline (PBS) and Hank’s-balanced salt solution (HBSS) were obtained from Lonza (Basel, Switzerland).
Experimental oils
In the animal experiment, we used lard (rich in saturated fatty acids) and corn oil (rich in LA) to prepare experiment diets. The lard sample (Armour, Grand Prairie, TX) was purchased from a local market in Hadley, MA. For the corn oil, because many commercial corn oil samples were already oxidized during production and storage, we purchased fresh, un-opened, corn oil (Mazola, ACH Food company) from a local market and purified it using silicic acid-activated charcoal chromatography. Briefly, glass chromatographic column was layer-by-layer filled with silicic acid, activated charcoal, and silicic acid at a volume of 400 mL, 120 mL, and 400 mL, respectively. Corn oil (1 L) was mixed with the same volume of hexane, and loaded to the equilibrated column. The eluent was collected and evaporated to dryness using a rotary vacuum evaporator. The purified oil was fortified with tocopherol as antioxidant, stored at −80 °C, and used for animal experiment.
Spontaneous colitis model in Il-10−/− mice
The animal experiment was approved by the University of Massachusetts (UMass)-Amherst Institutional Animal Care and Use Committee (IACUC). The Il-10−/− male mice (6-week-old) were obtained from the Jackson Laboratory (Bar Harbor, ME) and housed at a conventional mouse facility at UMass. They were randomly divided into two groups (n = 10 mice per group) after acclimation: the control group was fed on AIN-93G diet with modification which had 6.3 wt/wt% lard and 0.7 wt/wt% corn oil for fat content, and LA-rich group was treated with the same diet except the fat content was 7 wt/wt% corn oil (see diet composition in Table S1). After 18-week treatment (the treatment time was determined from previous studies of us9 and others10), the mice were sacrificed using carbon dioxide, and the tissues were harvested for biochemical analysis.
Measurement of lipocalin 2 (LCN-2) in feces
The mice fecal samples were collected, and suspended in PBS (containing 0.1% Tween 20) with vortex at a concentration of 100 mg/mL. The content of LCN-2 in the supernatant was determined using a solid phase sandwich ELISA (R&D Systems, Minneapolis, MN) after centrifugation (14,000 g, 10 min, 4 °C).
qRT-PCR analysis of gene expressions in colon and small intestine
The middle segment of the colon tissue and the distal segment of the small intestine tissues were ground in liquid nitrogen, and RNA was extracted by TRIzol method. The cDNA was produced using a reverse transcription kit (Applied Biosystems, Foster City, CA). qRT-PCR was carried out with SYBR Green (Thermo Fisher Scientific) and ΔΔCt method. The glyceraldehyde-3-phosphate dehydrogenase (Gapdh) was utilized as the reference gene, and the primers of the target genes were listed in Table S2.
Histological examination of colon tissue
The distal colon tissues were fixed with 4% formalin, and then they were washed, dehydrated, and embedded into paraffin. The block was sliced, and the 5 μm sections transferred onto glass slides. The slides were microscopic analyzed after hematoxylin and eosin (H&E) staining. The histological examination was performed based on crypt architecture, goblet cell depletion, inflammatory cell infiltration, and muscle thickening of the tissue. The each individual score was summed for total histological score11.
Flow cytometry analysis of immune cell infiltration in colon
The mice distal colon tissues were pre-digested with HBSS containing 1 mM DTT and 5 mM EDTA, and digested at 37 °C for 40 min with type 3 collagenease (Worthington Biochemical, Lakewood, NJ). The obtained cells were incubated with anti- mouse CD4 (FITC-conjugated), CD8 (PE-conjugated), CD25 (APC-Cy7-conjugated), T-bet (APC-conjugated), RORγt (PE-conjugated), F4/80 (PE-conjugated), CD80 (APC-conjugated), and Gr-1 (FITC-conjugated) antibodies. They were re-suspended in cell staining buffer after fixation (BioLegend, San Diego, CA) after washing. The fluorescence-activated cell sorting (FACS) was performed by LSRFortessa™ cell analyzer (BD Biosciences, San Jose, CA). In our analysis, macrophages were identified as F4/80+ cells, M1 macrophages were identified as F4/80+ CD80+ cells, neutrophils were identified as Gr-1+ cells, Th1 and Th17 cells were identified as CD4+ T-bet+ and CD4+ RORγt+ cells, respectively, and CD25+ was regarded as the activation of CD4 and CD8 cells.
GC-MS analysis of fatty acid profiles in mouse tissue
Total lipids from liver were extracted as described previously12. The tissues were treated with 3 N methanolic HCl to prepare the fatty acid methyl esters at 55°C for 40 min. They were then dissolved in hexane and subjected to Shimadzu GC-MS-QP2010 SE (Tokyo, Japan) for analysis as we described13.
LC-MS/MS analysis of eicosanoid metabolites
After animal sacrifice, the blood was harvested by cardiac puncture with a disposable syringe, immediately transferred to blood collection tubes (Covidien, Mansfield, MA), and centrifuged (1,500 g, 10 min, 4 °C) to yield plasma. The plasma was stored at −80 °C until analysis. To extract lipid metabolites from plasma, deuterated internal standards (d11-14,15-DHET, d11-11,12-EET, d4-9-HODE, d8-5-HETE, d4-6-keto PGF1a, d4-LTB4, d4-PGE2, d4-TXB2, 500 nM) were added into ~200 μL plasma. The mixture was then loaded onto pre-washed Waters® Oasis solid phase extraction (SPE) cartridges, and washed with 5% methanol containing 0.1% acetic acid, and the analytes were eluted with methanol and ethyl acetate, dried by a centrifugal vacuum evaporator, and then dispersed in methanol for LC-MS/MS analysis. The LC-MS/MS analysis was performed on an Agilent 1200SL HPLC coupled with a 4000 QTRAP MS/MS (AB Sciex) as previously14. The peaks were identified based on retention time and specific multiple reaction monitoring (MRM) transitions of the standards of lipid metabolite. The concentrations of the lipid metabolites were calculated according to calibration curves of standards.
Data analysis
Data are expressed as mean ± standard error of the mean (SEM). Shapiro-Wilk test was used to verify the normality of data for comparison between two groups. Statistical significance was determined by two-side t-test if data were normally distributed; otherwise, significance was calculated by Mann-Whitney U test. All the analysis was performed with SigmaPlot software (San Jose, CA). The Partial Least Squares Discriminant Analysis (PLS-DA) was performed using MetaboAnalyst (http://www.metaboanalyst.ca/). The data were auto scaled before the analysis. P < 0.05 is reported as statistically significant.
Results
LA-rich diet increased levels of LA in tissues of Il-10−/− mice
We used GC-MS to measure the levels of fatty acids in the liver tissue of the treated Il-10−/− mice. Compared with control diet, an 18-week treatment with LA-rich diet significantly increased levels of LA in the liver tissues: the levels of LA in the liver tissues of the control diet- versus LA-rich diet-treated mice are 5.8 ± 0.6% versus 11.7 ± 0.7% (P = 0.0002) (Table 1). Besides LA, the levels of other PUFA, including ARA (20:4ω−6), eicosapentaenoic acid (EPA, 20:5ω−3), and docosahexaenoic acid (DHA, 22:6ω−3), were not significantly changed (Table 1).
Table 1.
GC-Ms analysis of fatty acid profile in the liver tissues of mice (the data are mean ± SEM, expressed as % of an individual fatty acid to the total fatty acids).
| Fatty acid (%) | Control diet | LA-rich diet | P value |
|---|---|---|---|
| C14:0 | 0.7 ± 0.0 | 0.7 ± 0.0 | 0.78 |
| C16:0 | 26.6 ± 0.4 | 27.7 ± 0.4 | 0.09 |
| C16:1 n7 | 5.1 ± 0.2 | 4.5 ± 0.2 | 0.08 |
| C18:0 | 4.4 ± 0.3 | 4.2 ± 0.3 | 0.71 |
| C18:1 n9 | 40.8 ± 1.0 | 36.0 ± 1.2 | 0.02 |
| C18:1 n7 | 6.3 ± 0.2 | 4.8 ± 0.2 | < 0.01 |
| C18:2 n6 | 5.8 ± 0.6 | 11.7 ± 0.7 | < 0.01 |
| C18:3 n3 | 0.1 ± 0.0 | 0.1 ± 0.0 | 0.63 |
| C20:3 n6 | 0.6 ± 0.1 | 0.8 ± 0.1 | 0.17 |
| C20:4 n6 | 3.4 ± 0.4 | 3.2 ± 0.4 | 0.76 |
| C20:5 n3 | 0.4 ± 0.0 | 0.5 ± 0.1 | 0.52 |
| C22:6 n3 | 0.6 ± 0.1 | 0.5 ± 0.2 | 0.47 |
| others | 5.3 ± 0.3 | 5.4 ± 0.2 | 0.99 |
| n-6-to-n-3 ratio | 8.9 ± 0.7 | 14.2 ± 0.9 | 0.01 |
LA-rich diet modulated profiles of eicosanoids, with increased levels of LA metabolites, in the plasma of Il-10−/− mice
We used a LC-MS/MS-based lipidomics to analyze the profile of eicosanoid metabolites in the plasma of the treated Il-10−/− mice. This LC-MS/MS method can detect 88 metabolites (see complete list of eicosanoid metabolites included in our LC-MS/MS method in Table S3). We detected 49 metabolites from the plasma, as some metabolites were below the levels of detection of our LC-MS/MS (see complete LC-MS/MS results in Table 2). PLS-DA analysis showed that there is a significant differentiation between the LA-rich diet versus control diet in terms of the profiles of eicosanoid metabolites in plasma (Figure 1A). In addition, the VIP score analysis gave the most important metabolites that contribute to the differentiation (Figure 1B). Among the detected metabolites, the plasma concentrations of a series of LA-derived metabolites, including 9-hydroxyoctadecadienoic acid (HODE), 13-HODE, 9,10-dihydroxyoctadecenoic acid (DiHOME), and 12,13-DiHOME, were significantly increased by treatment with the LA-rich diet (Figure 1B and Table 2).
Table 2.
Concentrations of lipid metabolites in the plasma of mice fed with control or LA-rich diet (data are mean ± SEM).
| Metabolite | Control diet | LA-rich diet | P value |
|---|---|---|---|
| 13-oxo-ODE | 0.25 ± 0.04 | 0.39 ± 0.06 | 0.06 |
| 9-HOTrE | 0.24 ± 0.03 | 0.21 ± 0.02 | 0.53 |
| 9-oxo-ODE | 1.51 ± 0.13 | 2.79 ± 0.34 | < 0.01 |
| 15,16-EpODE | 0.27 ± 0.04 | 0.24 ± 0.04 | 0.57 |
| 13-HODE | 12.4 ± 1.22 | 23.1 ± 4.02 | 0.02 |
| 9-HODE | 3.50 ± 0.42 | 7.08 ± 1.44 | 0.01 |
| 12,13-EpOME | 14.3 ± 3.11 | 21.0 ± 4.46 | 0.21 |
| 9,10-EpOME | 13.7 ± 3.10 | 20.1 ± 5.01 | 0.31 |
| EKODE | 1.79 ± 0.32 | 3.12 ± 0.70 | 0.16 |
| 12,13-DiHOME | 3.74 ± 0.24 | 7.41 ± 0.85 | < 0.01 |
| 9,10-DiHOME | 2.30 ± 0.11 | 4.76 ± 0.66 | < 0.01 |
| 12-HEPE | 1.16 ± 0.37 | 2.00 ± 0.53 | 0.21 |
| 15-oxo-ETE | 0.47 ± 0.07 | 0.81 ± 0.21 | 0.08 |
| 5-oxo-ETE | 0.98 ± 0.13 | 0.92 ± 0.13 | 0.74 |
| 11,12-EpETrE | 5.35 ± 0.98 | 4.69 ± 0.76 | 0.79 |
| 11-HETE | 0.18 ± 0.09 | 0.52 ± 0.12 | 0.03 |
| 12-HETE | 45.4 ± 13.2 | 99.4 ± 25.9 | 0.08 |
| 14,15-EpETrE | 4.93 ± 0.95 | 3.91 ± 0.57 | 0.37 |
| 15-HETE | 0.90 ± 0.26 | 2.14 ± 0.47 | 0.03 |
| 5,6-EpETrE | 74.8 ± 9.73 | 79.7 ± 17.3 | 0.68 |
| 5-HETE | 4.28 ± 0.48 | 4.12 ± 0.46 | 0.82 |
| 8,9-EpETrE | 5.61 ± 0.77 | 3.63 ± 0.53 | 0.05 |
| 8-HETE | 0.01 ± 0.01 | 0.03 ± 0.02 | 0.17 |
| 9-HETE | 0.01 ± 0.01 | 0.03 ± 0.02 | 0.18 |
| 5-HETrE | 0.47 ± 0.06 | 0.83 ± 0.23 | 0.21 |
| 9,10,13-TriHOME | 1.59 ± 0.24 | 2.86 ± 0.73 | 0.04 |
| 9,12,13-TriHOME | 2.85 ± 0.33 | 5.02 ± 1.19 | 0.05 |
| 14,15-DiHETE | 0.09 ± 0.01 | 0.08 ± 0.01 | 0.41 |
| 17,18-DiHETE | 0.33 ± 0.05 | 0.33 ± 0.03 | 0.92 |
| 6-trans-LTB4 | 0.63 ± 0.07 | 0.65 ± 0.06 | 0.84 |
| 11,12-DiHETrE | 0.83 ± 0.07 | 0.98 ± 0.08 | 0.15 |
| 14,15-DiHETrE | 1.39 ± 0.12 | 1.82 ± 0.13 | 0.02 |
| 5,6-DiHETrE | 0.79 ± 0.05 | 0.83 ± 0.07 | 0.52 |
| 8,9-DiHETrE | 1.12 ± 0.03 | 1.41 ± 0.07 | < 0.01 |
| LTB3 | 0.38 ± 0.04 | 0.41 ± 0.05 | 0.68 |
| 10,11-EpDPE | 0.36 ± 0.05 | 0.28 ± 0.03 | 0.17 |
| 17-HDoHE | 0.54 ± 0.15 | 0.99 ± 0.19 | 0.08 |
| 19,20-EpDPE | 2.74 ± 0.21 | 2.33 ± 0.22 | 0.20 |
| 7,8-EpDPE | 10.9 ± 1.96 | 8.33 ± 2.09 | 0.38 |
| 6R-LXA4 | 2.87 ± 0.76 | 5.55 ± 2.07 | 0.31 |
| PGD2 | 1.74 ± 0.36 | 2.31 ± 0.92 | 0.91 |
| PGE2 | 0.86 ± 0.04 | 1.10 ± 0.19 | 0.38 |
| 11,12-,15-TriHETrE | 1.09 ± 0.17 | 1.94 ± 0.49 | 0.12 |
| PGD1 | 7.75 ± 1.32 | 10.6 ± 2.62 | 0.68 |
| PGF2a | 0.67 ± 0.23 | 1.14 ± 0.26 | 0.05 |
| 16,17-DiHDPE | 0.49 ± 0.07 | 0.45 ± 0.03 | 0.64 |
| 19,20-DiHDPE | 2.60 ± 0.39 | 2.45 ± 0.20 | 0.74 |
| TXB2 | 0.80 ± 0.41 | 0.58 ± 0.20 | 0.68 |
| 6-keto-PGF1a | 1.72 ± 0.76 | 1.15 ± 0.77 | 0.91 |
Figure 1. LC-MS/MS profiling showed that LA-rich diet changed profiles of eicosanoid metabolites in plasma.
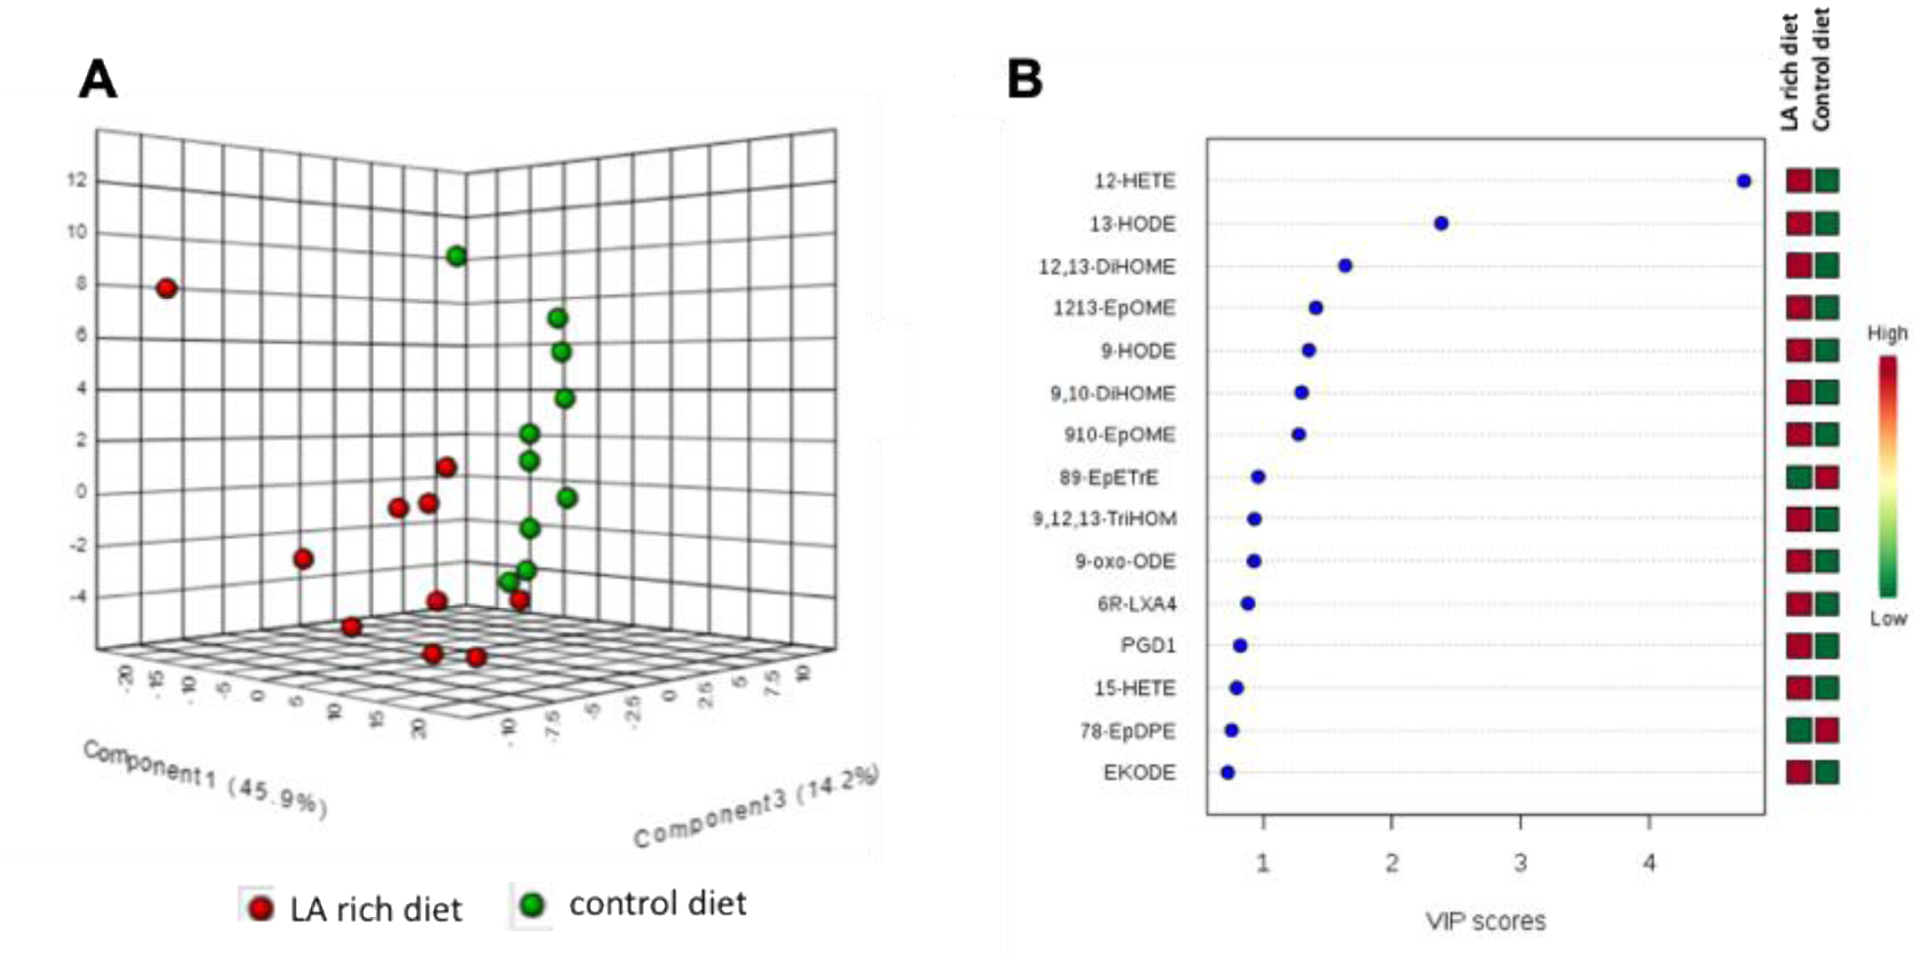
(A) PLS-DA analysis based on the eicosanoids profiles. (B) VIP score analysis which shows the most important metabolites that contribute to the differentiation of control diet versus LA-rich diet. n = 10 mice per group.
LA-rich diet has no effect on colonic inflammation in Il-10−/− mice
We studied the effects of LA-rich diet on body weight, colon length, and colonic inflammation in Il-10−/− mice. Compared with control diet, an 18-week treatment with LA-rich diet had no effect on body weight (Figure 2A) and colon length (Figure 2B). Fecal LCN-2 is a non-invasive and sensitive biomarker of colonic inflammation15,16. ELISA analysis showed that LA-rich diet did not significantly change fecal concentration of LCN-2 (28349.7 ± 4887.4 pg/g in control group versus 42997.8 ± 4984.0 pg/g in LA-rich diet group, Figure 2C), suggesting little effect of the LA-rich diet on colonic inflammation. Furthermore, histology analysis showed that LA-rich diet had little impact on crypt damage of the colon tissue (Figure 2D).
Figure 2. Effects of LA-rich diet on colonic inflammation in Il-10−/− mice.
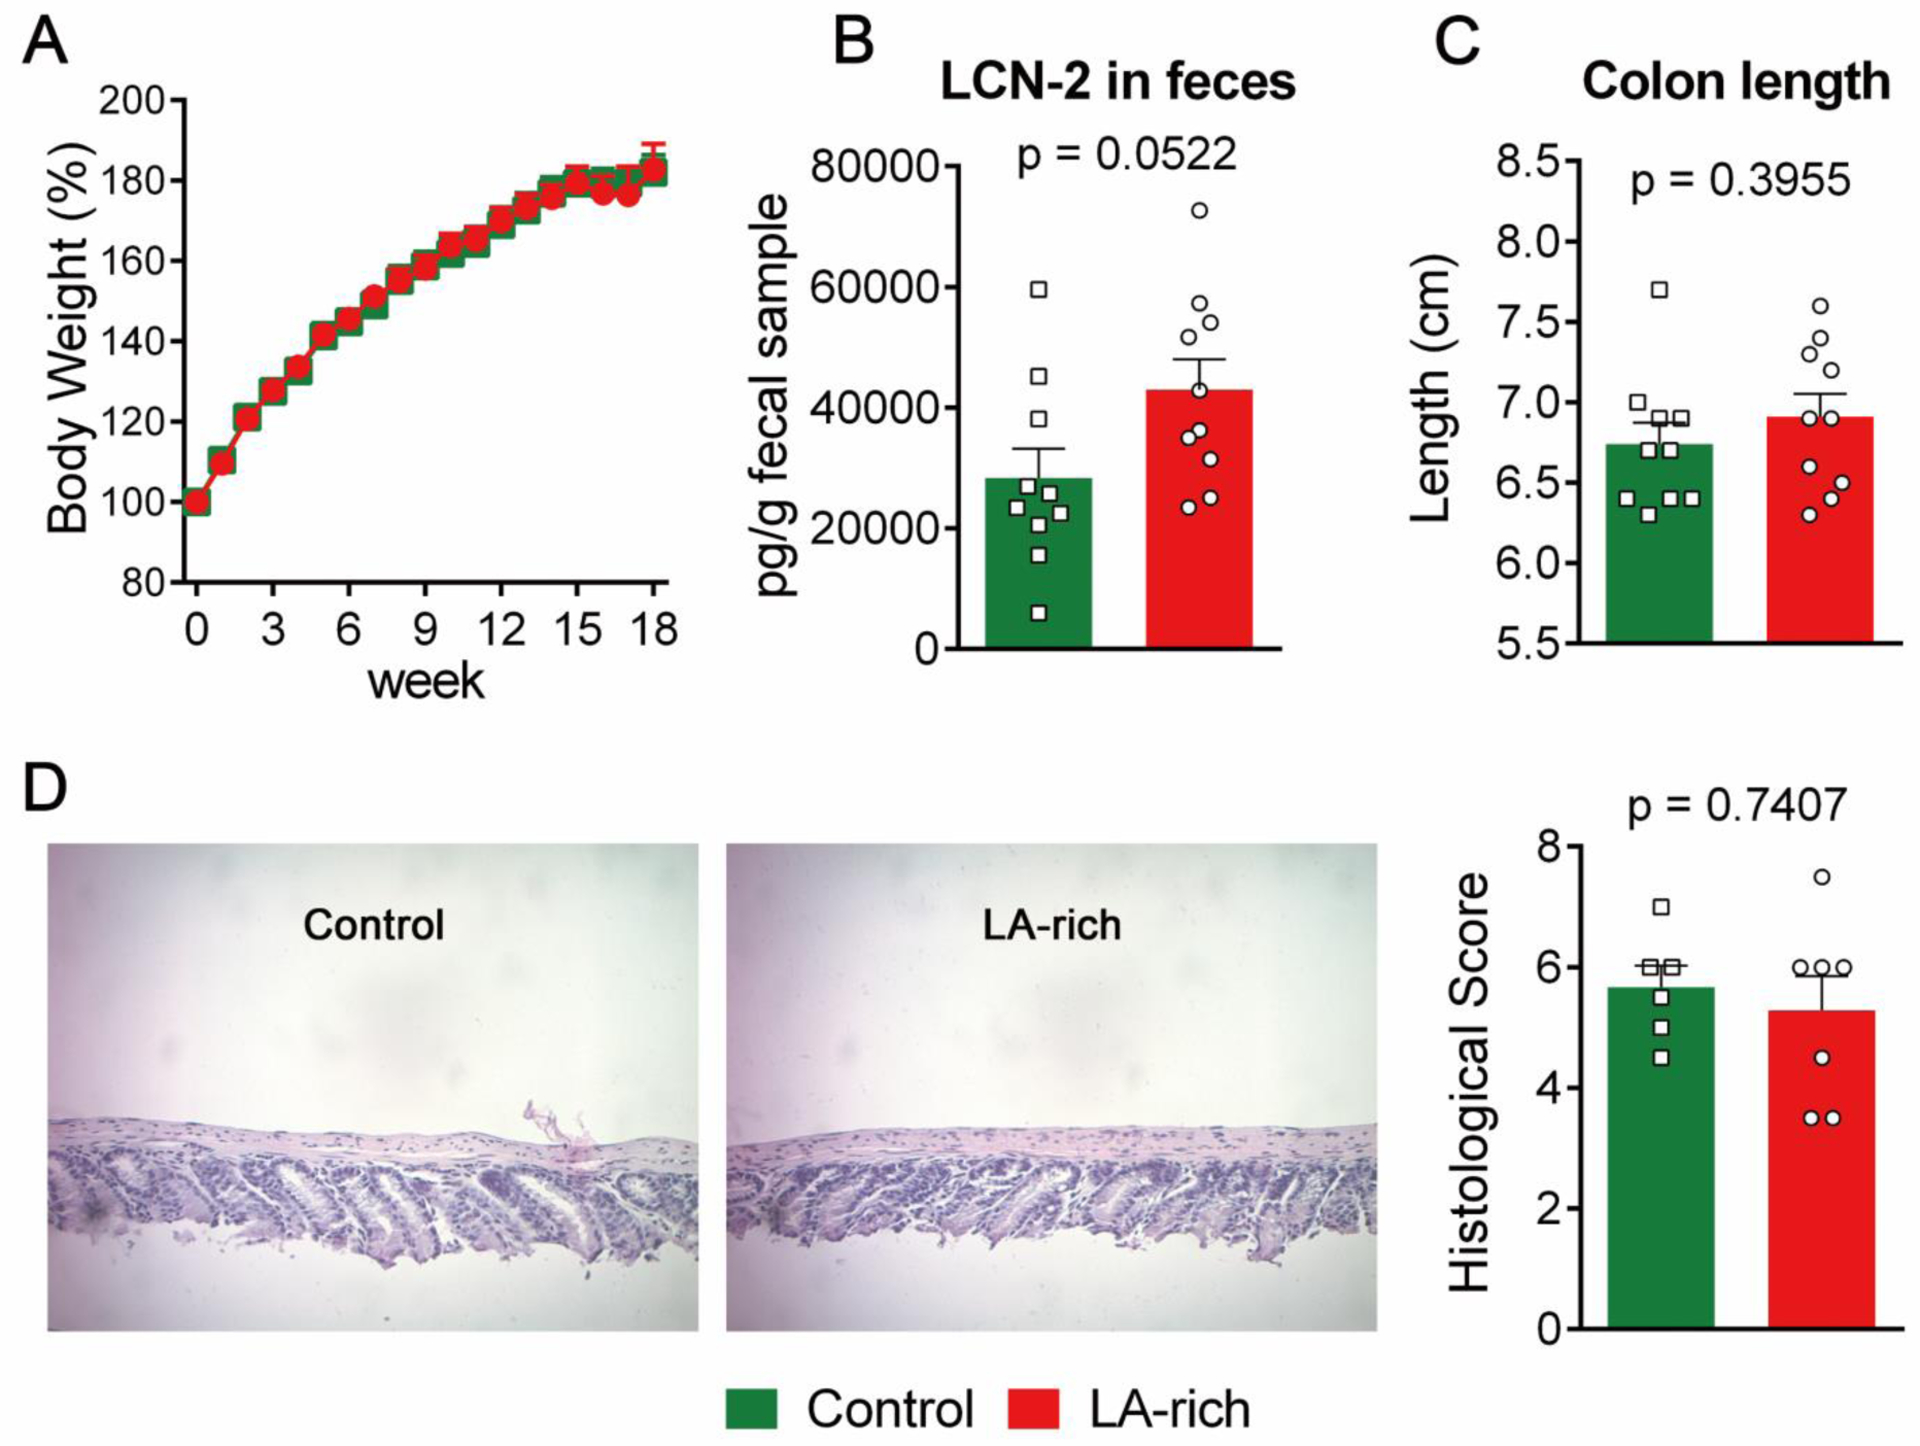
(A) Body weight (n = 10 mice per group), (B) fecal concentration of LCN-2 (n = 10 mice per group), (C) colon length (n = 10 mice per group), and (D) H&E histological analysis, left: representative H&E image, right: quantification of histological analysis (n = 6 mice per group). The data are mean ± SEM.
LA-rich diet has limited effect on gene expression of inflammatory cytokines and tight-junction (TJ) proteins in colon and small intestine
The development of colitis is associated with expression of pro-inflammatory cytokines in the colon, as well as disturbance in gut barrier function and increased gut permeability10. We used qRT-PCR to analyze transcriptional expression of inflammatory cytokines and TJ proteins in the colon and small intestine of the treated Il-10−/− mice. Compared with control diet, treatment with the LA-rich diet had little impact on the expression of a series of pro-inflammatory genes, such as Tnf-α, Ifn-γ, Il-1β, Il-6, and Mcp-1, and TJ genes, including ZO-1, Claudin-1, and Occludin, in the colon (Figure 3). In small intestine, the LA-rich diet increased expression of Il-1β (P = 0.03), while did not significantly alter expression of other cytokines (Figure 4).
Figure 3. Effects of LA-rich diet on gene expression in the colon tissues of Il-10−/− mice.

(A-E) gene expression of inflammatory cytokines. (F-H) gene expression of tight-junction proteins. The data are mean ± SEM, n = 10 mice per group.
Figure 4. Effects of LA-rich diet on gene expression in the small intestine of Il-10−/− mice.
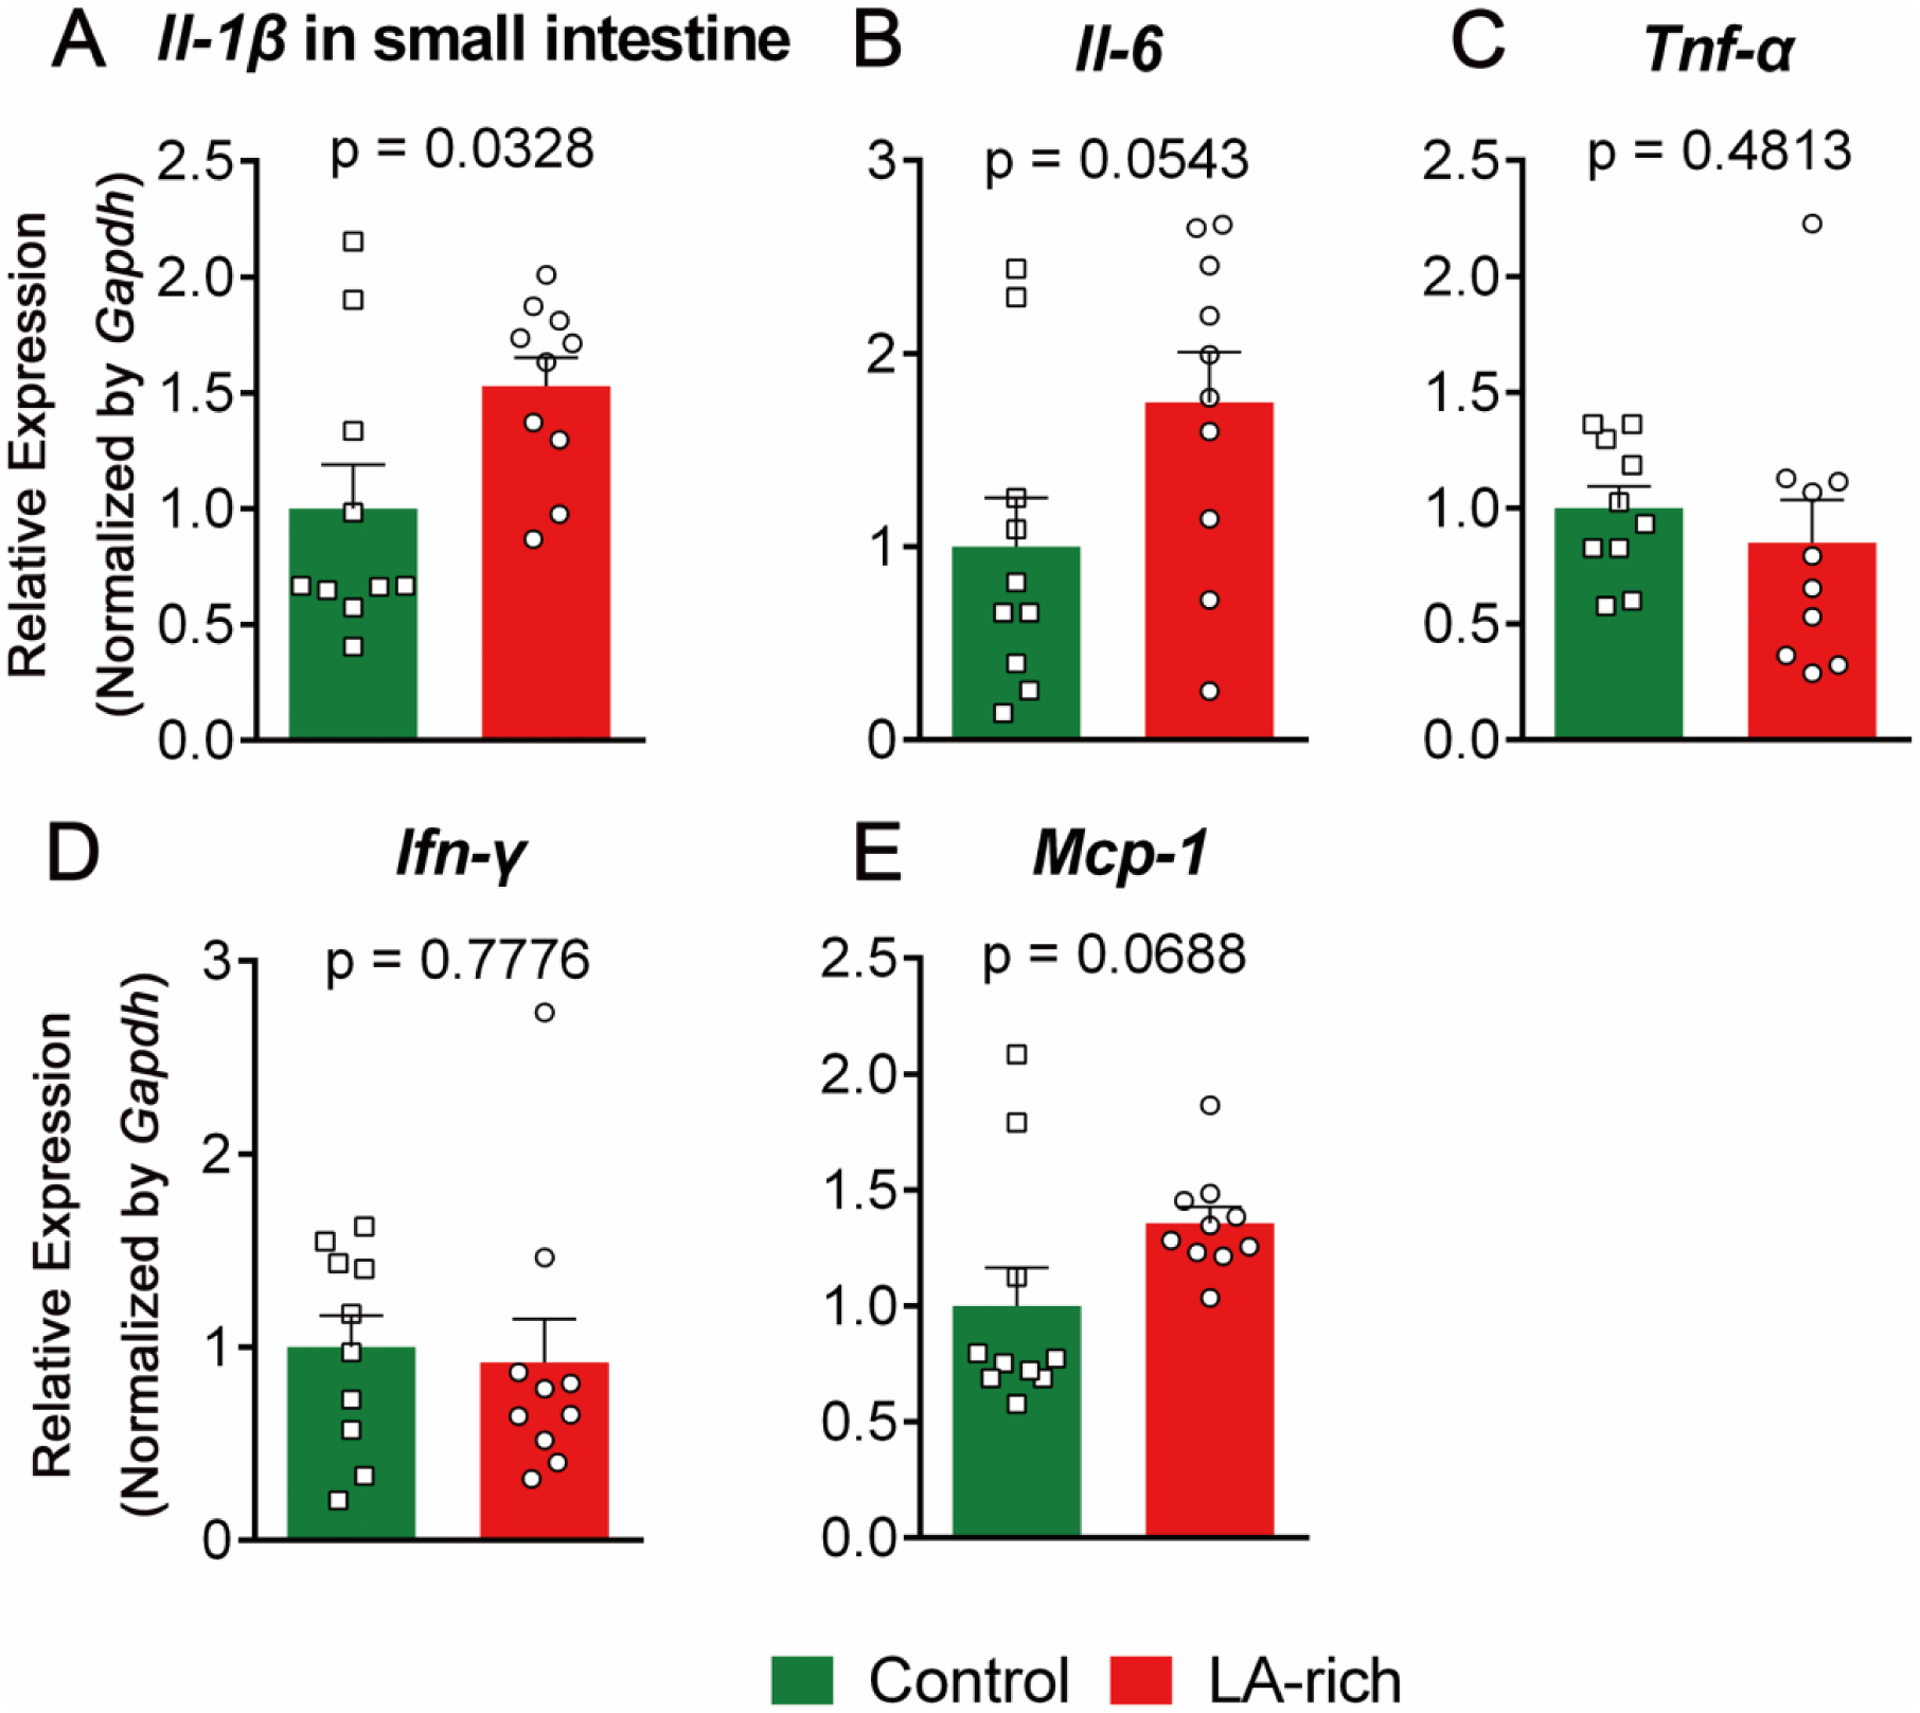
(A-E) gene expression of inflammatory cytokines. The data are mean ± SEM, n = 10 mice per group.
LA-rich diet has no effect on immune cell in colon and small intestine
Immune cells in intestinal tissues play critical roles in the pathogenesis of colitis17. We used FACS to quantify the immune cells into the colon and small intestine. Compared with control diet, treatment with the LA-rich diet had little impact on the levels of immune cells, such as macrophages (F4/80+), M1 macrophages (F4/80+ CD80+), neutrophils (Gr-1+), Th1 T cells (CD4+ T-bet+), and Th17 cells (CD4+ RORγt+), in both the colon (Figure 5, see representative FACS images in Figure S3) and small intestine (Figure 6).
Figure 5. Effects of LA-rich diet on infiltration of immune cells in the colon tissues of Il-10−/− mice.

The data are mean ± SEM, n = 10 mice per group.
Figure 6. Effects of LA-rich diet on infiltration of immune cells in the small intestine of Il-10−/− mice.
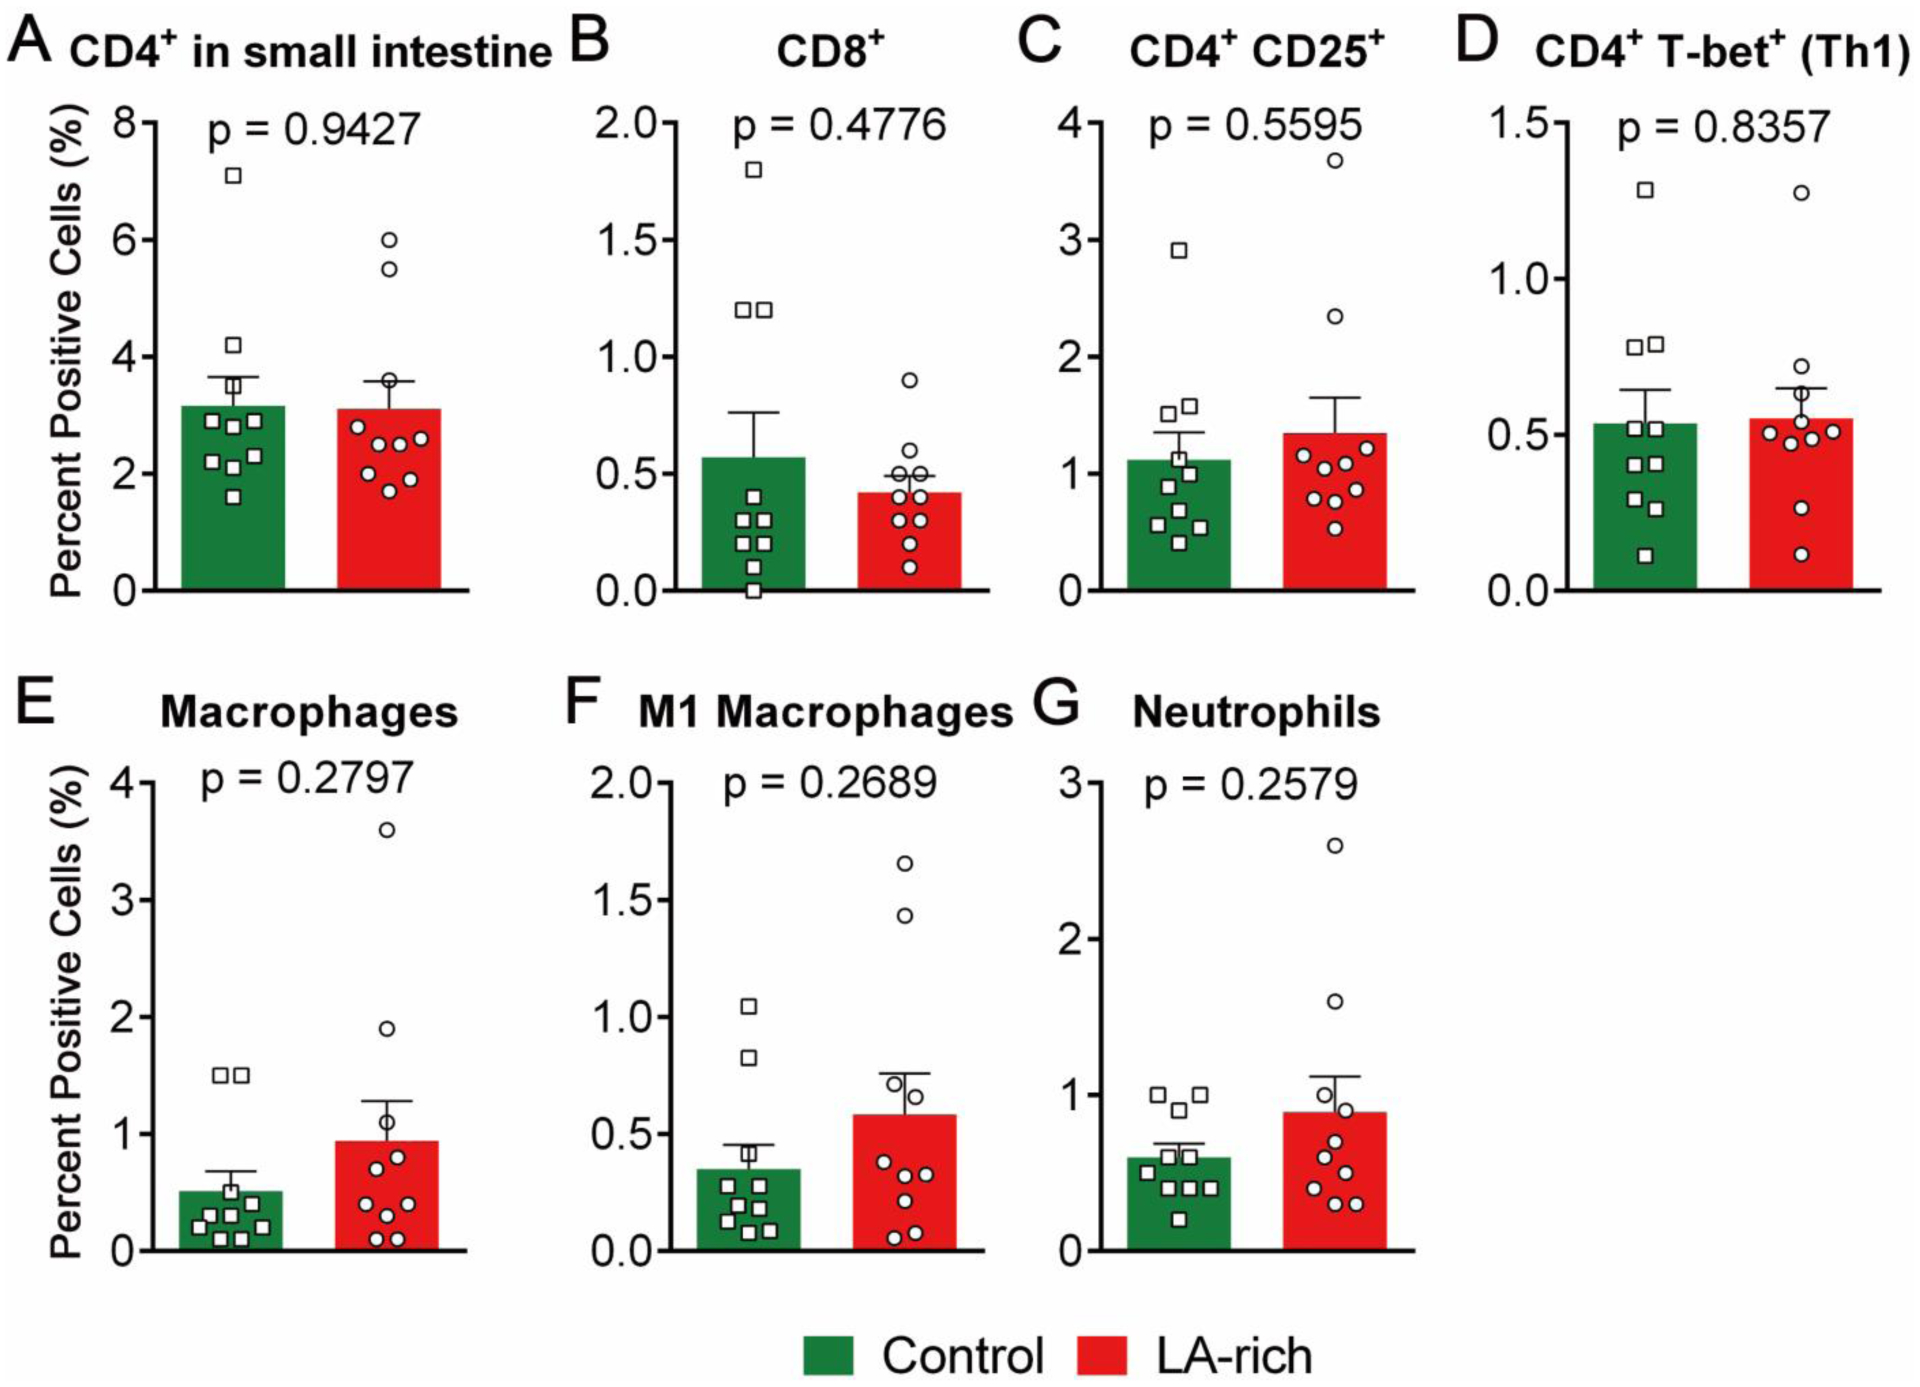
The data are mean ± SEM, n = 10 mice per group.
Discussion
The consumption of dietary LA has risen dramatically in recent decades: the consumption of LA has increased from ~3 Cal% to ~9 Cal% from 1909 to 19991. Human studies support that a high dietary intake of LA is associated with increased risks of developing colitis in humans8. However, it remains unclear whether increased consumption of dietary LA is causally involved in the elevated risks of colitis. To address this question, here we treated spontaneous colitis-prone (Il-10−/−) mice with a control diet (rich in saturated fatty acid, containing 3 Cal% LA) or a LA-rich diet (containing 9 Cal% LA) for 18 weeks. Our central finding is that compared with control diet, dietary administration of a LA-rich diet has little effect on severity of colitis in the Il-10−/− mice, as assessed by a series of assays including colon length, fecal concentration of LCN-2, H&E histology analysis of the colon tissue, qRT-PCR analysis of gene expression of inflammatory cytokines in colon and small intestine, and FACS quantification of immune cell infiltration into colon and small intestine. Together, these results suggest that increased consumption of increased dietary LA has little impact on promoting colitis, at least in the spontaneous Il-10−/− colitis model.
One concern for consumption of LA-rich diet is that LA can increase tissue levels of ARA and ARA-derived metabolites, resulting in increased inflammation and associated diseases. Indeed, LA could be further metabolized to ARA, which is an important precursor for biosynthesis of eicosanoids, such as PGE2 and LTB4, that are predominately pro-inflammatory and pro-tumorigenic3. We used GC-MS and LC-MS/MS to analyze the effects of the LA-rich diet on in vivo profiles of fatty acids and eicosanoids. We found that compared with the control diet, administration of the LA-rich diet increased tissue levels of LA, while had little impacts on other PUFAs (e.g. ARA, EPA, and DHA), in the treated Il-10−/− mice. This is largely in agreement with previous studies, which showed a limited conversion of LA (18:2) to longer-chain PUFA ARA (20:4) in vivo18. In agreement with the GC-MS data, LC-MS/MS showed that the concentrations of most ARA, EPA, DHA-derived eicosanoid metabolites were not significantly changed by the LA-rich diet. For example, the plasma concentrations of PGE2 (an important marker of inflammation) in control diet- versus LA-rich diet-treated mice are 0.86±0.04 nM versus 1.10±0.19 nM (P = 0.22). Overall, our data suggests that administration of a LA-rich diet has limited impact on in vivo levels of ARA and its metabolites.
GC-MS and LC-MS/MS analysis support that administration of LA-rich diet increased tissue levels of LA and plasma concentration of LA-derived metabolites. We found that compared with control diet, the LA-rich diet increased plasma concentrations of 9,10- and 12,13-DiHOME, which are metabolites of LA produced by two enzymatic steps that are catalyzed by cytochrome P450 monooxygenase and soluble epoxide hydrolase (sEH)19. Previous studies have shown that DiHOMEs have potent effects to induce chemotaxis, tissue injury, and cause mortality in animal models20,21. Furthermore, we found that LA-rich diet increased 9-HODE and 13-HODE which are also bioactive LA-derived metabolites22. It is likely that the increased levels of these metabolites did not contribute to the pathogenesis of colitis, at least in our Il-10−/− mouse model. However, the increased concentrations of these bioactive lipid metabolites suggest potential health modulating effects of the LA-rich diet, which requires further studies to better understand.
A limitation of our study is that we used fresh vegetable oils with low oxidative status. We used several strategies to control lipid oxidation in the vegetable oil samples: (i) we purchased fresh, un-opened, vegetable oil from the market, (ii) we used a silicic acid-activated charcoal chromatography to further purify the vegetable oil sample, and this column step removes almost all of the pre-existing oxidized fats in the vegetable oil samples, (iii) we added antioxidants (400 ppm tocopherol) in the purified vegetable oil to suppress oxidation, and (iv) during the animal feeding, we changed the diet every other day to minimize potential lipid oxidation. However, vegetable oil, which contains high levels of LA, is prone to lipid oxidation23. Our recent study showed that compared with a diet containing fresh vegetable oil, a diet containing frying oil, as well as frying oil-derived polar fractions, exaggerated dextran sodium sulfate (DSS)-induced colitis and azoxymethane (AOM)/DSS-induced colon tumorigenesis in mice24. Furthermore, our recent study showed that compared with un-oxidized vegetable oil, oxidized vegetable oil increased DSS- and IL-10-deficiency-induced colitis in mice (unpublished data). These results suggest that oxidized LA could promote colitis and colitis-associated colon cancer. It is feasible that oxidized vegetable oil could have different effects on colitis compared with fresh, un-oxidized, vegetable oil. The EPIC study showed that a high dietary intake of LA increases risks of developing colitis8, and this effect could be induced by consumption of oxidized LA, which is a common component in our diet.
In summary, our results showed that compared with control diet (rich in saturated fatty acid, containing 3 Cal% LA), an 18-week administration of LA-rich diet (containing 9 Cal% LA) increased tissue levels of LA, modulated plasma profiles of eicosanoid metabolites with increased concentrations of LA-derived metabolites, while had little impact on development of colitis in the Il-10−/− mice. Further studies are needed to compare the effects of oxidized versus un-oxidized LA on colitis and associated inflammatory diseases.
Supplementary Material
Acknowledgement
This research is supported by United States Department of Agriculture (USDA) Agriculture and Food Research Initiative (AFRI) Competitive Grant 2019-67017-29248 and 2016-67017-24423, and USDA Hatch grant MAS00556 and MAS00492, NIH/NCI R03CA218520 and R03CA237795 (to G.Z.), and NIH/NIEHS grant R35 ES030443 and NIEHS Superfund Research Program P42 ES004699 (to B.D.H.). We would like to thank the Flow Cytometry Core Facility of the University of Massachusetts Amherst for FACS analysis.
References
- 1.Blasbalg T, Hibbeln J, Ramsden C, Majchrzak S & Rawlings R Changes in consumption of omega-3 and omega-6 fatty acids in the United States during the 20th century. Am J Clin Nutr 93, 950–962 (2011). [DOI] [PMC free article] [PubMed] [Google Scholar]
- 2.Jandacek RJ Linoleic Acid: A Nutritional Quandary. Healthcare (Basel) 5(2017). [DOI] [PMC free article] [PubMed] [Google Scholar]
- 3.Greene ER, Huang S, Serhan CN & Panigrahy D Regulation of inflammation in cancer by eicosanoids. Prostaglandins Other Lipid Mediat 96, 27–36 (2011). [DOI] [PMC free article] [PubMed] [Google Scholar]
- 4.Enos RT, et al. High-fat diets rich in saturated fat protect against azoxymethane/dextran sulfate sodium-induced colon cancer. Am J Physiol Gastrointest Liver Physiol 310, G906–919 (2016). [DOI] [PMC free article] [PubMed] [Google Scholar]
- 5.Wu B, et al. Dietary corn oil promotes colon cancer by inhibiting mitochondria-dependent apoptosis in azoxymethane-treated rats. Exp Biol Med (Maywood) 229, 1017–1025 (2004). [DOI] [PubMed] [Google Scholar]
- 6.Fujise T, et al. Long-term feeding of various fat diets modulates azoxymethane-induced colon carcinogenesis through Wnt/beta-catenin signaling in rats. Am J Physiol Gastrointest Liver Physiol 292, G1150–1156 (2007). [DOI] [PubMed] [Google Scholar]
- 7.Reddy BS, Tanaka T & Simi B Effect of different levels of dietary trans fat or corn oil on azoxymethane-induced colon carcinogenesis in F344 rats. J Natl Cancer Inst 75, 791–798 (1985). [PubMed] [Google Scholar]
- 8.Tjonneland A, et al. Linoleic acid, a dietary n-6 polyunsaturated fatty acid, and the aetiology of ulcerative colitis: a nested case-control study within a European prospective cohort study. Gut 58, 1606–1611 (2009). [DOI] [PubMed] [Google Scholar]
- 9.Xie M, et al. Triclocarban exposure exaggerates spontaneous colonic inflammation in Il-10−/− mice. Toxicol Sci (2019). [DOI] [PubMed] [Google Scholar]
- 10.Berg DJ, et al. Enterocolitis and colon cancer in interleukin-10-deficient mice are associated with aberrant cytokine production and CD4(+) TH1-like responses. J Clin Invest 98, 1010–1020 (1996). [DOI] [PMC free article] [PubMed] [Google Scholar]
- 11.Kozlowski C, et al. An entirely automated method to score DSS-induced colitis in mice by digital image analysis of pathology slides. Dis Model Mech 6, 855–865 (2013). [DOI] [PMC free article] [PubMed] [Google Scholar]
- 12.Folch J, Lees M & Sloane-Stanley G A simple method for the isolation and purification of total lipids from animal tissues. J biol Chem 226, 497–509 (1957). [PubMed] [Google Scholar]
- 13.Wang W, et al. Lipidomic profiling reveals soluble epoxide hydrolase as a therapeutic target of obesity-induced colonic inflammation. Proc Natl Acad Sci U S A 115, 5283–5288 (2018). [DOI] [PMC free article] [PubMed] [Google Scholar]
- 14.Yang J, Schmelzer K, Georgi K & Hammock BD Quantitative profiling method for oxylipin metabolome by liquid chromatography electrospray ionization tandem mass spectrometry. Anal Chem 81, 8085–8093 (2009). [DOI] [PMC free article] [PubMed] [Google Scholar]
- 15.Chassaing B, et al. Fecal Lipocalin 2, a Sensitive and Broadly Dynamic Non-Invasive Biomarker for Intestinal Inflammation. PLOS ONE 7, e44328 (2012). [DOI] [PMC free article] [PubMed] [Google Scholar]
- 16.Chassaing B, et al. Dietary emulsifiers impact the mouse gut microbiota promoting colitis and metabolic syndrome. Nature 519, 92–96 (2015). [DOI] [PMC free article] [PubMed] [Google Scholar]
- 17.Grivennikov SI, Greten FR & Karin M Immunity, Inflammation, and Cancer. Cell 140, 883–899. [DOI] [PMC free article] [PubMed] [Google Scholar]
- 18.Rett BS & Whelan J Increasing dietary linoleic acid does not increase tissue arachidonic acid content in adults consuming Western-type diets: a systematic review. Nutrition & metabolism 8, 36–36 (2011). [DOI] [PMC free article] [PubMed] [Google Scholar]
- 19.Zhang G, Kodani S & Hammock BD Stabilized epoxygenated fatty acids regulate inflammation, pain, angiogenesis and cancer. Prog Lipid Res 53, 108–123 (2014). [DOI] [PMC free article] [PubMed] [Google Scholar]
- 20.Moghaddam MF, et al. Bioactivation of leukotoxins to their toxic diols by epoxide hydrolase. Nat Med 3, 562–566 (1997). [DOI] [PMC free article] [PubMed] [Google Scholar]
- 21.Zheng J, Plopper CG, Lakritz J, Storms DH & Hammock BD Leukotoxin-diol: a putative toxic mediator involved in acute respiratory distress syndrome. Am J Respir Cell Mol Biol 25, 434–438 (2001). [DOI] [PubMed] [Google Scholar]
- 22.Shureiqi I, et al. The 15-lipoxygenase-1 product 13-S-hydroxyoctadecadienoic acid down-regulates PPAR-delta to induce apoptosis in colorectal cancer cells. Proc Natl Acad Sci U S A 100, 9968–9973 (2003). [DOI] [PMC free article] [PubMed] [Google Scholar]
- 23.Vieira SA, Zhang G & Decker EA Biological Implications of Lipid Oxidation Products. Journal of the American Oil Chemists’ Society, 1–13 (2017). [Google Scholar]
- 24.Zhang J, et al. Thermally Processed Oil Exaggerates Colonic Inflammation and Colitis-Associated Colon Tumorigenesis in Mice. Cancer Prev Res (Phila) 12, 741–750 (2019). [DOI] [PubMed] [Google Scholar]
Associated Data
This section collects any data citations, data availability statements, or supplementary materials included in this article.