

Abstract
The blood system is often represented as a tree-like structure with stem cells that give rise to mature blood cell types through a series of demarcated steps. Although this representation has served as a model of hierarchical tissue organization for decades, single-cell technologies are shedding new light on the abundance of cell type intermediates and the molecular mechanisms that ensure balanced replenishment of differentiated cells. In this Brief Review, we exemplify new insights into blood cell differentiation generated by single-cell RNA sequencing, summarize considerations for the application of this technology, and highlight innovations that are leading the way to understand hematopoiesis at the resolution of single cells.
Keywords: blood cells, computational biology, hematopoiesis, stem cells, technology
Highlights.
The hematopoietic hierarchy is being redrawn by single-cell sequencing.
Technological developments have made single-cell assays widely available.
Computational analysis is often rate limiting to generate new biological insight.
Please see www.ahajournals.org/atvb/atvb-focus for all articles published in this series.
Revision of the Hematopoietic Hierarchy
The blood system has long served as a model for hierarchical tissue organization. In 1909, the idea was introduced that a common stem cell could generate all blood cell types.1 In the 1960s, irradiation of mouse bone marrow cells was used to introduce unique chromosomal markers, followed by transplantation and clonal analysis of spleen colony-forming units. These experimental advances enabled the identification of progenitor cells with the capacity for limited self-renewal, proliferation, and differentiation into multiple lineages.2 Over the next decades, refinement of assays and the introduction of technologies such as flow cytometry delineated how hematopoietic stem cells undergo a series of differentiation steps to give rise to mature cell types of the megakaryocyte/erythroid, myeloid, and lymphoid lineages (Figure [A]). A limited number of phenotypically defined cell types with predictable lineage potential were considered to represent relatively homogeneous molecular states.3,4 This orderly model allowed increasingly detailed descriptions of the factors that regulate hematopoietic differentiation.
Figure.
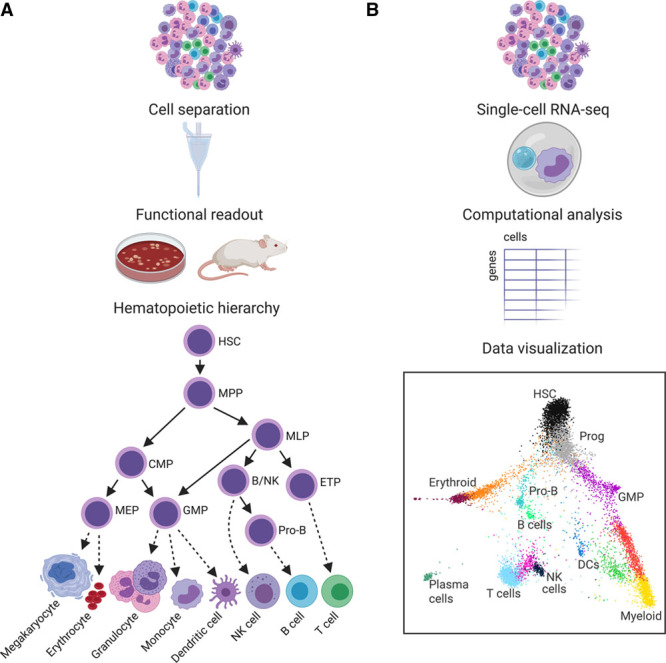
Different approaches to describe the hematopoietic hierarchy. A, Hematopoietic cell types can be separated, for example, using flow cytometry to sort based on surface markers. In vitro differentiation and transplantation inform the lineage potential of single cells or sorted populations. These assays played a major role in establishing the hierarchical relationships between cell types. B, Molecular characterization of individual cells provides an additional method to study cellular heterogeneity. Computational analysis of these datasets indicates that cell types are more heterogeneous and that differentiation trajectories are more gradual than appreciated previously. B/NK indicates B/natural killer cell progenitor; CMP, common myeloid progenitor; DC, dendritic cell; ETP, early T-cell progenitor; GMP, granulocyte/macrophage progenitor; HSC, hematopoietic stem cell; MEP, megakaryocyte/erythroid progenitor; MLP, multilymphoid progenitor; MPP, multipotent progenitor; Prog, progenitor; RNA-seq, RNA sequencing. A, Hierarchy derived from Doulatov et al.4 B, K nearest neighbor graph derived from van Galen et al.47
Over the past decade, single-cell technologies such as single-cell RNA sequencing (scRNA-seq) have developed at a fast pace.5 The blood is an attractive system to study because it is readily available as a single-cell suspension and because there are well-established molecular markers and functionally validated cell types. Considering all this prior knowledge, it may come as a surprise that scRNA-seq is significantly revising our fundamental understanding of the blood system. Rather than an orderly hierarchy of a defined set of cell types, scRNA-seq studies consistently recover more continuous differentiation trajectories (Figure [B]).6–8 It is important to keep in mind that these 2-dimensional representations are the result of measuring thousands of genes, representing a multitude of regulatory processes. Although the reduction of all these processes to a few dimensions results in a continuous trajectory, not all individual regulatory mechanisms are marked by gradual change.9,10 For example, some cell states can be resolved by a molecular switch, like Irf8 and Gfi1 that compete in a bipotential state to direct myeloid fate decisions.11 Other consequential decision points are irreversible, such as enucleation during erythroid differentiation or DNA recombination during B- and T-cell differentiation. Considering such variety in processes that control cellular differentiation, the gradual commitment trajectories detected by scRNA-seq should be viewed as a compendium of molecular mechanisms that each contribute to cell state changes in unique ways.
Increasingly, single-cell analysis is not used in isolation but as a complementary tool. Its combination with orthogonal models and assays often reveals previously unappreciated complexity in the maintenance of immune cell homeostasis.12 One example is that lineage differentiation does not just consist of branching points that lead to further diversification. In fact, separate differentiation trajectories can converge to replenish similar mature cell types, as shown in the myeloid lineage.13–15 A second example is a deeper understanding of progenitor cells. Single-cell analyses of classically defined megakaryocyte-erythroid progenitors showed that this population contains bipotent and unipotent progenitors and that cell fate is regulated by cell cycle duration, reminiscent of myeloid-lymphoid fate choices.16–19 In addition to the stepwise differentiation through megakaryocyte-erythrocyte progenitor stages, single-cell analyses have strengthened evidence that megakaryocytes can also branch directly from stem cells.20–23 A third area where single-cell analyses will have high impact is the deconvolution of macrophages. These cells can originate from embryonic precursors or from adult bone marrow stem cells and reside in various tissues with concomitant environmental interactions. scRNA-seq has been used to characterize macrophages from the aorta, adipose tissue, liver, kidney, and airways.24–29 With integrative studies, a more complete picture of macrophage biology will start to emerge.30 A refined understanding of differentiation trajectories and cellular heterogeneity will inform strategies to modulate specific cell states in health and disease.
Technological Innovations
A large variety of scRNA-seq technologies have been developed that differ in critical ways. First, plate-based methods in which cells are separated by flow cytometry before processing include MARS-Seq, CEL-Seq, and Smart-Seq.31–33 The high sensitivity and full-length coverage of current plate-based methods enable robust detection of genes with low expression levels, splice variants, and allele-specific expression. Second, high-throughput droplet- or nanowell-based approaches have enabled thousands of cells to be analyzed in a single experiment. Drop-Seq and InDrop capture cells and barcoded beads in droplets, which allows for the generation of barcoded cDNA for thousands of cells in a single tube.34,35 Using similar chemistry but without droplets, Seq-Well captures cells and beads into nanowells on 90 000-well plates that are handled without specialized equipment.36 In the commercial space, 10× Genomics provides a popular platform that has made droplet-based scRNA-seq accessible to the wider research community.37 These methods yield 3′-biased reads and fewer transcripts per cell compared with plate-based methods, although recent improvements have increased the sensitivity.38 The analysis of large cell numbers is advantageous for complex tissues and identification of rare populations. Third, combinatorial indexing provides another approach to high-throughput scRNA-seq.39 This split-pool barcoding strategy has been applied to whole organisms due to its advantages in terms of throughput, cost, and broad cell type compatibility. Since extracted nuclei are used as a starting material, single-cell combinatorial-indexing RNA-seq (sci-RNA-seq3) is less sensitive to differences in cell size, stickiness, and mechanical sensitivity and only captures nuclear mRNAs. With this variety of available technologies and the use of carefully considered experimental designs,40–42 scRNA-seq can be applied to a range of biological questions.
An area of development is simultaneous acquisition of several layers of information (modalities) from the same single cell. First, simultaneous mRNA and protein capture can resolve situations where transcript levels do not correlate with protein levels. Plate-based scRNA-seq methods allow for the quantification of proteins using indexed sorting, but droplet methods cannot be combined with flow cytometry. To enable high-throughput scRNA-seq with detection of protein levels, CITE-seq uses oligonucleotide-labeled antibodies.43 This approach was used to describe cellular heterogeneity in mixed-phenotype acute leukemia,44 and commercial kits are currently available. Second, to combine RNA-seq with the detection of genetic variants such as somatic mutations, specific sites can be enriched with high sensitivity using TARGET-seq (compatible with Smart-Seq) or with high throughput using Genotyping of Transcriptomes (compatible with 10×). These approaches have been primarily applied to link leukemia-associated mutations to gene expression changes.45–48 Third, several strategies have been developed to combine RNA-seq with lineage tracing, which provides insight into clonal relationships between cells. Applications range from tracking stem cell progeny during native hematopoiesis to identifying clones that develop resistance to cancer therapy.49–52 Additional developments include combined RNA-seq and ATAC-seq (assay for transposase-accessible chromatin using sequencing),53–56 RNA-seq with tissue localization,57,58 and single-cell DNA-sequencing combined with surface protein expression.59 While this list is by no means exhaustive, it demonstrates that the field is rapidly moving toward multiomic strategies to comprehensively map tissue heterogeneity.
Computational Challenges
Typically, analysis of a single sample yields hundreds to thousands of cells with thousands of sequencing reads per cell. An initial goal of the analysis is to detect what genes were expressed in every individual cell (Figure [B]). This requires a number of computational steps, including demultiplexing of reads, alignment to a reference genome, and grouping reads by cell barcodes. Fortunately, several software tools are available to facilitate these procedures, such as zUMIs, Alevin, and 10× CellRanger.60,61 These programs allow bioinformaticians to generate a count matrix containing the number of transcripts that were detected per gene in each cell.
After the generation of a count matrix, the greatest challenge is to interpret the data in a biologically meaningful way. The following procedures will start to acquaint the user with the data. High-quality cells can be selected on the basis of a minimum number of detected transcripts (ranging from 200 to 5000) and a maximum fraction of mitochondrial transcripts, which correlates with cell death. Additional strategies to clean up the data include subtraction of contaminating transcripts62,63 and the removal of doublets or multiple cells that were captured together. To remove doublets, agreement between tools such as DoubletDecon, DoubletFinder, and Scrublet can prevent the erroneous classification of doublets as a new rare cell type.64–66 The next steps will start to reveal structure in gene expression profiles. Transcript counts are normalized to a total of 10 000 per cell, and the data are log-transformed. To simplify the analysis, only genes with high variability between cells are selected. To reduce the noise associated with each individual gene, linear dimension reduction by principal component analysis identifies sets of correlated genes that are the primary source of heterogeneity in the data. At this point, datasets from different technologies or donors can be combined to minimize technical differences and facilitate the identification of biological differences between samples. Various approaches are available, including Harmony, Seurat integration, and batch-balanced k nearest neighbors.67–70 Next, nonlinear dimensionality reduction generates a 2-dimensional representation of the data, wherein transcriptionally similar cells are placed close together (Figure [B]). This step is often performed by generating a k nearest neighbor graph, t-SNE (t-distributed stochastic neighbor embedding), or UMAP (uniform manifold approximation and projection).71,72 Effectively, the expression of thousands of genes has now been reduced to x and y coordinates. This intuitive visualization enables superimposition of gene expression or other cell-specific features, which is helpful to begin to interpret the data. All the steps in this section are facilitated by freely available software packages such as Seurat, Scanpy, Monocle, or CellHarmony.39,69,73,74 Still, these analyses require expertise in R and Python programming languages, biological insight, dedication, and time. In combination with deeper analyses and orthogonal validation, biological meaning can now start to be uncovered.
Clustering cells is required for many downstream analyses, such as differential gene expression analysis between cell types, developmental stages, or perturbations. The goal of clustering is to group cells with similar gene expression patterns and inferred similar functional properties together.75 The aforementioned packages include clustering algorithms, such as optimized graph-based methods to partition cells into interconnected communities.76 The annotation of clusters can be fairly straightforward for distinct cell types that express canonical markers such as T cells and B cells or challenging for similar cell types such as progenitor or T-cell subsets. The automation of cluster annotation could substantially facilitate data analysis, but a comprehensive and widely accepted cell type atlas to use as a reference is currently lacking for most tissues.77 When a reference dataset is available, automated cell type annotation can reveal gene expression differences between normal and perturbed tissues that are not compromised by developmental state heterogeneity or contaminating cell types. For example, (1) in acute myeloid leukemia patient samples, we used a Random Forest algorithm to classify malignant cell states by their similarity to annotated cell types from healthy donors,47 (2) in pluripotent stem cell–derived cultures, Artificial Neural Networks identified hematopoietic stem cell–like cells similar to human fetal liver hematopoietic stem cells,78 and (3) using a community clustering strategy, alignment of Gfi1 mutant cells to wild-type controls showed that Gfi1-target genes are altered sequentially, as cells traverse successive differentiation states.79 Analytical innovations such as cellular trajectory analysis and inference of dynamic information using splice variants (RNA velocity) continue to expand the scope of single-cell genomics.80,81 Ultimately, it is up to the researcher analyzing the data to apply these tools appropriately and to develop creative approaches to derive new insights.
Outlook
Single-cell genomics opens up avenues to study complex tissues and to discover molecular mechanisms at a new level of resolution. Using these technologies, we learned that blood cell types are more diverse than previously appreciated and that differentiation is best represented as a continuous trajectory rather than discrete steps. Single-cell analysis has been used to identify rare cell types in heterogeneous populations, such as hematopoietic stem cell–like cells in pluripotent stem cell–derived cultures. It also enables comparisons between control and perturbed cells across stages of differentiation. For example, single-cell sequencing has been used to study deregulation in malignant cell types compared with healthy controls without being obscured by cell type heterogeneity. Extensive efforts in technology development have resulted in robust scRNA-seq protocols that are accessible for widespread adoption, whereas multiomic strategies like combined DNA and RNA analysis are at the leading edge. Computational tools allow us to structure the data and generate intuitive visualizations. Creative data analysis is generally the greatest challenge and essential to derive biological insight. Software packages that perform complex tasks like dimensionality reduction and clustering are making computational analysis more accessible. Further standardization of procedures such as cell type annotation is imminent. Together with initiatives like the Human Cell Atlas, these innovations will accelerate our progress toward a comprehensive understanding of biological systems.
Acknowledgments
We thank A. Kreso for critical feedback. Figures were created with biorender.com.
Sources of Funding
P. van Galen is supported by the National Institutes of Health, National Cancer Institute (R00CA218832), the Ludwig Center at Harvard, the Harvard Medical School Epigenetics and Gene Dynamics Initiative, the Glenn Foundation for Medical Research and American Federation for Aging Research, the Leukemia & Lymphoma Society, and by Gilead Sciences as a Research Scholar in Hematology/Oncology.
Disclosures
None.
Footnotes
Nonstandard Abbreviations and Acronyms
- ATAC-seq
- assay for transposase-accessible chromatin using sequencing
- t-SNE
- t-distributed stochastic neighbor embedding
- UMAP
- uniform manifold approximation and projection
For Sources of Funding and Disclosures, see page 1016.
References
- 1.Maximow AA. Der lymphozyt als gemeinsame stammzelle der verschiedenen blutelement in der embryonalen entwicklung und im postfetalen leben der säugetiere. Folia Haematologica. 1909;VIII:125–134. [Google Scholar]
- 2.Wu AM, Till JE, Siminovitch L, McCulloch EA. A cytological study of the capacity for differentiation of normal hemopoietic colony-forming cells. J Cell Physiol. 1967;69:177–184. doi: 10.1002/jcp.1040690208 [DOI] [PubMed] [Google Scholar]
- 3.Weissman IL, Anderson DJ, Gage F. Stem and progenitor cells: origins, phenotypes, lineage commitments, and transdifferentiations. Annu Rev Cell Dev Biol. 2001;17:387–403. doi: 10.1146/annurev.cellbio.17.1.387 [DOI] [PubMed] [Google Scholar]
- 4.Doulatov S, Notta F, Laurenti E, Dick JE. Hematopoiesis: a human perspective. Cell Stem Cell. 2012;10:120–136. doi: 10.1016/j.stem.2012.01.006 [DOI] [PubMed] [Google Scholar]
- 5.Svensson V, Vento-Tormo R, Teichmann SA. Exponential scaling of single-cell RNA-seq in the past decade. Nat Protoc. 2018;13:599–604. doi: 10.1038/nprot.2017.149 [DOI] [PubMed] [Google Scholar]
- 6.Velten L, Haas SF, Raffel S, Blaszkiewicz S, Islam S, Hennig BP, Hirche C, Lutz C, Buss EC, Nowak D, et al. Human haematopoietic stem cell lineage commitment is a continuous process. Nat Cell Biol. 2017;19:271–281. doi: 10.1038/ncb3493 [DOI] [PMC free article] [PubMed] [Google Scholar]
- 7.Karamitros D, Stoilova B, Aboukhalil Z, Hamey F, Reinisch A, Samitsch M, Quek L, Otto G, Repapi E, Doondeea J, et al. Single-cell analysis reveals the continuum of human lympho-myeloid progenitor cells. Nat Immunol. 2018;19:85–97. doi: 10.1038/s41590-017-0001-2 [DOI] [PMC free article] [PubMed] [Google Scholar]
- 8.Laurenti E, Göttgens B. From haematopoietic stem cells to complex differentiation landscapes. Nature. 2018;553:418–426. doi: 10.1038/nature25022 [DOI] [PMC free article] [PubMed] [Google Scholar]
- 9.Weinreb C, Wolock S, Tusi BK, Socolovsky M, Klein AM. Fundamental limits on dynamic inference from single-cell snapshots. Proc Natl Acad Sci USA. 2018;115:E2467–E2476. doi: 10.1073/pnas.1714723115 [DOI] [PMC free article] [PubMed] [Google Scholar]
- 10.Liggett LA, Sankaran VG. Unraveling hematopoiesis through the lens of genomics. Cell. 2020;182:1384–1400. doi: 10.1016/j.cell.2020.08.030 [DOI] [PMC free article] [PubMed] [Google Scholar]
- 11.Olsson A, Venkatasubramanian M, Chaudhri VK, Aronow BJ, Salomonis N, Singh H, Grimes HL. Single-cell analysis of mixed-lineage states leading to a binary cell fate choice. Nature. 2016;537:698–702. doi: 10.1038/nature19348 [DOI] [PMC free article] [PubMed] [Google Scholar]
- 12.Giladi A, Amit I. Single-cell genomics: a stepping stone for future immunology discoveries. Cell. 2018;172:14–21. doi: 10.1016/j.cell.2017.11.011 [DOI] [PubMed] [Google Scholar]
- 13.Yáñez A, Coetzee SG, Olsson A, Muench DE, Berman BP, Hazelett DJ, Salomonis N, Grimes HL, Goodridge HS. Granulocyte-monocyte progenitors and monocyte-dendritic cell progenitors independently produce functionally distinct monocytes. Immunity. 2017;47:890–902.e4. doi: 10.1016/j.immuni.2017.10.021 [DOI] [PMC free article] [PubMed] [Google Scholar]
- 14.Drissen R, Thongjuea S, Theilgaard-Mönch K, Nerlov C. Identification of two distinct pathways of human myelopoiesis. Sci Immunol. 2019;4:eaau7148. [DOI] [PubMed] [Google Scholar]
- 15.Weinreb C, Rodriguez-Fraticelli A, Camargo FD, Klein AM. Lineage tracing on transcriptional landscapes links state to fate during differentiation. Science. 2020;367:eaaw3381. [DOI] [PMC free article] [PubMed] [Google Scholar]
- 16.Psaila B, Barkas N, Iskander D, Roy A, Anderson S, Ashley N, Caputo VS, Lichtenberg J, Loaiza S, Bodine DM, et al. Single-cell profiling of human megakaryocyte-erythroid progenitors identifies distinct megakaryocyte and erythroid differentiation pathways. Genome Biol. 2016;17:83 doi: 10.1186/s13059-016-0939-7 [DOI] [PMC free article] [PubMed] [Google Scholar]
- 17.Lu YC, Sanada C, Xavier-Ferrucio J, Wang L, Zhang PX, Grimes HL, Venkatasubramanian M, Chetal K, Aronow B, Salomonis N, et al. The molecular signature of megakaryocyte-erythroid progenitors reveals a role for the cell cycle in fate specification. Cell Rep. 2018;25:3229 doi: 10.1016/j.celrep.2018.11.075 [DOI] [PMC free article] [PubMed] [Google Scholar]
- 18.Kueh HY, Champhekar A, Champhekhar A, Nutt SL, Elowitz MB, Rothenberg EV. Positive feedback between PU.1 and the cell cycle controls myeloid differentiation. Science. 2013;341:670–673. doi: 10.1126/science.1240831 [DOI] [PMC free article] [PubMed] [Google Scholar]
- 19.Davizon-Castillo P, Rowley JW, Rondina MT. Megakaryocyte and platelet transcriptomics for discoveries in human health and disease. Arterioscler Thromb Vasc Biol. 2020;40:1432–1440. doi: 10.1161/ATVBAHA.119.313280 [DOI] [PMC free article] [PubMed] [Google Scholar]
- 20.Noetzli LJ, French SL, Machlus KR. New insights into the differentiation of megakaryocytes from hematopoietic progenitors. Arterioscler Thromb Vasc Biol. 2019;39:1288–1300. doi: 10.1161/ATVBAHA.119.312129 [DOI] [PMC free article] [PubMed] [Google Scholar]
- 21.Rodriguez-Fraticelli AE, Wolock SL, Weinreb CS, Panero R, Patel SH, Jankovic M, Sun J, Calogero RA, Klein AM, Camargo FD. Clonal analysis of lineage fate in native haematopoiesis. Nature. 2018;553:212–216. doi: 10.1038/nature25168 [DOI] [PMC free article] [PubMed] [Google Scholar]
- 22.Notta F, Zandi S, Takayama N, Dobson S, Gan OI, Wilson G, Kaufmann KB, McLeod J, Laurenti E, Dunant CF, et al. Distinct routes of lineage development reshape the human blood hierarchy across ontogeny. Science. 2016;351:aab2116 doi: 10.1126/science.aab2116 [DOI] [PMC free article] [PubMed] [Google Scholar]
- 23.Prins D, Park HJ, Watcham S, Li J, Vacca M, Bastos HP, Gerbaulet A, Vidal-Puig A, Göttgens B, Green AR. The stem/progenitor landscape is reshaped in a mouse model of essential thrombocythemia and causes excess megakaryocyte production. Sci Adv. 2020;6:eabd3139. [DOI] [PMC free article] [PubMed] [Google Scholar]
- 24.Cochain C, Vafadarnejad E, Arampatzi P, Pelisek J, Winkels H, Ley K, Wolf D, Saliba AE, Zernecke A. Single-cell RNA-seq reveals the transcriptional landscape and heterogeneity of aortic macrophages in murine atherosclerosis. Circ Res. 2018;122:1661–1674. doi: 10.1161/CIRCRESAHA.117.312509 [DOI] [PubMed] [Google Scholar]
- 25.Li C, Menoret A, Farragher C, Ouyang Z, Bonin C, Holvoet P, Vella AT, Zhou B. Single cell transcriptomics based-MacSpectrum reveals novel macrophage activation signatures in diseases. JCI insight. 2019;5:e126453. [DOI] [PMC free article] [PubMed] [Google Scholar]
- 26.MacParland SA, Liu JC, Ma XZ, Innes BT, Bartczak AM, Gage BK, Manuel J, Khuu N, Echeverri J, Linares I, et al. Single cell RNA sequencing of human liver reveals distinct intrahepatic macrophage populations. Nat Commun. 2018;9:4383 doi: 10.1038/s41467-018-06318-7 [DOI] [PMC free article] [PubMed] [Google Scholar]
- 27.Zimmerman KA, Bentley MR, Lever JM, Li Z, Crossman DK, Song CJ, Liu S, Crowley MR, George JF, Mrug M, et al. Single-cell RNA sequencing identifies candidate renal resident macrophage gene expression signatures across species. J Am Soc Nephrol. 2019;30:767–781. doi: 10.1681/ASN.2018090931 [DOI] [PMC free article] [PubMed] [Google Scholar]
- 28.Mould KJ, Jackson ND, Henson PM, Seibold M, Janssen WJ. Single cell RNA sequencing identifies unique inflammatory airspace macrophage subsets. JCI insight. 2019;4:e126556. [DOI] [PMC free article] [PubMed] [Google Scholar]
- 29.Travaglini KJ, Nabhan AN, Penland L, Sinha R, Gillich A, Sit RV, Chang S, Conley SD, Mori Y, Seita J, et al. A molecular cell atlas of the human lung from single-cell RNA sequencing. Nature. 2020;587:619–625. doi: 10.1038/s41586-020-2922-4 [DOI] [PMC free article] [PubMed] [Google Scholar]
- 30.Bian Z, Gong Y, Huang T, Lee CZW, Bian L, Bai Z, Shi H, Zeng Y, Liu C, He J, et al. Deciphering human macrophage development at single-cell resolution. Nature. 2020;582:571–576. doi: 10.1038/s41586-020-2316-7 [DOI] [PubMed] [Google Scholar]
- 31.Hashimshony T, Senderovich N, Avital G, Klochendler A, de Leeuw Y, Anavy L, Gennert D, Li S, Livak KJ, Rozenblatt-Rosen O, et al. CEL-Seq2: sensitive highly-multiplexed single-cell RNA-Seq. Genome Biol. 2016;17:77 doi: 10.1186/s13059-016-0938-8 [DOI] [PMC free article] [PubMed] [Google Scholar]
- 32.Jaitin DA, Kenigsberg E, Keren-Shaul H, Elefant N, Paul F, Zaretsky I, Mildner A, Cohen N, Jung S, Tanay A, et al. Massively parallel single-cell RNA-seq for marker-free decomposition of tissues into cell types. Science. 2014;343:776–779. doi: 10.1126/science.1247651 [DOI] [PMC free article] [PubMed] [Google Scholar]
- 33.Hagemann-Jensen M, Ziegenhain C, Chen P, Ramsköld D, Hendriks GJ, Larsson AJM, Faridani OR, Sandberg R. Single-cell RNA counting at allele and isoform resolution using Smart-seq3. Nat Biotechnol. 2020;38:708–714. doi: 10.1038/s41587-020-0497-0 [DOI] [PubMed] [Google Scholar]
- 34.Macosko EZ, Basu A, Satija R, Nemesh J, Shekhar K, Goldman M, Tirosh I, Bialas AR, Kamitaki N, Martersteck EM, et al. Highly parallel genome-wide expression profiling of individual cells using nanoliter droplets. Cell. 2015;161:1202–1214. doi: 10.1016/j.cell.2015.05.002 [DOI] [PMC free article] [PubMed] [Google Scholar]
- 35.Klein AM, Mazutis L, Akartuna I, Tallapragada N, Veres A, Li V, Peshkin L, Weitz DA, Kirschner MW. Droplet barcoding for single-cell transcriptomics applied to embryonic stem cells. Cell. 2015;161:1187–1201. doi: 10.1016/j.cell.2015.04.044 [DOI] [PMC free article] [PubMed] [Google Scholar]
- 36.Gierahn TM, Wadsworth MH, 2nd, Hughes TK, Bryson BD, Butler A, Satija R, Fortune S, Love JC, Shalek AK. Seq-Well: portable, low-cost RNA sequencing of single cells at high throughput. Nat Methods. 2017;14:395–398. doi: 10.1038/nmeth.4179 [DOI] [PMC free article] [PubMed] [Google Scholar]
- 37.Zheng GX, Terry JM, Belgrader P, Ryvkin P, Bent ZW, Wilson R, Ziraldo SB, Wheeler TD, McDermott GP, Zhu J, et al. Massively parallel digital transcriptional profiling of single cells. Nat Commun. 2017;8:14049 doi: 10.1038/ncomms14049 [DOI] [PMC free article] [PubMed] [Google Scholar]
- 38.Hughes TK, Wadsworth MH, 2nd, Gierahn TM, Do T, Weiss D, Andrade PR, Ma F, de Andrade Silva BJ, Shao S, Tsoi LC, et al. Second-strand synthesis-based massively parallel scRNA-seq reveals cellular states and molecular features of human inflammatory skin pathologies. Immunity. 2020;53:878–894.e7. doi: 10.1016/j.immuni.2020.09.015 [DOI] [PMC free article] [PubMed] [Google Scholar]
- 39.Cao J, Spielmann M, Qiu X, Huang X, Ibrahim DM, Hill AJ, Zhang F, Mundlos S, Christiansen L, Steemers FJ, et al. The single-cell transcriptional landscape of mammalian organogenesis. Nature. 2019;566:496–502. doi: 10.1038/s41586-019-0969-x [DOI] [PMC free article] [PubMed] [Google Scholar]
- 40.Lafzi A, Moutinho C, Picelli S, Heyn H. Tutorial: guidelines for the experimental design of single-cell RNA sequencing studies. Nat Protoc. 2018;13:2742–2757. doi: 10.1038/s41596-018-0073-y [DOI] [PubMed] [Google Scholar]
- 41.Lähnemann D, Köster J, Szczurek E, et al. Eleven grand challenges in single-cell data science. Genome Biol. 2020;21:31. [DOI] [PMC free article] [PubMed] [Google Scholar]
- 42.Ding J, Adiconis X, Simmons SK, Kowalczyk MS, Hession CC, Marjanovic ND, Hughes TK, Wadsworth MH, Burks T, Nguyen LT, et al. Systematic comparison of single-cell and single-nucleus RNA-sequencing methods. Nat Biotechnol. 2020;38:737–746. doi: 10.1038/s41587-020-0465-8 [DOI] [PMC free article] [PubMed] [Google Scholar]
- 43.Stoeckius M, Hafemeister C, Stephenson W, Houck-Loomis B, Chattopadhyay PK, Swerdlow H, Satija R, Smibert P. Simultaneous epitope and transcriptome measurement in single cells. Nat Methods. 2017;14:865–868. doi: 10.1038/nmeth.4380 [DOI] [PMC free article] [PubMed] [Google Scholar]
- 44.Granja JM, Klemm S, McGinnis LM, Kathiria AS, Mezger A, Corces MR, Parks B, Gars E, Liedtke M, Zheng GXY, et al. Single-cell multiomic analysis identifies regulatory programs in mixed-phenotype acute leukemia. Nat Biotechnol. 2019;37:1458–1465. doi: 10.1038/s41587-019-0332-7 [DOI] [PMC free article] [PubMed] [Google Scholar]
- 45.Psaila B, Wang G, Rodriguez-Meira A, Li R, Heuston EF, Murphy L, Yee D, Hitchcock IS, Sousos N, O’Sullivan J, et al. ; NIH Intramural Sequencing Center. Single-cell analyses reveal megakaryocyte-biased hematopoiesis in myelofibrosis and identify mutant clone-specific targets. Mol Cell. 2020;78:477–492.e8. doi: 10.1016/j.molcel.2020.04.008 [DOI] [PMC free article] [PubMed] [Google Scholar]
- 46.Nam AS, Kim KT, Chaligne R, Izzo F, Ang C, Taylor J, Myers RM, Abu-Zeinah G, Brand R, Omans ND, et al. Somatic mutations and cell identity linked by Genotyping of Transcriptomes. Nature. 2019;571:355–360. doi: 10.1038/s41586-019-1367-0 [DOI] [PMC free article] [PubMed] [Google Scholar]
- 47.van Galen P, Hovestadt V, Wadsworth Ii MH, Hughes TK, Griffin GK, Battaglia S, Verga JA, Stephansky J, Pastika TJ, Lombardi Story J, et al. Single-cell RNA-seq reveals AML hierarchies relevant to disease progression and immunity. Cell. 2019;176:1265–1281.e24. doi: 10.1016/j.cell.2019.01.031 [DOI] [PMC free article] [PubMed] [Google Scholar]
- 48.Suvà ML, Tirosh I. Single-cell RNA sequencing in cancer: lessons learned and emerging challenges. Mol Cell. 2019;75:7–12. doi: 10.1016/j.molcel.2019.05.003 [DOI] [PubMed] [Google Scholar]
- 49.Eyler CE, Matsunaga H, Hovestadt V, Vantine SJ, van Galen P, Bernstein BE. Single-cell lineage analysis reveals genetic and epigenetic interplay in glioblastoma drug resistance. Genome Biol. 2020;21:174 doi: 10.1186/s13059-020-02085-1 [DOI] [PMC free article] [PubMed] [Google Scholar]
- 50.Ludwig LS, Lareau CA, Ulirsch JC, Christian E, Muus C, Li LH, Pelka K, Ge W, Oren Y, Brack A, et al. Lineage tracing in humans enabled by mitochondrial mutations and single-cell genomics. Cell. 2019;176:1325–1339.e22. doi: 10.1016/j.cell.2019.01.022 [DOI] [PMC free article] [PubMed] [Google Scholar]
- 51.Wagner DE, Klein AM. Lineage tracing meets single-cell omics: opportunities and challenges. Nat Rev Genet. 2020;21:410–427. doi: 10.1038/s41576-020-0223-2 [DOI] [PMC free article] [PubMed] [Google Scholar]
- 52.Rodriguez-Fraticelli AE, Camargo F. Systems analysis of hematopoiesis using single-cell lineage tracing. Curr Opin Hematol. 2021;28:18–27. doi: 10.1097/MOH.0000000000000624 [DOI] [PubMed] [Google Scholar]
- 53.Zhu C, Yu M, Huang H, Juric I, Abnousi A, Hu R, Lucero J, Behrens MM, Hu M, Ren B. An ultra high-throughput method for single-cell joint analysis of open chromatin and transcriptome. Nat Struct Mol Biol. 2019;26:1063–1070. doi: 10.1038/s41594-019-0323-x [DOI] [PMC free article] [PubMed] [Google Scholar]
- 54.Cao J, Cusanovich DA, Ramani V, Aghamirzaie D, Pliner HA, Hill AJ, Daza RM, McFaline-Figueroa JL, Packer JS, Christiansen L, et al. Joint profiling of chromatin accessibility and gene expression in thousands of single cells. Science. 2018;361:1380–1385. doi: 10.1126/science.aau0730 [DOI] [PMC free article] [PubMed] [Google Scholar]
- 55.Chen S, Lake BB, Zhang K. High-throughput sequencing of the transcriptome and chromatin accessibility in the same cell. Nat Biotechnol. 2019;37:1452–1457. doi: 10.1038/s41587-019-0290-0 [DOI] [PMC free article] [PubMed] [Google Scholar]
- 56.Ma S, Zhang B, LaFave LM, Earl AS, Chiang Z, Hu Y, Ding J, Brack A, Kartha VK, Tay T, et al. Chromatin potential identified by shared single-cell profiling of RNA and chromatin. Cell. 2020;183:1103–1116.e20. doi: 10.1016/j.cell.2020.09.056 [DOI] [PMC free article] [PubMed] [Google Scholar]
- 57.Rodriques SG, Stickels RR, Goeva A, Martin CA, Murray E, Vanderburg CR, Welch J, Chen LM, Chen F, Macosko EZ. Slide-seq: a scalable technology for measuring genome-wide expression at high spatial resolution. Science. 2019;363:1463–1467. doi: 10.1126/science.aaw1219 [DOI] [PMC free article] [PubMed] [Google Scholar]
- 58.Hu KH, Eichorst JP, McGinnis CS, Patterson DM, Chow ED, Kersten K, Jameson SC, Gartner ZJ, Rao AA, Krummel MF. ZipSeq: barcoding for real-time mapping of single cell transcriptomes. Nat Methods. 2020;17:833–843. doi: 10.1038/s41592-020-0880-2 [DOI] [PMC free article] [PubMed] [Google Scholar]
- 59.Miles LA, Bowman RL, Merlinsky TR, Csete IS, Ooi AT, Durruthy-Durruthy R, Bowman M, Famulare C, Patel MA, Mendez P, et al. Single-cell mutation analysis of clonal evolution in myeloid malignancies. Nature. 2020;587:477–482. doi: 10.1038/s41586-020-2864-x [DOI] [PMC free article] [PubMed] [Google Scholar]
- 60.Parekh S, Ziegenhain C, Vieth B, Enard W, Hellmann I. zUMIs - A fast and flexible pipeline to process RNA sequencing data with UMIs. GigaScience. 2018;7:giy059. [DOI] [PMC free article] [PubMed] [Google Scholar]
- 61.Srivastava A, Malik L, Smith T, Sudbery I, Patro R. Alevin efficiently estimates accurate gene abundances from dscRNA-seq data. Genome Biol. 2019;20:65 doi: 10.1186/s13059-019-1670-y [DOI] [PMC free article] [PubMed] [Google Scholar]
- 62.Young MD, Behjati S. SoupX removes ambient RNA contamination from droplet-based single-cell RNA sequencing data. GigaScience. 2020;9:giaa151. [DOI] [PMC free article] [PubMed] [Google Scholar]
- 63.Yang S, Corbett SE, Koga Y, Wang Z, Johnson WE, Yajima M, Campbell JD. Decontamination of ambient RNA in single-cell RNA-seq with DecontX. Genome Biol. 2020;21:57 doi: 10.1186/s13059-020-1950-6 [DOI] [PMC free article] [PubMed] [Google Scholar]
- 64.DePasquale EAK, Schnell DJ, Van Camp PJ, Valiente-Alandí Í, Blaxall BC, Grimes HL, Singh H, Salomonis N. DoubletDecon: deconvoluting doublets from single-cell RNA-sequencing data. Cell Rep. 2019;29:1718–1727.e8. doi: 10.1016/j.celrep.2019.09.082 [DOI] [PMC free article] [PubMed] [Google Scholar]
- 65.McGinnis CS, Murrow LM, Gartner ZJ. DoubletFinder: doublet detection in single-cell RNA sequencing data using artificial nearest neighbors. Cell Syst. 2019;8:329–337.e4. [DOI] [PMC free article] [PubMed] [Google Scholar]
- 66.Wolock SL, Lopez R, Klein AM. Scrublet: computational identification of cell doublets in single-cell transcriptomic data. Cell Syst. 2019;8:281–291.e9. doi: 10.1016/j.cels.2018.11.005 [DOI] [PMC free article] [PubMed] [Google Scholar]
- 67.Korsunsky I, Millard N, Fan J, Slowikowski K, Zhang F, Wei K, Baglaenko Y, Brenner M, Loh PR, Raychaudhuri S. Fast, sensitive and accurate integration of single-cell data with Harmony. Nat Methods. 2019;16:1289–1296. doi: 10.1038/s41592-019-0619-0 [DOI] [PMC free article] [PubMed] [Google Scholar]
- 68.Polański K, Young MD, Miao Z, Meyer KB, Teichmann SA, Park JE. BBKNN: fast batch alignment of single cell transcriptomes. Bioinformatics. 2020;36:964–965. doi: 10.1093/bioinformatics/btz625 [DOI] [PMC free article] [PubMed] [Google Scholar]
- 69.Stuart T, Butler A, Hoffman P, Hafemeister C, Papalexi E, Mauck WM, 3rd, Hao Y, Stoeckius M, Smibert P, Satija R. Comprehensive integration of single-cell data. Cell. 2019;177:1888–1902.e21. doi: 10.1016/j.cell.2019.05.031 [DOI] [PMC free article] [PubMed] [Google Scholar]
- 70.Hie B, Peters J, Nyquist SK, Shalek AK, Berger B, Bryson BD. Computational methods for single-cell RNA sequencing. Annu Rev Biomed Data Sci. 2020;3:339–364. [Google Scholar]
- 71.Weinreb C, Wolock S, Klein AM. SPRING: a kinetic interface for visualizing high dimensional single-cell expression data. Bioinformatics. 2018;34:1246–1248. doi: 10.1093/bioinformatics/btx792 [DOI] [PMC free article] [PubMed] [Google Scholar]
- 72.Sagar, Grün D. Deciphering cell fate decision by integrated single-cell sequencing analysis. Annu Rev Biomed Data Sci. 2020;3:1–22. doi: 10.1146/annurev-biodatasci-111419-091750 [DOI] [PMC free article] [PubMed] [Google Scholar]
- 73.Wolf FA, Angerer P, Theis FJ. SCANPY: large-scale single-cell gene expression data analysis. Genome Biol. 2018;19:15 doi: 10.1186/s13059-017-1382-0 [DOI] [PMC free article] [PubMed] [Google Scholar]
- 74.DePasquale EAK, Schnell D, Dexheimer P, Ferchen K, Hay S, Chetal K, Valiente-Alandí Í, Blaxall BC, Grimes HL, Salomonis N. cellHarmony: cell-level matching and holistic comparison of single-cell transcriptomes. Nucleic Acids Res. 2019;47:e138 doi: 10.1093/nar/gkz789 [DOI] [PMC free article] [PubMed] [Google Scholar]
- 75.Kiselev VY, Andrews TS, Hemberg M. Challenges in unsupervised clustering of single-cell RNA-seq data. Nat Rev Genet. 2019;20:273–282. doi: 10.1038/s41576-018-0088-9 [DOI] [PubMed] [Google Scholar]
- 76.Traag VA, Waltman L, van Eck NJ. From Louvain to Leiden: guaranteeing well-connected communities. Sci Rep. 2019;9:5233 doi: 10.1038/s41598-019-41695-z [DOI] [PMC free article] [PubMed] [Google Scholar]
- 77.Abdelaal T, Michielsen L, Cats D, Hoogduin D, Mei H, Reinders MJT, Mahfouz A. A comparison of automatic cell identification methods for single-cell RNA sequencing data. Genome Biol. 2019;20:194 doi: 10.1186/s13059-019-1795-z [DOI] [PMC free article] [PubMed] [Google Scholar]
- 78.Fidanza A, Stumpf PS, Ramachandran P, Tamagno S, Babtie A, Lopez-Yrigoyen M, Taylor AH, Easterbrook J, Henderson B, Axton R, et al. Single cell analyses and machine learning define hematopoietic progenitor and HSC-like cells derived from human PSCs [published online July 2, 2020]. Blood. doi: 10.1182/blood.2020006229 [DOI] [PMC free article] [PubMed] [Google Scholar]
- 79.Muench DE, Olsson A, Ferchen K, Pham G, Serafin RA, Chutipongtanate S, Dwivedi P, Song B, Hay S, Chetal K, et al. Mouse models of neutropenia reveal progenitor-stage-specific defects. Nature. 2020;582:109–114. doi: 10.1038/s41586-020-2227-7 [DOI] [PMC free article] [PubMed] [Google Scholar]
- 80.Saelens W, Cannoodt R, Todorov H, Saeys Y. A comparison of single-cell trajectory inference methods. Nat Biotechnol. 2019;37:547–554. doi: 10.1038/s41587-019-0071-9 [DOI] [PubMed] [Google Scholar]
- 81.Bergen V, Lange M, Peidli S, Wolf FA, Theis FJ. Generalizing RNA velocity to transient cell states through dynamical modeling. Nat Biotechnol. 2020;38:1408–1414. doi: 10.1038/s41587-020-0591-3 [DOI] [PubMed] [Google Scholar]