Abstract
Introduction
Esophageal squamous cell carcinoma (ESCC) is often resistant to radiotherapy, likely due to sub-clones that survive and repopulate in the tumor. The analysis of genomic sequencing data related to radiotherapy will provide a better understanding of the intratumoral heterogeneity and genetic evolution of ESCC during radiotherapy.
Methods
We analyzed whole-exome sequencing data from pre- and post-irradiation ESCC patients at single-cell and bulk levels in public datasets. We investigated the gene functions involving radioresistance in ESCC cell lines. Furthermore, we established gene knockdown cell lines and explored the transcriptional alterations induced by RNA interference (RNAi) of these genes in KYSE-150 ESCC cell line.
Results
We identified three candidate genes related to radioresistance: AHNAK2, EVPL and LAMA5. Knockdown of AHNAK2 and EVPL genes led to increased radioresistance in ESCC cell lines, but not LAMA5. The transcriptome analysis indicated that these genes may regulate the expression of interleukins, interleukin receptors and chemokines by inhibiting the NF-κB and TNF signaling pathways in radioresistant ESCC cells, thereby suppressing their immune response.
Conclusion
These data may provide new therapeutic strategies by targeting general ESCC radioresistance-related genes, which may eventually help the development of targeted therapies.
Keywords: esophageal squamous cell carcinoma, radiotherapy, TNF signaling, NF-κB signaling
Introduction
Esophageal cancer is the eighth most common malignant tumor in the world. In China, 90% of cases are esophageal squamous cell carcinoma.1 Late diagnosis results in about 70% ~ 80% of patients lost their opportunity for surgery. The response rates of cisplatin, paclitaxel and other chemotherapy regimens are 33% ~ 40%, with only a slight improvement in overall survival.2 At present, radiotherapy is an important treatment method for esophageal cancer and is widely used in clinic.3 However, the tumor’s innate or acquired radio-resistance is a key problem affecting the efficacy of radiotherapy for ESCC. The local recurrence occurs in more than 50% of cases, resulting in a 2-year survival rate of only 10% for radiotherapy patients.4 Thus, understanding the molecular mechanisms behind the radioresistance, and manipulating these mechanisms to either increase or reverse radioresistance could have major implications to developing more effective treatments for these patients.
Although numerous applications of genome sequencing have clearly described the subtypes and the mutational patterns of ESCC,5 the tumor evolutions during various clinical treatments remain unclear. In tumor radiotherapy, previous studies have shown that the deregulation of cell cycle and apoptosis, and the inhibition of DNA damage repair may contribute to radioresistance.6,7 The underlying molecular mechanisms of radiation resistance are very complicated and are influenced by many factors, including the evolution of tumor cells8 and the alteration of the tumor environment.9 Genomic analysis, especially at the single-cell level of pre- and post-treatment of tumor cells, may help to achieve the highest resolution genetic profile of therapeutic-related intra-tumor heterogeneity and could provide valuable resources for the understanding of the therapeutic resistance.10,11
Herein, we reanalyzed the published scWES and bulk WES data of ESCC from patients before and after radiotherapy,12 identified and validated three potential radioresistant genes – AHNAK2, EVPL and LAMA5. To further elucidate their functions in ESCC radioresistance, RNA-seq was performed to determine the differential expressed genes and related signaling pathways in ESCC cells by RNA interference of these genes. The results will provide valuable information for developing novel therapeutic strategies for ESCC in the future.
Materials and Methods
Cell Culture and Transfection
ESCC cell line KYSE-150 and TE-1 were originally purchased from the Type Culture Collection of the Chinese Academy of Sciences, Shanghai, China. The cells were cultured in RPM1640 medium supplemented with 10% fetal bovine serum at 37°C with 5% CO2. Cells were transiently transfected with the indicated siRNA using Lipofectamine 3000 according to the manufacturer’s instructions (Invitrogen, Carlsbad, CA, USA). We have recently authenticated the source of cell lines by short tandem repeat analysis (Genetic Testing Biotechnology Corporation, Suzhou, China) and no cross-contaminated cell lines were found. siRNAs specific for AHNAK2, EVPL, and LAMA5 were chemically synthesized by Jima Company (Shanghai, China). The sense sequences of the siRNAs were as follows: AHNAK2, 5ʹ-UUGUUGUGUACACUCUAGCCUG-3ʹ; LAMA5, 5ʹ-UACAGUAGCACUGCCCUGU-3ʹ; EVPL, 5ʹ- UUAUCUACCAGCUUAUACC −3ʹ.
Data of scWES and Bulk WES for Bioinformatics Analyses
All scWES and bulk WES data were obtained from the ENA (European Nucleotide Archive, http://www.ebi.ac.uk/ena) and the accession number is PRJEB18426. Pre-IR cells with more mutational burden than the maximum Post-IR cell are used to identify radiosensitive mutations by comparing mutated genes to cells which remained after IR. A gene is a sensitive candidate if it is mutated within a high-mutation burden primary tumor (23cm) pre-IR cell (>62 somatic mutations) and it is not mutated in any post-IR cell. A gene is a resistant candidate if it exists within primary tumor (23cm) post-IR and did not exist within a high-mutation burden pre-IR cell or the percentage of post-IR cells with the mutation is greater than non-high mutational burden primary tumor (23cm) pre-IR cells.
Quantitative Real-Time PCR (qRT-PCR)
Total RNA was isolated with a total RNA mini-prep kit (Ap-MN-MS-RNA-250, Axygen, USA) and then reverse transcribed to cDNA with PrimeScript RT Master Mix (Takara, Japan). qRT-PCR was performed with SYBR Premix EX Taq (Takara, Japan) using specific primers: GAPDH, sense 5ʹ-AGG TGA AGG TCG GAG TCA −3ʹ, antisense 5ʹ-GGT CAT TGA TGG CAA CAA-3ʹ; AHNAK2, sense 5ʹ-GAG AAG GAG GAC ACG GAG TGC-3ʹ, antisense 5ʹ-CCC CGC TTG CTC TTT ATG GAT TG-3ʹ; EVPL, sense 5ʹ- ACC CTT GGA GGA CTT GGA G-3ʹ, antisense 5ʹ- TCT CCG TTC CCA GGC TCT-3ʹ; LAMA5, sense 5ʹ- CCT CGT CCT CCA ATG ACA C-3ʹ, antisense 5ʹ- GCG CTG CAG TCC ATT C-3ʹ. The relative expression of transcripts was quantified by normalization to GAPDH in cell lines.
Immunofluorescence Assay of γ-H2AX Expression
Transfected cells growing in a 6-well plate were exposed to 6 Gy of radiation, and 2 hours later for KYSE-150 cells and 15 min later for TE-1 cells, were fixed with acetone/methanol (1:1), and permeabilized with Triton-X 100 (0.1%) in phosphate-buffered saline (PBS). Non-specific binding was blocked by 3% BSA in PBS. Cells were then incubated with anti-γ-H2AX antibody (Cell Signaling Technology, USA) for 2 h in PBS with 0.1% BSA followed by Alexa Fluor 488-conjugated secondary antibodies (Thermo Fisher Scientific, USA) to complete the indirect immunofluorescence procedure. Immunofluorescence-image capture was conducted on a confocal laser scanning microscopy (Olympus Corp., Japan). Immunofluorescence intensity was obtained by Image-Pro Plus v6.0 software (Media Cybernetics, USA).
Colony Formation Assay
The siRNA transfected TE-1 cancer cells were exposed to radiation at 0 Gy (as a control) and 6 Gy. Then, all cells were cultured for 12 days at 37°C in 5% CO2/95% air environment to allow colony formation. Each group of cells was performed in duplicates. After washing with pre-cooled PBS, cultures were fixed with pre-cooled methanol for 20 min and stained with crystal violet (C0121, Beyotime, Shanghai, China) for 15 min, and then washed with de-ionized water. Colonies in each plate were examined and calculated to measure colony formation rate.
Cell Viability Assay
Cell viability of radiotherapy treatment was determined by CCK8 assay. Briefly, 3000 siRNA transfected TE-1 or KYSE-150 cancer cells per well were seeded into a 96-well plate and incubated overnight. Then, cells were exposed to radiation at 0 Gy (as a control) and 6 Gy. After incubation for 24 h, 48 h, and 72 h, the medium in each well was replaced with a fresh culture medium containing 10 μL CCK8 (Dojindo, Japan). The plates were incubated for additional 2 h, and then absorbance was determined at 450 nm with a microplate spectrophotometer.
RNA-Seq for siRNA Knockdown Cancer Cells
KYSE-150 cells were collected when the cells transfected with siRNA control or target genes (AHNAK2, EVPL and LAMA5) (2 replicates per sample). Total RNAs were extracted using the RNeasy Mini kit (Qiagen), and the quality of the RNA was evaluated using Agilent Bioanalyzer 2100 (Agilent Technologies, Inc.). Sequence libraries were prepared using a TruSeq Stranded mRNA Library Prep kit for NeoPrep according to the manufacturer’s instructions and sequenced using an Illumina HiSeq 2000 platform. Raw sequencing data were deposited in the SRA database, under SRA number SRP149023.
RNA-Seq Data Processing
Fastqc was used for quality control of the sequenced data. RNA-seq Data were trimmed using Trimmomatic to remove and filter low-quality sequencing data and the adapters. We used the human genome NCBI GRCh38 and its corresponding transcriptome gene annotation for read alignment. Tophat alignment tool was used for alignment with default parameter settings.
DAVID and Ingenuity Pathway Analysis (IPA) for RNA-Seq Data
Database for Annotation, Visualization and Integrated Discovery (DAVID; http://david.abcc.ncifcrf.gov), Functional Annotation Bioinformatics Microarray Analysis was used to identify significantly enriched gene ontology (GO) and Kyoto Encyclopedia of Genes and Genomes (KEGG) terms among the given list of genes that are differentially expressed in response to siRNA treatment. Statistically overrepresented GO and KEGG categories with p-value≤0.05 were considered significant. For Ingenuity Pathway Analysis (IPA), DEGs were submitted to IPA software (Qiagen bioinformatics, Ingenuity Pathway Analysis), the canonical pathways were considered significant with p-value≤0.05 and z-score≥1 or z-score≤-1.
Statistical Analysis
Statistical data were represented as mean ± standard deviation from at least three independent experiments performed in triplicate. The gene expression was statistically analyzed using repeated measures two-way ANOVA.
Results
Identification of Candidate Radioresistant Genes in ESCC Using scWES and Bulk WES
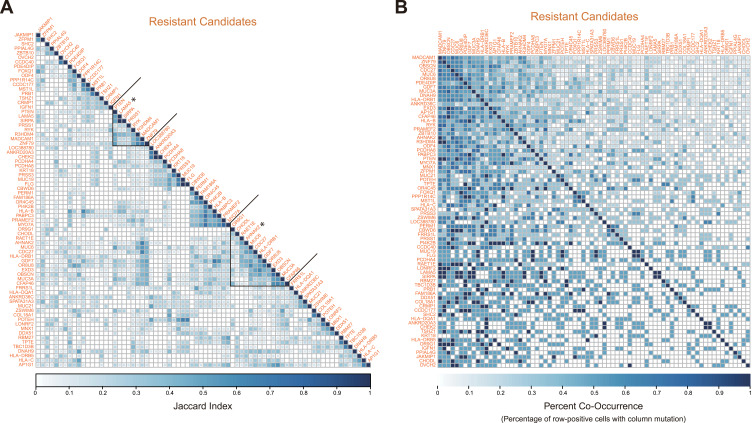
In order to identify the potential radioresistant genes and investigate their functions, we collected and reanalyzed the published data of scWES and bulk WES and mainly focused on the radioresistance-related genes and signaling pathways.12 The criteria of identifying IR-resistant gene candidates were defined as genes which were mutated in multiple post-IR cells and either: 1) not mutated in any potential sensitive cell or 2) the percentage of cells with a gene mutated post-IR is greater than the percentage of cells with it mutated in pre-IR primary tumor (23cm) cells with less than 62 mutations. A total of 74 IR-resistant gene candidates were identified (Figure 1A). Interestingly, mutations in LAMA5 and CHEK2 co-occur with PTEN and AHNAK2 mutations in cancer cells. However, there was no cancer cell carried both LAMA5 and CHEK2 mutations at single-cell level, suggesting mutations in LAMA5 and CHEK2 may represent different radioresistant subclones within AHNAK2mutPTENmut cells (Figure 1A and B). No resistant-candidate gene was identified as mutated with all other resistant genes (Figure 2B) across developmental stages and there were approximately four smaller clusters, in which LAMA5 and AHNAK2 clustering apart from one another.
Figure 1.
Pairwise comparisons of 74 candidate radioresistant genes. (A) Resistant gene candidate jaccard index across resistant cells (Post-IR Primary 23cm), hierarchically clustered. (B) Resistant candidate gene percent co-occurrence across resistant cells, calculated as the percentage of row-positive cells with the column mutated.
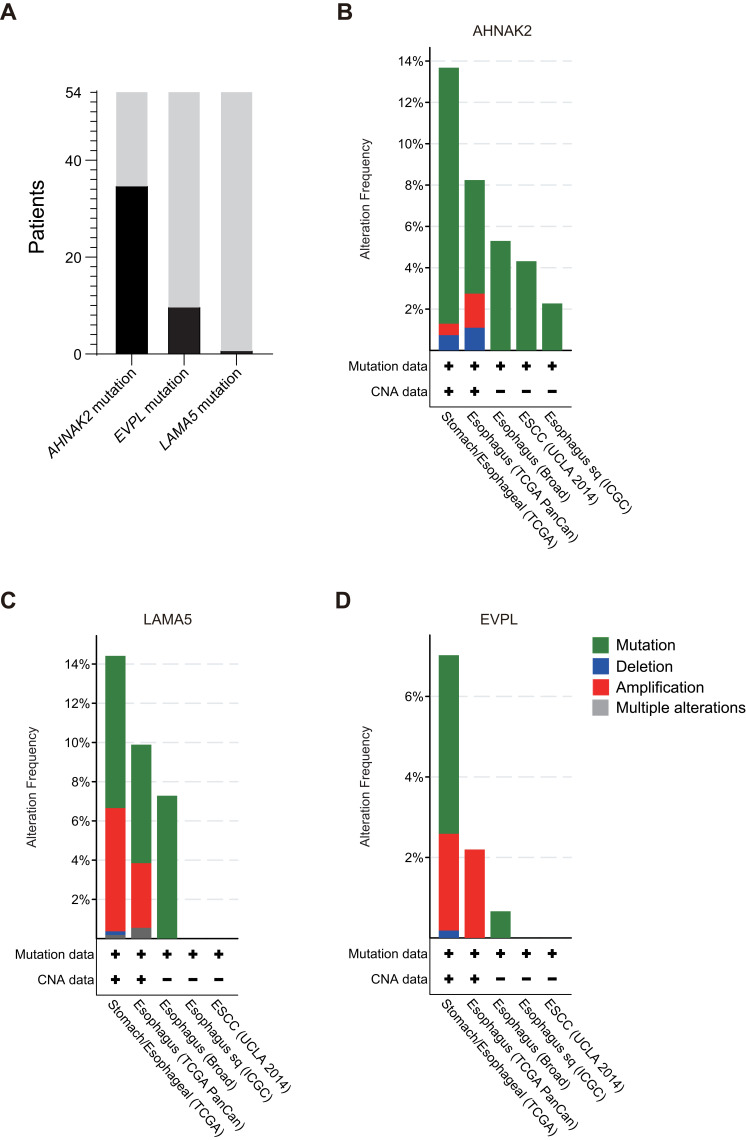
Figure 2.
Alteration frequency of AHNAK2, EVPL and LAMA5 in ESCC Patients and ESCC-TCGA genomic data. (A) Persistent mutation of AHNAK2, EVPL and LAMA5 in ESCC patients during their radiotherapy. (B–D) The frequency of mutation, deletion, amplification and other alterations of AHNAK2 (B), EVPL (C) and LAMA5 (D) were showed in ESCC tissues, including ESCC (ICGC), ESCC (UCLA, 2014), esophagus (Broad), esophagus (TCGA PanCan) and Stomach/Esophageal (TCGA).
Furthermore, we integrated the gene lists from scWES data with the bulk WES, and further calculated deleterious mutations in those patients with matching tumor biopsies before and after irradiation. We observed that 65% (35/54) of patients with mutations in AHNAK2, 19% (10/54) with mutations in EVPL and 2% (1/54) of patients with mutations in LAMA5 that were persistent during their radiotherapy (Figure 2A). Collectively, the results suggested that mutations in AHNAK2, EVPL and LAMA5 may potentially contribute to the radioresistance of ESCC. Moreover, we examined the mutational status of these three genes in primary ESCC datasets from cBioPortal database (Figure 2B–D). Approximately 14%, 14% and 7% ESCC tumors were carrying AHNAK2, LAMA5 and EVPL alterations, respectively. It is worth noting that the majority of the alterations were mutations, confirming the significant role of these genes in primary ESCC development.
Radioresistance of Candidate Genes in ESCC Cell Line
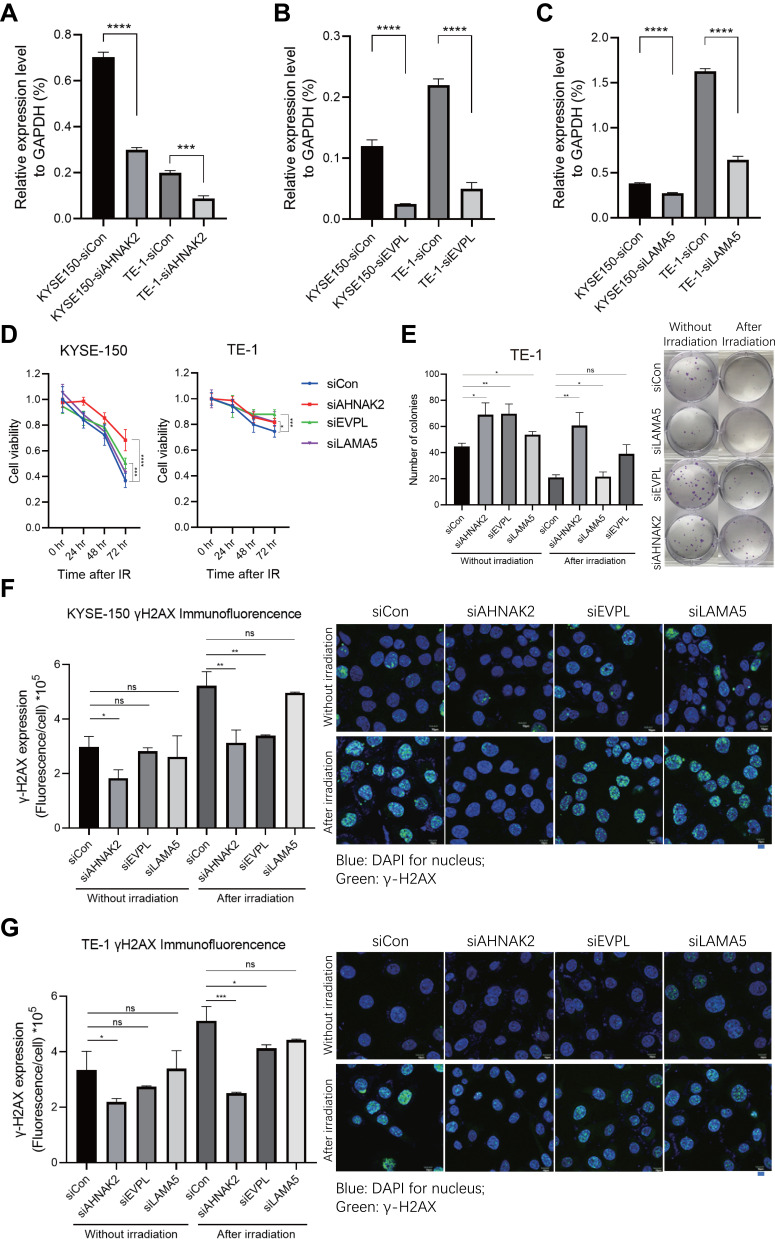
In order to validate the function of these candidate radioresistant genes (AHNAK2, LAMA5, and EVPL) in ESCC, we generated ESCC cell lines KYSE-150 and TE-1 with RNAi technology (Figure 3A–C). Interestingly, the ESCC cells with AHNAK2-RNAi and EVPL-RNAi showed much higher cell viability compared with control-RNAi in both KYSE-150 and TE-1 cancer cells (Figure 3D) in response to irradiation treatment (6 Gy). The colony formation assay with siRNA transfected TE-1 cells also exhibited that more colonies were formed in the AHNAK2-RNAi and EVPL-RNAi ESCC cells (Figure 3E), which indicated that knockdown of AHNAK2 and EVPL could induce radioresistance. Furthermore, the radiotherapy-induced DNA damage repair was examined with γ-H2AX immunofluorescence. Compared with control siRNA, the siAHNAK2 and siEVPL could significantly reduce the γ-H2AX immunofluorescence in KYSE-150 and TE-1 cancer cells, but not the siLAMA5 (Figure 3F and G). In summary, these results indicated that AHNAK2 and EVPL may involve in the induction of radioresistance in ESCC, but not the LAMA5.
Figure 3.
Validation of the potential radioresistance of siAHNAK2, siEVPL and siLAMA5 in ESCC. (A–C) Knockdown of AHNAK2 (A), EVPL (B) and LAMA5 (C) with siRNA in ESCC cell line, KYSE-150 and TE-1 cancer cells. (D) Cell viability of siCon (control), siAHNAK2, siEVPL and siLAMA5 treated cancer cells after 6Gy irradiation treatment. (E) Colony formation of siCon (control), siAHNAK2, siEVPL and siLAMA5 treated TE-1 cells after 6Gy irradiation treatment. (F–G) γ-H2AX immunofluorescence in siAHNAK2, siEVPL and siLAMA5 treated KYSE-150 (F) and TE-1 (G) cancer cells. Blue represents DAPI stained nucleus, green represents γ-H2AX foci. * indicates p-value < 0.05, ** indicates p-value < 0.01, *** indicates p-value < 0.001, **** indicates p-value < 0.0001, ns indicates p-value > 0.05.
Transcriptome Sequencing of ESCC Cells with siRNA Knockdown of AHNAK2, EVPL and LAMA5 Genes
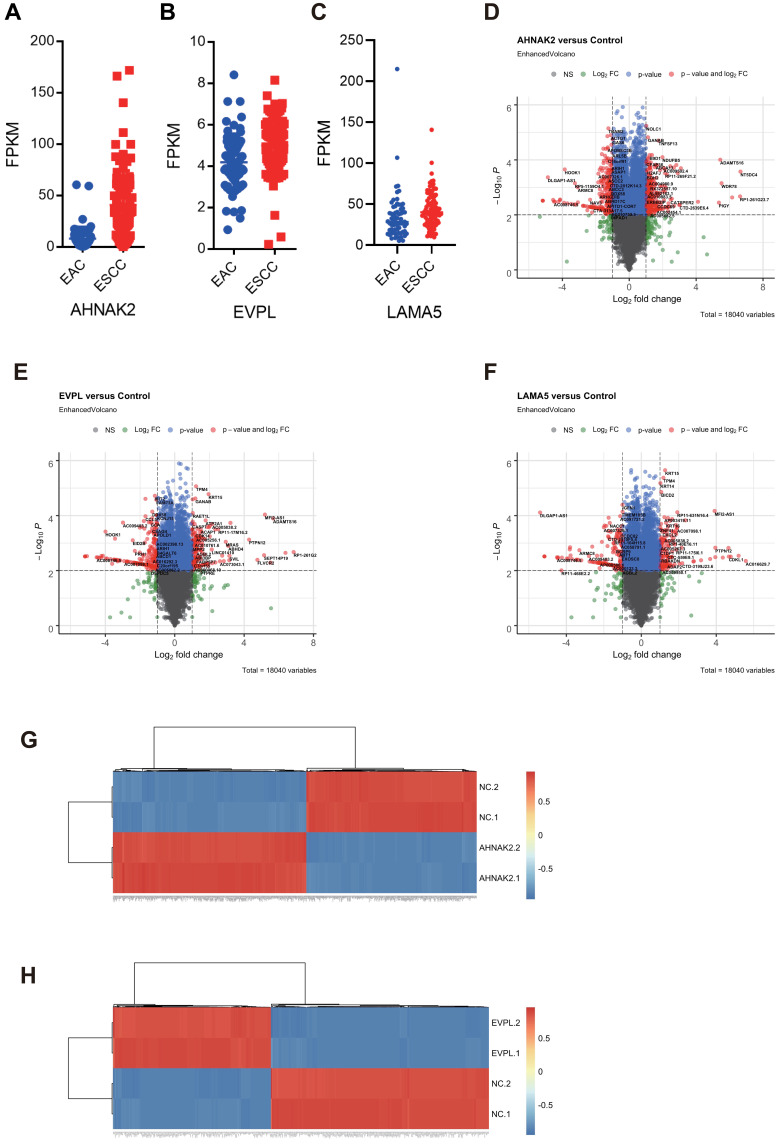
The analysis of TCGA dataset of large-scale esophageal tumor samples showed that the three candidate genes AHNAK2, LAMA5 and EVPL were highly expressed in ESCC tumors (Figure 4A–C). To further investigate the role of these genes in radioresistance, we conducted siRNA knockdown of AHNAK2, EVPL and LAMA5 in ESCC cell lines and performed RNA-seq to identify the potential influenced signaling pathways. In comparing to the transcriptome profile from siRNA-control transfected ESCC cells, significantly differentiated expressed genes were identified in siRNA-AHNAK2, siRNA-EVPL and siRNA-LAMA5 transfected KYSE-150 ESCC cells, respectively. The volcano plots and heatmap showed that there were 558 genes upregulated and 419 genes downregulated in siRNA-AHNAK2 cells (|log2(fold-change)|>1, p-value<0.05) (Figure 4D and G), 820 upregulated and 742 downregulated genes in siRNA-EVPL cells (Figure 4E and H), as well as 243 upregulated and 216 downregulated genes in siRNA-LAMA5 KYSE-150 cells (|log2(fold-change)|>1, p-value<0.05) (Figure 4F).
Figure 4.
Transcriptome analyses of siRNA knockdown AHNAK2, EVPL and LAMA5. (A-C) Highly expressed AHNAK2 (A), EVPL (B) and LAMA5 (C) in ESCC. Expression of AHNAK2, EVPL and LAMA5 were analyzed in esophageal cancer of TCGA pancancer database, including ESCC and esophageal adenocarcinoma (EAC). (D–F) Volcano plot showed the different expressional genes (DEGs) in siRNA-AHNAK2 (D), siRNA-EVPL (E) and siRNA-LAMA5 (F) transfected KYSE-150 cells. (G and H) Heatmap showed the DEGs in siRNA-AHNAK2 (G) and siRNA-EVPL (H) transfected KYSE-150 cells.
DAVID Ontology Analysis of Transcriptome Data Revealed the Reduction of NF-κB and TNF Signaling in ESCC Cells Knocking Down AHNAK2 and EVPL Genes
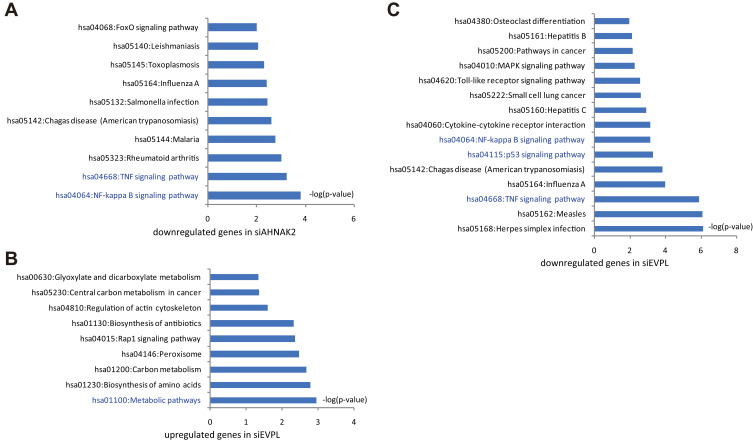
Moreover, the upregulated or downregulated genes in siRNA-AHNAK2 and siRNA-EVPL transfected KYSE-150 cells were summarized. We submitted these genes to DAVID (a web-based high-throughput functional genomics analysis tool) for systematically clustering these genes. In siRNA-AHNAK2, KEGG-pathway analysis showed that downregulated genes were significantly enriched in NF-kappa B signaling pathway (p-value = 1.53*E-04) and TNF signaling pathway (p-value = 1.95*E-04) (Figure 5A and Supplementary Table S1). In siRNA-EVPL, KEGG-pathway analysis showed that upregulated genes were significantly enriched in metabolic pathways (p-value = 0.001) (Figure 5B), while the downregulated genes were significantly enriched in TNF signaling pathway (p-value = 1.38*E-06), p53 signaling pathway (p-value = 5.45*E-04), NF-kappa B signaling pathway (p-value = 7.23*E-04) (Figure 5C and Supplementary Table S1). These results showed that knockdown of AHNAK2 and EVPL may have similar transcriptional influence, in which the NF-kappa B signaling pathway and TNF signaling pathway were significantly repressed in KYSE-150 cells.
Figure 5.
DAVID-KEGG analyses of siRNA-AHNAK2 and siRNA-EVPL transfected KYSE-150 cells. (A) DAVID-KEGG analysis of the downregulated genes in siRNA-AHNAK2 transfected KYSE-150 cells, p-value < 0.01. (B) DAVID-KEGG analysis of the upregulated genes in siRNA-EVPL transfected KYSE-150 cells, p-value < 0.01. (C) DAVID-KEGG analysis of the downregulated genes in siRNA-EVPL transfected KYSE-150 cells, p-value < 0.01.
Ingenuity Pathway Analysis (IPA) of Transcriptome Data Revealed the Reduction of Immune Response in ESCC Cells Knocking Down AHNAK2 and EVPL Genes
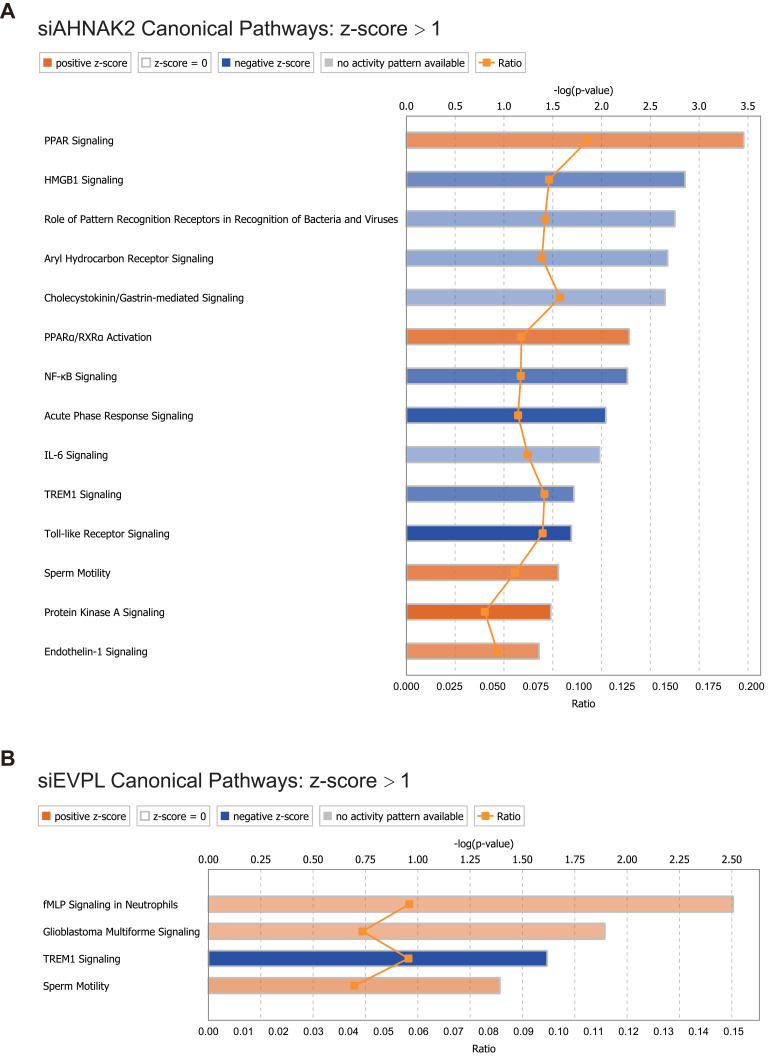
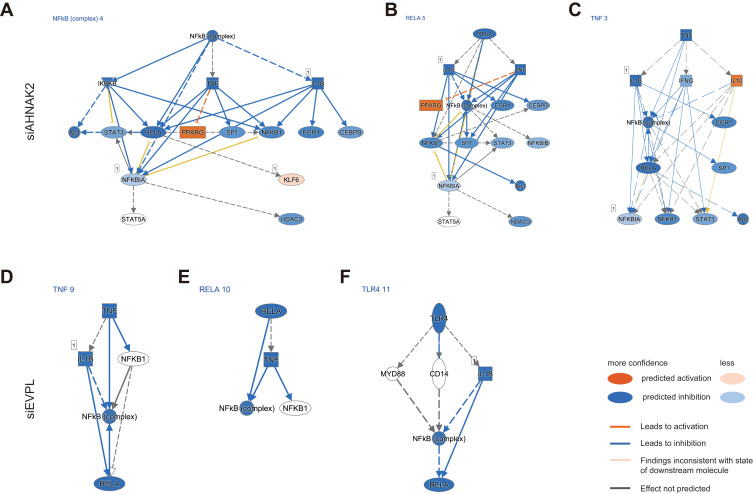
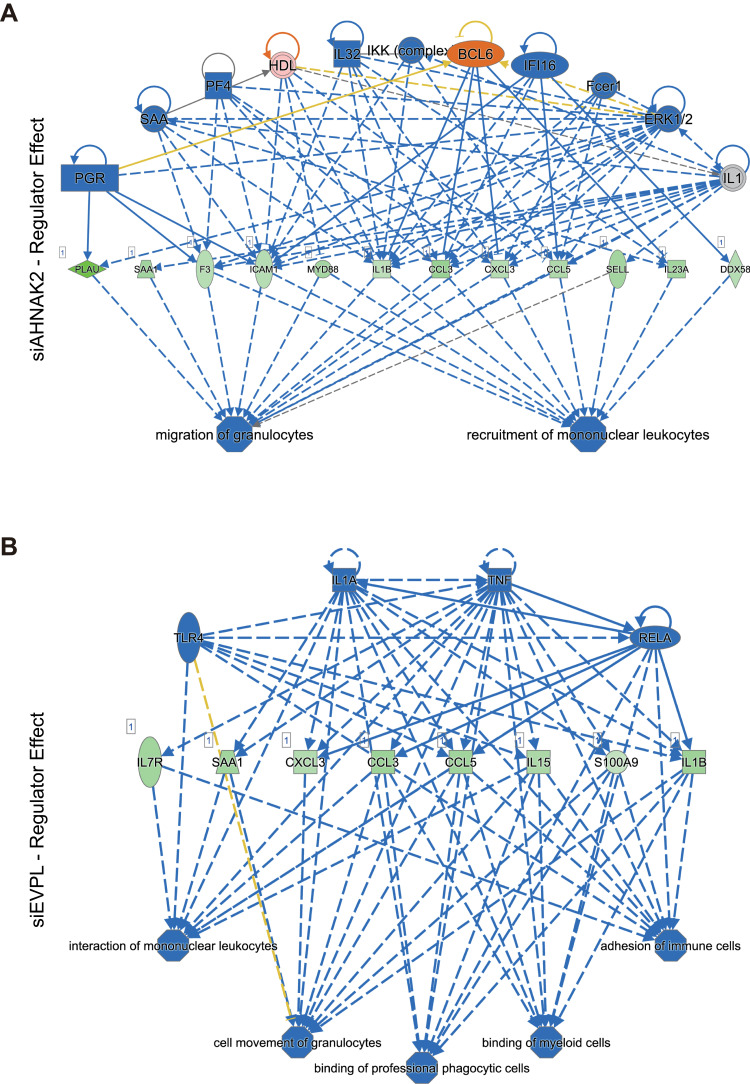
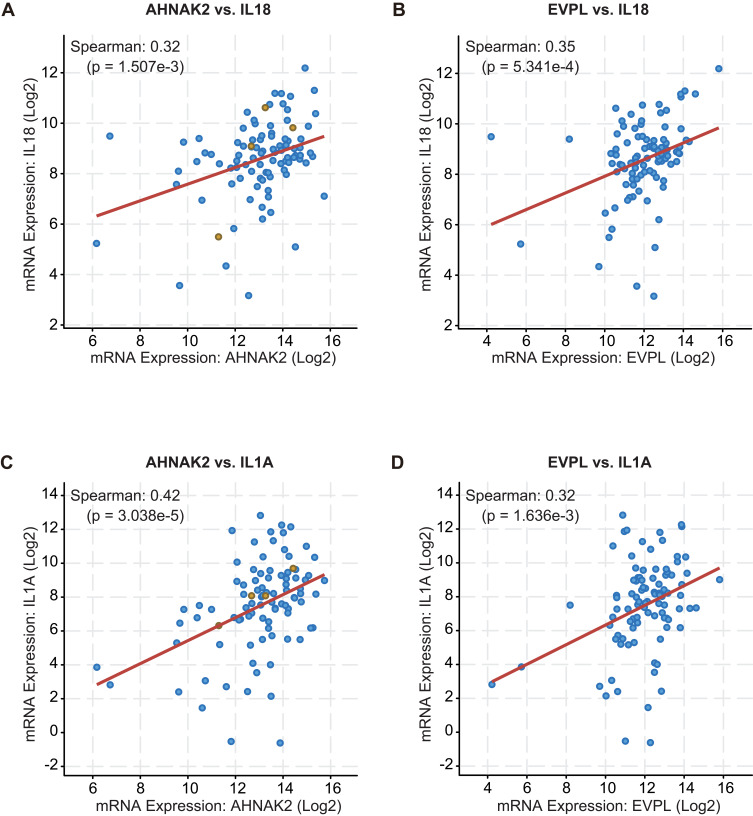
Then, we applied these DEGs of siRNA-AHNAK2 and siRNA-EVPL into IPA. In canonical pathways of IPA, we found that the PPAR signaling was significantly activated, while NF-κB signaling and Toll-like receptor signaling were significantly inhibited in siRNA-AHNAK2 (Figure 6A); the TREM1 signaling was significantly inhibited in siRNA-EVPL (Figure 6B). In upstream analysis of IPA, the signaling pathways of NF-κB, RELA and TNF were predicted to be significantly inhibited in siRNA-AHNAK2 (Figure 7A–C), and the signaling pathways of TNF, RELA and TLR were predicted to be significantly inhibited in siRNA-EVPL (Figure 7D–F). Furthermore, the regulator effector of IPA showed the potential functional variations by siRNA-AHNAK2 and siRNA-EVPL. In siRNA-AHNAK2, the inhibited signaling (such as ERK1/2, IKK complex, IL32, et al) repressed the expression of multiple target genes (such as DDX58, IL23A, CCL5, CCL3, et al), then inhibited the function of cancer cells (such as migration of granulocytes and recruitment of mononuclear leukocytes) (Figure 8A). In siRNA-EVPL, the inhibited signaling of TLR4, IL1A, TNF and RELA will repress the expression of IL1B, CCL3, CCL5 and IR7R and other genes, then inhibited the functions (such as interaction of mononuclear leukocytes, cell movement of granulocytes, adhesion of immune cells, et al) (Figure 8B). Furthermore, the correlations between AHNAK2, EVPL and interleukins and chemokines in ESCC tissues were also investigated in the ESCC-TCGA transcriptome database (RNA-seq of 95 ESCC tissues) (Supplementary Table S2). The results showed that the expression level of AHNAK2 and EVPL significantly correlated a large number of interleukins, interleukin receptors and chemokines (|Spearman Correlation| > 0.3, p-value < 0.01), and they also had interrelated interleukins and interleukin receptors, such as IL36RN, IL17RE, IL36G, IL36B, IL4I1, IL18 and IL1A (Figure 9A–D and Supplementary Table S2). In summary, these results suggested that knockdown of AHNAK2 and EVPL in KYSE-150 cells will repress the potential immune response of cancer cells through controlling the expression of interleukins and chemokines by inhibiting the NF-κB and TNF signaling pathways.
Figure 6.
IPA canonical pathways of DEGs in siRNA-AHNKA2 and siRNA-EVPL transfected KYSE-150 cells. The canonical pathways of siRNA-AHNAK2 (A) and siRNA-EVPL (B) were showed with z-score > 1. Blue color shows inhibited canonical pathways (negative z-score), while orange color shows activated canonical pathways (positive z-score). The shade of color represents the degree of inhibition or activation.
Figure 7.
IPA upstream analyses of siRNA-AHNAK2 and siRNA-EVPL transfected KYSE-150 cells. (A–C) IPA upstream analyses of siRNA-AHNAK2 transfected KYSE-150 cells, including the NF-κB signaling (A), RELA signaling (B) and TNF signaling (C). (D–F) IPA upstream analyses of siRNA-EVPL transfected KYSE-150 cells, including the TNF signaling (D), RELA signaling (E) and TLR4 signaling (F). Blue color shows predicted inhibition, while orange color shows predicted activation.
Figure 8.
IPA regulator effect in siRNA-AHNAK2 and siRNA-EVPL transfected KYSE-150 cells. (A) IPA regulator effect in siRNA-AHNAK2 transfected KYSE-150 cells. (B) IPA regulator effect in siRNA-EVPL transfected KYSE-150 cells. Blue color shows predicted inhibition, while orange color shows predicted activation. Green color shows the downregulation of indicated genes.
Figure 9.
The mRNA of AHNAK2 and EVPL positively co-expressed with IL18 and IL1A in TCGA transcriptome data of ESCC. The co-expression between AHNAK2 (A) or EVPL (B) and IL18 were showed, p-value < 0.001. The co-expression between AHNAK2 (C) or EVPL (D) and IL1A were showed, p-value < 0.001.
Discussion
Radiotherapy is a standard therapeutic option for ESCC patients. However, the local recurrence and distant metastasis often occur, usually due to the evolution of tumor cells and tumor microenvironment to radioresistance.8,9 The longitudinal scWES and bulk WES profiles of ESCC during radiotherapy provide significant genomic resources for ESCC evolution and heterogeneity.12 Previous bulk-WES analyses have shown that chemotherapy and chemoradiotherapy (CRT) did not impact the tumor mutational burden, but significantly impacted the tumor immune microenvironment.13,14 Meanwhile, therapeutic resistant related genomic mutations and epigenetic alterations were significantly enriched.15–17 However, these findings from previous datasets require further validations in larger radiotherapy treated ESCC cohorts using higher resolution sequencing approaches.
In the present work, we reported three newly identified radioresistant genes – AHNAK2, EVPL and LAMA5,18–23 in which the mutations in these genes may cause loss of function and contributed to radioresistance.24,25 Using the RNA-seq analyses, massive signaling pathways were identified to be influenced in the siRNA-AHNAK2 and siRNA-EVPL treated KYSE-150 cells; however, this observation was not found in siRNA-LAMA5 treated cancer cells (p-value < 0.01). Although the mutations (or reductions) of AHNAK2 or EVPL could significantly cause the radioresistance of cancer cells, the transcriptional changes of these cancer cells may play vital roles in the resistance of cancer during radiotherapy. The IPA upstream analysis showed that knockdown of AHNAK2 or EVPL genes in ESCC significantly repressed the expression of interleukins, interleukin receptors and chemokines, which may significantly influence the tumor microenvironment.
Previously, Hou et al 2018 demonstrated that inhibiting the canonical NF-κB pathway dampened the therapeutic effect of radiotherapy,26 which is consistent with the effect caused by siAHNAK2 or siEVPL in ESCC. Previous studies have shown that radiotherapy could modulate host immune response functioning by triggering recruitment and activation of antigen-presenting cells and priming of tumor antigen-specific T-cell responses,27,28 and a combination of radiotherapy and immunotherapy may result in an enhanced antitumor effect.29 Nevertheless, the radioresistance proposed in our study by AHNAK2 and EVPL indicated that radiotherapy may reduce the immune response of tumor cells, thereby restricting the antitumor immune response. This reduction in immune response may be due to changes in the transcriptome of the tumor cells, resulting in remodeling the tumor microenvironment.9,30
In summary, we demonstrated that mutations in AHNAK2, LAMA5 and EVPL genes were correlated with radioresistance in ESCC and provided a mechanistic clue that loss of function in specific gene may reshape the transcriptome profiles in tumor cells and reduce their potential immune response and thereby impact the overall resistance to radiotherapy. Our study provides a novel rationale for designing an actionable strategy to minimize radioresistance in the clinic.
Acknowledgments
RNA-seq was performed at the Genseeq Company.
Funding Statement
This work was supported by the Hangzhou Social Development Self-declaration Project (20180533B63) and Zhejiang Health Science and Technology Project (2018KY595).
Data Sharing Statement
The studies used previously published data. The scWES and bulk WES sequence data could be assessed in the ENA (European Nucleotide Archive, http://www.ebi.ac.uk/ena) and the accession number is PRJEB18426. Our RNA-seq data were uploaded to the NCBI SRA database with the accession number SRP149023.
Ethics Approval and Consent to Participate
Not applicable. The studies used previously published data.
Patient Consent for Publication
Not applicable.
Author Contributions
All authors contributed to data analysis, drafting or revising the article, have agreed on the journal to which the article will be submitted, gave final approval of the version to be published, and agree to be accountable for all aspects of the work.
Disclosure
The authors declare that they have no competing interests.
References
- 1.Chen W, Zheng R, Zeng H, Zhang S, He J. Annual report on status of cancer in China, 2011. Chin J Cancer Res. 2015;34(3):2–12. doi: 10.1186/s40880-015-0001-2 [DOI] [PMC free article] [PubMed] [Google Scholar]
- 2.Kotecki N, Hiret S, Etienne PL, et al. First-line chemotherapy for metastatic esophageal squamous cell carcinoma: clinico-biological predictors of disease control. Oncology. 2016;90(2):88–96. doi: 10.1159/000442947 [DOI] [PubMed] [Google Scholar]
- 3.Ordu AD, Nieder C, Geinitz H, et al. Association between radiation dose and pathological complete response after preoperative radiochemotherapy in esophageal squamous cell cancer. Anticancer Res. 2014;34(12):7255–7261. [PubMed] [Google Scholar]
- 4.Mariette C, Balon JM, Piessen G, Fabre S, Van Seuningen I, Triboulet JP. Pattern of recurrence following complete resection of esophageal carcinoma and factors predictive of recurrent disease. Cancer. 2003;97(7):1616–1623. doi: 10.1002/cncr.11228 [DOI] [PubMed] [Google Scholar]
- 5.Cancer Genome Atlas Research N, Analysis Working Group Asan U, Agency BCC, et al. Integrated genomic characterization of oesophageal carcinoma. Nature. 2017;541(7636):169–175. doi: 10.1038/nature20805 [DOI] [PMC free article] [PubMed] [Google Scholar]
- 6.Dutreix M, Cosset JM, Sun JS. Molecular therapy in support to radiotherapy. Mutat Res. 2010;704(1–3):182–189. doi: 10.1016/j.mrrev.2010.01.001 [DOI] [PubMed] [Google Scholar]
- 7.Kaliberov SA, Buchsbaum DJ. Chapter seven–Cancer treatment with gene therapy and radiation therapy. Adv Cancer Res. 2012;115:221–263. doi: 10.1016/B978-0-12-398342-8.00007-0 [DOI] [PMC free article] [PubMed] [Google Scholar]
- 8.Baumann M, Krause M, Hill R. Exploring the role of cancer stem cells in radioresistance. Nat Rev Cancer. 2008;8(7):545–554. doi: 10.1038/nrc2419 [DOI] [PubMed] [Google Scholar]
- 9.Barker HE, Paget JT, Khan AA, Harrington KJ. The tumour microenvironment after radiotherapy: mechanisms of resistance and recurrence. Nat Rev Cancer. 2015;15(7):409–425. doi: 10.1038/nrc3958 [DOI] [PMC free article] [PubMed] [Google Scholar]
- 10.Wu H, Zhang XY, Hu Z, et al. Evolution and heterogeneity of non-hereditary colorectal cancer revealed by single-cell exome sequencing. Oncogene. 2017;36(20):2857–2867. doi: 10.1038/onc.2016.438 [DOI] [PubMed] [Google Scholar]
- 11.Xu X, Hou Y, Yin X, et al. Single-cell exome sequencing reveals single-nucleotide mutation characteristics of a kidney tumor. Cell. 2012;148(5):886–895. doi: 10.1016/j.cell.2012.02.025 [DOI] [PMC free article] [PubMed] [Google Scholar]
- 12.Yang L, Zhang X, MacKay M, et al. Identification of radioresponsive genes in esophageal cancer from longitudinal and single cell exome sequencing. Int J Radiat Oncol Biol Phys. 2020;108(4):1103–1114. doi: 10.1016/j.ijrobp.2020.06.015 [DOI] [PubMed] [Google Scholar]
- 13.Kamran SC, Lennerz JK, Margolis CA, et al. Integrative molecular characterization of resistance to neoadjuvant chemoradiation in rectal cancer. Clin Cancer Res. 2019;25(18):5561–5571. doi: 10.1158/1078-0432.CCR-19-0908 [DOI] [PMC free article] [PubMed] [Google Scholar]
- 14.Liu D, Abbosh P, Keliher D, et al. Mutational patterns in chemotherapy resistant muscle-invasive bladder cancer. Nat Commun. 2017;8(1):2193. doi: 10.1038/s41467-017-02320-7 [DOI] [PMC free article] [PubMed] [Google Scholar]
- 15.Patch AM, Christie EL, Etemadmoghadam D, et al. Whole-genome characterization of chemoresistant ovarian cancer. Nature. 2015;521(7553):489–494. doi: 10.1038/nature14410 [DOI] [PubMed] [Google Scholar]
- 16.Johnson BE, Mazor T, Hong C, et al. Mutational analysis reveals the origin and therapy-driven evolution of recurrent glioma. Science. 2014;343(6167):189–193. doi: 10.1126/science.1239947 [DOI] [PMC free article] [PubMed] [Google Scholar]
- 17.Faltas BM, Prandi D, Tagawa ST, et al. Clonal evolution of chemotherapy-resistant urothelial carcinoma. Nat Genet. 2016;48(12):1490–1499. doi: 10.1038/ng.3692 [DOI] [PMC free article] [PubMed] [Google Scholar]
- 18.Bartolini A, Cardaci S, Lamba S, et al. BCAM and LAMA5 mediate the recognition between tumor cells and the endothelium in the metastatic spreading of KRAS-mutant colorectal cancer. Clin Cancer Res. 2016;22(19):4923–4933. doi: 10.1158/1078-0432.CCR-15-2664 [DOI] [PubMed] [Google Scholar]
- 19.Gordon-Weeks A, Lim SY, Yuzhalin A, et al. Tumour-derived laminin alpha5 (LAMA5) promotes colorectal liver metastasis growth, branching angiogenesis and notch pathway inhibition. Cancers (Basel). 2019;11(5):630. doi: 10.3390/cancers11050630 [DOI] [PMC free article] [PubMed] [Google Scholar]
- 20.Zhang X, Li Q, Jiang W, et al. LAMA5 promotes human umbilical vein endothelial cells migration, proliferation, and angiogenesis and is decreased in preeclampsia. J Matern Fetal Neonatal Med. 2020;33(7):1114–1124. doi: 10.1080/14767058.2018.1514597 [DOI] [PubMed] [Google Scholar]
- 21.Sigurdson AJ, Brenner AV, Roach JA, et al. Selected single-nucleotide polymorphisms in FOXE1, SERPINA5, FTO, EVPL, TICAM1 and SCARB1 are associated with papillary and follicular thyroid cancer risk: replication study in a German population. Carcinogenesis. 2016;37(7):677–684. doi: 10.1093/carcin/bgw047 [DOI] [PMC free article] [PubMed] [Google Scholar]
- 22.Lu D, Wang J, Shi X, Yue B, Hao J. AHNAK2 is a potential prognostic biomarker in patients with PDAC. Oncotarget. 2017;8(19):31775–31784. doi: 10.18632/oncotarget.15990 [DOI] [PMC free article] [PubMed] [Google Scholar]
- 23.Wang M, Li X, Zhang J, et al. AHNAK2 is a novel prognostic marker and oncogenic protein for clear cell renal cell carcinoma. Theranostics. 2017;7(5):1100–1113. doi: 10.7150/thno.18198 [DOI] [PMC free article] [PubMed] [Google Scholar]
- 24.Ahlemeyer B, Vogt JF, Michel V, Hahn-Kohlberger P, Baumgart-Vogt E. Microporation is an efficient method for siRNA-induced knockdown of PEX5 in HepG2 cells: evaluation of the transfection efficiency, the PEX5 mRNA and protein levels and induction of peroxisomal deficiency. Histochem Cell Biol. 2014;142(5):577–591. doi: 10.1007/s00418-014-1254-6 [DOI] [PubMed] [Google Scholar]
- 25.Reiff T, Tsarovina K, Majdazari A, Schmidt M, Del Pino I, Rohrer H. Neuroblastoma phox2b variants stimulate proliferation and dedifferentiation of immature sympathetic neurons. J Neurosci. 2010;30(3):905–915. doi: 10.1523/JNEUROSCI.5368-09.2010 [DOI] [PMC free article] [PubMed] [Google Scholar]
- 26.Hou Y, Liang H, Rao E, et al. Non-canonical NF-kappaB antagonizes STING sensor-mediated DNA sensing in radiotherapy. Immunity. 2018;49(3):490–503 e4. doi: 10.1016/j.immuni.2018.07.008 [DOI] [PMC free article] [PubMed] [Google Scholar]
- 27.Apetoh L, Ghiringhelli F, Tesniere A, et al. Toll-like receptor 4-dependent contribution of the immune system to anticancer chemotherapy and radiotherapy. Nat Med. 2007;13(9):1050–1059. doi: 10.1038/nm1622 [DOI] [PubMed] [Google Scholar]
- 28.Ma Y, Adjemian S, Mattarollo SR, et al. Anticancer chemotherapy-induced intratumoral recruitment and differentiation of antigen-presenting cells. Immunity. 2013;38(4):729–741. doi: 10.1016/j.immuni.2013.03.003 [DOI] [PubMed] [Google Scholar]
- 29.Gong X, Li X, Jiang T, et al. Combined radiotherapy and anti-PD-L1 antibody synergistically enhances antitumor effect in non-small cell lung cancer. J Thorac Oncol. 2017;12(7):1085–1097. doi: 10.1016/j.jtho.2017.04.014 [DOI] [PubMed] [Google Scholar]
- 30.Zou W. Immunosuppressive networks in the tumour environment and their therapeutic relevance. Nat Rev Cancer. 2005;5(4):263–274. doi: 10.1038/nrc1586 [DOI] [PubMed] [Google Scholar]


