

Abstract
We demonstrate improved methods for making valid and accurate comparisons of fluorescence measurement capabilities among instruments tested at different sites and times. We designed a suite of measurements and automated data processing methods to obtain consistent objective results and applied them to a selection of 23 instruments at nine sites to provide a range of instruments as well as multiple instances of similar instruments. As far as we know, this study represents the most accurate methods and results so far demonstrated for this purpose. The first component of the study reporting improved methods for photoelectron scale (Spe) evaluations, which was published previously (Parks, El Khettabi, Chase, Hoffman, Perfetto, Spidlen, Wood, Moore, and Brinkman: Cytometry A 91 (2017) 232–249). Those results which were within themselves are not sufficient for instrument comparisons, so here, we use the Spe scale results for the 23 cytometers and combine them with additional information from the analysis suite to obtain the metrics actually needed for instrument evaluations and comparisons. We adopted what we call the 2+2SD limit of resolution as a maximally informative metric, for evaluating and comparing dye measurement sensitivity among different instruments and measurement channels. Our results demonstrate substantial differences among different classes of instruments in both dye response and detection sensitivity and some surprisingly large differences among similar instruments, even among instruments with nominally identical configurations. On some instruments, we detected defective measurement channels needing service. The system can be applied in shared resource laboratories and other facilities as an aspect of quality assurance, and accurate instrument comparisons can be valuable for selecting instruments for particular purposes and for making informed instrument acquisition decisions. An institutionally supported program could serve the cytometry community by facilitating access to materials, and analysis and maintaining an archive of results.
Keywords: flow cytometry, instrumentation, standardization, sensitivity, automated data analysis, photoelectron scale, LED, microspheres, resolution limit, limit of detection
Commonly quoted indicators of fluorescence measurement capability like stain index (SI) (1) depend on the particular choice of cells or sample of interest while others, for example, the “molecules of equivalent fluorophore (MEF) of an unstained Rainbow bead” often quoted in instrument specifications, are not really correlated with ability to detect dim signals (2). In response to the unmet need for maximally informative instrument comparisons separated in time and space, we developed a general, accurate, and reliable approach for evaluating fluorescence measurement performance.
The physics and statistical aspects of fluorescence detection in cytometers indicate that two fundamental parameters, conventionally called Q and B, describe the measurement capabilities, where Q is the photoelectron signal per unit of dye, and B is the total background (electronic and optical) separate from any specific signal (3,4). In practice, as instrument baseline restoration prevents direct evaluation of background signal, B is inferred from the variance measured at the minimum possible signal level. Alternatively, Q and the 2+2SD limit of resolution metric (2,5) can be used.
The first component of this study (6) established improved methods for accurate evaluation of Spe scales. Spe scale evaluations in themselves are valuable for understanding measurements on a single instrument including “spillover spreading” in fluorescence compensation and for setting correct weights in the weighted least squares method (WLSM) for spectral unmixing (7). However, additional information is needed for calculating Q and B or 2+2SD. Here we combine Spe scale results with calibrated dye measurements and background distributions to obtain high quality comparisons between instruments.
Details of materials and methods along with additional results and discussion are provided in Supporting Information.
Organization and Approach of the Project
We selected nine laboratories and 23 instruments for the study and assembled a set of reference particle samples, LED test equipment and detailed instructions for data acquisition. The project objective was to evaluate the instruments in their normal running condition, so the instrument operators were instructed to use instrument conditions they would use for typical immunophenotyping experiments. The instruments include 8 LSR-IIs, 1 LSR Fortessa, 5 FACSAria, 1 FACSCanto, 1 FACSVerse, 1 Accuri C6, 1 Scanford (upgraded FACScan), 1 FACSCalibur, 1 MoFlo, 2 Influx and 1 Xitogen XTG1600 (now the Beckman Coulter CytoFLEX). As described in (1), measurements for Spe scale evaluation included LED signals and two multilevel, multidye particle sets. The LED system was a prototype of the quantiFlash (A-P-E GmbH). The multilevel beads were an 8-level, 5-dye set from Spherotech, and a 6-level, 4-dye set from Thermo Fisher. Calibrated dye scales were evaluated using a 10 dye set of dried FACSuite FC Beads preloaded with dye-conjugated antibody (BD Biosciences). The dyes were APC, APC-Cy7, APC-H7, FITC, PE, PE-Cy7, PerCP, PerCP-Cy5.5, V450, and V500-C. The samples had a rated shelf life of 6 months, and brightness assignments were provided in “ABD” units that approximate the output of a reference antibody-dye conjugate (8). Fluorescence channel backgrounds were evaluated using small unlabeled particles (Duke Standards 1.011 μm).
To avoid any form of subjective analysis, we developed a script for the R statistical environment (9) to perform the extensive calculations automatically and reproducibly. It incorporates the whole set of data analyses for each instrument including all of the constraints and checks for data acceptance. The analysis procedure for LED and multilevel bead data to obtain Spe scales is described in (6). The analysis for the FC Beads and Duke 1,011 nm beads started with gating on the main FSC-SSC peak. Identified populations were Gaussian fitted in fluorescence dimensions to obtain peak means and SDs.
We define the measurements and their relationships as follows. Spe scales in instrument measurement units (MFI) define QMFI = Spe/MFI. The FC Bead measurements provided dye scales in ABD units per MFI or ABD/MFI, and the standard deviation (SD) of the Duke 1,011 nm bead distribution corresponds to the background SD in MFI or BSDMFI. The dye specific Q is QABD = Spe/ABD = QMFI/(ABD/MFI). The background SD expressed in Spe is BSDSpe = BSDMFI × QMFI. The background SD expressed in ABD is BSDABD = BSDSpe/QABD = BSDMFI × (ABD/MFI). Due to the mean–variance equivalent of Poisson processes, the background in Spe is BSpe = (BSDSpe)2. The background in ABD is BABD = BSpe/QABD.
Other measures of staining quality including Staining Index (1) and Separation Parameter (SP) or Separation (S) (4,10) provide useful information, but they reference particular unstained or stained cells and do not estimate the minimum dye needed for detection or population resolution. Therefore, we selected the 2+2SD limit of resolution metric (2,5). As illustrated in Figure 1, this is the amount of dye signal added to the background distribution that would yield a positive distribution whose point 2SDs below its mean equals the point 2 backgrounds SDs above the background mean. In practice, rather than try to experimentally identify a signal level meeting the 2+2SD criterion, we calculate it using the other available measurements. In Spe, it can be expressed as
| (1a) |
Figure 1.

Illustration for the 2+2SD “limit of resolution” criterion. The lasers-on background distribution is shown in red. A distribution with added LED signal is shown in blue where the LED level was selected to make the point 2SD below its mean the same as the point 2SD above the background mean. This amount of added signal is defined as the 2+2SD limit of resolution. For comparisons between instruments, the instrument scale units (MFI) were converted to ABD units of a dye appropriate for the measurement channel.
In ABD units
| (1b) |
The derivation for these equations is provided in Supporting Information. From (1b), it is clear that, for high values of Q, 2+2SDABD approaches 4BSDABD and, for low values of Q, it will be higher than 4BSDABD.
We consider 2+2SD to be a much more meaningful and intuitive metric than B for use by cytometrists. The practical benefit of 2+2SD is that it is a fundamental measure of instrument capability that defines a minimum limit of resolution and is not dependent on any particular choice of cell samples or applications. Lower 2+2SD values mean that distributions of negative and low positive events will have less overlap and could, if sorted, be obtained in higher purity with less cross contamination. The 2+2SD limit of resolution values will apply directly to low background samples like most microorganisms and extracellular vesicles (EVs). Particular applications with samples that have substantial autofluorescence or background staining will require a higher amount of dye than the 2+2SD level for good separation, but instruments with lower 2+2SD will always be at least somewhat better than instruments with higher 2+2SD.
Data Evaluation Results, Instrument Comparisons, and Interpretation
All of the instrument data as well as summary spreadsheets, the R script used for the data analysis, output files from the automated analysis procedure (2,8) and supporting information document are available in FlowRepository (11) at https://flowrepository.org/id/FR-FCM-ZZTF.
The evaluation of Q, B, and 2+2SD depends on three measured factors, Spe scale (Spe/MFI), dye bead signal (ABD/MFI), and background SD (BSDMFI) combined as described above. The precision of these measured factors along with FC Bead stability data, determines the uncertainties in the metrics. For Spe scales on instruments with linear electronics, 90% of standard errors (SE) were <3%, and on log amp instruments 85% of SEs were <10%. The SEs of FC Bead means should be <1%, and even acquisitions at higher than specified flow rates give means lowered by <1%. We tested the FC Bead stability and found 12 h retests all within 3%. At 9 and 17 months 90% of samples were within 4% of the initial level with none worse than 10%. Finally, we evaluated the uncertainty in 1,011 nm bead background SD values at <1%. Therefore, we conclude that a large majority of the Q and 2+2SD values in the tables should be accurate to within 10%.
Table 1 shows QABD for each dye on each of the instruments expressed for convenience as Q1000ABD, the number of photoelectrons detected for 1,000 ABD dye units. Q1000ABD values more than 2.5-fold above or below the median are highlighted. The 2+2SD “limit of resolution,” representing the amount of dye needed for clear detection of dye positive events, is shown in Table 2 as 2+2SDABD for all of the dyes and instruments. Entries above twice the median or below half of the median for each dye are highlighted. High Q values result in greater measurement precision and are valuable for minimizing spectral overlap spread in compensated data. The jet-in-air sorters (MoFlo, and two Influxes) have Q1000ABD values far below the median of all instruments. This along with imperfections in the analog log amps, make these instruments a poor choice for applications requiring fluorescence compensation. Due largely to their very low Q values, the MoFlo and Influxes have generally high 2+2SD values although these overlap the lower end of 2+2SD on instruments with immersion optics indicating that the MoFlo and Influxes should be usable for nondemanding measurements. The Xitogen uses avalanche photodiode (APD) detectors and has the highest Q1000ABD value in each of the measurement channels and better than median detection sensitivity on all channels. This should make it an excellent choice for multicolor fluorescence applications. Among the eight LSR-IIs there is not much more than a factor of 2 range in Q1000ABD in some channels and over an order of magnitude in others indicating that something is probably defective in the channels with very low Q1000ABD values. In particular, the identically configured LSR-IIs A-E are generally quite similar with a few defective channels revealed. In 2+2SD, these instruments are matched within a factor of 2 to 3 on most channels except for the high 2+2SD on the V450 and V500-C channels of LSR-II D, which result from very low Q1000ABD values. Evidently, LSR-II G was in need of repair with multiple channels showing very high noise that led to high 2+2SD values.
Table 1.
QSpe as Spe/1000 ABD dye units
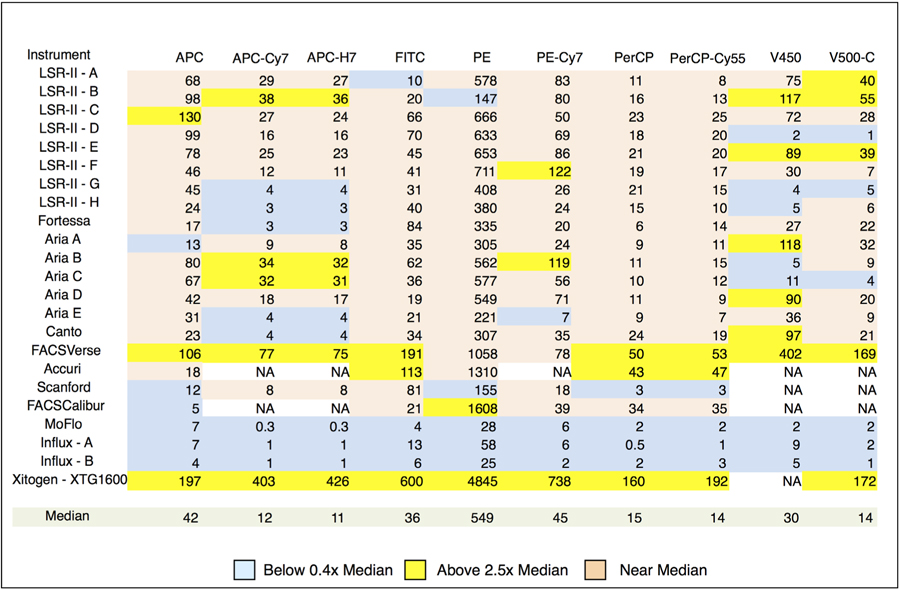 |
Statistical photoelectrons (Spe) per 1000 ABD units of dye (= 1000 × QABD or Q1000ABD) by instrument and measurement channel. The results are color coded to represent low (a), average (c) and high (b) Q values relative to the median for all instruments on that measurement channel. NA indicates measurements that could not be made on the instrument.
Table 2.
ABD units needed to provide 2+2SD separation from background
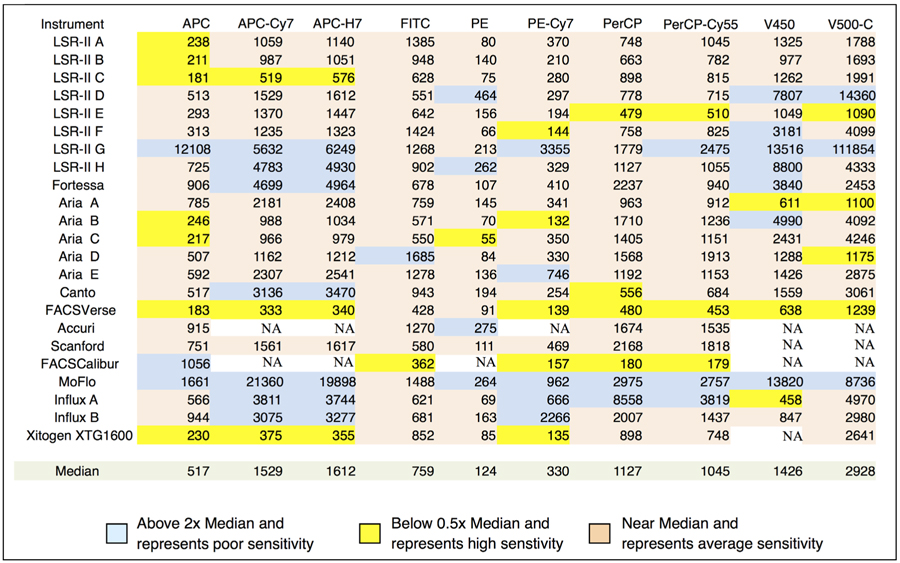 |
Instrument results and comparisons for 2+2SD limit of resolution in ABD units. The results are color coded to represent low (a), average (c) and high (b) sensitivity relative to the median for all instruments on that measurement channel. NA indicates measurements that could not be made on the instrument.
Using the whole set of data for each instrument, we generated robust, useful, and precise instrument evaluations with a standardized process and automated analysis tools. This work points the way to a broader program that would allow cytometrists to evaluate and compare their instruments in a systematic and accurate fashion. Ideally, institutional support will be organized to further develop appropriate materials and procedures for flow cytometer evaluation, provide a resource for consistent analysis of the resulting data and host a publicly accessible archive of instrument evaluation results (within FlowRepository?). Such a project might involve an ISAC working group in collaboration with NIST and companies producing cytometers and the various materials needed. In particular, NIST should have responsibility in coordination with the manufacturing corporations for maintaining the consistency of dye level assignments. Instrument manufacturers could greatly facilitate Spe scale evaluation by installing LEDs at appropriate points (especially in more enclosed systems) and providing software control and processing to automatically evaluate Spe scales.
Supplementary Material
Acknowledgments
The authors thank Ming Yan for initiating and hosting discussions that led to this project and Eric Chase and Robert Hoffman for valuable discussions. We thank BD Biosciences, Spherotech and Thermo Fisher for donating reference particle samples. BD Biosciences and Kevin Holmes made instruments available for the project. Josef Spidlen is an ISAC Mary Lou Ingram Scholar.
Grant sponsor: Natural Sciences and Engineering Research Council of Canada (NSERC); Grant sponsor: NIH Blueprint for Neuroscience Research, Grant number: EB003824; Grant sponsor: NIH, NIAID, Grant number: AI098519; Grant sponsor: U.S. Department of Health and Human Services > National Institutes of Health, Grant number: R01GM118417
Footnotes
Conflicts of Interest
James Wood has a financial interest in the commercialized version of the LED test system (quantiFlash, A.P.E Angewandte Physik, & Elektronik GmbH, Berlin, Germany).
Literature Cited
- 1.Parks DR, El Khettabi F, Chase E, Hoffman RA, Perfetto SP, Spidlen J, Wood JC, Moore WA, Brinkman RR. Evaluating flow cytometer performance with weighted quadratic least squares analysis of LED and multi-level bead data. Cytometry A 2017;91A:232–249. [DOI] [PMC free article] [PubMed] [Google Scholar]
- 2.Maecker HT, Frey T, Nomura L, Trotter J. Selecting fluorochrome conjugates for maximum sensitivity. Cytometry A 2004;62A:169–173. [DOI] [PubMed] [Google Scholar]
- 3.Hoffman RA, Chase ES. Is the blank bead MEF fluorescence sensitivity specification meaningful? CYTO2010 Conference Poster #376. [Google Scholar]
- 4.Hoffman RA, Wood JCS. Characterization of flow cytometry instrument sensitivity. Curr Protoc Cytom Supplement 40 2007;1.20.1–1.20.18. [DOI] [PubMed] [Google Scholar]
- 5.Chase ES, Hoffman RA. Resolution of dimly fluorescent particles: A practical measure of fluorescence sensitivity. Cytometry 1998;33:267–279. [PubMed] [Google Scholar]
- 6.Stoner SA, Duggan E, Condello D, Guerrero A, Turk JR, Narayanan PK, Nolan JP. High sensitivity flow cytometry of membrane vesicles. Cytometry A 2016;89A: 196–206. [DOI] [PubMed] [Google Scholar]
- 7.Futamura K, Sekino M, Hata A, Ikebuchi R, Nakanishi Y, Egawa G, Kabashima K, Watanabe T, Furuki M, Tomura M. Novel full-spectral flow cytometry with multiple spectrally-adjacent fluorescent proteins and fluorochromes and visualization of in vivo cellular movement. Cytometry A 2015;87A:830–842. [DOI] [PMC free article] [PubMed] [Google Scholar]
- 8.Qr Stall A. and Br in BD FACSDivaTM software: Parameters for characterizing detector performance. San Jose, CA: BD Biosciences. BD Biosciences Application Note, June 2012. https://www.bdbiosciences.com/documents/BD_Diva_Qr_Br_AppNote.pdf. [Google Scholar]
- 9.Core Team R. R Foundation for Statistical Computing. R: A Language and Environment for Statistical Computing. Vienna, Austria, 2016. http://www.R-project.org/. [Google Scholar]
- 10.Wood J. Fundamental flow cytometer properties governing sensitivity and resolution. Cytometry 1998;33:260–266. [PubMed] [Google Scholar]
- 11.Spidlen J, Breuer K, Rosenberg C, Kotecha N, Brinkman RR. FlowRepository - Aresource of annotated flow cytometry datasets associated with peer-reviewed publications. Cytometry A 2012;81A(9):727–731. [DOI] [PubMed] [Google Scholar]
Associated Data
This section collects any data citations, data availability statements, or supplementary materials included in this article.