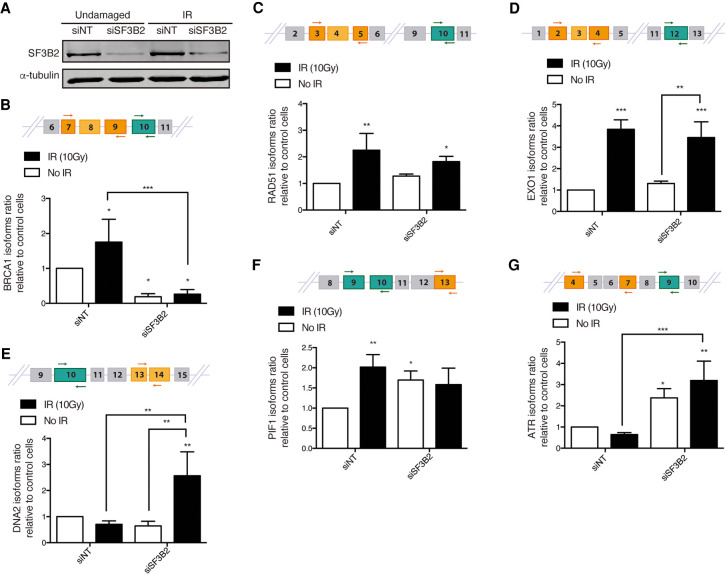
FIGURE 2.
Splicing changes in DDR factors in cells depleted for SF3B2. (A) Representative western blot showing the expression levels of SF3B2 upon depletion with a siRNA against SF3B2 or a control sequence (siNT) in cells exposed or not to 10 Gy of ionizing radiation. α-tubulin blot was used as loading control. (B–G) Specific RNA isoforms levels of the indicated genes were calculated as the ratio between the abundance of the specific splicing form normalized with the total amount of each gene RNA by quantitative RT-PCR using specific primers in cells transfected with the indicated siRNAs and 6 h after irradiation or mock treatment. See Materials and Methods for details. A schematic representation of the splicing events measured is shown in each case on the top. The common splicing event analyzed is shown in green, oligos are represented as arrows. The specific splicing that changes upon SF3B2 depletion is shown in orange. The graphs represent the average and standard deviation of three independent experiments. Statistical significance was calculated using an ANOVA test. (*) P < 0.05, (**) P < 0.01, and (***) P < 0.005.

