

Abstract
Background
The prognostic value of programmed cell death-ligand 1 (PD-L1) in gynecological cancers has been explored previously, but the conclusion remains controversial due to limited evidence. This study aimed to conduct an updated meta-analysis to re-investigate the predictive significance of PD-L1 expression.
Methods
PubMed, EMBASE and Cochrane Library databases were searched. The associations between PD-L1 expression status and prognosis [overall survival (OS), progression-free survival (PFS), recurrence-free survival (RFS), cancer-specific survival (CSS) or disease-free survival (DFS)], clinical parameters [FIGO stage, lymph node metastasis (LNM), tumor size, infiltration depth, lymphovascular space invasion (LVSI) or grade] and response to anti-PD-1/PD-L1 treatment [objective response rate (ORR)] were analyzed by hazard ratios (HR) or relative risks (RR).
Results
Fifty-five studies were enrolled. Overall, high PD-L1 expression was not significantly associated with OS, PFS, RFS, CSS and DFS of gynecological cancers. However, subgroup analysis of studies with reported HR (HR = 1.27) and a cut-off value of 5% (HR = 2.10) suggested that high PD-L1 expression was correlated with a shorter OS of gynecological cancer patients. Further sub-subgroup analysis revealed that high PD-L1 expressed on tumor-infiltrating immune cells (TICs) predicted a favorable OS for ovarian (HR = 0.72), but a poor OS for cervical cancer (HR = 3.44). PD-L1 overexpression was also correlated with a lower OS rate in non-Asian endometrial cancer (HR = 1.60). High level of PD-L1 was only clinically correlated with a shorter PFS in Asian endometrial cancer (HR = 1.59). Furthermore, PD-L1-positivity was correlated with LNM (for overall, ovarian and endometrial cancer expressed on tumor cells), advanced FIGO stage (for overall, ovarian cancer expressed on tumor cells, endometrial cancer expressed on tumor cells and TICs), LVSI (for overall and endometrial cancer expressed on tumor cells and TICs), and increasing infiltration depth/high grade (only for endometrial cancer expressed on TICs). Patients with PD-L1-positivity may obtain more benefit from anti-PD-1/PD-L1 treatment than the negative group, showing a higher ORR (RR = 1.98), longer OS (HR = 0.34) and PFS (HR = 0.61).
Conclusion
Our findings suggest high PD-L1 expression may be a suitable biomarker for predicting the clinical outcomes in patients with gynecological cancers.
Keywords: gynecological cancers, programmed death ligand 1, prognosis, immunotherapy, clinicopathological features
Background
Gynecological cancers have been a significant global health burden for women (1, 2). According to the statistics by the American Cancer Society in 2020, uterine corpus endometrial cancer accounts for approximately 65,620 new cases and 12,590 deaths, followed by ovarian cancer (21,750 new cases and 13,940 deaths) and cervical cancer (13,800 new cases and 4,290 deaths) (3). Although several therapeutic options (i.e. surgery, chemoradiotherapy and immunotherapy) have been recommended recently, some patients exhibit a poor response to these management strategies and experience relapses or metastases, ultimately dying from their diseases (4). Therefore, predictive biomarkers may be urgently necessary to early stratify these patients at a high risk of poor responses and unfavorable outcomes and then guide more individualized treatment regimens to further improve overall survival (OS).
Recently, accumulating evidence has revealed that immune escape represents a crucial hallmark for malignant transformation and tumor progression (5, 6). The programmed death-ligand 1 (PD-L1, also called B7-H1 or CD274)/programmed cell death-1 (PD-1) axis is a major immune checkpoint pathway (7). PD-L1 distributed on tumor cells or tumor-infiltrating immune cells (TICs) can bind with the co-inhibitory molecule PD-1 on T cells and then promote T-cell exhaustion (8). Exhausted CD8+ T cells have significantly reduced cytotoxicity, which facilities the cancer cells escape from T cell-mediated immune surveillance (7, 9). These findings suggest that overexpressed PD-L1 may serve as a potential biomarker to predict the tumor progression, poor prognosis and therapeutic response. This hypothesis has been proved by meta-analyses on several cancers, including gynecological cancer types (10–12). For example, Gu et al., synthesized 7 studies of cervical cancer and found that PD-L1 overexpression was related with poor OS [hazard ratios (HR) = 2.52; 95% confidence interval (CI) =1.09 – 5.83, p = 0.031] in overall or Asian patients and progression-free survival (PFS) (HR = 4.78; 95% CI = 1.77–12.91, p = 0.002) only in Asian subgroup (10). This predictive significance of positive PD-L1 expression for shorter OS (HR = 1.66) and PFS (HR = 2.17) was also demonstrated in a meta-analysis for Asian patients with ovarian cancer (12). Lu et al. reported that PD-L1 expression was significantly associated with poor differentiation (odds ratios = 2.82) and advanced International Federation of Gynecology and Obstetrics (FIGO) stage (odds ratios = 1.71) of endometrial cancer patients (11). However, there was still no meta-analysis to integrate all gynecological cancer types. More importantly, the number of included publications was relatively fewer (all < 10) in these three published meta-analyses of each gynecological cancer type (10–12). Furthermore, the clinical association of PD-L1 was not analyzed for ovarian cancer previously (12); the association of PD-L1 to anti-PD-1/PD-L1 treatment was not investigated in any type; data of tumor cells and TICs were not both collected in endometrial and cervical cancer studies (10, 11) and thus their specific associations could not be performed. Hereby, the predictive performance of PD-L1 for patients with gynecological cancer remains inconclusive.
In the present study, we attempted to conduct an updated meta-analysis based on 55 published evidences to re-investigate the association of PD-L1 expression status in tumor cells and TICs with the prognosis, clinicopathological characteristics and response to anti-PD-1/PD-L1 treatment in gynecological cancer patients.
Materials and Methods
This meta-analysis followed the guidelines of the Preferred Reporting Items for Systematic Review and Meta-analysis (PRISMA). Patient consent and ethical approval were waived because this study collected the data from published articles.
Literature Search
The online databases of the PubMed, the Cochrane Library and Embase were systematically searched up to April, 2020. The following key words were applied for searches: (“gynecological” OR “cervical” OR “ovarian” OR “endometrial”) AND (“cancer” OR “carcinoma” OR “tumor”) AND (“PD-L1” OR “programmed death ligand-1” OR “B7-H1” OR “CD274”). The reference lists in the retrieved papers and relevant reviews were also checked to identify additional publications.
Inclusion and Exclusion Criteria
Two reviewers independently evaluated potential articles. Studies which met the following inclusion criteria were considered eligible: 1) patients were diagnosed as any one type of gynecological cancers by pathological analyses (regardless of epithelial cancers, sarcomas or neuroendocrine tumors); 2) tumor samples for detection of PD-L1 expression were collected during primary tumor removal surgery or diagnostic biopsy before any treatment (such as neoadjuvant chemotherapy, PD-1/PD-L1 inhibitor); 3) the protein expression of PD-L1 on tumor cells or TICs of cancer tissues was determined using immunohistochemistry (IHC); 4) prognosis [OS, PFS, recurrence-free survival (RFS), cancer-specific survival (CSS) or disease-free survival (DFS)], clinicopathological parameters [FIGO stage, lymph node metastasis (LNM), tumor size, depth of infiltration, lymphovascular space invasion (LVSI), FIGO grade] and therapeutic response outcomes [objective response rate (ORR)] were compared between groups with high (positive) and low (negative) expression of PD-L1; 5) HR or relative risks (RR) as well as 95% CI values could be directly extracted, indirectly calculated using raw data or estimated from Kaplan–Meier curve; and 6) the studies were published in English and full-text. Studies were excluded if they were: 1) duplicate articles; 2) case reports, reviews, meeting abstracts, comments or letters; 3) studies evaluating the expression of PD-L1 at mRNA levels or at protein levels using other methods; 4) studies measuring the expression of PD-L1 after treatment; 5) studies having no usable data to estimate HRs and 95%CIs; 6) studies focusing on other cancers; and 7) studies written in other languages. Any disagreements were solved by discussion.
Data Extraction and Quality Assessment
Two researchers independently extracted the following data from each study: name of the first author, year of publication, country, population number, cancer type, clinicopathological features, prognostic endpoint, treatment, IHC detection area/antibody type/antibody source/IHC counting method/cut-off point for PD-L1, HRs with 95% CIs and their statistical analysis approach. Multivariable analysis results were preferentially extracted to obtain HRs and 95%CIs; otherwise, univariate analysis results were collected. The survival data in the Kaplan-Meier curves were read using a digitizing software-Engauge Digitizer 4.1. Any disputes were resolved through discussion.
The quality of included studies was assessed using the Newcastle-Ottawa Scale (NOS) (13) that consists of three key domains: selection, comparability and outcomes or exposure. Total NOS score ranged from 0 to 9. Studies with the final score > 6 were considered to have a high methodological quality.
Statistical Analysis
All data analyses were achieved with STATA 13.0 software (STATA Corporation, College Station, TX, USA). HRs with 95% CIs from each study were pooled to determine the association of PD-L1 expression with the prognostic indicators; while RRs with 95% CIs were utilized to measure the correlation of PD-L1 expression with clinicopathological factors and ORR. HR or RR > 1 indicated a poorer prognosis or higher degree of malignancy in patients with high PD-L1 expression. Association difference was analyzed using z test (p < 0.05). Heterogeneity across studies was quantified by using the Q-test and I2 statistic. P < 0.10 and I2 > 50% were set as the threshold for defining the studies with significant heterogeneity. A random-effect model was chosen to compute the pooled HR (or RR) for variables from studies with heterogeneity. A fixed-effect model was adopted for studies without evidence of heterogeneity. Egger’s linear regression test (14) was used to detect the publication bias. If bias was seen (p < 0.05), “trim and fill” algorithm (15) was chosen for adjustment of HRs (RRs). Subgroup analysis was also carried out according to study country, sample size, cancer type, IHC detection area, antibody type, antibody source, IHC counting method, cut-off value, HR source and statistical approach to investigate possible causes of heterogeneity. Sensitivity analysis was performed via omitting any one study at a time. P-values and 95% CIs were two-sided.
Results
Study Selection
Figure 1 outlines the flowchart of the literature collection process. A total of 4,882 records were initially identified through searching the electronic database. After removal of 3,502 duplicate records, the titles and abstracts of 1,380 studies were read. Consequently, 1,312 articles were excluded because of they were: case reports (n = 31), meta/review (n = 47), animal studies (n = 93), studies investigating other cancers (n = 759), irrelevant topics (n = 208), without survival or other clinical outcomes (n = 172) and published in other languages (n = 2). After reviewing 68 full-text articles in detail, 16 studies were further removed since sufficient data were not provided for analysis (n = 8), IHC method was not used for detection of PD-L1 protein expression (n = 5) or the samples were collected after treatment (n = 3). Additional 3 studies were supplemented through checking the references of reviews. Finally, 55 studies were eligible for the meta-analysis (16–70).
Figure 1.

Flowchart of the study inclusion process.
Characteristics of the Included Studies
Table 1 shows the characteristics of all the included studies. The publication years ranged from 2007 to 2020 and 61.8% (34/55) of them were published within 2019 and 2020. Fourteen studies were performed in China, nine were in the USA, eight were in Japan, four in Korea, each three in Thailand, Turkey, each two in Canada, France, Germany and each one in Norway, Belgium, Brazil, Denmark, Egypt, Greece, Sweden and UK. Twenty-three studies explored the association of PD-L1 with clinical outcomes in ovarian cancer patients, 15 focused on cervical cancer and 14 investigated endometrial cancer. Ovarian and endometrial cancer patients were both enrolled in two studies, while cervical and endometrial cancer patients were both collected in one study. The prognostic endpoint was OS in 38 studies, PFS in 20 studies, RFS in 2 studies, CSS in 6 studies and DFS in 5 studies. FIGO stage (II-IV vs I or III-IV vs I-II) was compared between the groups with high and low expression of PD-L1 in 27 studies; tumor size (≥40 mm vs < 40 mm) was described in 5 studies; LNM (yes vs no) was reported in 16 studies; infiltration depth (≥ 1/2 vs <1/2) was analyzed in 7 studies; LVSI (yes vs no) was observed in 14 studies; FIGO grade was explored in 13 studies. One thing should be noted that tumor cells and TICs were both analyzed and the different IHC counting methods (cut-off points) were applied in some studies, which led to more datasets used for analysis of the prognostic and clinical significance of PD-L1 compared with the actual number of papers ( Table S1 ). The patients in most of these studies underwent surgery, radiotherapy and/or chemotherapy with routine drugs, while six studies specifically explored the efficacy of anti-PD-1/PD-L1 antibodies (pembrolizumab, atezolizumab, nivolumab) for the treatment of gynecological cancers (65–70). The association of PD-L1 expression status with ORR, OS and PFS to these anti-PD-1/PD-L1 immune checkpoint inhibitors was also investigated in these six studies (65–70). The NOS scores of all included studies were > 6, suggesting the methodological quality was high for all of them ( Table S2 ).
Table 1.
Characteristics of included studies.
| Study | Year | Country | No. | Cancer type | Clinical endpoint | Clinicopathological factors | HR for survival analysis | PD-L1 expression | |||
|---|---|---|---|---|---|---|---|---|---|---|---|
| Calculation method | Source | Detected area by IHC | IHC counting method | Cut-off value | |||||||
| Wang S (16) | 2018 | China | 90 | CC | OS, PFS | LVSI, FIGO stage, infiltration depth, LNM, tumor size | UV | Reported | Tumor cells | IRS | H-score of 100 |
| Enwere EK (17) | 2017 | Canada | 120 | CC | OS, PFS | FIGO stage, LNM | UV | Reported | Tumor cells | SP, SI | Median percentage, Median tAQUA score |
| Feng M (18) | 2018 | China | 219 | CC | OS | LVSI, infiltration depth; LNM, grade, tumor size | UV | Estimated | Tumor cells, TICs | SP | >5% |
| Kim M (19) | 2017 | Korea | 27 | CC | OS, PFS | LVSI, LNM | UV | Estimated | Tumor cells | SP | >1% |
| Iijima M (20) | 2020 | Japan | 33 | CC | OS, PFS | FIGO stage, LNM | UV | Estimated | Tumor cells | SP | >1% |
| Tsuchiya T (21) | 2020 | Japan | 104 | CC | OS | FIGO stage, LNM |
UV | Reported | Tumor cells, TICs | SI | Score (tumor cells, 0; TICs, 3) |
| Kawachi A (22) | 2018 | Japan | 148 | CC | DFS | LVSI, LNM, tumor size | UV | Estimated | Tumor cells | SP | >5% |
| Loharamtaweethong K (23) | 2019 | Thailand | 171 | CC | RFS, CSS | UV (CSS), MV (RFS) | Reported | Tumor cells | SP | >5% | |
| Miyasaka Y (24) | 2020 | Japan | 71 | CC | OS, PFS | MV | Reported | Tumor cells | SP | >1% | |
| Chen H (25) | 2020 | China | 222 | CC | OS, DFS | MV | Reported | Tumor cells, TICs | SP | Tumor cells, >1%; TICs, >5% | |
| Lippens (26) | 2020 | Belgium | 38 | CC | CSS | UV | Estimated | TICs | SP | >5% | |
| Karim R (27) | 2009 | USA | 115 | CC | OS | LVSI, LNM, tumor size | UV | Estimated | Tumor cells | SP | >0% |
| Loharamtaweethong K (28) | 2019 | Thailand | 153 | CC | RFS, CSS | FIGO stage, LNM, tumor size | UV | Estimated | Tumor cells | SP | >10% |
| Grochot RM (29) | 2019 | Brazil | 59 | CC | OS, PFS | UV | Estimated | Tumor cells | SP | >0% | |
| Xu M (30) | 2016 | China | 112 | OC | FIGO stage, grade | Tumor cells | IRS | Score > 4 | |||
| Nhokaew W (31) | 2019 | Thailand | 92 | OC | DFS | UV | Estimated | Tumor cells | SI | Score > 2 | |
| Schmoeckel E (32) | 2019 | Germany | 288 | OC | OS | MV | Reported | Tumor cells | SP | >1% | |
| Hamanishi J (33) | 2007 | Japan | 50 | OC | OS, PFS | FIGO stage, LNM | MV | Reported | Tumor cells | SI | Score > 1 |
| Mesnage SJL (34) | 2017 | France | 50 | OC | PFS | UV | Reported | TICs | SP | >5% | |
| Zhu J (35) | 2017 | China | 122 | OC | OS, PFS | FIGO stage | MV | Reported | Tumor cells | SP | >10% |
| Zhu J (36) | 2017 | China | 19 | OC | OS | FIGO stage | UV | Estimated | Tumor cells | SP | >10% |
| Zong L (37) | 2020 | China | 146 | OC | OS, PFS | UV | Estimated | CP | SP | >1% | |
| Wang Q (38) | 2017 | China | 107 | OC | OS | FIGO stage | MV (tumor cells), UV (TICs) | Reported | Tumor cells, TICs | SP | >5% |
| Zhu X (39) | 2018 | China | 112 | OC | OS | FIGO stage, LNM, grade | UV | Estimated | Tumor cells | SP (or SI) | >10% (or score > 1) |
| Buderath P (40) | 2019 | Germany | 179 | OC | OS | UV | Estimated | TICs | SP | >0% | |
| Kim KH (41) | 2019 | Korea | 248 | OC | OS | FIGO stage, grade | MV | Reported | Tumor cells, TIC | SP + SI | >5% + score > 2 |
| Zhu X (42) | 2019 | China | 112 | OC | OS, DFS | FIGO stage, LNM, grade | UV | Reported | Tumor cells | SP (or SI) | >10% (or score > 1) |
| Zhang L (43) | 2019 | China | 124 | OC | OS, PFS | FIGO stage, LNM, grade | MV | Reported | Tumor cells | IRS | Score > 3 |
| Alldredge J (44) | 2019 | USA | 46 | OC/EC | OS | FIGO stage | UV | Reported | Tumor cells, TIC |
Tumor cells, SP; CPS, IRS | Tumor cells, >0%; CPS, score > 1 |
| De La Motte Rouge T (45) | 2019 | France | 51 | OC | OS, DFS | UV | Reported | Tumor cells | Other | > 1000 | |
| Martin de la Fuente L (46) | 2020 | Sweden | 130 | OC | OS | MV | Reported | TICs | SP | > 1% | |
| Chatterjee J (47) | 2017 | UK | 48 | OC | PFS | UV | Reported | TICs | SI | Median score | |
| Henriksen JR (48) | 2020 | Denmark | 283 | OC | OS | FIGO stage | MV | Reported | Tumor cells | SP | > 1% |
| Sungu N (49) | 2019 | Turkey | 127 | EC | OS | LVSI, FIGO stage, grade | UV | Estimated | Tumor cells, TICs | SI + SP | Score > 2 (≥ 1%) |
| Vagios S (50) | 2019 | Greece | 101 | EC | OS, PFS | LVSI, FIGO stage, infiltration depth, LNM | MV | Reported | Tumor cells | SP | > 1% |
| Kucukgoz Gulec U (51) | 2019 | Turkey | 53 | EC | OS | MV | Reported | Tumor cells | SP | > 5% | |
| Zhang S (52) | 2020 | Japan | 221 | EC | OS | LVSI, FIGO stage, infiltration depth, FIGO grade | MV | Reported | Tumor cells, TICs | IRS, SI | TC, score > 0; TICs, score > 4 |
| Kim J (53) | 2018 | Korea | 183 | EC | OS, PFS | LVSI, FIGO stage, infiltration depth, grade | UV (tumor cells), MV (TICs) | Reported | Tumor cells, TICs | SI | > 1.977 |
| Jones TE (54) | 2021 | USA | 43 | EC | OS | FIGO stage | UV | Reported | CP | SP | > 5% |
| Kucukgoz Gulec U (55) | 2020 | Turkey | 59 | EC | OS | MV | Reported | Tumor cells | SP | >5% | |
| Tawadros AIF (56) | 2018 | Egypt | 95 | EC | LVSI, FIGO stage, infiltration depth, LNM, grade | Tumor cells | IRS | Score >3 | |||
| Li ZB (57) | 2017 | USA | 700 | EC | CSS | LVSI | UV | Estimated | Tumor cells, TICs | SP | >1% |
| Mo ZF (58) | 2016 | China | 75 | EC | LVSI, FIGO stage | Tumor cells, TICs | IRS | >5% | |||
| Yamashita H (59) | 2018 | Japan | 149 | EC | OS, PFS | UV | Estimated | Tumor cells | SP | >5% | |
| Engerud H (60) | 2020 | Norway | 700 | EC | CSS | FIGO stage, infiltration depth, grade | UV | Estimated | Tumor cells | IRS | Score >0 |
| Crumley S (61) | 2019 | USA | 132 | EC | LVSI, FIGO stage, infiltration depth, LNM | Tumor cells | SI + SP | Score >2 + ≥ 0%; Score >3 + > 2% | |||
| Li MJ (62) | 2017 | China | 113 | OC | OS | FIGO stage | UV (DFS), MV (OS) | Reported | Tumor cells | IRS | Score >2 |
| Webb JR (63) | 2016 | Canada | 479 | OC | CSS | FIGO stage, grade | MV (HGSC), UV (other) | Reported, estimated | CP | SI | Score >1 |
| Xue CY (64) | 2020 | China | 77 | OC | OS, PFS | FIGO stage, grade | MV (OS), UV KM (PFS) | Reported | Tumor cells | IRS | H-score of 100 |
| Chung HC (65) | 2019 | Korea | 98 | CC | OS, PFS, ORR | UV | Estimated | CP | SI | Score >1 | |
| Liu JF (66) | 2019 | USA | 12/15 | OC/EC | OS, PFS, ORR | UV | Estimated | TICs | SI | Score >1 | |
| Matulonis UA (67) | 2019 | USA | 338 | OC | ORR | CP | SI | Score >1 | |||
| Zamarin D (68) | 2020 | USA | 52 | OC | PFS, ORR | UV | Reported | Tumor cells, TICs | SP | Tumor cells, > 1%; TICs, > 1% or 10% | |
| Santin AD (69) | 2020 | USA | 22 | EC | ORR | CP | SI | score >1 | |||
| Tamura K (70) | 2019 | Japan | 44 | CC,EC | OS, PFS, ORR | UV | Estimated | Tumor cells | SP | >1% | |
OS, overall survival; PFS, progression free survival; RFS, recurrence-free survival; CSS, cancer-specific survival; DFS, disease-free survival; FIGO, International Federation of Gynecology and Obstetrics; LNM, lymph node metastasis; LVSI, lymphovascular space invasion; ORR, overall response rate; KM, Kaplan–Meier curve; UV, univariate analysis; MV, multivariate analysis; SP, staining percentage; SI, staining intensity score; IRS, immunoreactive SI (that is, IRS = SI × SP); IHC, immunohistochemistry; TICs, tumor-infiltrating immune cells; CPS, combined positive; estimated, the HR was obtained from Kaplan–Meier curve; HGSC, high-grade serous ovarian cancer.
Association Between Programmed Cell Death-Ligand 1 Expression and Survival
Overall Analysis in All Gynecological Cancers
Fifty-one datasets ( Table S1 ) reported the predictive values of PD-L1 for OS in all gynecological cancers. The random-effects model was chosen because of significant heterogeneity (I2 = 71.7%, p = 0.000). The results of the meta-analysis indicated no significant association of PD-L1 expression with OS (HR = 1.13; 95% CI: 0.91 – 1.39, p = 0.263). Data on PFS were extracted from 26 datasets ( Table S1 ). The pooled results showed that PD-L1 expression was not significantly associated with PFS (HR = 1.04; 95% CI: 0.85 – 1.29, p = 0.682) under a random-effect model (I2 = 63.7%, p = 0.000). Meta-analysis using the corresponding datasets also demonstrated that positive expression of PD-L1 was not related to RFS (n = 2; HR = 1.08; 95% CI: 0.64 – 1.83, p = 0.778; I2 = 0%, p = 0.746), DFS (n = 6: HR = 1.26; 95% CI: 0.60 – 2.64, p = 0.545; I2 = 81.5%, p = 0.000) and CSS (n = 10: HR = 0.81; 95% CI: 0.65 – 1.01, p = 0.056; I2 = 28.8%, p = 0.180).
Subgroup Analysis in All Gynecological Cancers
To further investigate the possible prognostic potential of PD-L1 in gynecological cancers, the subgroup analysis was performed. The results showed that, in studies with reported HR, high PD-L1 expression was correlated with shorter OS (n = 33: HR = 1.27; 95% CI: 1.01 – 1.61, p = 0.041) ( Figure 2 ; Table 2 ). Furthermore, PD-L1-positive status with a cut-off value of 5% predicted a poor OS (n = 8: HR = 2.10; 95% CI: 1.17 – 3.75, p = 0.013), but not 1% or others ( Table 2 ). Although a significant association between PD-L1 and PFS was also observed in analyses of non-Asian population (n = 10: HR = 1.04; 95% CI: 1.00 – 1.07, p = 0.040) ( Figure 3 ; Table 3 ), the corresponding HR was relatively lower and approximated to 1, indicating the clinical relevance of PD-L1 expression with PFS may be insignificant. The conclusions of PFS from estimated HR may be undetermined, although it was significant (p = 0.001). Owing to the small number of included studies, subgroup analysis was not performed for RFS, DFS and CSS.
Figure 2.

Forest plots showing the significant association between high PD-L1 expression and a poor overall survival (OS) in all gynecological cancers patients by analysis of the studies with reported HR. HR, hazard ratio; CI, confidence interval.
Table 2.
Subgroup analysis on the outcome of OS.
| Comparison | Studies | HR(95%CI) | Pz-value | I2 | PH-value | |
|---|---|---|---|---|---|---|
| Region | Asian | 32 | 1.22(0.88,1.68) | 0.237 | 76.1 | 0.000 |
| Non-Asian | 19 | 1.05(0.81,1.37) | 0.699 | 61.5 | 0.000 | |
| Sample size | <100 | 20 | 1.09(0.72,1.64) | 0.694 | 73.2 | 0.000 |
| >100 | 31 | 1.15(0.90,1.48) | 0.265 | 71.5 | 0.000 | |
| IHC counting method | SI | 12 | 0.97(0.52,1.79) | 0.922 | 72.7 | 0.000 |
| SP | 32 | 1.21(0.93,1.56) | 0.158 | 72.5 | 0.000 | |
| IRS | 6 | 1.14(0.69,1.89) | 0.598 | 72.5 | 0.003 | |
| Other | 1 | 0.37(0.09,1.56) | 0.176 | – | – | |
| Cut-off values |
1% | 13 | 0.96(0.66,1.46) | 0.939 | 60.7 | 0.002 |
| 5% | 8 | 2.10(1.17,3.75) | 0.013 | 75.9 | 0.000 | |
| Others | 30 | 0.99(0.77,1.28) | 0.949 | 67.1 | 0.000 | |
| Cancer type | Ovarian | 22 | 1.02(0.80,1.30) | 0.884 | 69.9 | 0.000 |
| Cervical | 16 | 1.31(0.76,2.27) | 0.338 | 81.3 | 0.000 | |
| Endometrial | 13 | 1.23(0.77,1.98) | 0.381 | 50.0 | 0.020 | |
| Antibody type | Monoclonal | 48 | 1.09(0.87,1.36) | 0.447 | 71.8 | 0.000 |
| Unclear | 3 | 1.94(0.77,4.88) | 0.161 | 75.2 | 0.018 | |
| Antibody source | Mouse | 8 | 1.27(0.64,2.54) | 0.495 | 81.9 | 0.000 |
| Rabbit | 40 | 1.07(0.85,1.35) | 0.566 | 69.0 | 0.000 | |
| Unclear | 3 | 1.94(0.77,4.88) | 0.161 | 75.2 | 0.018 | |
| IHC detection area | Tumor cells | 31 | 1.32(0.99,1.74) | 0.052 | 69.6 | 0.000 |
| TICs | 16 | 0.94(0.66,1.34) | 0.751 | 63.5 | 0.000 | |
| Tumor cells + TICs | 4 | 0.75(0.34,1.63) | 0.463 | 85.0 | 0.000 | |
| HR method | MV | 21 | 1.34(0.94,1.91) | 0.103 | 75.3 | 0.000 |
| UV | 30 | 1.01(0.77,1.32) | 0.958 | 69.5 | 0.000 | |
| HR source | Reported | 33 | 1.27(1.01,1.61) | 0.041 | 66.1 | 0.000 |
| Estimated | 18 | 0.86(0.55,1.35) | 0.513 | 78.2 | 0.000 | |
OS, overall survival; UV, univariate analysis; MV, multivariate analysis; SP, staining percentage; SI, staining intensity score; IRS, immunoreactive SI (that is, IRS = SI × SP); HR, hazard ratio; CI, confidence interval; IHC, immunohistochemistry; TICs, tumor-infiltrating immune cells. PZ, p-value for association; PH, p-value for heterogeneity obtained by Q-test; I2, the degree of heterogeneity by I2 statistic. Bold indicated the significance after analysis of two or more than two studies (p < 0.05).
Figure 3.

Forest plots showing the significant association between PD-L1 expression and a shorter progression-free survival (PFS) in all gynecological cancers patients from non-Asian countries. HR, hazard ratio; CI, confidence interval.
Table 3.
Subgroup analysis on the outcome of PFS.
| Comparison | Studies | HR(95%CI) | Pz-value | I2 | PH-value | |
|---|---|---|---|---|---|---|
| Region | Asian | 16 | 1.30(0.86,1.97) | 0.209 | 75.8 | 0.000 |
| Non-Asian | 10 | 1.04(1.00,1.07) | 0.040 | 0.0 | 0.670 | |
| Sample size | <100 | 16 | 0.98(0.72,1.34) | 0.921 | 70.4 | 0.000 |
| >100 | 10 | 1.14(0.83,1.56) | 0.423 | 50.4 | 0.033 | |
| IHC counting method | SI | 8 | 1.22(0.73,2.05) | 0.451 | 77.3 | 0.000 |
| SP | 15 | 0.89(0.74,1.08) | 0.226 | 0.0 | 0.478 | |
| IRS | 3 | 2.22(0.75,6.53) | 0.149 | 87.7 | 0.000 | |
| Cut-off values |
1% | 8 | 0.75(0.55,1.02) | 0.065 | 0.0 | 0.669 |
| 5% | 2 | 0.76(0.43,1.36) | 0.361 | 0.0 | 0.947 | |
| Others | 16 | 1.25(0.94,1.65) | 0.120 | 74.4 | 0.000 | |
| Cancer type | Ovarian | 10 | 1.14(0.87,1.49) | 0.360 | 62.0 | 0.005 |
| Cervical | 9 | 0.87(0.54,1.39) | 0.561 | 68.6 | 0.001 | |
| Endometrial | 7 | 1.27(0.70,2.30) | 0.431 | 56.1 | 0.034 | |
| Antibody type | Monoclonal | 22 | 0.95(0.73,1.22) | 0.665 | 52.1 | 0.002 |
| Unclear | 4 | 1.65(0.90,3.01) | 0.106 | 86.3 | 0.000 | |
| Antibody source | Mouse | 3 | 0.79(0.26,2.41) | 0.684 | 85.7 | 0.001 |
| Rabbit | 19 | 0.99(0.79,1.24) | 0.894 | 28.5 | 0.120 | |
| Unclear | 4 | 1.65(0.90,3.01) | 0.106 | 86.3 | 0.000 | |
| IHC detection area | Tumor cells | 17 | 1.16(0.86,1.56) | 0.337 | 59.8 | 0.001 |
| TICs | 7 | 1.05(0.68,1.61) | 0.830 | 54.4 | 0.041 | |
| Tumor cells + TICs | 2 | 0.60(0.29,1.24) | 0.167 | 75.7 | 0.043 | |
| HR method | MV | 7 | 1.46(0.82,2.62) | 0.201 | 68.4 | 0.004 |
| UV | 19 | 0.95(0.76,1.20) | 0.661 | 62.3 | 0.000 | |
| HR source | Reported | 16 | 1.29(1.00,1.67) | 0.052 | 67.1 | 0.000 |
| Estimated | 10 | 0.65(0.50,0.84) | 0.001 | 3.3 | 0.409 | |
OS, overall survival; UV, univariate analysis; MV, multivariate analysis; SP, staining percentage; SI, staining intensity score; IRS, immunoreactive SI (that is, IRS = SI × SP); HR, hazard ratio; CI, confidence interval; IHC, immunohistochemistry; TIC, tumor-infiltrating immune cells. PZ, p-value for association; PH, p-value for heterogeneity obtained by Q-test; I2, the degree of heterogeneity by I2 statistic. Bold indicated the significance after analysis of two or more than two studies (p < 0.05).
Sub-Subgroup Analysis in Each Cancer Type
In addition, non-significant relationships were seen between PD-L1 and OS/PFS in any type of gynecological cancers ( Tables 2 and 3 ). To further explore whether PD-L1 expression may be a significant prognostic factor for specific gynecological cancer type, the sub-subgroup analysis was also conducted. The results revealed that PD-L1 overexpression on TICs predicted a favorable OS for ovarian cancer (n = 8: HR = 0.72; 95% CI: 0.59 – 0.87, p = 0.001; Figure 4A ); while predicted a shorter OS for cervical cancer patients (n = 3: HR = 3.44; 95% CI: 1.78 – 6.66, p = 0.000) ( Table S3 ). Also, the positive association between PD-L1 expression and OS in cervical cancer patients was proved in studies with reported HR (n = 8: HR = 1.89; 95% CI: 1.06 – 3.36, p = 0.031) and sample size > 100 (n = 9: HR = 1.92; 95% CI: 1.07 – 3.45, p = 0.030), further increasing the credibility to use PD-L1 as the prognostic biomarker for cervical cancer ( Table S3 ). Likewise, PD-L1 overexpression was correlated with a lower OS rate in non-Asian individuals with endometrial cancer (n = 7: HR = 1.60; 95% CI: 1.07 – 2.40, p = 0.022) ( Table S3 ). The cut-off value of 5% may be optimal (n = 3: HR = 2.37; 95% CI: 1.35 – 4.18, p = 0.003) compared with 1% and others ( Table S3 ). The association between PD-L1 expression and PFS may be clinically significant only in the Asian endometrial cancer patients (n = 5: HR = 1.59; 95% CI: 1.01 – 2.51, p = 0.045) ( Table S4 ), but not in cervical cancer because the pooled HR was obtained from estimated HR in most of individual studies ( Table S1 ) or in ovarian cancer because the pooled HR approximated to 1 ( Table S4 ).
Figure 4.

Forest plots showing the association of PD-L1 expression for ovarian cancer patients. (A) PD-L1 expression on tumor-infiltrating immune cells and overall survival (OS). (B) PD-L1 expression on tumor cells and LNM. (C) PD-L1 expression on tumor cells and FIGO stage. FIGO, International Federation of Gynecology and Obstetrics; LNM, lymph node metastasis; HR, hazard ratio; RR, relative risk; CI, confidence interval.
Association of Programmed Cell Death-Ligand 1 Expressions With Clinicopathological Characteristics
Overall Analysis in All Gynecological Cancers
As shown in Table 4 , the overall pooled results showed that PD-L1 overexpression correlated with LNM (n = 21: RR = 1.23; 95% CI = 1.09 – 1.51, p = 0.003), advanced FIGO stage (III–IV vs I-II) (n = 34: RR = 1.18; 95% CI = 1.05 – 1.32, p = 0.007) and LVSI (n = 20: RR = 1.26; 95% CI = 1.05 – 1.57, p = 0.034).
Table 4.
Correlations between PD-L1 expression and clinical characteristics.
| Comparison | Studies | RR(95%CI) | P-value | I2 | P-value | ||
|---|---|---|---|---|---|---|---|
| LNM (yes vs no) |
Overall | 21 | 1.23(1.09,1.51) | 0.003 | 42.2 | 0.022 | |
| Cancer type | Ovarian | 4 | 1.70(1.23,2.34) | 0.001 | 51.2 | 0.105 | |
| Cervical | 11 | 1.03(0.83,1.27) | 0.792 | 29.3 | 0.167 | ||
| Endometrial | 6 | 1.85(1.17,2.91) | 0.008 | 46.3 | 0.097 | ||
| IHC detection area (overall) | Tumor cells | 19 | 1.33(1.12,1.59) | 0.001 | 42.5 | 0.027 | |
| TICs | 2 | 0.98(0.64,1.49) | 0.907 | 48.2 | 0.165 | ||
| IHC detection area (ovarian) | Tumor cells | 4 | 1.70(1.23,2.33) | 0.001 | 51.2 | 0.105 | |
| IHC detection area (cervical) | Tumor cells | 9 | 1.05(0.82,1.33) | 0.725 | 33.7 | 0.148 | |
| TICs | 2 | 0.98(0.64,1.49) | 0.907 | 48.2 | 0.165 | ||
| IHC detection area (endometrial) | Tumor cells | 6 | 1.85(1.17,2.91) | 0.008 | 46.3 | 0.097 | |
| Tumor size (≥4 cm vs < 4 cm) |
Overall | 6 | 1.05(0.86,1.29) | 0.637 | 23.7 | 0.256 | |
| Cancer type | Cervical | 6 | 1.05(0.86,1.29) | 0.637 | 23.7 | 0.256 | |
| IHC detection area (overall) | Tumor cells | 5 | 1.11(0.90,1.37) | 0.339 | 10.6 | 0.346 | |
| TICs | 1 | 0.61(0.24,1.51) | 0.283 | – | – | ||
| FIGO stage (III-IV vs I-II) |
Overall | 34 | 1.18(1.05,1.32) | 0.007 | 55.0 | 0.000 | |
| Cancer type | Ovarian | 21 | 1.14(1.01,1.29) | 0.039 | 57.7 | 0.001 | |
| Cervical | 2 | 1.85(0.97,3.54) | 0.061 | 0.0 | 0.764 | ||
| Endometrial | 11 | 1.30(0.95,1.77) | 0.106 | 53.3 | 0.018 | ||
| IHC detection area (overall) | Tumor cells | 23 | 1.21(1.07,1.37) | 0.003 | 42.5 | 0.017 | |
| TICs | 4 | 1.22(0.85,1.76) | 0.279 | 82.5 | 0.001 | ||
| Tumor cells + TICs | 7 | 0.89(0.65,1.22) | 0.470 | 0.0 | 0.656 | ||
| IHC detection area (ovarian) | Tumor cells | 14 | 1.23(1.12,1.36) | 0.000 | 33.1 | 0.110 | |
| TICs | 2 | 0.94(0.86,1.04) | 0.254 | 66.5 | 0.084 | ||
| Tumor cells + TICs | 5 | 0.82(0.56,1.19) | 0.295 | 0.0 | 0.412 | ||
| IHC detection area (cervical) | Tumor cells | 2 | 1.85(0.97,3.54) | 0.061 | 0.0 | 0.764 | |
| IHC detection area (endometrial) | Tumor cells | 7 | 1.10(0.88,1.37) | 0.412 | 60.5 | 0.019 | |
| TICs | 2 | 1.72(1.16,2.54) | 0.007 | 0.0 | 0.605 | ||
| Tumor cells + TICs | 2 | 0.98(0.54,1.77) | 0.928 | 0.0 | 0.736 | ||
| FIGO stage (II-IV vs I) |
Overall | 8 | 1.34(0.83, 2.16) | 0.233 | 81.0 | 0.000 | |
| Cancer type | Endometrial | 4 | 2.90(1.70,4.94) | 0.000 | 0.0 | 0.688 | |
| Cervical | 4 | 0.87(0.57,1.34) | 0.520 | 79.1 | 0.002 | ||
| IHC detection area (overall) | Tumor cells | 5 | 1.33(0.71,2.47) | 0.371 | 85.5 | 0.000 | |
| TICs | 3 | 1.77(0.45,6.96) | 0.417 | 78.6 | 0.009 | ||
| IHC detection area (cervical) | Tumor cells | 3 | 0.89(0.71,1.12) | 0.336 | 85.6 | 0.001 | |
| TICs | 1 | 0.73(0.51,1.05) | 0.093 | – | – | ||
| IHC detection area (endometrial) | Tumor cells | 2 | 2.96(1.58,5.55) | 0.001 | 0.0 | 0.454 | |
| TICs | 2 | 3.47(1.23,9.83) | 0.019 | 0.0 | 0.340 | ||
| Infiltration depth (≥ 1/2 vs <1/2) |
Overall | 9 | 1.27(0.99,1.63) | 0.058 | 78.1 | 0.000 | |
| Cancer type | Cervical | 1 | 1.12(0.96,1.30) | 0.150 | – | – | |
| Endometrial | 8 | 1.34(0.96,1.87) | 0.082 | 80.8 | 0.000 | ||
| IHC detection area (overall) | Tumor cells | 7 | 1.15(0.88,1.49) | 0.316 | 76.3 | 0.000 | |
| TICs | 2 | 1.77(1.33,2.35) | 0.000 | 0.0 | 0.852 | ||
| IHC detection area (endometrial) | Tumor cells | 6 | 1.03(0.89,1.19) | 0.692 | 79.4 | 0.000 | |
| TICs | 2 | 1.77(1.33,2.35) | 0.000 | 0.0 | 0.852 | ||
| LVSI (yes vs no) |
Overall | 20 | 1.26(1.02,1.57) | 0.034 | 69.5 | 0.000 | |
| Cancer type | Cervical | 6 | 0.91(0.77,1.09) | 0.296 | 0.0 | 0.450 | |
| Endometrial | 14 | 1.51(1.15,2.00) | 0.004 | 68.2 | 0.000 | ||
| IHC detection area (overall) | Tumor cells | 13 | 1.25(0.95,1.64) | 0.118 | 70.4 | 0.000 | |
| TICs | 6 | 1.41(0.95,2.10) | 0.092 | 64.6 | 0.015 | ||
| Tumor cells + TICs | 1 | 0.92(0.58,1.44) | 0.700 | – | – | ||
| IHC detection area (cervical) | Tumor cells | 5 | 0.92(0.76,1.11) | 0.373 | 8.8 | 0.356 | |
| TICs | 1 | 0.80(0.50,1.28) | 0.354 | – | – | ||
| IHC detection area (endometrial) | Tumor cells | 8 | 1.61(1.03,2.51) | 0.035 | 75.4 | 0.000 | |
| TICs | 5 | 1.71(1.34,2.18) | 0.000 | 19.2 | 0.293 | ||
| Tumor cells + TICs | 1 | 0.92(0.58,1.44) | 0.700 | – | – | ||
| Grade (G3 vs G1+ G2) |
Overall | 18 | 1.20(0.96,1.51) | 0.111 | 74.0 | 0.000 | |
| Cancer type | Ovarian | 10 | 1.22(0.90,1.64) | 0.205 | 66.8 | 0.001 | |
| Cervical | 2 | 0.88(0.76,1.01) | 0.075 | 0.0 | 0.557 | ||
| Endometrial | 7 | 1.48(0.79,2.77) | 0.221 | 77.5 | 0.000 | ||
| IHC detection area (overall) | Tumor cells | 11 | 1.01(0.76,1.35) | 0.924 | 68.1 | 0.001 | |
| TICs | 5 | 1.86(0.99,3.47) | 0.053 | 84.3 | 0.000 | ||
| Tumor cells + TICs | 4 | 1.15(0.95,1.39) | 0.145 | 0.0 | 0.806 | ||
| IHC detection area (ovarian) | Tumor cells | 6 | 0.96(0.77,1.20) | 0.722 | 24.2 | 0.252 | |
| TICs | 1 | 2.45(1.69,3.57) | 0.000 | – | – | ||
| Tumor cells + TICs | 4 | 1.15(0.95,1.39) | 0.145 | 0.0 | 0.806 | ||
| IHC detection area (cervical) | Tumor cells | 1 | 0.85(0.72,1.01) | 0.070 | – | – | |
| TICs | 1 | 0.94(0.72,1.22) | 0.629 | – | – | ||
| IHC detection area (endometrial) | Tumor cells | 4 | 1.15(0.86,1.54) | 0.344 | 85.6 | 0.000 | |
| TICs | 3 | 2.37(1.47,3.83) | 0.000 | 0.0 | 0.464 | ||
FIGO, International Federation of Gynecology and Obstetrics; LNM, lymph node metastasis; LVSI, lymphovascular space invasion; RR, relative risk; CI, confidence interval; IHC, immunohistochemistry; TICs, tumor-infiltrating immune cells. PZ, p-value for association; PH, p-value for heterogeneity obtained by Q-test; I2, the degree of heterogeneity by I2 statistic. Bold indicated the significance after analysis of two or more than two studies (p < 0.05).
Subgroup Analysis in All and Each Cancer Type
High expressed PD-L1 could predict LNM for ovarian (n = 4: RR = 1.70; 95% CI = 1.23 – 2.34, p = 0.001) and endometrial (n = 6: RR = 1.85; 95% CI = 1.17 – 2.91, p = 0.008) cancer patients. These associations for the high risk of LNM may be mainly resulted from the upregulated expression of PD-L1 on tumor cells (ovarian: n = 4, RR = 1.70; 95% CI = 1.23 – 2.34, p = 0.001; Figure 4B ; endometrial: n = 6, RR = 1.85; 95% CI = 1.17 – 2.91, p = 0.008; Figure 5A ).
Figure 5.

Forest plots showing the association of PD-L1 expression for endometrial cancer patients. (A) PD-L1 expression on tumor cells and LNM. (B) PD-L1 expression on tumor-infiltrating immune cells and LVSI. (C) PD-L1 expression on tumor cells and LVSI. LNM, lymph node metastasis. LVSI, lymphovascular space invasion; HR, hazard ratio; RR, relative risk; CI, confidence interval.
High expressed PD-L1 also could predict high FIGO stage for ovarian (III–IV vs I–II: n = 21, RR = 1.14; 95% CI = 1.01 – 1.29, p = 0.039) and endometrial cancer (II–IV vs I: n = 4, RR = 2.90; 95% CI = 1.70 – 4.94, p = 0.000). PD-L1 may be mainly high expressed on tumor cells (III-IV vs I-II: n = 14, RR = 1.23; 95% CI = 1.12 – 1.36, p = 0.000; Figure 4C ) in ovarian patients, while both tumor cells (II–IV vs I: n = 2, RR = 2.96; 95% CI = 1.58 – 5.55, p = 0.001) and TICs (III–IV vs I–II: n = 2, RR = 1.72; 95% CI = 1.16 – 2.54, p = 0.007; II–IV vs I: n = 2, RR = 3.47; 95% CI = 1.23 – 9.83, p = 0.019) expressed in endometrial cancer patients.
Likewise, endometrial cancer patients may have LVSI (n = 14, RR = 1.51; 95% CI = 1.15 – 2.00, p = 0.004) if PD-L1 was high expressed on TICs (n = 5: RR =1.71; 95% CI = 1.34 – 2.18, p = 0.000; Figure 5B ) or tumor cells (n = 8: RR = 1.61; 95% CI = 1.03 – 2.51, p = 0.035; Figure 5C ).
PD-L1 high expressed on TICs was associated with increasing infiltration depth (n = 2: RR = 1.77; 95% CI = 1.33 – 2.35, p = 0.000) and grade (n = 3: RR = 2.37; 95% CI = 1.47 – 3.83, p = 0.000) in endometrial cancer ( Table 4 ). There was no significant relationship of PD-L1 with tumor size regardless of overall or subgroup analyses.
Association of PD-L1 Expressions With Response to Anti-Programmed Cell Death-1/Programmed Cell Death-Ligand 1 Treatment
Overall Analysis in All Gynecological Cancers
Twelve datasets reported the ORR, while OS and PFS were recorded in 5 and 7 datasets, respectively. Meta-analysis of these datasets indicated that patients with PD-L1 positive expression may get more benefit from anti-PD-1/PD-L1 antibodies than PD-L1 negative patients, showing a higher ORR (RR = 1.98; 95% CI: 1.38 – 2.83, p = 0.000) ( Figure 6A ), longer OS (HR = 0.34; 95% CI: 0.21 – 0.56, p = 0.000) ( Figure 6B ) and PFS (HR = 0.61; 95% CI: 0.46 – 0.81, p = 0.001) ( Figure 6C ).
Figure 6.
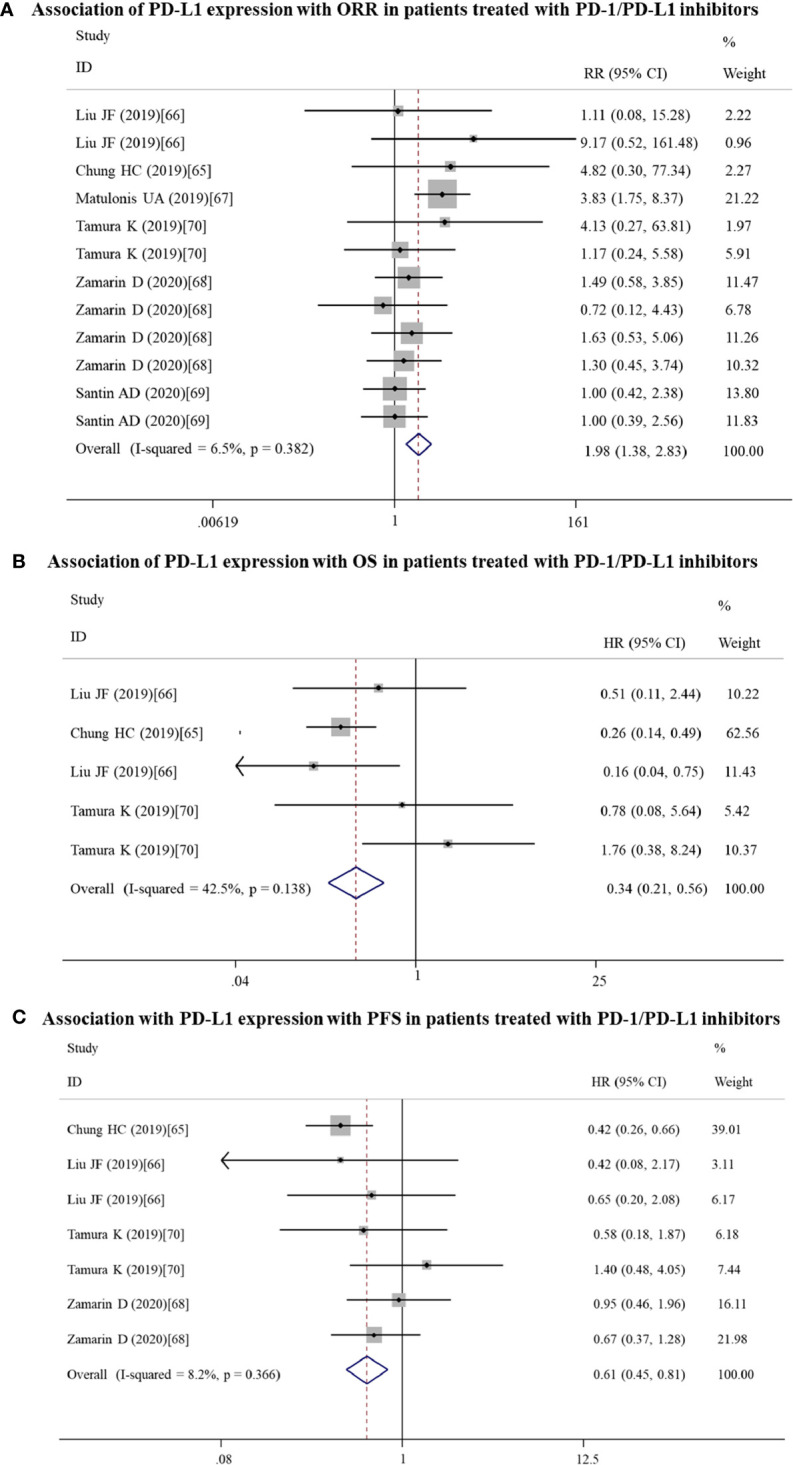
Forest plots showing the association between PD-L1 expression and response to PD-1/PD-L1 inhibitors in gynecological cancers. (A) Overall response rate (ORR). (B) Overall survival (OS). (C) Progression-free survival (PFS). HR, hazard ratio; CI, confidence interval.
Subgroup Analysis in All Gynecological Cancers
Subgroup analysis was performed only for ORR and PFS, not OS because of small articles included. The results showed that PD-1/PD-L1 inhibitors should be especially recommended for PD-L1-positive ovarian patients who could gain the high ORR (n = 6: RR = 2.17; 95% CI: 1.38 – 3.42, p = 0.001) and PD-L1-positive cervical patients who could obtain a longer PFS (n = 2: RR = 0.44; 95% CI: 0.29 – 0.68, p = 0.000) ( Table 5 ).
Table 5.
Subgroup analysis in response to PD-1/PD-L1 inhibitors.
| Comparison | Studies | RR(95%CI) | Pz-value | I2 | PH-value | ||
|---|---|---|---|---|---|---|---|
| ORR | Cancer type | Ovarian | 6 | 2.17(1.38,3.42) | 0.001 | 7.9 | 0.366 |
| Cervical | 2 | 4.50(0.63,32.01) | 0.133 | 0.0 | 0.937- | ||
| Endometrial | 4 | 1.27(0.72,2.25) | 0.410 | 0.0 | 0.498 | ||
| IHC detection area | Tumor cells | 5 | 1.27(0.72,2.24) | 0.403 | 0.0 | 0.827 | |
| TICs | 5 | 1.50(0.85,2.65) | 0.163 | 0.0 | 0.665 | ||
| Tumor cells + TICs | 2 | 3.92(1.84,8.38) | 0.000 | 0.0 | 0.874 | ||
| PFS | Cancer type | Ovarian | 3 | 0.74(0.47,1.17) | 0.196 | 0.0 | 0.604 |
| Cervical | 2 | 0.44(0.29,0.68) | 0.000 | 0.0 | 0.616 | ||
| Endometrial | 2 | 0.99(0.45,2.18) | 0.977 | 0.0 | 0.342 | ||
| IHC detection area | Tumor cells | 3 | 0.95(0.55,1.61) | 0.835 | 0.0 | 0.551 | |
| TICs | 3 | 0.64(0.38,1.07) | 0.088 | 0.0 | 0.873 | ||
| Tumor cells + TICs | 1 | 0.42(0.26,0.67) | 0.000 | – | – | ||
PFS, progression free survival; ORR, overall response rate; RR, relative risk; CI, confidence interval; IHC, immunohistochemistry; TICs, tumor-infiltrating immune cells. PZ, p-value for association; PH, p-value for heterogeneity obtained by Q-test; I2, the degree of heterogeneity by I2 statistic. Bold indicated the significance after analysis of two or more than two studies (p < 0.05).
Publication Bias and Sensitivity Analyses
Although significant heterogeneities were present for analysis of OS, PFS, DFS, LNM, FIGO stage, infiltration depth, LVSI and grade, Egger’s linear regression test analysis showed that there were no publication bias among their related studies (OS: p = 0.478; PFS, p = 0.939; DFS, p = 0.534; LNM, p = 0.917; FIGO stage, p = 0.087; infiltration depth, p = 0.181; LVSI, p = 0.504; grade, p = 0.246), indicating the credibility of results. Sensitivity analyses also confirmed the robustness of the results.
Discussion
There were several meta-analyses to analyze the prognostic significance PD-L1 by integrating multiple solid tumor types (71–74), but rare studies included the gynecological cancer [n = 1, cervical carcinoma (73, 75); n = 1 each for cervical and ovarian cancer (74)]. Our present study, for the first time, specifically investigated the association of PD-L1 expression with the prognosis and clinicopathological factors in all gynecological cancer patients. Pooled results showed that PD-L1 overexpression was not associated with OS, PFS, RFS, CSS and DFS, but subgroup analysis suggested PD-L1 overexpression predicted shorter OS in studies with reported HR and the cut-off value of 5%. Furthermore PD-L1 overexpression predicted clinical malignant characteristics of gynecological cancer patients (including LNM, advanced FIGO stage and LVSI). These conclusions seemed to be in line with the results of previous meta-studies of clinical samples (71–74) and the tumor-promoting mechanisms demonstrated by in vitro and in vivo experiments. For example, Wang et al. found that overexpression of PD-L1 significantly increased the migration, invasion, proliferative and colony-forming abilities of Siha and Me180 cervical cancer cell lines compared with control. Tumor xenograft growth was also significantly enhanced and LNM was more apparently observed in abdominal cavities of mice injected with PD-L1-overexpressing cervical cancer cells (16). Fei et al. also demonstrated that ectopic expression of PD-L1 promoted nasopharyngeal carcinoma cell invasion and metastasis in vitro and in vivo, which was attributed to its capability to activate the epithelial-mesenchymal transition process in a PI3K/AKT-dependent manner (76).
Although previous meta-analysis studies had investigated the prognostic and clinicopathological impact of PD-L1 for cervical (10), ovarian (12) and endometrial cancer (11), the number of articles included was relatively small. Our study performed an updated meta-analysis for each gynecological cancer type by increasing the number of articles included by more than two fold. As expected, some of our results were obviously different from previous reports: our analysis showed that PD-L1 was not significantly associated with OS and PFS in any cancer type, but the study of Gu et al. reported PD-L1 overexpression was related to a poor OS in patients with cervical cancer (10); our results revealed that LNM, high FIGO stage and LVSI were more frequently observed in PD-L1-positive endometrial cancer patients compared with negative controls; while Lu et al. proved that elevated PD-L1 expression was only correlated with advanced stage, but not LVSI (11). Thus, we consider our conclusions may be more believable by analysis of larger samples. Furthermore, compared with the above mete-analyses (10, 11), one innovation point in our study was to collect the PD-L1 expression on both of tumor cells and TICs, not only tumor cells. As anticipated, we obtained several new conclusions: high expression of PD-L1 on TICs was a protective factor for a poor OS in ovarian cancer patients (HR < 1), but a risk factor for unfavorable OS in cervical cancer patients, advanced stage, LVSI, high grade and increasing infiltration depth in endometrial cancer patients (HR > 1). Positive expression of PD-L1 on tumor cells was associated with a poor OS for ovarian cancer patients, LVSI for endometrial cancer patients, LNM and advanced stage for both cancer types. The anti-tumor roles of high PD-L1 on TICs for ovarian patients was also illustrated in other cancers, including colorectal (77), breast (78) and high-grade neuroendocrine carcinoma of lung (79). Its anti-cancer effects may be related with an adaptive mechanism to further activate and increase levels of cytotoxic CD8+ T cells as well as tumor-infiltrating lymphocytes (78, 80–82). Also, there was a study of non-small cell lung cancer to report that PD-L1 expression on tumor cells and TICs was associated with high levels of M2 tumor-associated macrophages and then led to a poor prognosis and an aggressive malignant phenotype, which may be one potential reason to cause the tumor-promoting effects of PD-L1 on tumor cells and TICs for gynecological cancers (83, 84).
In consideration of the fact that PD-L1 was highly expressed and the use of anti-PD-L1/PD-1 antibodies induced cell apoptosis and cell-cycle arrest in G0/G1 phase in gynecological cancer cells (85), increasing scholars recommended to using the PD-L1/PD-1 immune checkpoint inhibitors for the treatment of gynecological cancers in clinic (4, 86). However, like other therapeutic methods, there were differences in the therapeutic efficiency among different patients (69). Thus, it is also necessary to explore biomarkers to distinguish the patients and then schedule the PD-L1/PD-1 immune checkpoint inhibitors more reasonably. Previous studies on other cancers suggested the magnitude of clinical benefit from PD-L1/PD-1 inhibitors was PD-L1-dependent (87, 88). Therefore, we also investigated the associations between PD-L1 expression and ORR, OS, PFS in gynecological cancer patients. In agreement with the above studies (87–89), we also found PD-L1 patients had a significantly higher ORR (especially ovarian cancer), OS and PFS (especially cervical cancer) than PD-L1-negative patients. Although Kowanetz et al. observed that the ORR was relatively lower in patients with tumors expressing high PD-L1 levels on tumor cells than TICs (40% vs 22%) (80), our subgroup results indicated no association with tumor cells or TICs, which may be related with the small sample size.
Several limitations should be acknowledged in this study. First is the retrospective nature in most of included studies. Second, the cut-off value of PD-L1 was determined by different methods in included studies, which influenced its clinical use. Third, the number of included studies to report the association of PD-L1 expression with RFS/CSS/DFS/response to anti-PD-L1/PD-1 treatment was relatively small, which may compromise the credibility of the results and influence the subgroup analysis for each cancer type. Fourth, the estimation of HR from Kaplan–Meier curve may introduce some errors. Fifth, the restriction of articles published in other languages may lead to some negative results neglected.
Conclusion
Our meta-analyses ( Figure 7 ) indicated that positive PD-L1 detected by IHC may serve as a valuable predictor of a poor prognosis (OS, PFS), malignant clinicopathological characteristics (LNM, advanced FIGO stage and LVSI) and response efficiency to anti-PD-1/PD-L1 (ORR, OS, PFS) for patients with gynecological cancers, especially expression on tumor cells. High expressed PD-L1 on TICs may exert dual functions, including anti-cancer for ovarian cancer or oncogenic for cervical and endometrial cancers.
Figure 7.

A summary figure to show the crucial results to demonstrate the predictive values of PD-L1 for gynecological cancers patients. (A) associated with survival; (B) associated with clinicopathological features; (C) associated with anti-PD-1/PD-L1 treatment effects.
Data Availability Statement
The original contributions presented in the study are included in the article/ Supplementary Material ; further inquiries can be directed to the corresponding author.
Author Contributions
CZ and QY conceived and designed the study, collected the data, and performed the analysis. CZ wrote the first draft of the manuscript. QY was involved in the interpretation of the analyses and revised the manuscript. All authors contributed to the article and approved the submitted version.
Conflict of Interest
The authors declare that the research was conducted in the absence of any commercial or financial relationships that could be construed as a potential conflict of interest.
Supplementary Material
The Supplementary Material for this article can be found online at: https://www.frontiersin.org/articles/10.3389/fonc.2020.572203/full#supplementary-material
The data extracted from the published studies.
The Newcastle-Ottawa scale (NOS) quality assessment of the enrolled studies.
Subgroup analysis on the outcome of OS in each cancer type.
Subgroup analysis on the outcome of PFS in each cancer type.
Abbreviations
PD-L1, programmed death-ligand 1; PD-1, programmed cell death-1; IHC, immunohistochemistry; TICs, tumor-infiltrating immune cells; OS, overall survival; HR, hazard ratios; CI, confidence interval; PFS, progression free survival; PRISMA, Preferred Reporting Items for Systematic Review and Meta-analysis; RFS, recurrence-free survival; CSS, cancer-specific survival; DFS, disease-free survival; FIGO, International Federation of Gynecology and Obstetrics; LNM, lymph node metastasis; LVSI, lymphovascular space invasion; ORR, overall response rate; NOS, Newcastle-Ottawa Scale; RR, relative risks.
References
- 1. Torre LA, Islami F, Siegel RL, Ward EM, Jemal A. Global Cancer in Women: Burden and Trends. Cancer Epidemiol Biomarkers Prev (2017) 26(4):444–57. [DOI] [PubMed] [Google Scholar]
- 2. Ginsburg O, Bray F, Coleman MP, Vanderpuye V, Conteh L. The global burden of women’s cancers: a grand challenge in global health. Lancet (2017) 389(10071):847–60. [DOI] [PMC free article] [PubMed] [Google Scholar]
- 3. Siegel RL, Miller KD, Jemal A. Cancer statistics, 2020. CA Cancer J Clin (2020) 70(1):7–30. [DOI] [PubMed] [Google Scholar]
- 4. Grywalska E, Sobstyl M, Putowski L, Roliński J. Current Possibilities of Gynecologic Cancer Treatment with the Use of Immune Checkpoint Inhibitors. Int J Mol Sci (2019) 20(19):4705. [DOI] [PMC free article] [PubMed] [Google Scholar]
- 5. Cacan E. Epigenetic-mediated immune suppression of positive co-stimulatory molecules in chemoresistant ovarian cancer cells. Cell Biol Int (2017) 41(3):328–39. [DOI] [PubMed] [Google Scholar]
- 6. del Toro-Arreola S, García-Chagollán M, Jave-Suárez LF. [Escape mechanisms to the innate immune response in HPV-associated cervical cancer]. Rev Med Inst Mex Seguro Soc (2015) 53 Suppl 2:S194–9. [PubMed] [Google Scholar]
- 7. Jiang X, Wang J, Deng X, Xiong F, Ge J, Xiang B, et al. Role of the tumor microenvironment in PD-L1/PD-1-mediated tumor immune escape. Mol Cancer (2019) 18(1):10. [DOI] [PMC free article] [PubMed] [Google Scholar]
- 8. Blank C, Mackensen A. Contribution of the PD-L1/PD-1 pathway to T-cell exhaustion: an update on implications for chronic infections and tumor evasion. Cancer Immunol Immunother (2007) 56(5):739–45. [DOI] [PMC free article] [PubMed] [Google Scholar]
- 9. Zhao R, Song Y, Wang Y, Huang Y, Li Z, Cui Y, et al. PD-1/PD-L1 blockade rescue exhausted CD8+ T cells in gastrointestinal stromal tumours via the PI3K/Akt/mTOR signalling pathway. Cell Prolif (2019) 52(3):e12571. [DOI] [PMC free article] [PubMed] [Google Scholar]
- 10. Gu X, Dong M, Liu Z, Mi Y, Shi Y. Elevated PD-L1 expression predicts poor survival outcomes in patients with cervical cancer. Cancer Cell Int (2019) 19:146. [DOI] [PMC free article] [PubMed] [Google Scholar]
- 11. Lu L, Li Y, Luo R, Xu J, Wang M. Prognostic and Clinicopathological Role of PD-L1 in Endometrial Cancer: A Meta-Analysis. Front Oncol (2020) 10:632. [DOI] [PMC free article] [PubMed] [Google Scholar]
- 12. Huang LJ, Deng XF, Chang F, Wu XL, Wu Y, Diao QZ. Prognostic significance of programmed cell death ligand 1 expression in patients with ovarian carcinoma: A systematic review and meta-analysis. Medicine (2018) 97(43):e12858. [DOI] [PMC free article] [PubMed] [Google Scholar]
- 13. Stang A. Critical evaluation of the Newcastle-Ottawa scale for the assessment of the quality of nonrandomized studies in meta-analyses. Eur J Epidemiol (2010) 25(9):603–5. [DOI] [PubMed] [Google Scholar]
- 14. Egger M, Davey Smith G, Schneider M, Minder C. Bias in meta-analysis detected by a simple, graphical test. BMJ (1997) 315:629–34. [DOI] [PMC free article] [PubMed] [Google Scholar]
- 15. Peters JL, Sutton AJ, Jones DR, Abrams KR, Rushton L. Performance of the trim and fill method in the presence of publication bias and between-study heterogeneity. Stat Med (2007) 26(25):4544–62. [DOI] [PubMed] [Google Scholar]
- 16. Wang S, Li J, Xie J, Liu F, Duan Y, Wu Y, et al. Programmed death ligand 1 promotes lymph node metastasis and glucose metabolism in cervical cancer by activating integrin β4/SNAI1/SIRT3 signaling pathway. Oncogene (2018) 37(30):4164–80. [DOI] [PubMed] [Google Scholar]
- 17. Enwere EK, Kornaga EN, Dean M, Koulis TA, Phan T, Kalantarian M, et al. Expression of PD-L1 and presence of CD8-positive T cells in pre-treatment specimens of locally advanced cervical cancer. Mod Pathol (2017) 30(4):577–86. [DOI] [PubMed] [Google Scholar]
- 18. Feng M, Xu L, He Y, Sun L, Zhang Y. Clinical significance of PD-L1 (CD274) enhanced expression in cervical squamous cell carcinoma. Int J Clin Exp Pathol (2018) 11(11):5370–8. [PMC free article] [PubMed] [Google Scholar]
- 19. Kim M, Kim H, Dong HS, Kim K, No JH. Identifying Rational Candidates for Immunotherapy Targeting PD-1/PD-L1 in Cervical Cancer. Anticancer Res (2017) 37(9):5087–94. [DOI] [PubMed] [Google Scholar]
- 20. Iijima M, Okonogi N. Significance of PD-L1 expression in carbon-ion radiotherapy for uterine cervical adeno/adenosquamous carcinoma. J Gynecol Oncol (2020) 31(2):e19. [DOI] [PMC free article] [PubMed] [Google Scholar]
- 21. Tsuchiya T, Someya M, Takada Y, Hasegawa T, Kitagawa M, Fukushima Y, et al. Association between radiotherapy-induced alteration of programmed death ligand 1 and survival in patients with uterine cervical cancer undergoing preoperative radiotherapy. Strahlenther Onkol (2020) 196(8):725–35. 10.1007/s00066-019-01571-1 [DOI] [PubMed] [Google Scholar]
- 22. Kawachi A, Yoshida H, Kitano S, Ino Y, Kato T, Hiraoka N. Tumor-associated CD204(+) M2 macrophages are unfavorable prognostic indicators in uterine cervical adenocarcinoma. Cancer Sci (2018) 109(3):863–70. [DOI] [PMC free article] [PubMed] [Google Scholar]
- 23. Loharamtaweethong K, Vinyuvat S, Thammasiri J, Chitpakdee S, Supakatitham C, Puripat N. Impact of antiretroviral drugs on PD-L1 expression and copy number gains with clinical outcomes in HIV-positive and -negative locally advanced cervical cancers. Oncol Lett (2019) 18(6):5747–58. [DOI] [PMC free article] [PubMed] [Google Scholar]
- 24. Miyasaka Y, Yoshimoto Y, Murata K, Noda SE, Ando K, Ebara T, et al. Treatment outcomes of patients with adenocarcinoma of the uterine cervix after definitive radiotherapy and the prognostic impact of tumor-infiltrating CD8+ lymphocytes in pre-treatment biopsy specimens: a multi-institutional retrospective study. J Radiat Res (2020) 61(2):275–84. [DOI] [PMC free article] [PubMed] [Google Scholar]
- 25. Chen H, Xia B, Zheng T, Lou G. Immunoscore system combining CD8 and PD-1/PD-L1: A novel approach that predicts the clinical outcomes for cervical cancer. Int J Biol Markers (2020) 35(1):65–73. [DOI] [PubMed] [Google Scholar]
- 26. Lippens L, Bockstal MV, Jaeghere EAD, Tummers P, Denys H. Immunologic impact of chemoradiation in cervical cancer and how immune cell infiltration could lead toward personalized treatment. Int J Cancer (2020) 147(2):554–64. [DOI] [PubMed] [Google Scholar]
- 27. Karim R, Jordanova ES, Piersma SJ, Kenter GG, Chen L, Boer JM, et al. Tumor-expressed B7-H1 and B7-DC in relation to PD-1+ T-cell infiltration and survival of patients with cervical carcinoma. Clin Cancer Res (2009) 15(20):6341–7. [DOI] [PubMed] [Google Scholar]
- 28. Loharamtaweethong K, Supakatitham C, Vinyuvat S, Puripat N, Tanvanich S, Sitthivilai U. Prognostic Significance of PD-L1 Protein Expression and Copy Number Gains in Locally Advanced Cervical Cancer. Asian Pac J Allergy Immunol (2019). 10.12932/AP-120419-0538 [DOI] [PubMed] [Google Scholar]
- 29. Grochot RM, Brollo J, Neto FR, Tregnago AC, Scholze C, Norris R, et al. Expression of PD-L1 in cervical carcinoma and its impact on survival associated with T-cell infiltration and FoxP3 expression. Cancer Manag Res (2019) 11:4597–605. [DOI] [PMC free article] [PubMed] [Google Scholar]
- 30. Xu M, Zhang B, Zhang M, Liu Y, Yin FL, Liu X, et al. Clinical relevance of expression of B7-H1 and B7-H4 in ovarian cancer. Oncol Lett (2016) 11(4):2815–9. [DOI] [PMC free article] [PubMed] [Google Scholar]
- 31. Nhokaew W, Kleebkaow P, Chaisuriya N, Kietpeerakool C. Programmed Death Ligand 1 (PD-L1) Expression in Epithelial Ovarian Cancer: A Comparison of Type I and Type II Tumors. Asian Pac J Cancer Prev (2019) 20(4):1161–9. [DOI] [PMC free article] [PubMed] [Google Scholar]
- 32. Schmoeckel E, Hofmann S, Fromberger D, Rottmann M, Luthardt B, Burges A, et al. Comprehensive analysis of PD-L1 expression, HER2 amplification, ALK/EML4 fusion, and mismatch repair deficiency as putative predictive and prognostic factors in ovarian carcinoma. Virchows Arch (2019) 474(5):599–608. [DOI] [PubMed] [Google Scholar]
- 33. Hamanishi J, Mandai M, Iwasaki M, Okazaki T, Tanaka Y, Yamaguchi K, et al. Programmed cell death 1 ligand 1 and tumor-infiltrating CD8+ T lymphocytes are prognostic factors of human ovarian cancer. Proc Natl Acad Sci U S A (2007) 104(9):3360–5. [DOI] [PMC free article] [PubMed] [Google Scholar]
- 34. Mesnage SJL, Auguste A, Genestie C, Dunant A, Pain E, Drusch F, et al. Neoadjuvant chemotherapy (NACT) increases immune infiltration and programmed death-ligand 1 (PD-L1) expression in epithelial ovarian cancer (EOC). Ann Oncol (2017) 28(3):651–7. [DOI] [PubMed] [Google Scholar]
- 35. Zhu J, Wen H, Bi R, Wu Y, Wu X. Prognostic value of programmed death-ligand 1 (PD-L1) expression in ovarian clear cell carcinoma. J Gynecol Oncol (2017) 28(6):e77. [DOI] [PMC free article] [PubMed] [Google Scholar]
- 36. Zhu J, Wen H, Ju X, Bi R, Zuo W, Wu X. Clinical Significance of Programmed Death Ligand−1 and Intra-Tumoral CD8+ T Lymphocytes in Ovarian Carcinosarcoma. PloS One (2017) 12(1):e0170879. [DOI] [PMC free article] [PubMed] [Google Scholar]
- 37. Zong L, Zhou Y, Zhang M, Chen J, Xiang Y. VISTA expression is associated with a favorable prognosis in patients with high-grade serous ovarian cancer. Cancer Immunol Immunother (2020) 69(1):33–42. [DOI] [PMC free article] [PubMed] [Google Scholar]
- 38. Wang Q, Lou W, Di W, Wu X. Prognostic value of tumor PD-L1 expression combined with CD8(+) tumor infiltrating lymphocytes in high grade serous ovarian cancer. Int Immunopharmacol (2017) 52:7–14. [DOI] [PubMed] [Google Scholar]
- 39. Zhu X, Zhao L, Lang J. The BRCA1 Methylation and PD-L1 Expression in Sporadic Ovarian Cancer. Int J Gynecol Cancer (2018) 28(8):1514–9. [DOI] [PMC free article] [PubMed] [Google Scholar]
- 40. Buderath P, Mairinger F, Mairinger E, Böhm K, Mach P, Schmid KW, et al. Prognostic significance of PD-1 and PD-L1 positive tumor-infiltrating immune cells in ovarian carcinoma. Int J Gynecol Cancer (2019) 29(9):1389–95. [DOI] [PubMed] [Google Scholar]
- 41. Kim KH, Choi KU, Kim A, Lee SJ, Lee JH, Suh DS, et al. PD-L1 expression on stromal tumor-infiltrating lymphocytes is a favorable prognostic factor in ovarian serous carcinoma. J Ovarian Res (2019) 12(1):56. [DOI] [PMC free article] [PubMed] [Google Scholar]
- 42. Zhu X, Yang H, Lang J, Zhang Y. Ras association domain family protein 1a hypermethylation and PD-L1 expression in ovarian cancer: A retrospective study of 112 cases. Eur J Obstet Gynecol Reprod Biol (2019) 240:103–8. [DOI] [PubMed] [Google Scholar]
- 43. Zhang L, Chen Y, Li F, Bao L, Liu W. Atezolizumab and Bevacizumab Attenuate Cisplatin Resistant Ovarian Cancer Cells Progression Synergistically via Suppressing Epithelial-Mesenchymal Transition. Front Immunol (2019) 10:867. [DOI] [PMC free article] [PubMed] [Google Scholar]
- 44. Alldredge J, Serna-Gallegos T, Gallegos N, VanLeer JP, Chang J, Ziogas A, et al. Evaluation of clear cell subtypes of ovarian and uterine malignancies with anti-PD-L1 and anti-PD1 immunohistochemical expression and their association with stage and survival. Gynecol Oncol (2019) 155(3):483–8. [DOI] [PMC free article] [PubMed] [Google Scholar]
- 45. De La Motte Rouge T, Corné J, Cauchois A, Le Boulch M, Poupon C, Henno S, et al. Serum CD95L Level Correlates with Tumor Immune Infiltration and Is a Positive Prognostic Marker for Advanced High-Grade Serous Ovarian Cancer. Mol Cancer Res (2019) 17(12):2537–48. [DOI] [PubMed] [Google Scholar]
- 46. Martin de la Fuente L, Westbom-Fremer S, Arildsen NS, Hartman L, Malander S, Kannisto P, et al. PD-1/PD-L1 expression and tumor-infiltrating lymphocytes are prognostically favorable in advanced high-grade serous ovarian carcinoma. Virchows Arch (2020) 477(1):83–91. [DOI] [PMC free article] [PubMed] [Google Scholar]
- 47. Chatterjee J, Dai W, Aziz NHA, Teo PY, Wahba J, Phelps DL, et al. Clinical Use of Programmed Cell Death-1 and Its Ligand Expression as Discriminatory and Predictive Markers in Ovarian Cancer. Clin Cancer Res (2017) 23(13):3453–60. [DOI] [PubMed] [Google Scholar]
- 48. Henriksen JR, Donskov F, Waldstrøm M, Jakobsen A, Hjortkjaer M, Petersen CB, et al. Favorable prognostic impact of Natural Killer cells and T cells in high-grade serous ovarian carcinoma. Acta Oncol (2020) 59(6):652–9. [DOI] [PubMed] [Google Scholar]
- 49. Sungu N, Yildirim M, Desdicioglu R, Başaran Aydoğdu Ö, Kiliçarslan A, Tatli Doğan H, et al. Expression of Immunomodulatory Molecules PD-1, PD-L1, and PD-L2, and their Relationship With Clinicopathologic Characteristics in Endometrial Cancer. Int J Gynecol Pathol (2019) 38(5):404–13. [DOI] [PubMed] [Google Scholar]
- 50. Vagios S, Yiannou P, Giannikaki E, Doulgeraki T, Papadimitriou C, Rodolakis A, et al. The impact of programmed cell death-ligand 1 (PD-L1) and CD8 expression in grade 3 endometrial carcinomas. Int J Clin Oncol (2019) 24(11):1419–28. [DOI] [PubMed] [Google Scholar]
- 51. Kucukgoz Gulec U, Kilic Bagir E. Programmed death-1 (PD-1) and programmed death-ligand 1 (PD-L1) expressions in type 2 endometrial cancer. Arch Gynecol Obstet (2019) 300(2):377–82. [DOI] [PubMed] [Google Scholar]
- 52. Zhang S, Minaguchi T. PD-L1 and CD4 are independent prognostic factors for overall survival in endometrial carcinomas. BMC Cancer (2020) 20(1):127. [DOI] [PMC free article] [PubMed] [Google Scholar]
- 53. Kim J, Kim S, Lee HS, Yang W, Cho H, Chay DB, et al. Prognostic implication of programmed cell death 1 protein and its ligand expressions in endometrial cancer. Gynecol Oncol (2018) 149(2):381–7. [DOI] [PubMed] [Google Scholar]
- 54. Jones TE, Pradhan D, Dabbs DJ, Bhargava R, Onisko A, Jones MW. Immunohistochemical Markers With Potential Diagnostic, Prognostic, and Therapeutic Significance in Uterine Carcinosarcoma: A Clinicopathologic Study of 43 Cases. Int J Gynecol Pathol (2021) 40(1):84–93. 10.1097/PGP.0000000000000662 [DOI] [PubMed] [Google Scholar]
- 55. Kucukgoz Gulec U, Kilic Bagir E, Paydas S, Guzel AB, Gumurdulu D, Vardar MA. Prognostic significance of programmed death-1 (PD-1) and programmed death-ligand 1 (PD-L1) expression in uterine carcinosarcoma. Eur J Obstet Gynecol Reprod Biol (2020) 244:51–5. [DOI] [PubMed] [Google Scholar]
- 56. Tawadros AIF, Khalafalla MMM. Expression of programmed death-ligand 1 and hypoxia-inducible factor-1α proteins in endometrial carcinoma. J Cancer Res Ther (2018) 14(Supplement):S1063–9. [DOI] [PubMed] [Google Scholar]
- 57. Li ZB, Joehlin-Price AS, Rhoades J, Ayoola-Adeola M, Miller K, Parwani AV, et al. Programmed Death Ligand 1 Expression Among 700 Consecutive Endometrial Cancers: Strong Association With Mismatch Repair Protein Deficiency. Int J Gynecol Cancer (2018) 28(1):59–68. [DOI] [PubMed] [Google Scholar]
- 58. Mo ZF, Liu J, Zhang QY, Chen ZQ, Mei JD, Liu LX, et al. Expression of PD-1, PD-L1 and PD-L2 is associated with differentiation status and histological type of endometrial cancer. Oncol Lett (2016) 12(2):944–50. [DOI] [PMC free article] [PubMed] [Google Scholar]
- 59. Yamashita H, Nakayama K, Ishikawa M, Nakamura K, Ishibashi T, Sanuki K, et al. Microsatellite instability is a biomarker for immune checkpoint inhibitors in endometrial cancer. Oncotarget (2018) 9(5):5652–64. [DOI] [PMC free article] [PubMed] [Google Scholar]
- 60. Engerud H, Berg HF, Myrvold M, Halle MK, Bjorge L, Haldorsen IS, et al. High degree of heterogeneity of PD-L1 and PD-1 from primary to metastatic endometrial cancer. Gynecol Oncol (2020) 157(1):260–7. [DOI] [PubMed] [Google Scholar]
- 61. Crumley S, Kurnit K, Hudgens C. Identification of a subset of microsatellite-stable endometrial carcinoma with high PD-L1 and CD8+ lymphocytes. Mod Pathol (2019) 32(3):396–404. [DOI] [PMC free article] [PubMed] [Google Scholar]
- 62. Li MJ, Li HR, Liu F, Bi R, Tu XY, Chen LH, et al. Characterization of ovarian clear cell carcinoma using target drug-based molecular biomarkers: implications for personalized cancer therapy. J Ovarian Res (2017) 10(1):9. [DOI] [PMC free article] [PubMed] [Google Scholar]
- 63. Webb JR, Milne K, Kroeger DR, Nelson BH. PD-L1 expression is associated with tumor-infiltrating T cells and favorable prognosis in high-grade serous ovarian cancer. Gynecol Oncol (2016) 141(2):293–302. [DOI] [PubMed] [Google Scholar]
- 64. Xue CY, Xu Y, Ye WF, Xie QQ, Gao HY, Xu B, et al. Expression of PD-L1 in ovarian cancer and its synergistic antitumor effect with PARP inhibitor. Gynecol Oncol (2020) 157(1):222–33. [DOI] [PubMed] [Google Scholar]
- 65. Chung HC, Ros W, Delord JP, Perets R, Italiano A, Shapira-Frommer R, et al. Efficacy and Safety of Pembrolizumab in Previously Treated Advanced Cervical Cancer: Results From the Phase II KEYNOTE-158 Study. J Clin Oncol (2019) 37(17):1470–8. [DOI] [PubMed] [Google Scholar]
- 66. Liu JF, Gordon M, Veneris J, Braiteh F, Balmanoukian A, Eder JP, et al. Safety, clinical activity and biomarker assessments of atezolizumab from a Phase I study in advanced/recurrent ovarian and uterine cancers. Gynecol Oncol (2019) 154(2):314–22. [DOI] [PubMed] [Google Scholar]
- 67. Matulonis UA, Shapira-Frommer R, Santin AD, Lisyanskaya AS, Pignata S, Vergote I, et al. Antitumor activity and safety of pembrolizumab in patients with advanced recurrent ovarian cancer: results from the phase II KEYNOTE-100 study. Ann Oncol (2019) 30(7):1080–7. [DOI] [PubMed] [Google Scholar]
- 68. Zamarin D, Burger RA, Sill MW, Powell DJ, Jr., Lankes HA, Feldman MD, et al. Randomized Phase II Trial of Nivolumab Versus Nivolumab and Ipilimumab for Recurrent or Persistent Ovarian Cancer: An NRG Oncology Study. J Clin Oncol (2020) 38(16):1814–23. [DOI] [PMC free article] [PubMed] [Google Scholar]
- 69. Santin AD, Deng W, Frumovitz M, Buza N, Bellone S, Huh W, et al. Phase II evaluation of nivolumab in the treatment of persistent or recurrent cervical cancer (NCT02257528/NRG-GY002). Gynecol Oncol (2020) 157(1):161–6. [DOI] [PMC free article] [PubMed] [Google Scholar]
- 70. Tamura K, Hasegawa K, Katsumata N, Matsumoto K, Mukai H, Takahashi S, et al. Efficacy and safety of nivolumab in Japanese patients with uterine cervical cancer, uterine corpus cancer, or soft tissue sarcoma: Multicenter, open-label phase 2 trial. Cancer Sci (2019) 110: (9):2894–904. [DOI] [PMC free article] [PubMed] [Google Scholar]
- 71. Wu P, Wu D, Li L, Chai Y, Huang J. PD-L1 and Survival in Solid Tumors: A Meta-Analysis. PLoS One (2015) 10(6):e0131403. [DOI] [PMC free article] [PubMed] [Google Scholar]
- 72. Xiang X, Yu PC, Long D, Liao XL, Zhang S, You XM, et al. Prognostic value of PD -L1 expression in patients with primary solid tumors. Oncotarget (2018) 9(4):5058–72. [DOI] [PMC free article] [PubMed] [Google Scholar]
- 73. Lin Z, Xu Y, Zhang Y, He Q, Zhang J, He J, et al. The prevalence and clinicopathological features of programmed death-ligand 1 (PD-L1) expression: a pooled analysis of literatures. Oncotarget (2016) 7(12):15033–46. [DOI] [PMC free article] [PubMed] [Google Scholar]
- 74. Wang Q, Liu F, Liu L. Prognostic significance of PD-L1 in solid tumor: An updated meta-analysis. Med (Baltimore) (2017) 96(18):e6369. [DOI] [PMC free article] [PubMed] [Google Scholar]
- 75. Jin Y, Zhao J, Shi X, Yu X. Prognostic value of programed death ligand 1 in patients with solid tumors: A meta-analysis. J Cancer Res Ther (2015) 11 Suppl 1:C38–43. [DOI] [PubMed] [Google Scholar]
- 76. Fei Z, Deng Z, Zhou L, Li K, Xia X, Xie R. PD-L1 Induces Epithelial-Mesenchymal Transition in Nasopharyngeal Carcinoma Cells Through Activation of the PI3K/AKT Pathway. Oncol Res (2019) 27(7):801–7. [DOI] [PMC free article] [PubMed] [Google Scholar]
- 77. Koganemaru S, Inoshita N, Miura Y, Miyama Y, Fukui Y, Ozaki Y, et al. Prognostic value of programmed death-ligand 1 expression in patients with stage III colorectal cancer. Cancer Sci (2017) 108(5):853–8. [DOI] [PMC free article] [PubMed] [Google Scholar]
- 78. Huang W, Ran R, Chao, Shao B, Li HL. Prognostic and Clinicopathological Value of PD-L1 Expression in Primary Breast Cancer: A Meta-Analysis. Breast Cancer Res Treat (2019) 178(1):17–33. [DOI] [PubMed] [Google Scholar]
- 79. Kim HS, Lee JH, Nam SJ, Ock CY, Moon JW, Yoo CW, et al. Association of PD-L1 Expression with Tumor-Infiltrating Immune Cells and Mutation Burden in High-Grade Neuroendocrine Carcinoma of the Lung. J Thorac Oncol (2018) 13(5):636–48. [DOI] [PubMed] [Google Scholar]
- 80. Kowanetz M, Zou W, Gettinger SN, Koeppen H, Kockx M, Schmid P, et al. Differential regulation of PD-L1 expression by immune and tumor cells in NSCLC and the response to treatment with atezolizumab (anti-PD-L1). Proc Natl Acad Sci U S A (2018) 115(43):E10119–26. [DOI] [PMC free article] [PubMed] [Google Scholar]
- 81. Thompson ED, Taube JM, Asch-Kendrick RJ, Ogurtsova A, Xu H, Sharma R, et al. PD-L1 expression and the immune microenvironment in primary invasive lobular carcinomas of the breast. Mod Pathol (2017) 30(11):1551–60. [DOI] [PubMed] [Google Scholar]
- 82. Xu Y, Zhang X, Wang Y, Pan M, Wang M, Zhang J. A VEGFR2-MICA bispecific antibody activates tumor-infiltrating lymphocytes and exhibits potent anti-tumor efficacy in mice. Cancer Immunol Immunother (2019) 68(9):1429–41. [DOI] [PMC free article] [PubMed] [Google Scholar]
- 83. Kim DH, Kim H, Choi YJ, Kim SY, Lee JE, Sung KJ, et al. Exosomal PD-L1 promotes tumor growth through immune escape in non-small cell lung cancer. Exp Mol Med (2019) 51(8):1–13. [DOI] [PMC free article] [PubMed] [Google Scholar]
- 84. Sumitomo R, Hirai T, Fujita M, Murakami H, Otake Y, Huang CL. PD-L1 expression on tumor-infiltrating immune cells is highly associated with M2 TAM and aggressive malignant potential in patients with resected non-small cell lung cancer. Lung Cancer (2019) 136:136–44. [DOI] [PubMed] [Google Scholar]
- 85. Sun LM, Liu YC, Li W, Liu S, Liu HX, Li LW, et al. Nivolumab effectively inhibit platinum-resistant ovarian cancer cells via induction of cell apoptosis and inhibition of ADAM17 expression. Eur Rev Med Pharmacol Sci (2017) 21(6):1198–205. [PubMed] [Google Scholar]
- 86. Naumann RW, Hollebecque A, Meyer T, Devlin MJ, Oaknin A, Kerger J, et al. Safety and Efficacy of Nivolumab Monotherapy in Recurrent or Metastatic Cervical, Vaginal, or Vulvar Carcinoma: Results From the Phase I/II CheckMate 358 Trial. J Clin Oncol (2019) 37(31):2825–34. [DOI] [PMC free article] [PubMed] [Google Scholar]
- 87. Liu X, Guo CY, Tou FF, Wen XM, Kuang YK, Zhu Q, et al. Association of PD-L1 expression status with the efficacy of PD-1/PD-L1 inhibitors and overall survival in solid tumours: A systematic review and meta-analysis. Int J Cancer (2020) 147(1):116–27. [DOI] [PubMed] [Google Scholar]
- 88. Zhang B, Liu Y, Zhou S, Jiang H, Zhu K, Wang R. Predictive effect of PD-L1 expression for immune checkpoint inhibitor (PD-1/PD-L1 inhibitors) treatment for non-small cell lung cancer: A meta-analysis. Int Immunopharmacol (2020) 80:106214. [DOI] [PubMed] [Google Scholar]
- 89. Ghate K, Amir E, Kuksis M, Hernandez-Barajas D, Rodriguez-Romo L, Booth CM, et al. PD-L1 expression and clinical outcomes in patients with advanced urothelial carcinoma treated with checkpoint inhibitors: A meta-analysis. Cancer Treat Rev (2019) 76:51–6. [DOI] [PubMed] [Google Scholar]
Associated Data
This section collects any data citations, data availability statements, or supplementary materials included in this article.
Supplementary Materials
The data extracted from the published studies.
The Newcastle-Ottawa scale (NOS) quality assessment of the enrolled studies.
Subgroup analysis on the outcome of OS in each cancer type.
Subgroup analysis on the outcome of PFS in each cancer type.
Data Availability Statement
The original contributions presented in the study are included in the article/ Supplementary Material ; further inquiries can be directed to the corresponding author.