

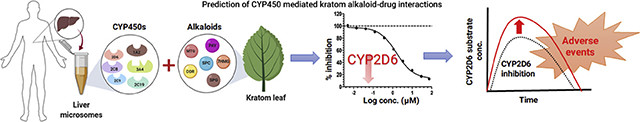
Abstract
In vitro cytochrome P450 inhibition of major kratom alkaloids: mitragynine (MTG), speciogynine (SPG), speciocilliatine (SPC), corynantheidine (COR), 7-hydroxymitragynine (7HMG) and paynantheine (PAY) was evaluated using human liver microsomes (HLMs) to understand their drug-drug interaction potential. CYP450 isoform-specific substrates of CYP1A2, 2C8, 2C9, 2C19, 2D6, and 3A4/5 were incubated in HLMs with or without alkaloids. Preliminary CYP450 inhibition (IC50) data were generated for each of these isoforms. In addition, the type of inhibition and estimation of the inhibition constants (Ki) of MTG and COR were determined. Among the tested alkaloids, MTG and COR were potent inhibitors of CYP2D6 (IC50, 2.2 and 4.2 μM, respectively). Both MTG and COR exhibited competitive inhibition of CYP2D6 activity and the Ki were found to be 1.1 and 2.8 μM, respectively. SPG and PAY showed moderate inhibition of CYP2D6 activity. Additionally, moderate inhibitory effects by SPC, MTG, and SPG were observed on CYP2C19 activity. Interestingly, inhibition of only midazolam hydroxylase CYP3A4/5 activity by COR, PAY, and MTG was observed while no inhibitory effect was observed when testosterone was used as a probe substrate. In conclusion, MTG and COR may lead to clinically significant adverse drug interactions upon coadministration of drugs that are substantially metabolized by CYP2D6.
Keywords: Cytochrome P450 inhibition, Kratom alkaloids, Mitragynine, 7-Hydroxymitragynine, Corynantheidine, Speciociliatine
Graphical Abstract
1. Introduction
Mitragyna speciosa, a medicinal tree commonly known as kratom, belongs to the Rubiaceae family indigenous to Southeast Asia (Boyer et al., 2008; Cinosi et al., 2015). MTG is the major alkaloid and comprises about 66 % of total alkaloidal content in the leaves of kratom. In addition to MTG, kratom contains more than 25 other indole or oxindole based alkaloids (Hassan et al., 2013). Some of the other important indole alkaloids of kratom leaves include PAY (9 %), SPG (7 %), 7HMG (2 %), SPC (1 %) and COR (< 1 %) (Hassan et al., 2013). The chemical structures of these alkaloids are shown in Fig. 1. Among these alkaloids, MTG and 7HMG are known to be partial agonists at μ-opioid receptors (Boyer et al., 2008; Kruegel et al., 2016). The pharmacological effect of other alkaloids has not been well understood. In one report, COR has been identified to antagonize the morphine inhibited twitch contraction of guinea pig ileum in a concentration dependent manner. In addition, receptor binding data have clearly shown that COR has an affinity towards the μ-opioid receptor. Further, COR did not alter the muscarinic receptor antagonist atropine or the calcium channel blocker verapamil-inhibited twitch contraction, suggesting the antagonistic effects of COR are primarily due to μ-opioid receptor blocking (Takayama et al., 2002). Interestingly, PAY, SPG, and SPC were found to inhibit twitch contraction in a naloxone-insensitive manner (Takayama, 2004). Further, it is reported that SPG and PAY act on ileal smooth muscle based on the observation that SPG and PAY inhibited the twitch contraction by direct stimulation of the muscarinic receptor on ileal smooth muscle (Takayama, 2004). Although the biological effects of these alkaloids have not been well characterized, they may have potentially substantial pharmacological effects. Currently, it is believed that MTG and 7HMG are the two primary alkaloids which contribute to the antinociceptive activity of kratom (Hemby et al., 2019).
Fig. 1.

Chemical structures of kratom alkaloids.
In a traditional setting, freshly harvested leaf material of kratom is consumed by natives to treat cough, diarrhoea, fatigue and to improve their physical endurance either by chewing, brewing as tea or by smoking the dried leaves (Cinosi et al., 2015; Lee et al., 2018). In the United States, kratom is widely available and it is currently being used by more than 1 million individuals, either self-prescribed for pain management, to treat opiate withdrawal symptoms, or for recreational purposes (Prozialeck et al., 2019, 2012; Swogger et al., 2015; Warner et al., 2016). It is noteworthy that unlike its traditional consumption practices, products in the United States are consumed as a dried leaf powder, tablet, capsule, or in concentrated extracts (Prozialeck et al., 2019). In some instances, the severe adverse events reported are mainly due to the consumption of kratom products adulterated either by other substances or by the higher content of 7HMG content compared to its natural abundance (Kronstrand et al., 2011; Lydecker et al., 2016; Prozialeck et al., 2019). In February 2018, the United States Food and Drug Administration (US FDA) had reported 44 deaths associated with kratom use, however, the actual causes of deaths were reported to be unknown (Gershman et al., 2019; Prozialeck et al., 2019). The autopsy reports have indicated that most cases involved polydrug ingestion including other synthetic opioids (Gershman et al., 2019). The possibility of kratom associated herb-drug interactions leading to life-threatening conditions exists based on these reports.
Majority of the known drug interactions occur due to inhibition of important drug metabolizing enzymes. The cytochrome P450 (CYP450) enzymes play a predominant role in drug metabolism, therefore, an alteration in CYP450 mediated metabolism could result in drug interactions ranging from clinically insignificant events to fatality (Lin and Lu, 1998; Wienkers and Heath, 2005). Few reports are available which evaluate the CYP450 inhibition potential of mitragynine (Hanapi et al., 2013; Lim et al., 2013) or alkaloidal extracts of kratom (Kong et al., 2011). Further, no reports are available for other kratom alkaloids on the evaluation of their CYP450 inhibition potential. In the available literature, CYP450 inhibition potential was determined using recombinant CYP450 isoforms (overexpressed systems and not in the native environment) and CYP450 activity was tested using either fluorescent or luminogenic CYP450 probe substrates (not suitable for in vivo assessment) (Bjornsson et al., 2003; Stresser et al., 2000). Moreover, these reports have not considered all the US FDA recommended CYP450 isoform while assessing the inhibition potential (United States Food and Drug Administration, 2017). Thus, the objective of this study was to examine the effect of six important kratom alkaloids MTG, SPG, SPC, COR, 7HMG, and PAY on CYP1A2, 2C8, 2C9, 2C19, 2D6, and 3A4/5 activities using HLMs and FDA recommended probe substrates.
2. Materials and methods
2.1. Chemicals and reagents
MTG, COR, PAY, SPC, and SPG (purity ≥ 98 %) were extracted and purified from the dried leaves of Mitragyna speciosa as described by Sharma et al. (Sharma et al., 2019) obtained from Pure Land Ethnobotanicals (Madison, WI, USA). The 7HMG (purity ≥ 98 %) synthesis was performed in-house using a method reported by Takayama et al. (Takayama et al., 2002). The chemical purity and structural characterization of each alkaloid was obtained by proton and carbon nuclear magnetic resonance (1H or 13C NMR) spectroscopy, high-performance liquid chromatography-photodiode array detection (HPLC-PDA), and high-resolution quadrupole time of flight mass spectrometry (LC-Q-TOF) (Sharma et al., 2019). Nicotinamide adenine dinucleotide phosphate reduced tetrasodium salt (NADPH) was obtained from MP Biomedicals (Solon, OH, USA). Montelukast sodium was obtained from Cayman Chemical (Waterloo, Australia). S-mephenytoin was purchased from Corning (Corning, NY, USA). Sulfaphenazole, (+)-N-3-benzylnirvanol, quinidine, ketoconazole, caffeine, quercetin, phenacetin, amodiaquine hydrochloride, diclofenac sodium, dextromethorphan hydrobromide, midazolam solution, 6β-hydroxytestosterone, α-naphthoflavone and testosterone were purchased from Sigma Aldrich (St. Louis, MO, USA). Acetaminophen, N-desethylamodiaquine hydrochloride, 4-hydroxydiclofenac, 4-hydroxymephenytoin, and dextrorphan were purchased from Santa Cruz Biotechnology (Santa Cruz, CA, USA). Human liver microsomes [pool of 200 donors (100 male and 100 female)] were purchased from XenoTech, LLC (Lenexa, KS, USA). High-performance liquid chromatography mass spectrometry (LC–MS) grade acetonitrile (ACN), formic acid, ammonium acetate, analytical grade potassium dihydrogen phosphate, and dipotassium hydrogen phosphate were purchased from Fisher Scientific (Fair Lawn, NJ, USA).
2.2. Liquid chromatography-tandem mass spectra analysis
The sample analysis was conducted using UPLC-MS/MS. The UPLC-MS/MS system comprised of a Waters Acquity I class UPLC system coupled with Waters Xevo TQ-S Micro mass spectrometer (Waters Corp., Milford, MA, USA). The chromatographic separations of the metabolites were performed on a Waters Acquity BEH, C18, 1.7 μm, 2.1 × 50 mm column maintained at a temperature of 45 °C. The mobile phase was either solvent A as 0.1 % v/v formic acid in water (for positive mode of ionization) or 5 mM ammonium acetate in water (for negative mode of ionization) and ACN as solvent B for both ionization modes delivered at a flow rate of 0.3 mL/min with a linear gradient as follows: 5 % B until 0.5 min, 5–90 % B over 2.0 min, maintained at 90 % B until 2.5 min and immediately decreased to 5 % B and maintained at 5 % B until 3 min. The data was acquired using MassLynx® software. The mass spectrometer was operated in the positive electrospray mode for all analytes except for 4-hydroxymephenytoin for which negative electrospray ionization mode was used. The capillary temperature was maintained at 450 °C, source temperature at 150 °C, capillary voltage 0.8 kV for positive mode ionization and −3.0 kV for negative mode ionization, desolvation gas and cone gas flows were set to 900 L/hr and 50 L/hr respectively. The MS/MS analysis was performed using argon as the collision gas. The analysis was conducted in multiple reaction monitoring mode (MRM), the details of the MRM transition, collision energy and cone voltages are shown in Supplemental Table S1. The representative chromatograms of the metabolites are shown in Fig. S1.
2.3. CYP450 inhibition assay
The CYP450 inhibitory potential of kratom alkaloids (MTG, SPG, SPC, COR, 7HMG and PAY) was evaluated as described previously with some modification (Yao et al., 2007). Phenacetin O-deethylation, amodiaquine N-deethylation, diclofenac 4′-hydroxylation, S-mephenytoin 4′-hydroxylation, dextromethorphan O-demethylation, testosterone 6β-hydroxylation and midazolam 1′-hydroxylation reactions were used as probe activities in human liver microsomes for CYP1A2, CYP2C8, CYP2C9, CYP2C19, CYP2D6, CYP3A4/5, and CYP3A4/5, respectively. The reported Km values were used to determine concentrations of all CYP450 probe substrates. (Yao et al., 2007). The stock solutions of all tested kratom alkaloids and CYP450 probe substrates were prepared in ACN and these were serially diluted with ACN to obtain the required concentration. The final organic solvent concentration in the incubation medium was kept at 0.5 % v/v. Briefly, the incubation mixture containing pooled HLMs (0.1 mg/ml), a selective CYP450 substrate, and the kratom alkaloid were preincubated for 5 min at 37 °C. The reactions were initiated by addition of NADPH solution (1 mM) and kept in an incubator shaker at 100 rpm and 37 °C. At the end of incubation, the reactions were terminated by the addition of 4 volumes of ice-cold ACN containing a mixture of caffeine (for positive mode of ionization) and quercetin (for negative mode of ionization) as internal standards (IS) at a concentration of 25 ng/mL each. Further, the control incubation (without the test compound or positive control inhibitor) was performed and the organic solvent content (by addition of test compound/inhibitor) in the control incubation was adjusted by adding an equivalent volume of ACN. In addition, incubation mixtures containing known CYP450 inhibitors were included as positive controls. All incubations were performed in triplicate. The details of incubation are shown in Table S2. Quenched samples were then filtered through a 0.45 μm 96 well filtration plate under centrifugation at a speed of 3000 ×g for 5 min maintained at 4 °C. The filtrate was diluted with an equal volume of water and injected into the UPLC-MS/MS system and the IC50 values were determined as described in the data analysis (Section 2.5).
2.4. Determination of enzyme inhibition constant (Ki) of MTG and COR for CYP2D6
Based on the IC50 values, the Ki values of MTG and COR for CYP2D6 were determined as described previously (Kakkar et al., 1999). Dextromethorphan (2.5, 5, 7, 25, 50 and 100 μM) was used as a probe substrate for CYP2D6 activity. For the Ki determination, MTG (0, 0.25, 0.5, 0.75, 1 and 2.5 μM), COR (0, 0.75, 1.5, 2.25, 3 and 7.5 μM) and quinidine (positive control; 0, 0.025, 0.05, 0.075, 0.1, and 0.25 μM) were incubated with different concentrations of dextromethorphan in HLM. The incubation conditions and sample preparation procedure were the same as described in Section 2.3. All incubations were conducted in triplicate.
2.5. Data analysis
The percentage of activity remaining was calculated by comparing the metabolite formation in test incubation relative to the metabolite formed in control incubation. The percentage inhibition versus inhibitor concentration data was plotted using a nonlinear regression curve fit function in GraphPad Prism® version 5.0 (La Jolla, CA, USA). The IC50 values were determined by interpolating the curve at 50 % inhibition. The most appropriate inhibition model was selected based upon the coefficient of determination (R2), Akaike’s Information Criterion (AIC) obtained from Phoenix WinNonlin®6.4 and a visual inspection of the data. The visual inspection of the Eadie-Hofstee diagnostic plot in the presence of a different concentration of inhibitor was performed. For the estimation of Ki, in the case of competitive inhibition, a secondary plot of apparent Km values was plotted as a function of inhibitor concentration where the x-intercept represented the negative value of the Ki (Copeland, 2000).
3. Results
3.1. CYP450 inhibition assay
The inhibitory effects of MTG and COR on the activities of CYP450 enzymes at a microsomal protein concentration of 0.1 mg/mL are shown in Figs. 2,3 while the inhibitory effects of SPG, SPC, 7HMG, and PAY are shown Supplemental Figs. S2–S5. The corresponding IC50 values are listed in Table 1. The IC50 values obtained for the positive controls are mentioned in the footnotes of Table 1 and were in agreement with published values (Yao et al., 2007; Walsky et al., 2005). Among the six isoform activities tested, CYP2D6 activity was strongly inhibited by MTG and COR with IC50 values of 2.2 and 4.2 μM, respectively (Table 1).
Fig. 2.

Inhibition curves of mitragynine (MTG) for human CYP450 activities using probe substrates in HLMs. Phenacetin O-deethylase for CYP1A2, amodiaquine N-deethylase for CYP2C8, diclofenac 4′-hydroxylase for CYP2C9 (top panel left to right), S-mephenytoin 4′-hydroxylase for CYP2C19, dextromethorphan O-demethylase for CYP2D6, midazolam 1′-hydroxylase for CYP3A4/5 (middle panel left to right) and testosterone 6β-hydroxylase for CYP3A4/5 (bottom). The data plotted as the mean ± SD of triplicate determinations. The solid lines represent the best fit to the data using nonlinear regression.
Fig. 3.

Inhibition curves of corynantheidine (COR) for human CYP450 activities using probe substrates in HLMs, phenacetin O-deethylase for CYP1A2, amodiaquine N-deethylase for CYP2C8, diclofenac 4′-hydroxylase for CYP2C9 (top panel left to right), S-mephenytoin 4′-hydroxylase for CYP2C19, dextromethorphan O-demethylase for CYP2D6, midazolam 1′-hydroxylase for CYP3A4/5 (middle panel left to right) and testosterone 6β-hydroxylase for CYP3A4/5 (bottom). The data plotted as the mean ± SD of triplicate determinations. The solid lines represent the best fit to the data using nonlinear regression.
Table 1.
IC50 values of kratom alkaloids for each CYP450 isozyme in human liver microsomes.
| CYP450s | Reaction | IC50 (μM) |
|||||
|---|---|---|---|---|---|---|---|
| MTG | SPG | SPC | COR | 7HMG | PAY | ||
| CYP1A2 | Phenacetin O-deethylase | > 45 | > 45 | > 45 | > 45 | > 45 | > 45 |
| CYP2C8 | Amodiaquine N-deethylase | 33.5 | > 45 | 36.6 | > 45 | > 45 | > 45 |
| CYP2C9 | Diclofenac 4′-hydroxylase | > 45 | > 45 | > 45 | 27.7 | > 45 | 15.7 |
| CYP2C19 | S-Mephenytoin 4′-hydroxylase | 10.5 | 19.5 | 8 | > 45 | 27.7 | 38.4 |
| CYP2D6 | Dextromethorphan O-demethylase | 2.2 | 12.9 | > 45 | 4.2 | > 45 | 6.0 |
| CYP3A4/5 | Midazolam 1′-hydroxylase | 11.4 | 13.5 | 26.4 | 7.3 | > 45 | 7.9 |
| CYP3A4/5 | Testosterone 6β-hydroxylase | > 45 | > 45 | > 45 | > 45 | > 45 | > 45 |
Data are expressed as the mean of triplicate determinations. The IC50 values obtained for positive control inhibitors used for CYP450 inhibition were as follows: CYP1A2, α-naphthoflavone (0.016 μM); CYP2C8, montelukast (0.083 μM); CYP2C9, sulfaphenazole (0.431 μM); CYP2C19, (+)-N-3-Benzylnirvanol (0.217 μM); CYP2D6, quinidine (0.056 μM); CYP3A4/5 midazolam and testosterone, ketoconazole (0.022 and 0.036 μM).
Interestingly, SPG diastereomers of MTG had shown moderate inhibition of CYP2D6 activity (IC50 = 12.9 μM), while SPC showed weak inhibition of CYP2D6 activity (IC50 > 45 μM). PAY also showed moderate inhibition of CYP2D6 activity (IC50 = 6.0 μM). In the case of other CYP450 enzymes, moderate inhibition of CYP2C19 activity was observed by SPC, MTG and SPG with IC50 values of 8.0, 10.5 and 19.5 μM, respectively (Table 1). Interestingly, moderate inhibition of only midazolam dependent CYP3A4/5 activity by COR, PAY and MTG was observed with an IC50 value of 7.3, 7.9 and 11.4 μM, respectively, while no inhibitory effect was observed when testosterone was used as probe substrate (IC50 > 45 μM). This substrate-dependent inhibition phenomenon of CYP3A4 activity might be attributed to the multiple binding sites for substrates within its active site (Kenworthy et al., 1999). None of the other tested CYP450 enzyme activities were inhibited by MTG, SPG, SPC, COR, 7HMG or PAY. Based on the CYP2D6 IC50 values (≤ 5 μM) for MTG and COR, enzyme kinetic assays were conducted with varying concentration of MTG or COR and dextromethorphan (CYP2D6 substrate) to characterize the type of reversible inhibition of CYP2D6. Representative Eadie-Hofstee plots for the inhibition of CYP2D6 by MTG and COR in human liver microsomes are shown in Fig. 4. The inhibition type was determined by the best fit to competitive mode of inhibition based on AIC values. MTG and COR strongly and selectively inhibited CYP2D6 with Ki values of 1.1 and 2.8 μM, respectively.
Fig. 4.

Eadie-Hofstee plot for CYP2D6 (dextromethorphan O-demethylase) activity in presence of varying concentrations of mitragynine (MTG, left panel) and corynanthedine (COR, right panel) in HLMs. The inset depicts secondary plot of Km, app versus inhibitor concentration for MTG and COR, where the slope of the line represents (Km/Ki value) while Y-intercept and X-intercept represents Km and Ki values. Each data plotted as a mean of triplicate determinations. The solid lines represent the best fit to the data using linear regression.
4. Discussion
To the best of our knowledge, this is the first comprehensive report of in vitro drug interaction potentials of MTG, SPG, SPC, COR, 7HMG, and PAY studied individually against six important CYP450 isoforms in human liver microsomes. In this study, we have demonstrated that MTG and COR are potent and relatively selective inhibitors of CYP2D6 activity in vitro, while PAY showed moderate inhibition of CYP2D6 activity. Both MTG and COR exhibited the competitive type of reversible inhibition of CYP2D6 activity. In the case of other CYP450 isoforms, moderate inhibition of CYP2C19 (by SPC, MTG and SPG) and midazolam 1′-hydroxylase activity of CYP3A4/5 (by COR, PAY and MTG) was observed. While other tested CYP450 isoforms activities were not inhibited by MTG, SPG, SPC, COR, 7HMG or PAY. Further, we did not observe any structure-activity relationship between these alkaloids with CYP450 inhibition, except in the case of CYP2D6 and CYP3A4/5 midazolam 1′-hydroxylase activity inhibition, some extent of correlation was observed with the three-dimensional (3D) structures of these alkaloids. The MTG, COR, PAY and SPG have more planar 3D structure where indoloquinazoline moiety of these compounds was completely overlapped as shown in Fig. 5A. These four alkaloids displayed strong inhibition of CYP2D6 and CYP3A4/5 midazolam 1′-hydroxylase activity (Table 1). Meanwhile, in the case of 7HMG, the hydroxy group at C-7 position twisted the indole moiety out of the plane compared to MTG as shown in Fig. 5B. On the other hand, the change in the chirality at the C-3 position from S to R resulted in significant change in the 3D structure of SPC as a result of the quinazolinemethoxyacrylate group taking an axial orientation rather than the equatorial as shown in Fig. 5C. These nonplanar structures of 7HMG and SPC might have resulted in the weak inhibition of CYP2D6 and CYP3A4/5 midazolam 1′-hydroxylase activity.
Fig. 5.

Overlaid 3-dimensional structures of kratom alkaloids (A) mitragynine (blue), corynantheidine (red), speciogynine (green) and paynantheine (cyan), (B) mitragynine (blue) and 7-hydroxymitragynine (red) and (C) mitragynine (blue) and speciociliatine (red). The 3D structures of the alkaloids were obtained from PubChem and overlaid using Chem3D® 10.0 software.
Generally, pharmacokinetic drug interactions occur when a co-administered drug alters the metabolism of other drugs and they are often associated with altered activity of drug metabolizing enzymes mainly due to inhibition or induction. The CYP450 family plays a predominant role in the clearance of the majority of currently marketed drugs (Ingelman-Sundberg and Evans, 2001). Although CYP2D6 represent 2–5 % of the total hepatic CYP450 content, it is known to metabolize almost 25 % of clinically used drugs, including: antidepressants, antiarrhythmics, analgesics and antipsychotics (Cho et al., 2014; Ingelman-Sundberg and Evans, 2001). In addition, CYP2D6 is known to be non-inducible, however, it is one of the most polymorphic CYP450 isoforms with 75 unique alleles identified to date, resulting in a varying extent of drug metabolizing capacities in the population (Ingelman-Sundberg and Evans, 2001). Thus, any alteration in the activity of CYP2D6 may pose serious clinical implications especially in the case of drugs with a narrow therapeutic index.
In vitro inhibition data has shown to be useful in the prediction of the magnitude of clinical drug-drug interaction (DDI) (Obach et al., 2006). In the case of reversible competitive inhibition, the magnitude of the change in exposure of drug is related to the potency of the inhibitor (Ki). However, the concentration of the inhibitor in vivo ([I]in vivo) and the fraction of the metabolic clearance of the affected drug mediated by the inhibited CYP450 isoform [fm, CYP450, in this case fm, CYP2D6] are also important determinants. The relationship between them has been previously described (Ito et al., 2005; Obach et al., 2006; Rowland and Matin, 1973).
| (1) |
Where AUCinhibited and AUCcontrol represent the area under the curve of an affected drug in the presence and absence of the inhibitor. The contribution of CYP2D6 mediated metabolism (CYP2D6 content in the intestine was 0.7 % of total CYP450) in the gut wall was considered to be negligible (Paine et al., 2006). Hence, the changes in the exposure of affected drug due to the inhibition of intestinal metabolism mediated by CYP2D6 were assumed to be minimal. The exposure differences in the drugs metabolized by hepatic CYP2D6 in presence of MTG or COR could be estimated using Equation 1. The values used for fm, CYP2D6 for known CYP2D6 substrates metoprolol, dextromethorphan and desipramine (0.8, 1 and 0.9, respectively) were obtained from the literature Obach et al., 2006). In general, the [I]in vivo values used in these predictions are a total systemic Cmax, free systemic Cmax, total hepatic inlet Cmax estimated after oral administration or free hepatic inlet Cmax. However, none of these values are available for COR; in the case of MTG, Cmax value (18–105 ng/ml, 0.045 to 0.26 μM) following oral administration kratom tea to chronic kratom user in Thailand has been reported (Trakulsrichai et al., 2015). Surprisingly, in the United States, MTG serum concentration levels reported in deceased kratom users varied widely from 16 to 4800 ng/mL (0.041–12.05 μM) (Gershman et al., 2019). This extent of variation in the systemic concentration of MTG is likely caused by the type of products consumed by the United States population (which include dried leaf powder, tablets, capsules, extracts, etc.) compared to the native users of kratom (fresh leaf material consumed either by chewing or brewing into tea) (Lydecker et al., 2016; Sharma et al., 2019). Importantly, these MTG serum concentrations represent concentrations obtained during autopsies, whereas the actual Cmax concentration is expected to be higher than the reported concentration post-mortem. For the prediction of changes in the exposure in the presence of MTG, in vivo concentrations were considered as a low of 0.041 and a high of 12.05 μM. The AUCinhibited to AUCcontrol ratio was estimated to be 1.17–11.95 for MTG using Eq. 1 as shown in Table 2. The FDA guidance on in vitro metabolism mediated DDI studies recommends that if the AUCinhibited to AUCcontrol ratio is greater than 1.02 then further investigation of DDI potential should be evaluated either by using mechanistic models or conducting clinical DDI studies with a sensitive index substrate (United States Food and Drug Administration, 2017). In this case, the ratio is higher than the cut-off value even at the lowest observed MTG concentrations as shown in Table 2. This suggests that MTG may affect the clearance of drugs metabolized by CYP2D6, which in turn warrants further investigation of DDI potential. The in vivo concentration of COR in humans are not available in the literature, therefore it is difficult to predict the extent of drug interaction mediated by CYP2D6 inhibition. However, the Ki value for COR is higher than the MTG and its natural abundance in the kratom leaves is less than < 1 % of total alkaloidal content (Hassan et al., 2013) so it could be hypothesized that its systemic exposure would be much lower than MTG, suggesting a minimal extent of DDI.
Table 2.
Prediction of maximum drug-drug interactions potential of MTG with drugs metabolized by CYP2D6.
| MTG concentration (I) | Drugs metabolized by CYP2D6 | Fold increase in exposure (AUCinhibited/AUCcontrol) |
|
|---|---|---|---|
| Cmax total | a fu x Cmax | ||
| Low (0.041 μM) | Metoprolol | 1.03 | 1.00 |
| Dextromethorphan | 1.04 | 1.00 | |
| Desipramine | 1.03 | 1.00 | |
| High (12.05 μM) | Metoprolol | 3.75 | 1.17 |
| Dextromethorphan | 11.95 | 1.22 | |
| Desipramine | 5.70 | 1.19 | |
uThe values for human plasma free fraction (f) for MTG (0.02) and COR (0.02) were determined in-house.
Furthermore, the rise of kratom consumption in the western world is mainly due to the ease of access and the availability of kratom products on the internet (Veltri and Grundmann, 2019). Kratom itself, or any of its alkaloids, specifically MTG or 7HMG are not controlled substances in the United States. Due to the public outcry, the scheduling of MTG and 7HMG by the US Drug Enforcement Administration (DEA) has not taken place (Veltri and Grundmann, 2019). Due to the unregulated use of kratom, the National Poison Center reporting database has documented 1807 cases of kratom exposure between 2011–2017 (Olsen et al., 2019). The Center for Disease Control and Prevention (CDC) analyzed 27,338 drug overdose deaths during the period of July 2016–December 2017. Among these 27,338 cases, 152 cases existed where individuals were tested positive for kratom in post-mortem toxicology testing. Of these cases, 91 deaths were declared to be associated with kratom, but in only 7 cases kratom was the lone substance detected (Olsen et al., 2019). Thus, the presence of multiple drugs in most of these cases suggest the potential role of DDI as possible causes of deaths (Gershman et al., 2019; Kamble et al., 2019; Olsen et al., 2019). MTG had been shown to be predominantly metabolized by CYP3A4 in humans (Kamble et al., 2019) and as shown here, it strongly inhibits CYP2D6 activity. Thus, further studies evaluating DDIs due to altered activities of CYP3A4 and CYP2D6 should be performed to understand the contribution of MTG implication in these deaths.
In conclusion, MTG and COR were found to be potent inhibitors of CYP2D6 activity, while among the other tested kratom alkaloids, SPG and PAY had shown a moderate inhibitory effect on CYP2D6 activity. Moderate inhibition of CYP2C19 by SPC, MTG, SPG and midazolam hydroxylase CYP3A4/5 activity by COR, PAY and MTG was observed. Clinically significant adverse drug interactions associated with kratom are most likely with drugs that are substantially metabolized by CYP2D6.
Supplementary Material
Acknowledgement
This study was supported by UG3 DA048353 and < GN1 > R01 < / GN1 > DA047855 grants from the National Institute on Drug Abuse.
Abbreviations:
- CYP450
Cytochrome P450
- MTG
mitragynine
- SPG
speciogynine
- SPC
speciocilliatine
- COR
corynantheidine
- 7HMG
7-hydroxymitragynine
- PAY
paynantheine
- HLM
human liver microsome
- ACN
acetonitrile
- DDI
drug-drug interaction
- NADPH
Nicotinamide adenine dinucleotide phosphate reduced
Footnotes
Declaration of Competing Interest
The authors declare no conflicts of interest.
Appendix A. Supplementary data
Supplementary material related to this article can be found, in the online version, at doi:https://doi.org/10.1016/j.toxlet.2019.11.005.
References
- Bjornsson TD, et al. , 2003. The conduct of in vitro and in vivo drug-drug interaction studies: a Pharmaceutical Research and Manufacturers of America (PhRMA) perspective. Drug Metab. Dispos. 31, 815–832. [DOI] [PubMed] [Google Scholar]
- Boyer EW, et al. , 2008. Self-treatment of opioid withdrawal using kratom (Mitragynia speciosa korth). Addiction 103, 1048–1050. [DOI] [PMC free article] [PubMed] [Google Scholar]
- Cho DY, et al. , 2014. Selective inhibition of cytochrome P450 2D6 by Sarpogrelate and its active metabolite, M-1, in human liver microsomes. Drug Metab. Dispos. 42, 33–39. [DOI] [PubMed] [Google Scholar]
- Cinosi E, et al. , 2015. Following “the Roots” of Kratom (Mitragyna speciosa): the evolution of an enhancer from a traditional use to increase work and productivity in southeast asia to a recreational psychoactive drug in western countries. Biomed Res. Int. 2015, 968786. [DOI] [PMC free article] [PubMed] [Google Scholar]
- Copeland RA, 2000. Enzymes: A Practical Introduction to Structure, Mechanism, and Data Analysis. Wiley-VCH Publishers, New York, pp. 266–304. [Google Scholar]
- Gershman K, et al. , 2019. Deaths in Colorado attributed to Kratom. N. Engl. J. Med. 380, 97–98. [DOI] [PMC free article] [PubMed] [Google Scholar]
- Hanapi NA, et al. , 2013. Inhibitory effect of mitragynine on human cytochrome P450 enzyme activities. Pharmacognosy Res. 5, 241–246. [DOI] [PMC free article] [PubMed] [Google Scholar]
- Hassan Z, et al. , 2013. From Kratom to mitragynine and its derivatives: physiological and behavioural effects related to use, abuse, and addiction. Neurosci. Biobehav. Rev. 37, 138–151. [DOI] [PubMed] [Google Scholar]
- Hemby SE, et al. , 2019. Abuse liability and therapeutic potential of the Mitragyna speciosa (kratom) alkaloids mitragynine and 7-hydroxymitragynine. Addict. Biol. 24, 874–885. [DOI] [PubMed] [Google Scholar]
- Ingelman-Sundberg M, Evans WE, 2001. Unravelling the functional genomics of the human CYP2D6 gene locus. Pharmacogenetics 11, 553–554. [DOI] [PubMed] [Google Scholar]
- Ito K, et al. , 2005. Impact of parallel pathways of drug elimination and multiple cytochrome P450 involvement on drug-drug interactions: CYP2D6 paradigm. Drug Metab. Dispos. 33, 837–844. [DOI] [PubMed] [Google Scholar]
- Kakkar T, et al. , 1999. Estimation of Ki in a competitive enzyme-inhibition model: comparisons among three methods of data analysis. Drug Metab. Dispos. 27, 756–762. [PubMed] [Google Scholar]
- Kamble SH, et al. , 2019. Metabolite profiling and identification of enzymes responsible for the metabolism of mitragynine, the major alkaloid of Mitragyna speciosa (kratom). Xenobiotica 49, 1279–1288. [DOI] [PubMed] [Google Scholar]
- Kenworthy KE, et al. , 1999. CYP3A4 drug interactions: correlation of 10 in vitro probe substrates. Br. J. Clin. Pharmacol. 48, 716–727. [DOI] [PMC free article] [PubMed] [Google Scholar]
- Kong WM, et al. , 2011. Evaluation of the effects of Mitragyna speciosa alkaloid extract on cytochrome P450 enzymes using a high throughput assay. Molecules 16, 7344–7356. [DOI] [PMC free article] [PubMed] [Google Scholar]
- Kronstrand R, et al. , 2011. Unintentional fatal intoxications with mitragynine and Odesmethyltramadol from the herbal blend Krypton. J. Anal. Toxicol. 35, 242–247. [DOI] [PubMed] [Google Scholar]
- Kruegel AC, et al. , 2016. Synthetic and receptor signaling explorations of the mitragyna alkaloids: mitragynine as an atypical molecular framework for opioid receptor modulators. J. Am. Chem. Soc. 138, 6754–6764. [DOI] [PMC free article] [PubMed] [Google Scholar]
- Lee MJ, et al. , 2018. Method validation in quantitative analysis of phase I and phase II metabolites of mitragynine in human urine using liquid chromatography-tandem mass spectrometry. Anal. Biochem. 543, 146–161. [DOI] [PubMed] [Google Scholar]
- Lim EL, et al. , 2013. In vitro evaluation of cytochrome P450 induction and the inhibition potential of mitragynine, a stimulant alkaloid. Toxicol. In Vitro 27, 812–824. [DOI] [PubMed] [Google Scholar]
- Lin JH, Lu AY, 1998. Inhibition and induction of cytochrome P450 and the clinical implications. Clin. Pharmacokinet. 35, 361–390. [DOI] [PubMed] [Google Scholar]
- Lydecker AG, et al. , 2016. Suspected adulteration of commercial kratom products with 7-hydroxymitragynine. J. Med. Toxicol. 12, 341–349. [DOI] [PMC free article] [PubMed] [Google Scholar]
- Obach RS, et al. , 2006. The utility of in vitro cytochrome P450 inhibition data in the prediction of drug-drug interactions. J. Pharmacol. Exp. Ther. 316, 336–348. [DOI] [PubMed] [Google Scholar]
- Olsen EO, et al. , 2019. Notes from the field: unintentional drug overdose deaths with kratom detected - 27 states, July 2016-December 2017. MMWR Morb. Mortal. Wkly. Rep. 68, 326–327. [DOI] [PMC free article] [PubMed] [Google Scholar]
- Paine MF, et al. , 2006. The human intestinal cytochrome P450 “pie”. Drug Metab. Dispos. 34, 880–886. [DOI] [PMC free article] [PubMed] [Google Scholar]
- Prozialeck WC, et al. , 2019. Kratom policy: the challenge of balancing therapeutic potential with public safety. Int. J. Drug Policy 70, 70–77. [DOI] [PMC free article] [PubMed] [Google Scholar]
- Prozialeck WC, et al. , 2012. Pharmacology of kratom: an emerging botanical agent with stimulant, analgesic and opioid-like effects. J. Am. Osteopath. Assoc. 112, 792–799. [PubMed] [Google Scholar]
- Rowland M, Matin SB, 1973. Kinetics of drug-drug interactions. J. Pharmacokinet. Biopharm. 1, 553–567. [DOI] [PubMed] [Google Scholar]
- Sharma A, et al. , 2019. Simultaneous quantification of ten key Kratom alkaloids in Mitragyna speciosa leaf extracts and commercial products by ultra-performance liquid chromatography-tandem mass spectrometry. Drug Test. Anal. 11, 1162–1171. [DOI] [PMC free article] [PubMed] [Google Scholar]
- Stresser DM, et al. , 2000. Substrate-dependent modulation of CYP3A4 catalytic activity: analysis of 27 test compounds with four fluorometric substrates. Drug Metab. Dispos. 28, 1440–1448. [PubMed] [Google Scholar]
- Swogger MT, et al. , 2015. Experiences of kratom users: a qualitative analysis. J. Psychoactive Drugs 47, 360–367. [DOI] [PMC free article] [PubMed] [Google Scholar]
- Takayama H, 2004. Chemistry and pharmacology of analgesic indole alkaloids from the rubiaceous plant, Mitragyna speciosa. Chem. Pharm. Bull. (Tokyo) 52, 916–928. [DOI] [PubMed] [Google Scholar]
- Takayama H, et al. , 2002. Studies on the synthesis and opioid agonistic activities of mitragynine-related indole alkaloids: discovery of opioid agonists structurally different from other opioid ligands. J. Med. Chem. 45, 1949–1956. [DOI] [PubMed] [Google Scholar]
- Trakulsrichai S, et al. , 2015. Pharmacokinetics of mitragynine in man. Drug Des. Devel. Ther. 9, 2421–2429. [DOI] [PMC free article] [PubMed] [Google Scholar]
- United States Food and Drug Administration, 2017. Draft guidance for industry. Vitro Metabolism and Transporter Mediated Drug-Drug Interaction Studies. [Google Scholar]
- Veltri C, Grundmann O, 2019. Current perspectives on the impact of kratom use. Subst. Abuse Rehabil. 10, 23–31. [DOI] [PMC free article] [PubMed] [Google Scholar]
- Walsky RL, et al. , 2005. Selective inhibition of human cytochrome P4502C8 by montelukast. Drug Metab. Dispos. 33, 413–418. [DOI] [PubMed] [Google Scholar]
- Warner ML, et al. , 2016. The pharmacology and toxicology of kratom: from traditional herb to drug of abuse. Int. J. Legal Med. 130, 127–138. [DOI] [PubMed] [Google Scholar]
- Wienkers LC, Heath TG, 2005. Predicting in vivo drug interactions from in vitro drug discovery data. Nat. Rev. Drug Discov. 4, 825–833. [DOI] [PubMed] [Google Scholar]
- Yao M, et al. , 2007. Development and full validation of six inhibition assays for five major cytochrome P450 enzymes in human liver microsomes using an automated 96-well microplate incubation format and LC-MS/MS analysis. J. Pharm. Biomed. Anal. 44, 211–223. [DOI] [PubMed] [Google Scholar]
Associated Data
This section collects any data citations, data availability statements, or supplementary materials included in this article.