

Abstract
Vascular contributions to early cognitive decline are increasingly recognized, prompting further investigation into the nature of related changes in perivascular spaces (PVS). Using magnetic resonance imaging, we show that, compared to a cognitively normal sample, individuals with early cognitive dysfunction have altered PVS presence and distribution, irrespective of Amyloid-β. Surprisingly, we noted lower PVS presence in the anterosuperior medial temporal lobe (1.29 times lower PVS volume fraction in cognitively impaired individuals compared with those unimpaired, p < 0.0001), which was associated with neurofibrillary tau tangle deposition in the right entorhinal cortex (beta (SE) = −0.98 (0.4); p = 0.014), one of the hallmarks of early Alzheimer’s disease pathology. We also observed higher PVS volume fraction in centrum semi-ovale of the white matter, but only in female participants (1.47 times higher PVS volume fraction in cognitively impaired individuals compared with those unimpaired, p = 0.0011). Furthermore, we observed PVS changes in participants with history of hypertension (higher PVS volume fraction in the white matter and lower PVS volume fraction in the anterosuperior medial temporal lobe). Our results suggest that anatomically specific alteration of the PVS is an early neuroimaging feature of cognitive impairment in aging adults, which is differentially manifested in female.
Keywords: perivascular space, cognitive decline, Alzheimer’s disease, clearance system
Introduction
Perivascular spaces (PVS), which are the fluid-filled area surrounding the cerebral vessels, are the major component of the brain clearance system (Joanna M. Wardlaw et al., 2020). PVS accommodate the flux of the cerebrospinal fluid (CSF) in the brain and are considered to play a role in brain metabolic homeostasis. Previous studies in animals suggest that the glymphatic (glia-lymphatic) system, whose main pathway is represented by the PVS, is a substantial factor in the net clearance of Aβ (Da Mesquita et al., 2018; Iliff et al., 2012; Louveau et al., 2018; Xu et al., 2015); reduction of efflux of interstitial fluid to the CSF in PVS could lessen Aβ clearance (Park et al., 2017; Rasmussen et al., 2018; Sweeney et al., 2018). Such an impaired clearance from the brain parenchyma could in part explain the accumulation of Aβ (Rasmussen et al., 2018).
Aβ deposition in the wall of leptomeningeal and intraparenchymal cerebral arteries is a common observation in Alzheimer’ disease (AD), that is thought to be associated with the enlargement of PVS as routes of Aβ clearance (Blair et al., 2015; Kalaria and Ballard, 1999; R. O. Weller et al., 2008). PVS changes have been linked to vascular diseases, including cerebral small vessel disease, cerebral amyloid angiopathy, blood-brain barrier (BBB) breakdown, hypertension and lacunar stroke (Charidimou et al., 2013; Doubal et al., 2010; Klarenbeek et al., 2013; Montagne et al., 2018; Potter et al., 2015; Rouhl et al., 2008; Joanna M Wardlaw et al., 2020; R. Weller et al., 2008; Y.-C. Zhu et al., 2010). Furthermore, an emerging body of evidence suggests vascular changes are linked to both clearance system dysfunction (Bakker et al., 2016; Carare et al., 2008; Diem et al., 2017; Iliff and Nedergaard, 2013; Marchi et al., 2016; Nedergaard, 2013) and vasculotoxic effects of Aβ and tau (Blair et al., 2015; Thomas et al., 1996).
Magnetic resonance imaging (MRI) studies have found significantly larger PVS in AD patients compared with controls in the centrum semi-ovale of the white matter (CSO-WM), but not in the basal ganglia (Banerjee et al., 2017; Ramirez et al., 2015a). Interestingly, Banerjee et al. found that the perivascular spaces in the white matter were associated with AD independently of the amyloid burden (Banerjee et al., 2017). With regards to cognition the literature is inconsistent (Francis et al., 2019; Hilal et al., 2018). Several studies suggested that increased PVS was associated with cognitive impairment (Ferguson et al., 2003; Jiménez-Balado et al., 2018; MacLullich et al., 2004; Passiak et al., 2019). Another study found no association between the number of visible PVS in the basal ganglia and cognitive impairment (Jeong et al., 2015). A recent study indicated an association of PVS in white matter with cognitive impairment (Beak et al., 2015). Two other recent studies also showed increased PVS is associated with cognitive impairment (Chen et al., 2011b; Francis et al., 2019; Ramirez et al., 2015b) or lower memory performance (Valdés Hernández et al., 2019).
Early studies have mainly focused on the global PVS volume or count across the CSO-WM or basal ganglia. The anatomical distribution of PVS alterations in white matter regions, however, remains largely unexplored. To date, it has not been demonstrated whether PVS may represent an early feature of cognitive decline, nor have relationships of PVS with other pathological markers of AD, including Aβ and tau been reported. To examine whether and to what extent PVS is altered in early cognitive decline, we performed a comprehensive data-driven analysis of the multi-modal data of the Alzheimer’s Disease Neuroimaging Initiative 3 (ADNI-3) participants (N=596). Since Aβ and tau can both lead to cerebral blood vessel abnormalities (Bennett et al., 2018; Iadecola, 2017; Kisler et al., 2017), we mapped PVS using MRI data and analyzed the relationship between PVS volume fraction and Aβ and tau accumulation as measured in positron emission tomography (PET) images. Additionally, we investigated whether PVS distribution and appearance on MRI are influenced by the APOE gene, whose ε4 variant represents one of the strongest genetic risk factors for AD (Corder et al., 1993).
Method
Study Participants
Data used in the preparation of this article were obtained from the Alzheimer’s Disease Neuroimaging Initiative 3 (ADNI-3) database (http://adni.loni.usc.edu). Data from ADNI-3 cohort (Weiner et al., 2017) was used, in which both T1-weighted (T1w) and fluid-attenuated inversion recovery (FLAIR) structural magnetic resonance image (MRI) were available at the time of this study. T1w and FLAIR images for 685 participants were downloaded from the ADNI database (http://adni.loni.usc.edu) (Toga and Crawford, 2010). Demographic information, clinical and cognitive assessment, positron emission tomography (PET), cardiovascular-related health measures and cerebrospinal fluid (CSF) biomarkers were collected. 51 participants who met the AD categorization criteria were excluded (as described in Clinical and cognitive assessment section). An additional 37 participants who failed MRI quality control were excluded (as described in Mapping perivascular spaces section), resulting in a total of 596 participants.
Inclusion/Exclusion Criteria
Participants were excluded if they had any significant neurologic disease other than suspected incipient Alzheimer’s disease; exclusionary neurologic conditions included Parkinson’s disease, multi-infarct dementia, Huntington’s disease, normal pressure hydrocephalus, brain tumor, progressive supranuclear palsy, seizure disorder, subdural hematoma, multiple sclerosis, or history of significant head trauma followed by persistent neurologic deficits or known structural brain abnormalities. Additional and detailed inclusion and exclusion criterion are described in the ADNI-3 protocol (Weiner et al., 2017) and also copied in Supplementary File 1.
Clinical and cognitive assessments
The ADNI clinical dataset comprises clinical information about each participant including recruitment, demographics, physical examinations, and cognitive assessment data. Demographic information including age, sex and the years of education were gathered, which were used as covariates in all statistical analysis. A clinical interview and a general physical exam were conducted. In addition, respiration rate, blood glucose level (after overnight fasting), and systolic and diastolic pressures were acquired in the 30-day interval of the imaging visit. The cognitive assessment was performed in accordance with published standardization procedures, including standardized interview and assessment with the participant and a knowledgeable informant.
Clinical dementia rating (CDR):
Six categories of cognitive functioning (memory, orientation, judgment and problem solving, community affairs, home and hobbies, and personal care) were assessed, in which the CDR describes five degrees of impairment (Hughes et al., 1982; Morris, 1993). Participant CDR scores were obtained through a standardized interview and assessment with the participant and a knowledgeable informant.
Mini-Mental State Examination (MMSE):
The MMSE scale evaluates orientation, memory, attention, concentration, naming, repetition, comprehension, and ability to create a sentence and to copy two overlapping pentagons (Folstein et al., 1983). Participant MMSE scores were obtained through standardized interview and assessment with the participant and a knowledgeable informant
Participant categorization is detailed in the ADNI-3 protocol document. In brief:
Cognitively normal (CN):
Participants were considered CN if they had normal memory function, which was assessed using education-adjusted cutoffs on the Logical Memory II subscale from the Wechsler Memory Scale (Wechsler, 1987). Participants must also have an MMSE score between 24 and 30 and a CDR of 0 (memory box score must be 0). CN participants were considered cognitively normal based on an absence of significant impairment in cognitive functions or daily living activities.
Mild cognitive impairment (MCI):
Participants were classified as MCI if they expressed subjective memory concern, with a score below the education-adjusted cutoffs on the Logical Memory II subscale from the Wechsler Memory Scale. The same MMSE score range as CN was used for the MCI group. Participants must have a global CDR of 0.5 and the memory box score must be at least 0.5. General cognition and functional performance of the MCI participants must be sufficiently preserved such that clinical diagnosis of Alzheimer’s disease could not be made.
Alzheimer’s disease (AD):
Participants categorized as AD were excluded from this study, to ensure the focus on early cognitive decline. In brief, participants were considered AD if they scored below the education-adjusted cutoff of the Wechsler Memory Scale, had an MMSE score between 20 to 24 and global CDR>= 0.5 (Weiner et al., 2017).
Genotyping
A 7 mL sample of blood was taken in ethylenediaminetetraacetic acid (EDTA)-containing vacutainer tubes and genomic DNA was extracted at Cogenics (now Beckman Coulter Genomics) using the QIAamp DNA Blood Maxi Kit (Qiagen, Inc, Valencia, CA) following the manufacturer’s protocol. All DNA extraction and genotyping was done blinded to group assignment. The two SNPs (rs429358, rs7412) that define the ε2, ε3, and ε4 alleles of the apolipoprotein E (APOE) were genotyped by PCR amplification and HhaI restriction enzyme digestion. The genotype was resolved on 4% Metaphor Gel and visualized by ethidium bromide staining.
Amyloid Positron Emission Tomography (Amyloid PET)
Amyloid PET data was used to categorize participants to Aβ+ and Aβ− groups. Amyloid PET analysis was performed according to UC Berkeley PET methodology for quantitative measurement (Baker et al., 2017a; Landau et al., 2014, 2015; Schöll et al., 2016). Participants were imaged by Florbetapir (18 F-AV-45, Avid). Six 5-minute frames of AV45 were acquired. All frames were co-registered to frame 1 using NeuroStat “mcoreg” module with rigid-body translation and six degrees of freedom. All frames were averaged into a single image and reoriented into a 160×160×96 voxel image grid with 1.5 mm voxels. The reorientation was performed so that the anterior-posterior axis of the subject is parallel to the anterior-posterior commissure line.
Amyloid PET analysis
PET images were then co-registered on T1w MRI using the mutual information algorithm in SPM5 with default setting to align brain parcellation boundaries. The MRI and PET images were acquired within 3 months. Quantitative measurement was done based on Standard Uptake Value ratio (SUVR). The mean tracer uptakes in the main four cortical regions (frontal, anterior/posterior cingulate, lateral parietal, lateral temporal) were calculated. The mean of the whole cerebellum was also measured as the reference. Then, the whole cortical SUVR was calculated by averaging the mean of tracer uptake across the 4 cortical regions and dividing by the whole cerebellum reference region.
Tau PET and analysis
Tau PET was also collected by Flortaucipir (18 F-AV-1451). In this study only the Tau uptake in entorhinal region, which corresponds to the Braak stage 1 (Braak and Braak, 1996), was used to assess the correlation between PVS volume and early AD pathology. Similar pre-processing to Amyloid PET was performed to measure Tau PET SUVR in entorhinal region. The Tau PET values were normalized using cerebellar gray matter intensity.
For both Amyloid and Tau measurements, the analyzed PET from ADNI was used in this study (AV1451 version 05–12-2020 and AV45 version 08–09-2018). The technical details and reference metrics are described in ADNI-3 documents and associated publications (Baker et al., 2017b, 2017a; Braak and Braak, 1991; Brendel et al., 2015; Chen et al., 2015; Clark et al., 2011; Diedrichsen, 2006; Jagust et al., 2009; Joshi et al., 2012; Kepe, 2013; Landau et al., 2015, 2014, 2013b, 2013a, 2012; Maass et al., 2017; Mormino et al., 2009; Reilhac et al., n.d.; Schöll et al., 2016).
Cerebral spinal fluid biomarkers
CSF Aβ40, CSF Aβ42 and Tau, phosphorylated Tau181 (p-Tau) measurement were completed using the Roche Elecsys cobase 601 fully automated immunoassay platform at the ADNI biomarker core (University of Pennsylvania). CSF biomarker samples were acquired in the 30-days interval of the imaging visit. All samples were aliquoted and stored at −80°C until assay. A 2D-ultra performance liquid chromatography tandem mass spectroscopy (UPLC/MS -MS) platform was used (Kang et al., 2015; Korecka et al., 2014), which was calibrated with a surrogate calibrator matrix prepared from artificial CSF plus 4 mg/mL bovine serum albumin.
Magnetic resonance imaging
MRI imaging of the ADNI-3 was done exclusively on 3T scanners (Siemens, Philips, and GE) using a standardized protocol. 3D T1w with 1 mm3 resolution was acquired using an MPRAGE sequence (on Siemens and Philips scanners) and FSPGR (on GE scanners). For FLAIR images, a 3D sequence with similar resolution as T1w images was acquired, which provided the opportunity for accurate intrasubject intermodal co-registration. MPRAGE T1w MRI scans were acquired using the following parameters: TR = 2300 ms, TE = 2.98 ms, FOV = 240 × 256 mm2, matrix = 240 × 256 (variable slice number), TI = 900 ms, flip angle = 9, effective voxel resolution = 1 × 1 × 1 mm3. The FSPGR sequence was acquired using sagittal slices, TR = 7.3 ms, TE = 3.01 ms, FOV = 256 × 256 mm2, matrix = 256 × 256 (variable slice number), TI = 400 ms, flip angle = 11, effective voxel resolution = 1 × 1 × 1 mm3. 3D FLAIR images were acquired using sagittal slices, TR = 4,800 ms, TE = 441 ms, FOV = 256 × 256 mm2, matrix = 256 × 256 (variable slice number), TI = 1650 ms, flip angle = 120, effective voxel resolution = 1 × 1 × 1.2 mm3.
MRI preprocessing and brain parcellation
T1w preprocessing and parcellation was done using the FreeSurfer (v5.3.0) software package, which is freely available (Fischl, 2012), and data processing using the Laboratory of Neuro Imaging (LONI) pipeline system (http://pipeline.loni.usc.edu) (Dinov et al., 2010, 2009; Moon et al., 2015; Torri et al., 2012), similar to (Sepehrband et al., 2018; Sta Cruz et al., 2019). Brain volume and white matter mask were derived from the Desikan-Killiany atlas (Desikan et al., 2006). The parcellation was performed as part of the recon-all module of the FreeSurfer, which uses an atlas-based parcellation approach. Prior to parcellation, recon-all applies the following pre-processing steps: motion correction, non-uniform intensity normalization, Talairach transform computation, intensity normalization and skull stripping (Dale et al., 1999; Desikan et al., 2006; Fischl et al., 2004b, 2004a, 2002, 1999; Fischl and Dale, 2000; Reuter et al., 2012, 2010; Reuter and Fischl, 2011; Segonne et al., 2007, 2004; Sled et al., 1998; Waters et al., 2018). FLAIR images of each participants were corrected for non-uniform field inhomogeneity using N4ITK module (Tustison et al., 2010) of Advanced Normalization Tools (ANTs) (Avants et al., 2009). FLAIR images were then co-registered to T1w images using antsIntermodalityIntrasubject ANTs module.
White matter regions from FreeSurfer recon-all outputs were used to study PVS across white matter region. FreeSurfer uses Desikan-Killiany atlas (Desikan et al., 2006) to parcellate cortical area into 68 regions and also provides parcellation of the corresponding underlying white matter regions, which were used in this study. The CSO-WM region of the FreeSurfer output was also used to ensure a complete coverage of the white matter. White matter regions were extracted from aparc parcellation of the FreeSurfer recon-all pipeline that is stored as wmparc. These white matter regions are listed in Supplementary File 3.
Mapping perivascular spaces
Perivascular spaces (PVS) were mapped from T1w images and then white matter hyperintensities, which were falsely segmented as PVS, were excluded using FLAIR images. PVS segmentation was done using an automated and highly reliable quantification technique that we developed and validated (Sepehrband et al., 2019a). In brief, after preprocessing the data, T1w images were filtered using an adaptive non-local mean filtering technique (Manjón et al., 2010). The non-local mean technique measures the image intensity similarities by considering the neighboring voxels in a blockwise fashion, where the filtered image is . For each voxel (xj) the weight (ω) is measured using the Euclidean distance between 3D patches. The adaptive non-local mean filtering technique adds a regularization term to the above formulation to remove bias intensity of the Rician noise observed in MRI. Therefore the expected Euclidian distance between two noisy patches Ni and Nj is defined as: d(Ni, Nj) = ∥u0(Ni) – u0(Nj)∥2 + 2σ2, where d(Ni, Nj) = 2σ2 if Ni = Ni. The Rician noise of the MRI images, calculated using robust noise estimation technique presented by Wiest-Daessle et al. (Wiest-Daesslé et al., 2008), was used as the noise level for non-local filtering (Manjón et al., 2010). To preserve PVS voxels while removing the noise, filtering was applied only on high frequency spatial noises. This was achieved by using a filtering patch with a radius of 1 voxel, which removes the noise at a single-voxel level and preserves signal intensities that are spatially repeated (Manjón et al., 2010).
Subsequently, we applied a Frangi filter (Frangi et al., 1998) to T1w using the Quantitative Imaging Toolkit (Cabeen et al., 2018). The Frangi filter estimates a vesselness measure for each voxel from eigenvectors λ of the Hessian matrix of the image:
Where, , , .
Default parameters of : α = 0.5, β = 0.5 and c were used, as recommended in (Frangi et al., 1998). The parameter c was set to half the value of the maximum Hessian norm. Frangi filter estimated vesselness measures at different scales and provided the maximum likeliness. The scale was set to a large range of 0.1 to 5 voxels in order to maximize the vessel inclusion. The output of this step is a quantitative map of vesselness in regions of interest and is taken to be the maximum across scales, as suggested in the original paper (Frangi et al., 1998). The range corresponds to specific levels in scale space that are searched for tubular structure feature detector. Thus, the outputs across voxels comprise vesselness measured across a range of filter scales. Then vesselness threshold of 0.00002 was used to segment the PVS voxels (note that original PVS segmentation reported the scaled thresholds – the raw threshold is reported here for the ease of replication). For each segmented voxel, corresponding FLAIR voxels were checked, and if the FLAIR voxel value was a white matter hyperintensity, then the voxel was excluded from the final PVS mask. To check for white matter hyperintensities, PVS voxels that were in the top 10 percentile of the FLAIR signal distribution were excluded from the PVS mask.
Supplementary Figure 1 shows an example of the PVS map of one of the study participants. PVS segmentation performance was assessed on a sub-set of data. Twenty-five participants data were randomly chosen and PVS masks were manually corrected to include undetected PVS and exclude incorrect PVS. Then, the performance of the automated segmentation technique with and without white matter hyperintensity correction were assessed using three metrics: 1) the sensitivity (also known as recall), 2) the precision (also known as positive predictive value) and 3) F1 score (also known as Dice similarity coefficient), defined as:
where TP (True Positive) denotes the number of segmented PVS voxels by algorithm which also belong to PVS voxels of the ground truth; FN (False Negative) denotes the number of segmented background voxels by algorithm which belong to PVS of the ground truth; FP (False Positive) denotes the number of segmented PVS voxels by algorithm which belong to background of ground truth.
The sensitivity of the segmentations to PVS voxels were both 98±2 % (M±SD) for the automated mapping with and without FLAIR correction. The precision of the automated technique with and without FLAIR correction were 61±17 % (M±SD) and 93±5 % (M±SD), respectively. F1 Score of the automated technique with and without FLAIR correction were 74±14 % (M±SD) and 95±3 % (M±SD), respectively. Evaluation results highlights the importance of the postprocessing correction with FLAIR. This is because of the large presence of non-PVS hypointense signal in aging population, which could drastically affect the precision of the automated technique on T1w alone data.
T1w images were registered to the ANTs template nonlinear registration module (Avants et al., 2011, 2009), and the same transformation matrix was applied to PVS masks. PVS masks of all participants were transformed to the template space. Then the normative PVS was generated for each of the CN and MCI groups (Figure 1). The normative PVS was generated by averaging the binary PVS masks (i.e. sum of all PVS masks divided by the group size). Two regions of interest (ROIs) were then drawn on the template to enable statistical analysis of the PVS presence. The first ROI was drawn in the anterosuperior medial temporal lobe (asMTL), and the second on the centrum semi-ovale of white matter (CSO-WM). The ROIs were registered back into each subject’s space. Then, the volume of PVS in those regions were divided by the total ROI volume to extract PVS volume fraction. CSO-WM was selected because this region has been historically used as the clinical ROI to assess PVS (Joanna M Wardlaw et al., 2020). The asMTL region was included following the qualitative observation of the PVS normative map in normal aging group and individuals with cognitive deficit (Figure 1). The PVS observed in asMTL are mainly correspond to anterior temporal arteries and their sub-branches, penetrating from the anterior part of the temporal lobe along the anterior-posterior axis (Supplementary Figure 2).
Figure 1. Maps of the perivascular space (PVS).
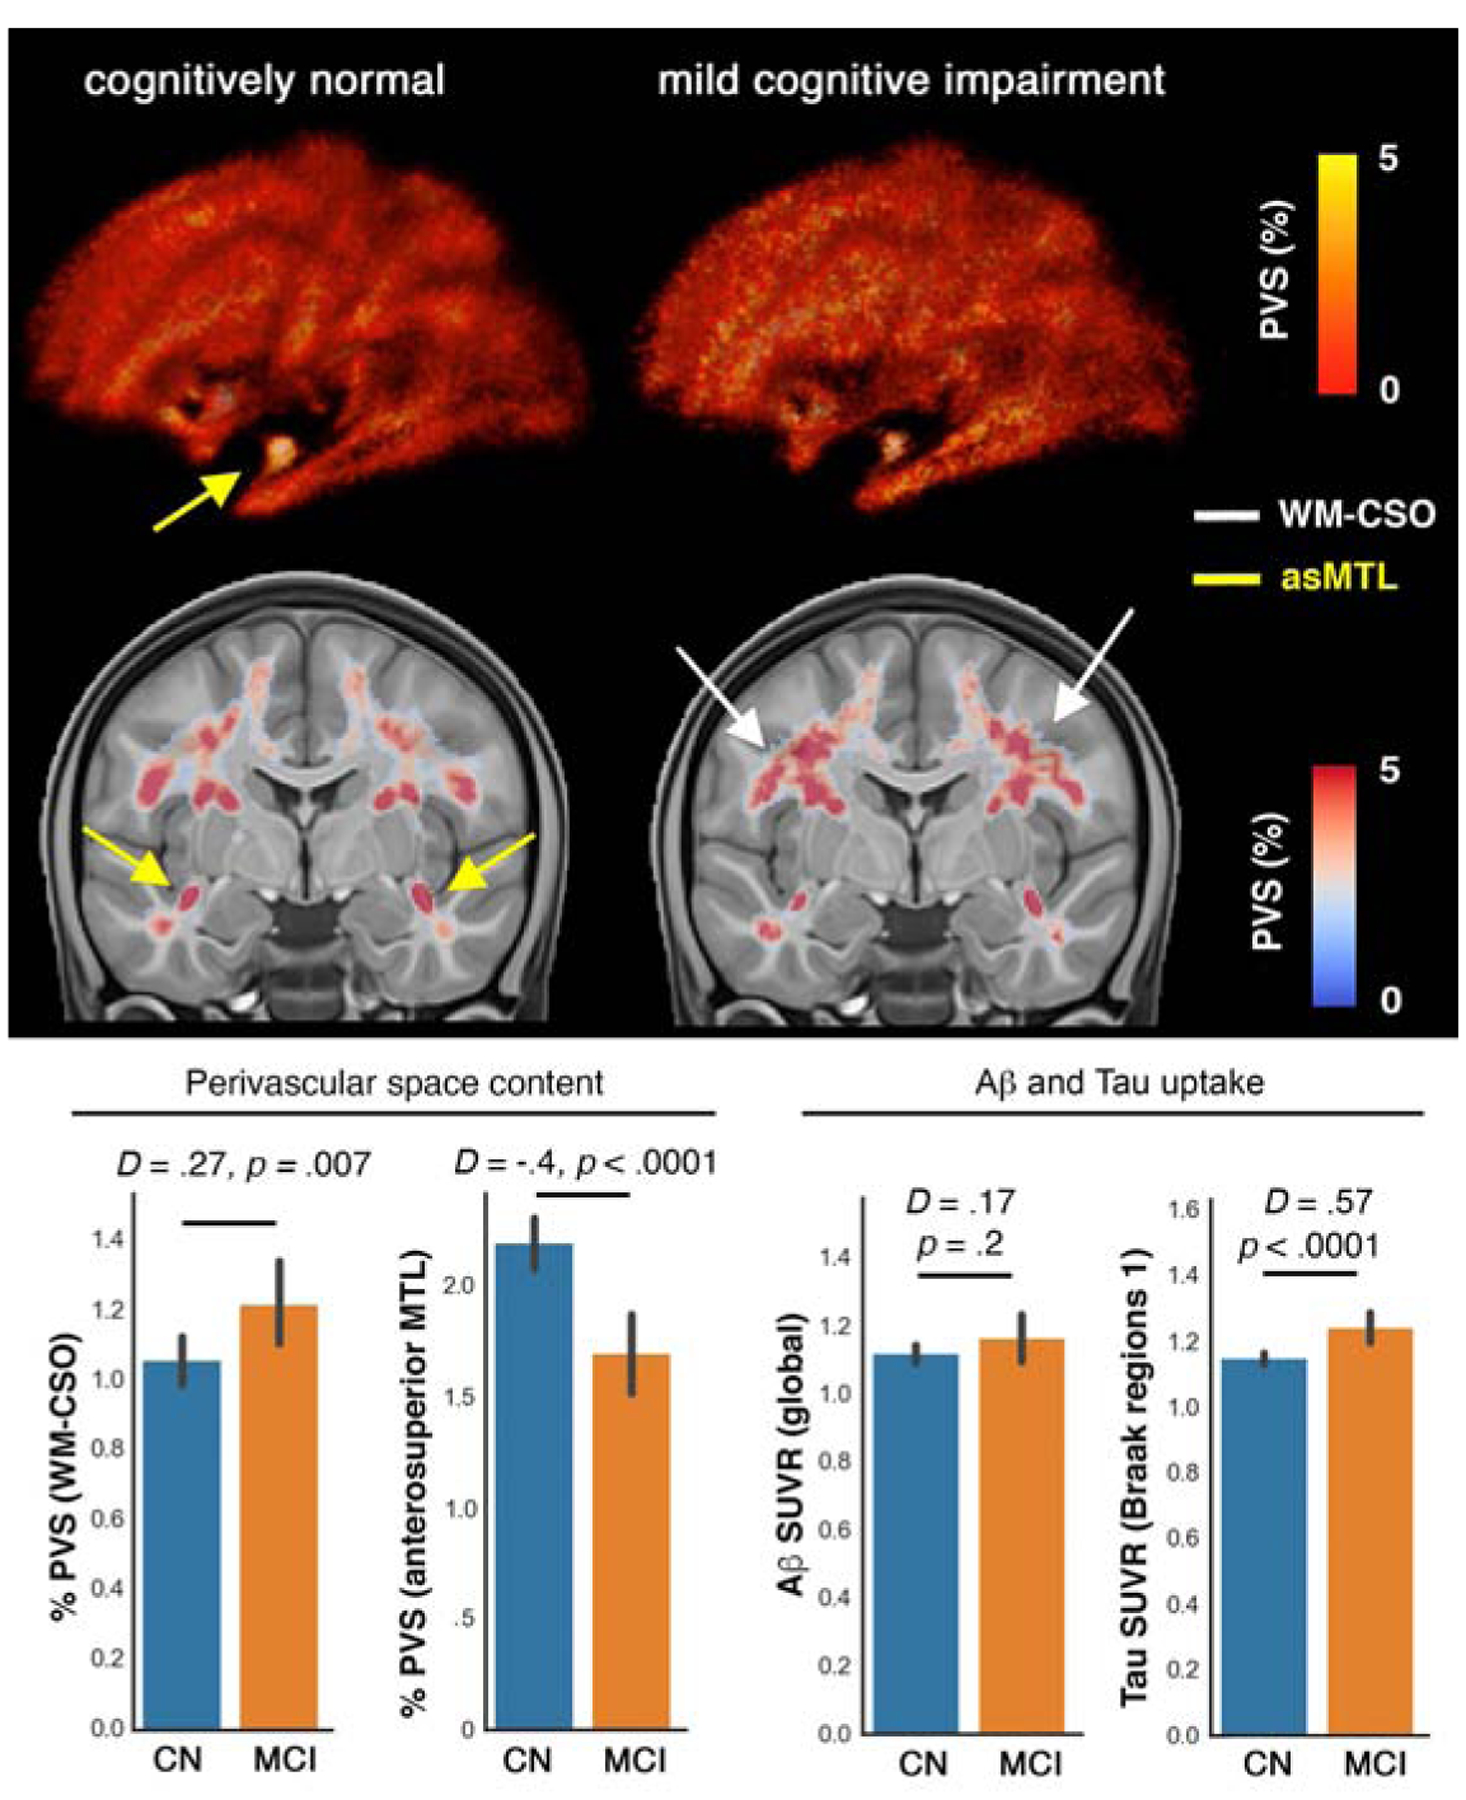
in cognitively normal (CN: n=424) and mild cognitively impaired (MCI: n=173) participants of Alzheimer’s Disease Neuroimaging Initiative 3 (ADNI-3). Normative maps of PVS across CN and MCI are presented, which were obtained by averaging PVS maps across the group (presenting percentage of overlapping PVS content across group). Overall, a higher amount of PVS was observed in global white matter and specifically in the centrum semi-ovale (CSO-WM) region of the MCI participants. Surprisingly, in the MCI group, a lower amount of PVS was observed in anterosuperior medial temporal lobe white matter. As comparison references, total standardized uptake value ratio (SUVR) of cerebral Aβ, and Tau PET SUVR in the regions associated with Braak stage 1 (i.e. entorhinal cortex) were included. D and p values are Cohen’s d (effect size) and p-value of the group differences, measured using estimation statistics.
All FLAIR and T1w MRI images were manually checked for misalignment and postprocessing failure, randomly and blind to clinical and neuroimaging measures. A total of 37 participants were excluded after the quality control.
We observed MRI manufacturer difference across PVS measures, in which PVS were consistently underestimated in Philips compared to other scanners (p<0.01 across all comparisons). Therefore, two post-hoc tests were performed: 1) manufacturer was included in the regression model as covariate. No statistically significant contribution from scanner manufacturer was observed in any statistical model (all p-value ≥ 0.55). 2) statistical analysis was repeated, excluding 51 participants that were scanned with the Philips scanner. Statistical conclusions were equivalent to those from the full dataset when images from Philips scanner were excluded (Supplementary File 2).
Statistical analysis
Table 1 summarizes study participants’ demographic and clinical information. To assess the PVS volume fraction differences, we used estimation statistics when comparing CN and MCI group differences (Ho et al., 2019). To this end, we estimated the group mean difference by calculating the unpaired Cohen’d effect size and the confidence interval between the PVS volume fraction of CN and MCI groups. To calculate the confidence interval of the effect size 5000 bootstrap samples were taken. The confidence interval was bias-corrected and accelerated (Ho et al., 2019). We also reported two-sided p-value of Mann-Whitney test, which was reported as the likelihood of observing the effect size, if the null hypothesis of zero difference is true. Secondary statistical analyses were performed to incorporate potential confounds. To this end, one-way analysis of covariates (ANCOVA) was conducted to determine a statistically significant difference between CN and MCI individuals on the PVS volume fraction, controlling for age, sex and years of education using a linear model. An interaction between cognitive status and sex was also included in the model to examine if PVS group differences in cognitive status are different between male and female individuals. PVS estimates were calculated as a volume fraction, defined as the volume of PVS in the region. For domain-specific analysis, a similar approach with the same formulation was used, but with the difference that CDR was used to make 2 groups: participants with no cognitive deficit (i.e. CDR=0) and participants with mild cognitive deficit (i.e. CDR=0.5). PVS was also assessed across 68 white matter regions of the Desikan-Killiany atlas (Desikan et al., 2006), which were obtained using recon-all module of the FreeSurfer. The Benjamini–Hochberg procedure with a false discovery rate of 0.05 was used to correct for multiple comparisons. All ANCOVA statistical results are included in Supplementary File 3 and the significant regions are reported in the text. Throughout the manuscript raw p-values are reported.
Table 1.
Participant summary information.
| Measures | Cognitively Normal | MCI | Statistics p-value |
|---|---|---|---|
| N | 423 | 173 | |
| Female: n (%) | 252 (59%) | 73 (42%) | p=0.0001 |
| Age (years) | 73.04 ± 7.36 | 75.56 ± 8.16 | p=0.0003 |
| Education (years) | 16.90 ± 2.25 | 15.98 ± 2.78 | p=0.00007 |
| Brain volume (mm3) | 1,064,574 ± 107,460 | 1,051,535 ± 106,529 | p=0.358 |
| CDR global* | 0.0 (0.0) | 0.5 (0.0) | p=3e-168 |
| CDR memory* | 0.0 (0.0) | 0.5 (0.0) | p=6e-133 |
| CDR sum-of-boxes* | 0.0 (0.0) | 1.0 (1.5) | p=3e-86 |
| MMSE* | 29.0 (1.0) | 29.0 (3.0) | p=9e-15 |
| APOE status: n (%) | |||
| ε3/ε3 | 212 (66%) | 78 (61%) | |
| ε3/ε4 | 99 (31%) | 37 (29%) | |
| ε4/ε4 | 10 (3%) | 12 (9%) | |
| Mean Ab PET (global SUVR)+ | 1.11 ± 0.17 | 1.16 ± 0.27 | p=0.043 |
| Mean Tau PET (Entorhinal region)++ | 1.10 ± 0.13 | 1.20 ± 0.23 | p=0.000014 |
| History of Hypertension: n (%)+++ | 91 (34%) | 44 (52%) | p=0.002 |
| Systolic pressure (mm Hg) | 133.9 ± 17.8 | 134.1 ± 18.0 | p=0.863 |
| Diastolic pressure (mm Hg) | 75.0 ± 9.6 | 73.4 ± 8.4 | p=0.051 |
Values are mean ± SD or frequency (percent).
Values are median (IQR) (normality hypothesis was rejected with D’Agostino and Pearson’s test (Pearson et al., 1977))
n=259 participants had Florbetapir AV45 Aβ PET data: n(CN)=171, n(MCI)=59
n=345 participants had Flortaucipir AV1451 Tau PET data: n(CN)=240, n(MCI)=79
n=378 participants (269 CN, 86 MCI) had data about history of hypertension
n=508 participants had APOE status data, n=60 with APOE ε2 were excluded in genotype analysis
The association between PVS volume fraction and Tau pathology, as measured by PET, was investigated. For Tau PET analysis, regional SUVRs in medial temporal lobe regions associated with early AD pathology were investigated. In particular, we examined whether PVS volume fraction of asMTL is correlated with Tau uptake in regions with early AD pathology: entorhinal cortex (ERC), and parahippocampus (PHC). The correlation between PVS volume fraction and Tau uptake were also compared in ERC and PHC. For these analyses, we formulated a linear regression model to investigate whether PVS volume fraction is a predictor of Flortaucipir (AV-1451) SUVR, adjusting for age, sex, education and brain size. An ordinary least square fitting was used to fit the linear regression to the data using StatsModel Python library. A secondary analysis was also performed including the continuous unthresholded Aβ SUVR as a covariate to compare the effect size of PVS volume fraction against Aβ SUVR.
We then looked into possible explanations for PVS volume fraction mean differences between CN and MCI groups, including amyloid PET, APOE status, and cardiovascular measures. For the Amyloid PET analysis, participants were categorized into CN and MCI with and without amyloid presence, which was defined by a cut-off at SUVR of 1.1 (Baker et al., 2017a; Landau et al., 2014, 2015; Schöll et al., 2016). Mean PVS volume fractions were then compared across Aβ− and Aβ+ groups, correcting for age, sex and education. When the overall association between vascular and PVS volume fraction and amyloid load was assessed, the continuous unthresholded Aβ SUVR values were used. Similar estimation statistics framework was used for APOE status comparison and cardiovascular measures. For the APOE-ε4 carrier status analysis, participants were categorized into three groups based on the number of APOE ε4 allele repeats: 0 for ε3/ε3, 1 for ε3/ε4, and 2 for ε4/ε4. Participants with APOE-ε2 allele were excluded from genotype analysis as it was shown to be a protective carrier (Panza et al., 2000; Qiu et al., 2004). A secondary analysis was done including APOE-ε2 allele, which resulted to the same conclusion (no association was found).
Because of the pathological changes in blood vessels observed in hypertension as well as the cerebrovascular response to the blood levels of oxygen and carbon dioxide, which are two primary determinants of ventilation (Battisti-Charbonney et al., 2011), we explored the contributions of blood pressure and respiratory rate to the PVS. Available cardiovascular risk factors including history of hypertension and vital signs (systolic and diastolic pressures, respiration rate and temperature) were used as independent variables to explain the variation of PVS volume fraction. Similar linear regression modelling as above was used for this purpose, correcting for age, sex and education. The Benjamini–Hochberg procedure with a false discovery rate of 0.05 was used to correct for multiple comparisons (Figure 6 and Supplementary File 4). Hippocampal volumes were extracted from FreeSurfer outputs and compared across groups. Given, the significant hippocampal volume difference (CN > MCI: p=5e-12), additional statistical analysis was performed, including hippocampal volume as covariate for MTL results. PVS difference of the asMTL remained significantly different between CN and MCI after incorporating hippocampal volume as a covariate: left asMTL (CN > MCI: F(1, 532) = 6.11, p = 0.013), right asMTL (CN > MCI: F(1, 532) = 4.51, p = 0.03).
Figure 6. History of hypertension and respiration rate are differentially associated with the PVS volume fraction.
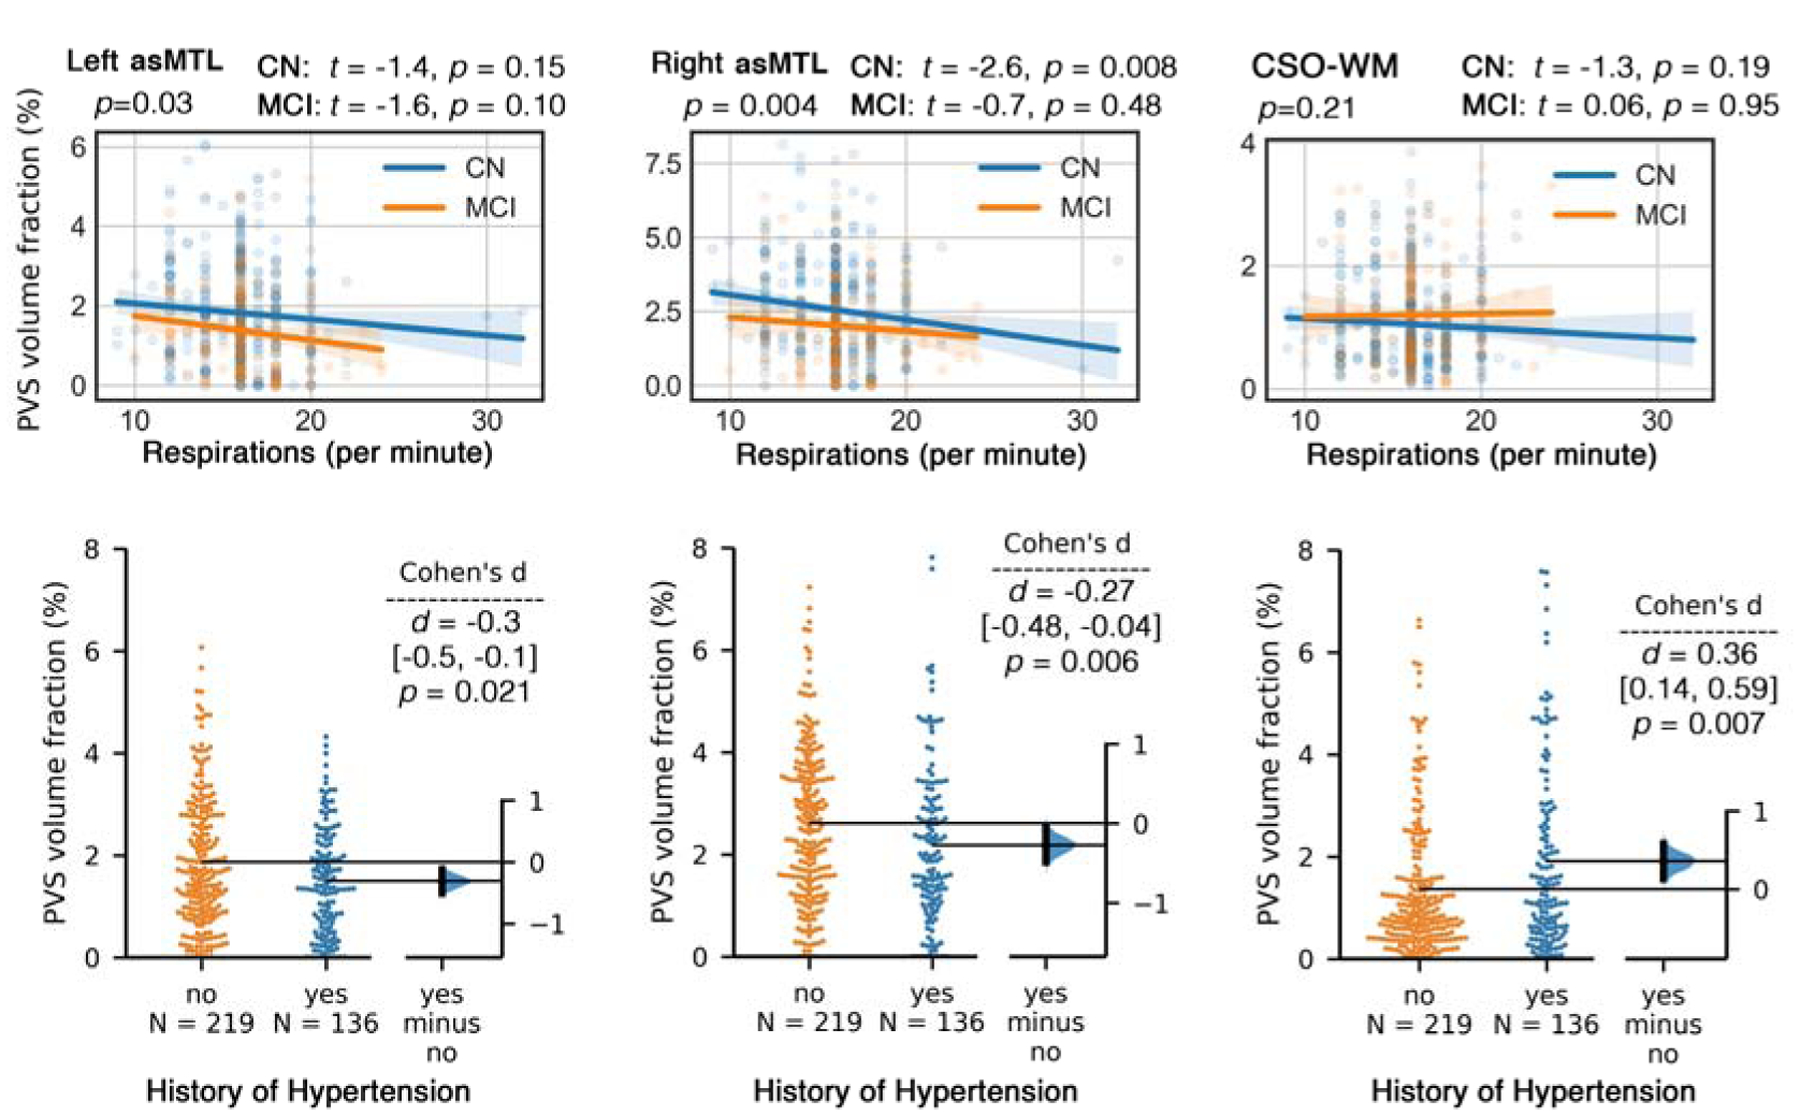
First row: respiratory rate (number of breaths per minute) is negatively associated with PVS volume fraction in anterosuperior medial temporal lobe (asMTL), but not associated with PVS volume fraction in centrum semi-ovale of the white matter (CSO-WM). Second row: Participants with history of hypertension had significantly higher PVS volume fraction in CSO-WM; PVS volume fraction in asMTL was lower in participants with history of hypertension (but not significant after correcting for covariates).
Finally, given the significant difference in the age and sex distribution between the CN and MCI groups (see Table 1), a secondary analysis was done on an age- and sex-matched subgroup. This subgroup included a random sample of participants with the same sex and comparable age equally distributed in the CN and MCI groups. The demographic and clinical information about this the age- and sex-matched subgroup are summarized in Table 2.
Table 2.
Participant summary information of the age- and sex-matched subgroup.
| Measures | Cognitively Normal | MCI | Statistics p-value |
|---|---|---|---|
| N | 173 | 173 | |
| Female: n (%) | 73 (42%) | 73 (42%) | p=1 |
| Age (years) | 75.57 ± 8.06 | 75.56 ± 8.16 | p=0.984 |
| Education (years) | 16.85 ± 2.51 | 15.98 ± 2.78 | p=0.004 |
| Brain volume (mm3) | 1,085,078 ± 107,438 | 1,051,535 ± 106,529 | p=0.469 |
| CDR global* | 0.0 (0.0) | 0.5 (0.0) | p=3e-86 |
| CDR memory* | 0.0 (0.0) | 0.5 (0.0) | p=5e-65 |
| CDR sum-of-boxes* | 0.0 (0.0) | 1.0 (1.5) | p=1e-41 |
| MMSE* | 29.0 (1.25) | 29.0 (3.0) | p=3e-7 |
Values are mean ± SD or frequency (percent).
Values are median (IQR) (normality hypothesis was rejected with D’Agostino and Pearson’s test (Pearson et al., 1977))
Results
A higher total amount of PVS was observed in the normative PVS map of MCI participants compared to CN participants (Figure 1). The increased PVS in MCI compared to CN participants was most evident in the CSO-WM. Surprisingly, PVS percentage on the normative template was notably lower in MCI compared to CN in the anterosuperior medial temporal lobe (asMTL; yellow arrow in Figure 1). The tau SUVR in the entorhinal cortex was significantly higher in MCI compared to CN participants (Cohen’d = 0.6, p = 0.0014), while group differences in global Aβ SUVR were not observed (Cohen’d = 0.17, p = 0.2). To enable statistical analysis to assess the association of asMTL with demographic, cognitive and neuropathological measurement, an ROI of the asMTL was drawn on the study T1w MRI template and was used to estimate PVS volume fraction in asMTL. Other regions of the MTL white matter are included in the Desikan-Killiany atlas (Desikan et al., 2006) used in this study.
No asymmetry was observed in the CSO-WM (p = 0.6) and therefore the total CSO-WM was used for the rest of the analysis. PVS volume fraction of the CSO-WM was higher in MCI compared to CN (Figure 2.d: p = 0.007 and Cohen’s d = 0.27). We found a significant effect of age on PVS volume fraction of the CSO-WM (F(1, 532) = 33.6, p = 1e-08), whereas we did not find any significant effect of the cognitive status (p = 0.08) or sex (p = 0.11) individually. However, we observed a significant effect of the interaction of cognitive status and sex on PVS volume fraction of the CSO-WM after controlling for age and years of education (F(1, 532) = 4.05, p = 0.044). When PVS volume fraction of CSO-WM was assessed separately in male and female groups, we found a significant effect of cognitive status on PVS volume fraction after controlling for age and years of education in females (MCI > CN: F(1, 280) = 10.63, p = 0.001), but no significant difference between CN and MCI in males (F(1, 249) = 0.02, p = 0.88). In the female group, the adjusted F ratio of the cognitive status was almost as high as the age effect on the PVS volume fraction (F(1, 280) = 14.66, p = 0.0001). When PVS volume fraction of CSO-WM was assessed separately in CN and MCI participants, we observed a significantly higher PVS volume fraction in males compared to females (p = 0.0002, Cohen’d = 0.38), but no sex difference in the MCI group (p = 0.99).
Figure 2. PVS volume fraction in anterosuperior medial temporal lobe (asMTL) was significantly lower in mild cognitive impairment (MCI) participants compared to cognitively normal (CN).
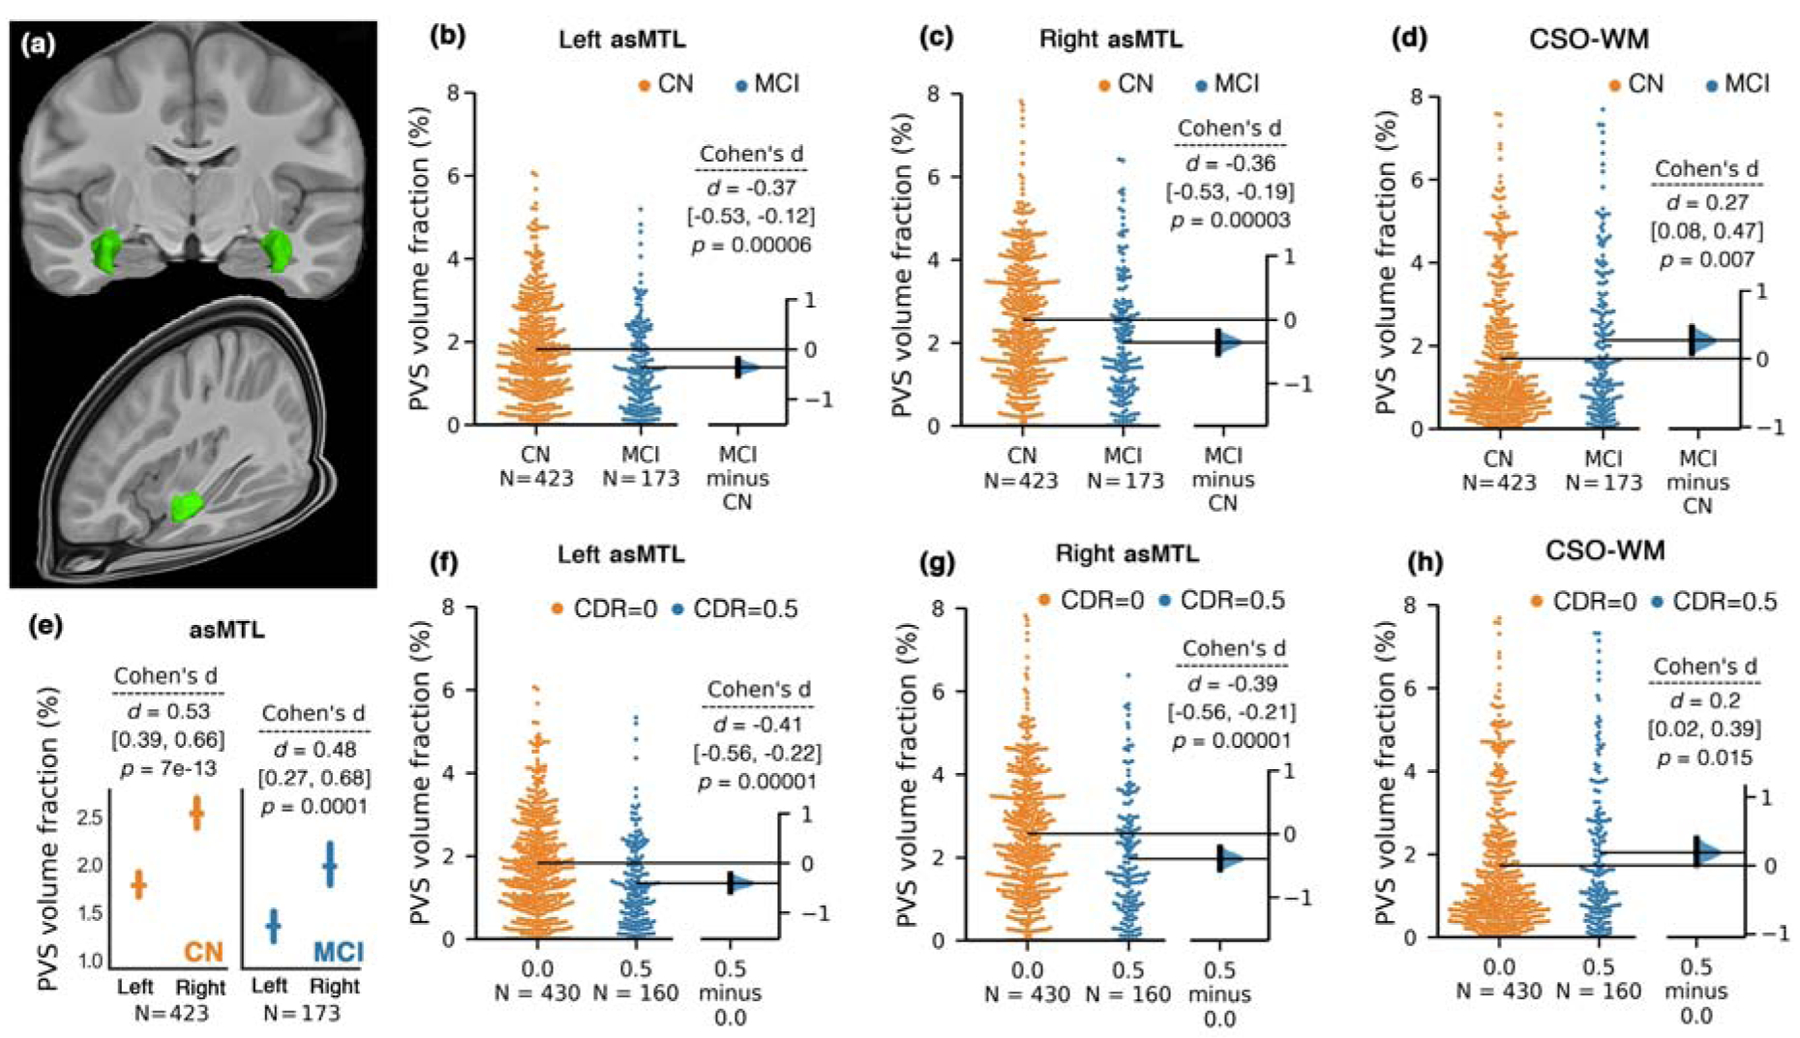
A 3D render of the asMTL on template space is presented in (a). Bilateral and significant PVS volume fraction differences between CN and MCI participants were observed in asMTL (b and c). Unpaired Cohen’s d effect size and confident intervals were reported (d [CI]) for the group differences between CN and MCI using estimation statistics (Ho et al., 2019). Two-sided p-value of Mann-Whitney test was also reported. The PVS volume fraction in asMTL was asymmetrical across both CN and MCI groups (e); mean and standard errors are shown. Diagnostic group comparison on PVS volume fraction across the centrum semi-ovale of the white matter (CSO-WM) is shown in (d). (f-h) plots compare PVS volume fraction of the asMTL (f-g) and CSO-WM (h) when study participants were categorized based on clinical dementia rating (CDR).
The PVS volume fraction in the asMTL region was significantly higher in the right hemisphere compared to the left in both CN (p = 7e-13) and MCI (p = 0.0001) groups (Figure 2.e). Therefore, statistical analyses were conducted separately for each hemisphere. A significantly lower PVS volume fraction in MCI compared to CN groups was observed (Figure 2.b–c) in both left (p=0.00006) and right (p=0.00003) asMTL. After correcting for age, sex and years of education, the effect of cognitive status on PVS volume fraction remained significant in the left asMTL (F(1, 532) = 11.25, p = 0.0008), which explained a higher variance in the model compared to the effect of age on PVS volume fraction (F(1, 532) = 8.04, p = 0.005). No other covariate significantly affected the PVS volume fraction. Similarly in right asMTL, we found a significant effect of cognitive status on PVS volume fraction after correcting for age, sex and years of education (F(1, 532) = 12.94, p = 0.0003), which explained a higher variance in the model compared to the effect of age on PVS volume fraction (F(1, 532) = 11.96, p = 0.0006). No other covariate significantly affected the PVS volume fraction.
When participants were categorized based on CDR scores (Figure 2.f and 2.g), the same pattern was observed: PVS volume fraction of asMTL were significantly lower in participants with signs of cognitive deficit (CDR=0.5) compared with cognitively normal individuals bilaterally (CDR=0) (left asMTL: p=0.00001, right asMTL: p=0.00001).
When regional analyses across white matter were performed on the effect of cognitive status on PVS volume fraction, four regions survived the multiple comparison correction and remained significantly different after correcting for age, sex and years of education: left medial orbito-frontal region (MCI > CN), F(1, 532) = 3.93, p = 0.048; left pars opercularis (MCI > CN), F(1, 532) = 4.77, p = 0.029; left rostral middle frontal region (MCI > CN), F(1, 532) = 4.16, p = 0.041; and right entorhinal region (MCI < CN), F(1, 532) = 6.36, p = 0.012. A complete list of statistical results is presented in Supplementary File 3. In all these regions, the MCI group had higher PVS volume fraction than CN, except for the entorhinal region, where CN group had higher PVS volume fraction, corroborating findings from the analysis of the asMTL region. No significant difference was observed in other regions of MTL. The asMTL difference was associated with hippocampal volume (left asMTL: F(1, 532) = 6.11, p = 0.013; right asMTL: F(1, 532) = 21.14, p = 0.000005; incorporating age, sex and years of education as covariates), but not confounded by it. When hippocampal volume was included in the analysis, the PVS volume fraction difference between CN and MCI in asMTL remained statistically significant (left asMTL, CN > MCI: F(1, 532) = 6.11, p = 0.013, right asMTL, CN > MCI: F(1, 532) = 4.51, p = 0.03; incorporating age, sex and years of education as covariates).
When the age- and sex-matched subgroup was analyzed (Table 2), similar conclusions were reached (i.e., CN participants presented higher PVS volume fraction in asMTL and lower PVS volume fraction in CSO-WM). In brief, PVS volume fraction of asMTL was significantly higher in CN compared to MCI: left asMTL, CN > MCI: F(1, 309) = 17.3, p = 0.00004, right asMTL, CN > MCI: F(1, 309) = 18.52, p = 0.00002; incorporating age, sex and years of education as covariates. PVS volume fraction of CSO-WM was significantly higher in MCI compared to CN in females (F(1, 124) = 6.09, p = 0.015; incorporating age, sex and years of education as covariates), but not males (F(1, 183) = 0.79, p = 0.37). In the regional analysis, same conclusions were made in the subgroup analysis for right entorhinal (MCI < CN), F(1, 341) = 10.04, p = 0.002) and left pars opercularis regions (MCI > CN), F(1, 341) = 5.17, p = 0.023), but not left medial orbito-frontal and left rostral middle frontal regions; incorporating age, sex and years of education as covariates.
PVS volume fraction in the asMTL was significantly associated with Tau PET standardized uptake value ratio (SUVR) in the entorhinal cortex (ERC), which is a pathological hallmark of AD in the first stages (Braak stages I (Braak and Braak, 1996)). The association appeared to be lateralized, in which only the Tau SUVR on the right ERC showed significant correlation with the PVS volume fraction of the ipsilateral white matter of the asMTL (Figure 3.b) (beta (SE) = −0.98 (0.4); p = 0.014, corrected for age, sex and education). Unlike ERC, we did not observe significant associations between asMTL PVS volume fraction and Tau uptake in the HC or PHC bilaterally (Figure 3.c; p > 0.27). We observed that PVS volume fraction was associated with Tau uptake in regions associated with Braak I (i.e. ERC; Figure 3.f), but the association was weaker (and non-significant) for Tau uptake in the parahippocampal region (Figure 3.f; p = 0.25).
Figure 3. PVS volume fraction was associated with early AD pathology.
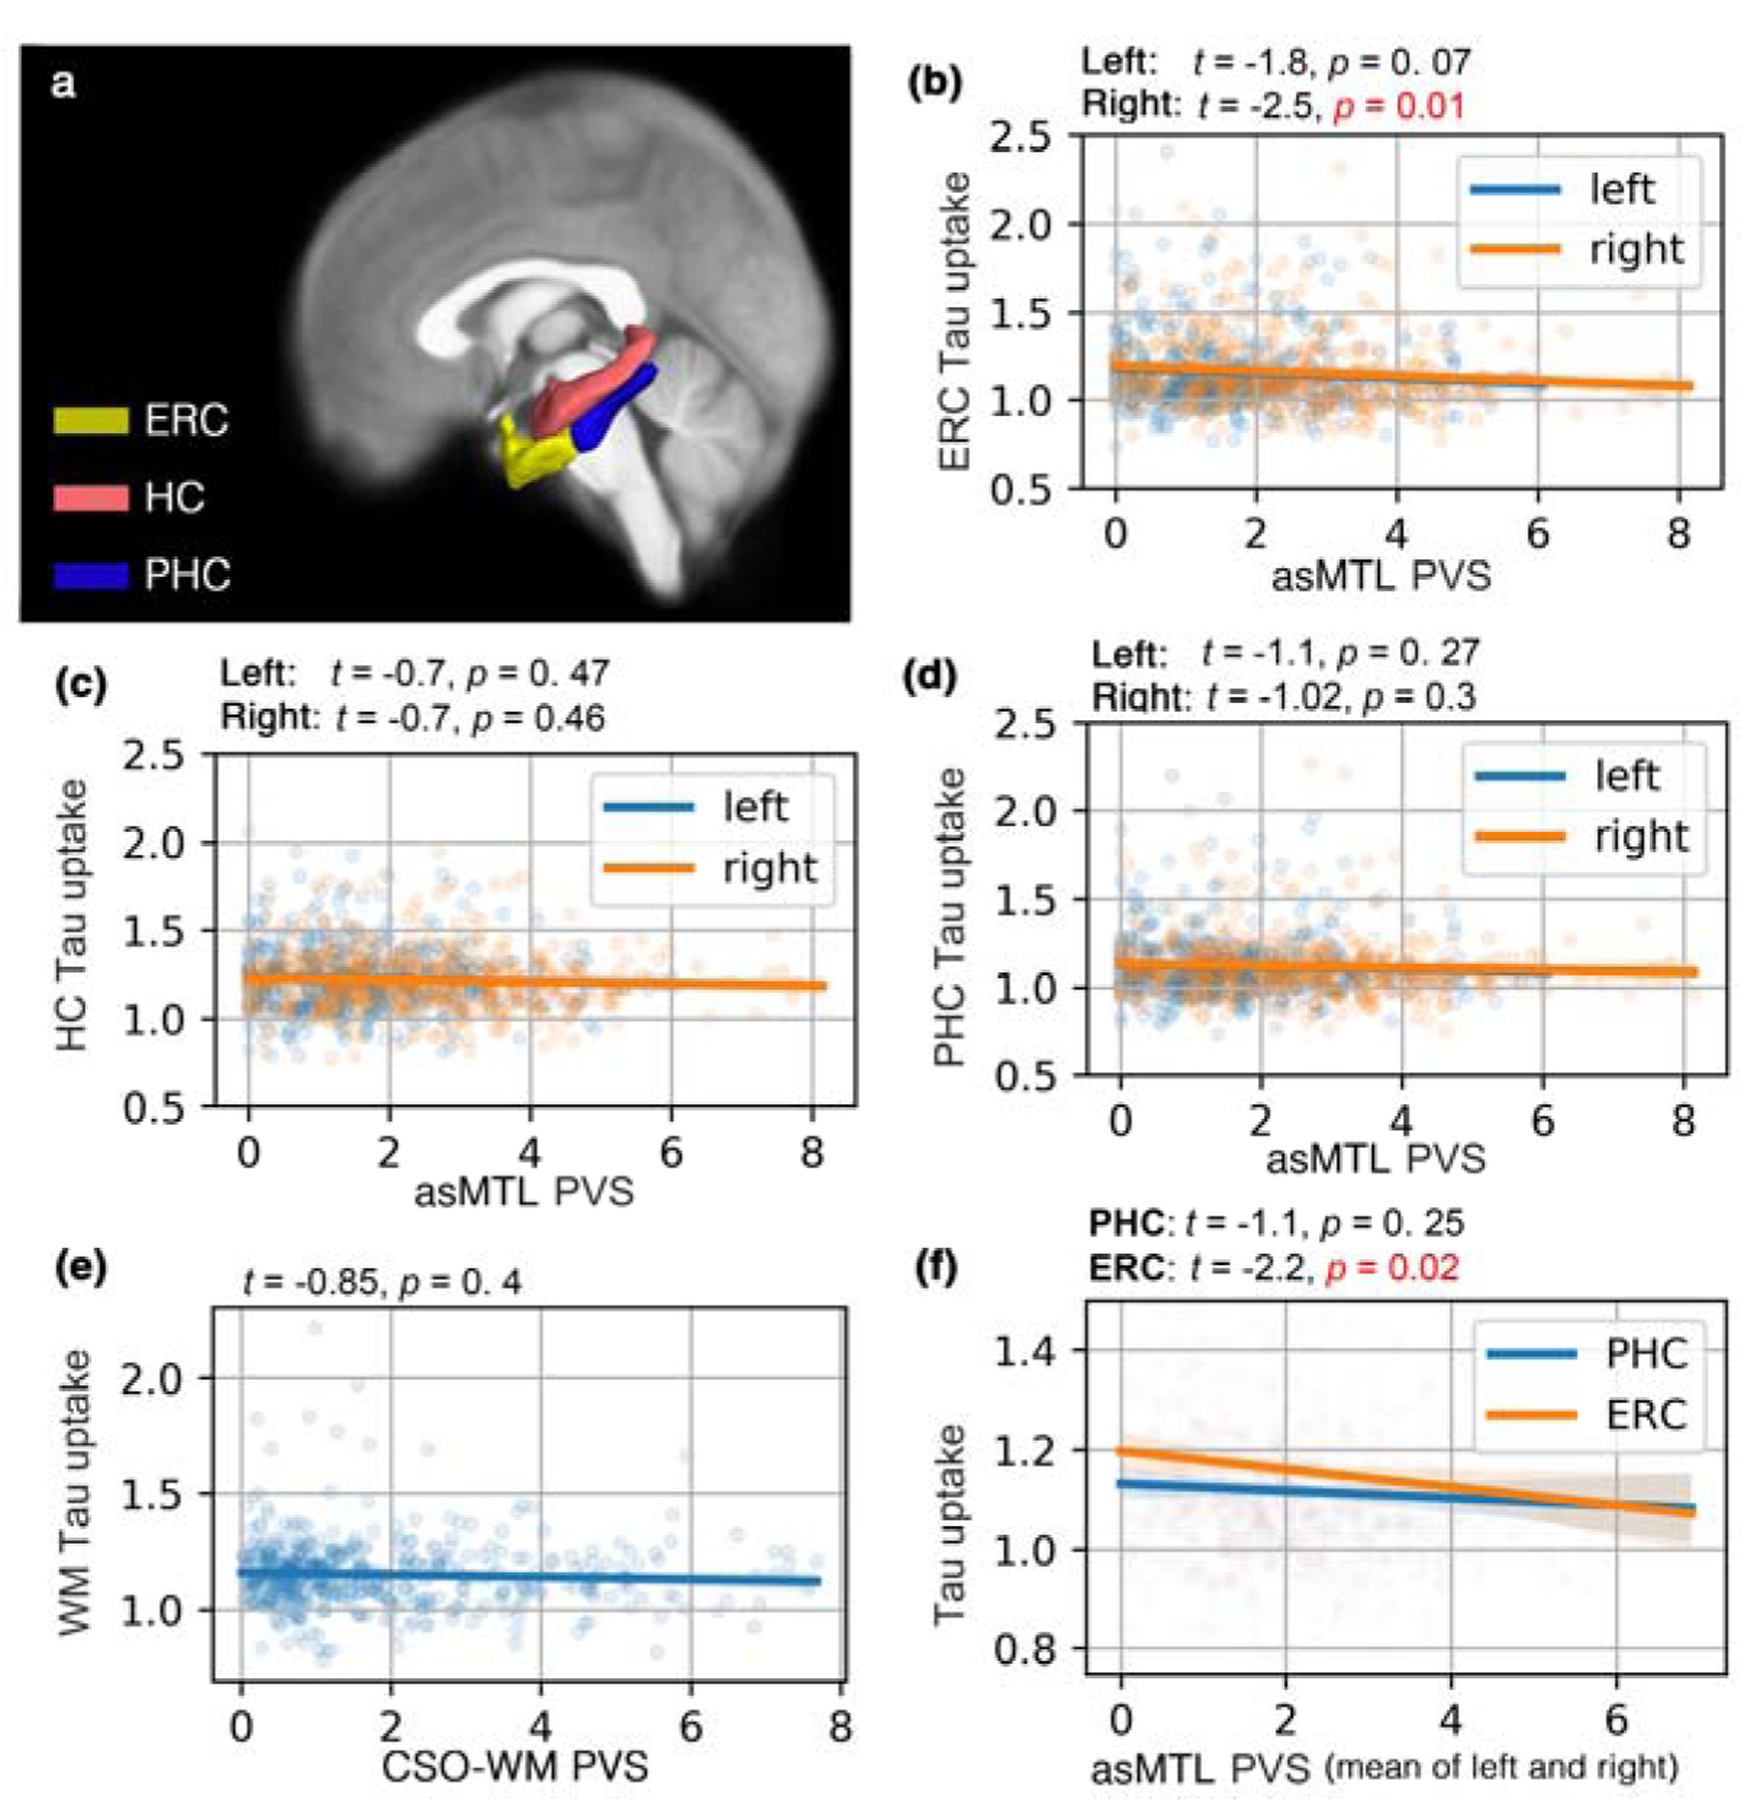
Studied regions of interest are shown in (a). PVS volume fraction of the anterosuperior medial temporal lobe (asMTL) was a predictor of Tau uptake (AV1451 PET Tau SUVR) in entorhinal cortex (ERC) (b) (right asMTL: p=0.01, left asMTL: p=0.07, corrected for age, sex, education and brain size), in contrast with PVS volume fraction of the centrum semi-ovale of the white matter (CSO-WM) (p=0.4) (e). A non-significant correlation between PVS volume fraction of asMTL and Tau uptake in ERC and parahippocampal cortex (PHC) was observed (c-d). Participants with lower PVS volume fraction in asMTL appeared to have higher amount of Tau in ERC. The correlation between asMTL PVS volume fraction and Tau SUVR was highest in regions involved in early AD pathology (i.e. ERC as per Braak stage I), and the association was weaker for PHC (f). The association analysis was performed in a subset of the population including participants with both Tau PET and MRI data (n=319; n(CN)=240, n(MCI)=79).
No significant associations between PVS volume fraction and Tau or Aβ SUVR were found in white matter regions associated with late Braak stages. We only observed a weak non-significant association between PVS volume fraction of medial orbito-frontal white matter and Aβ SUVR of medial orbito-frontal cortex (F(1, 224) = 3.29, p = 0.07).
PVS volume fractions across different regions were independent of Amyloid load or APOE ε4 status (Figure 4 and 5). A second linear regression performed using cerebral amyloid load values (Aβ SUVR) as a predictor of PVS volume fraction, using age, sex and years of education as covariates, which showed no significant relationship between Aβ uptake and PVS volume fraction (p=0.61). The same conclusion was drawn when the analysis was performed on CN and MCI groups separately. No differences in mean PVS volume fraction between Aβ− and Aβ+ participants were observed in MCI and CN participants (CN (left asMTL): p=0.75, CN (right asMTL): p=0.98, MCI (left asMTL): p=0.55, MCI (right asMTL): p=0.16, CN (CSO-WM): p=0.95, MCI (CSO-WM): p=0.15, Supplementary Figure 3). We also observed no PVS volume fraction difference across participants with different APOE ε4 repeats (Figure 5).
Figure 4. PVS volume fraction of the anterosuperior medial temporal lobe (asMTL) and centrum semi-ovale of the white matter (CSO-WM) were not associated with the amyloid beta uptake, as measured by positron emission tomography.
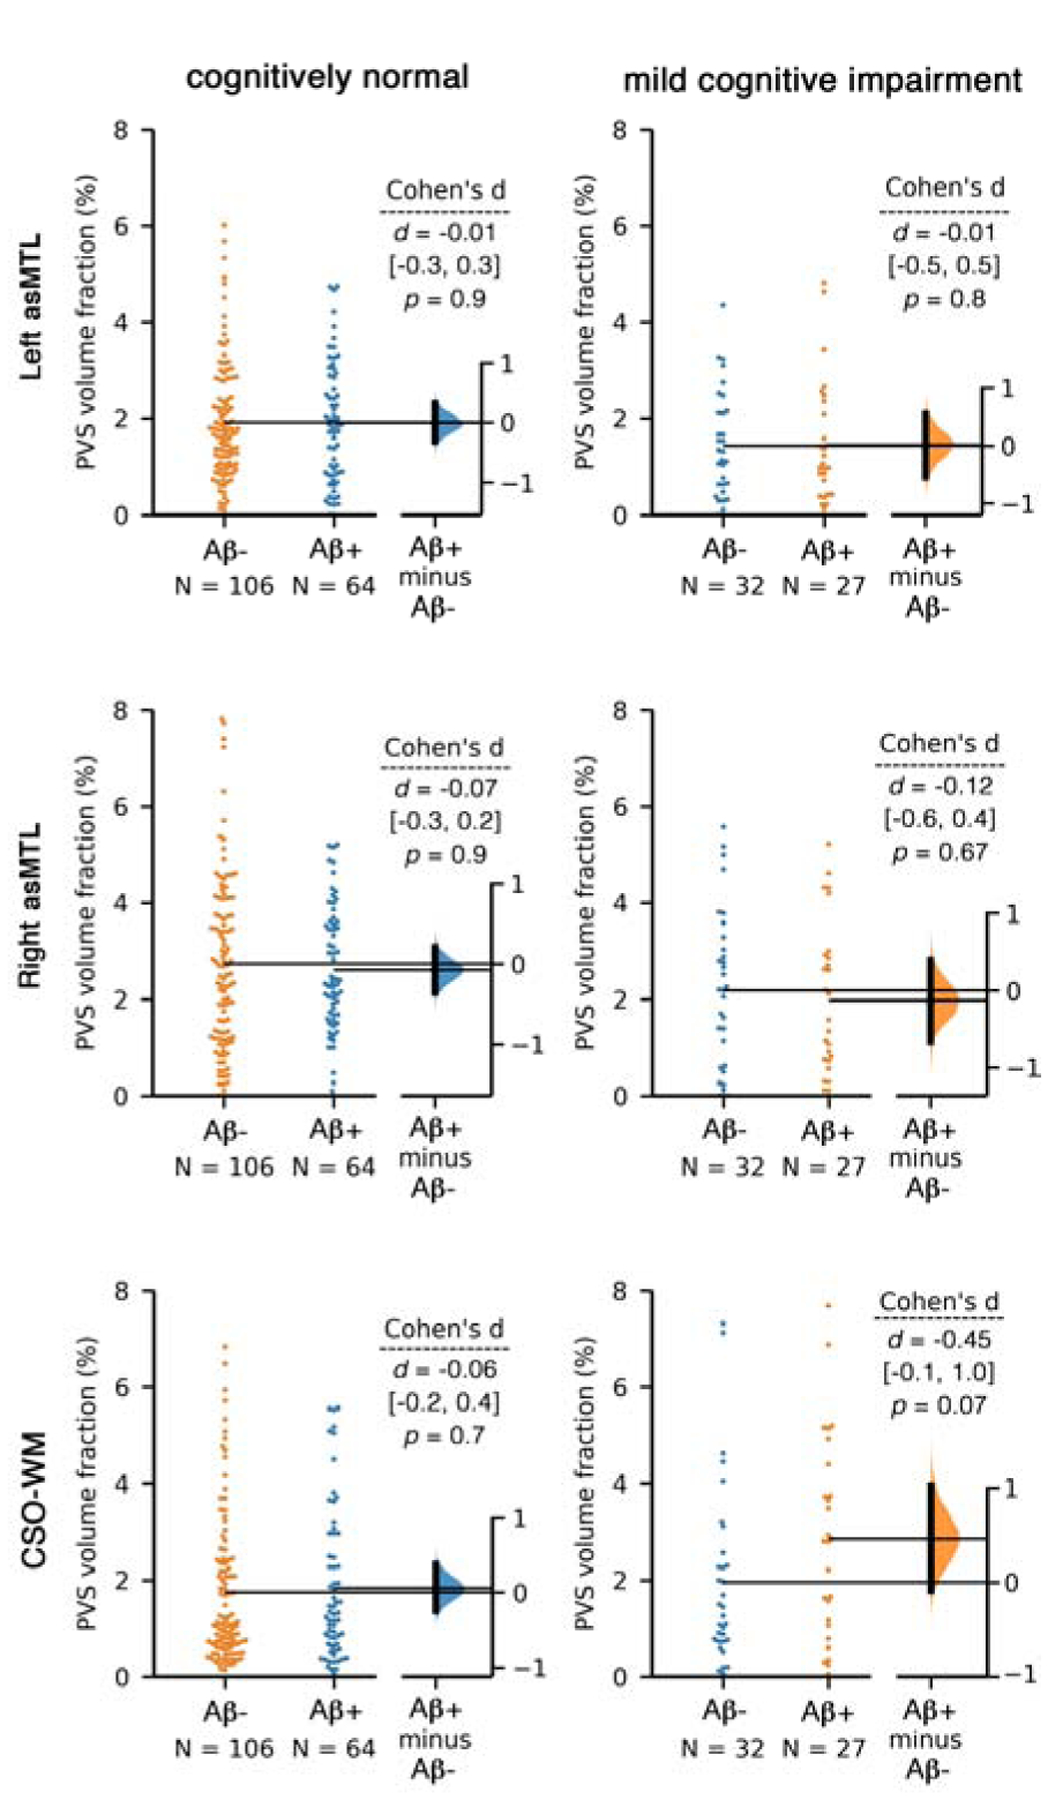
Aβ−/+ categorization was applied based on Florbetapir cortical summary measurement (SUVR). Florbetapir cutoff of 1.11 using the whole cerebellum region as a reference. Equivalent statistical conclusions were drawn when we used a cutoff of 0.79 in a composite reference region including cerebellum, brainstem/pons, and eroded subcortical white matter. Linear regression analysis using Aβ SUVR also showed no association between Aβ uptake and PVS volume fraction (p=0.61). When regional values of Aβ SUVR were used (instead of global SUVR), no associations were observed (p>0.6 for all tests).
Figure 5. PVS volume fraction of the anterosuperior medial temporal lobe (asMTL) and centrum semi-ovale of the white matter (CSO-WM) were not associated with APOE ε4 allele repeats.
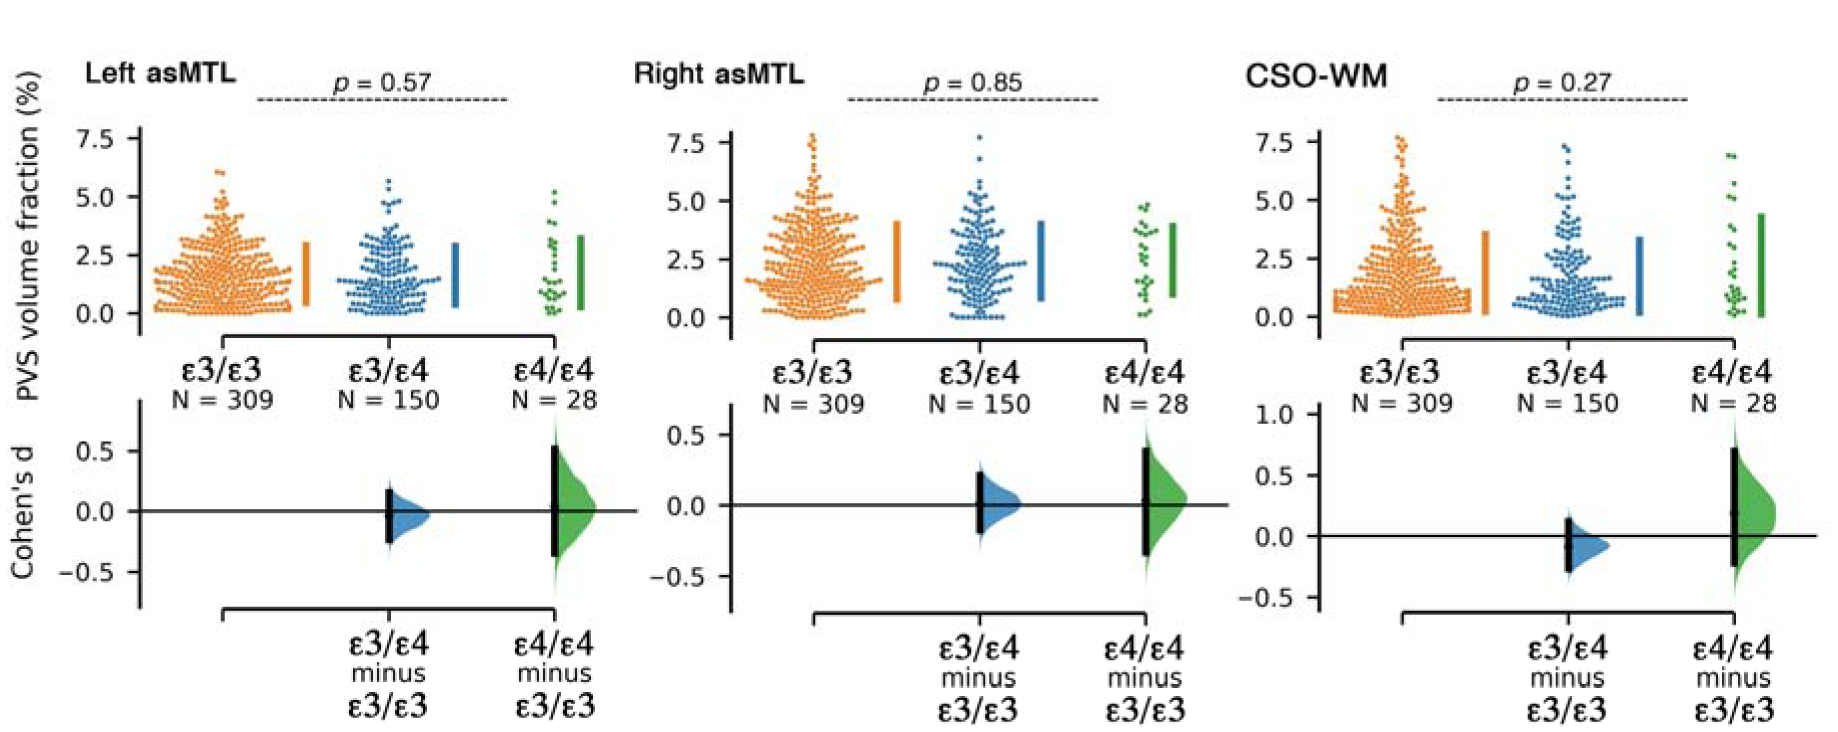
Participants were categorized based on the number of APOE ε4 allele repeats.
When total asMTL PVS volume fraction and composite cerebral amyloid load values (Aβ SUVR) were included in the same logistic regression model to predict the cognitive status (MCI vs CN), the asMTL PVS (beta (SE) = −0.33 (0.1); t = −2.3; p = 0.019; lower in MCI) was a stronger predictor than that of PET SUVR (beta (SE) = 2.26 (1.2); t = 1.8; p = 0.07; higher in MCI), supporting the hypothesis that alterations in the supply and clearance of the asMTL is an early feature of AD-related cognitive decline. No association between PVS volume fraction and CSF biomarkers were found (Supplementary File 5). Continuous data of CSF Aβ1–42, Aβ1–40, Tau and phosphorylated Tau (p-Tau) were used for the association analysis, adjusting for age, sex, years of education and brain size.
Finally, hypertension and vital sign relation with PVS measures were assessed (Figure 6). Participants with a history of hypertension had significantly higher PVS volume fraction in the CSO-WM (p=0.0007) and significantly lower PVS volume fraction in the left asMTL (p=0.006). These differences were no longer statistically significant when age, sex and years of education were included (the difference was mainly explained by age and years of education). We only noted a marginal difference between PVS volume fraction of the CSO-WM in female participants with and without history of hypertension (higher PVS volume fraction in female with history of hypertension: F(1, 163) = 3.59, p = 0.05). After exploring the vital signs (systolic, diastolic and pulse pressure, respiration rate and temperature), we observed a significant inverse association between respiration rate and PVS volume fraction in the asMTL (p=0.004, adjusted for age, sex and education), in which tachypneic participants (respiration rate > 20 per minute) had lower PVS volume fraction in the asMTL. After including variables with statistically significant associations with PVS (i.e. history of hypertension and respiration rate) into the analysis of PVS difference by cognitive status (CN vs MCI), all statistical conclusions regarding cognitive group differences remained unchanged.
Discussion
In this study we examined the distribution of regional white matter PVS alterations in individuals with mild cognitive impairment and cognitively normal older adults. Our findings show that older adults with mild cognitive impairment present with alterations to the PVS, specifically in the asMTL and CSO-WM. PVS volume fraction was higher in the CSO-WM of individuals with mild cognitive impairment, and this effect was driven by females. Surprisingly, individuals with mild cognitive impairment showed lower PVS volume fraction in the asMTL, which was highly correlated with tau uptake in regions affected in the early stages of AD progression. Lastly, individuals with a history of hypertension present with higher PVS volume fraction in the CSO-WM and lower PVS volume fraction in the asMTL.
PVS enlargement in the CSO-WM is a commonly used biomarker for cerebrovascular pathology (Doubal et al., 2010; Ishikawa et al., 2018). Overall, our results demonstrate significantly larger PVS volume fractions in the CSO-WM of individuals with MCI compared to elderly CN controls. Our results are consistent with previous findings of PVS enlargement in the CSO-WM of patients with MCI (Chen et al., 2011a), AD (Banerjee et al., 2017; Chen et al., 2011a), and cerebral amyloid angiopathy (Charidimou et al., 2017, 2015), as well as normal aging (Charidimou et al., 2013; Doubal et al., 2010). Similar to previous evidence showing the PVS burden in the CSO-WM is greater in CN males compared to females (Ramirez et al., 2015a), we observed that CN males present higher PVS volume fraction compared to CN females, whereas no significant difference was found between females and males in the MCI group. In fact, MCI females showed higher PVS volume fraction in the CSO-WM compared to CN females, reaching values comparable to both CN and MCI males. It is possible that the PVS volume fraction of male healthy controls appear similar to those found in male MCI patients due to a higher baseline level of PVS in healthy males compared to females. Nevertheless, whether the differences in PVS between males and females is related to hormonal effects on the perivascular flow, structural anatomical variations, and/or sex differences in astrocytic response to inflammation, remains to be explored (Ramirez et al., 2016).
The asMTL region presented an asymmetric distribution of PVS across the two hemispheres, with the right asMTL having a higher PVS volume fraction than the contralateral side, irrespective of cognitive status. This asymmetric pattern observed both in CN and in MCI groups suggests that a lateralization of PVS in asMTL is possibly a normal physiological asymmetry and not related to pathology. Perlmutter et al. reported significantly higher cerebral blood flow and metabolic rate in the right superior temporal region of normal subjects using PET imaging, which was interpreted as a normal physiological asymmetry (Perlmutter et al., 1987).
Within the medial temporal lobe, a region intimately connected with the limbic system and anatomically in contact with the hippocampus, PVS content was associated with cognitive status in the white matter of the anterior superior MTL and right entorhinal region. The asMTL reflects the region adjacent to the anterior part of the superior temporal gyrus that receives blood supply from the anterior temporal arteries and their sub-branches (Supplementary Figure 2) (De Long, 1973). Interestingly, we found the PVS volume fraction of the asMTL and right entorhinal region was significantly lower in patients with MCI compared to CN aging controls. This finding is in opposition to the conventional view that PVS dilation in cerebral white matter is a pathological feature of progressive glymphatic dysfunction in AD (Troili et al., 2020). However, previous studies of PVS enlargement in neurodegeneration have focused on the CSO-WM (Banerjee et al., 2017; Chen et al., 2011a; Ramirez et al., 2015a), basal ganglia (Banerjee et al., 2017; Chen et al., 2011a; Ramirez et al., 2015a; Y. C. Zhu et al., 2010), hippocampus (Chen et al., 2011a) or global white matter (Y. C. Zhu et al., 2010) and there is limited evidence of regional differences in PVS content within the medial temporal lobe of individuals with MCI and AD.
In order to characterize the nature of the observed PVS alterations within the asMTL of MCI subjects, we explored associations with more specific characteristics of AD pathology, such as deposition of beta-amyloid plaques and tau neurofibrillary tangles, and genetic risk factors for AD. In the present study, lower PVS volume fraction in the asMTL of patients with MCI was associated with higher tau PET SUVR but were independent of cerebral Aβ PET SUVR and APOE4 status. This association with tau was found in the entorhinal cortex, a region implicated in the pre-clinical stages of AD (Braak stages I) (Braak and Braak, 1991). The lower amount of PVS in the asMTL of individuals with MCI was concomitant with pathological alterations unique to the neurodegenerative processes that characterize early stages of AD progression. A previous cross-sectional study of Aβ deposition using PET in patients with MCI and AD similarly found no association between PVS content and Aβ uptake (Banerjee et al., 2017), but the association with tau deposition was not investigated. Recent studies also demonstrated that pathological phenomena associated with PVS alterations, such as neurovascular dysfunction and BBB breakdown, occur early in AD and independently of Aβ and Tau (Montagne et al., 2020; Daniel A Nation et al., 2019). Therefore, additional studies are required to validate this finding and define the diagnostic role of perivascular spaces for the detection of early pathology leading to cognitive dysfunction.
Pathological changes in the structure and/or function of the cerebral microvasculature have been shown to play a major role in dementia (Bakker et al., 2016; Khachaturian et al., 2019; Malone et al., 2019) and hypertension is a significant risk factor for neurodegenerative disease (Faraco and Iadecola, 2013). In the present study, PVS volume fraction was significantly lower in the asMTL and significantly higher in the CSO-WM in patients with a history of hypertension. Previous research on the association between PVS and hypertension shows mixed results: there is evidence that suggests PVS in the CSO-WM increases (Arba et al., 2018; Hurford et al., 2014; Zhang et al., 2016), decreases (Charidimou et al., 2014) or does not change (Potter et al., 2015; Riba-Llena et al., 2016) in the presence of hypertension. Indeed, there is accumulating evidence that the PVS of the basal ganglia, not the CSO-WM, is more strongly associated with vascular risk factors (Troili et al., 2020). The relationship between lower PVS volume fraction in the asMTL and a history of hypertension is therefore inquisitive and may suggest a heterogeneous glymphatic response to cerebrovascular stressors across the white matter. Future studies should aim to disentangle the complex variables that contribute to the overall vascular health of patients.
The PVS becomes visible when enlarged and represents a pathological feature of brain vascular damage that indicates obstruction of the CSF/interstitial fluid flow and impairment of the waste clearance system. It is unclear whether PVS enlargement is a cause or consequence of reduced fluid clearance, however it is associated with a cascade of neurodegenerative, cerebrovascular and immunological responses. Dilation of the PVS may be attributed to impaired arterial pulsatility and reduced arterial elasticity (Hadaczek et al., 2006; Iliff et al., 2013; Kress et al., 2014) and the white matter may be particularly vulnerable to the deleterious effects of impaired cerebrovascular reactivity due to the naturally slower blood flow and fewer capillaries that supply the white matter compared to cortical and subcortical gray matter (Lin et al., 2017; Nonaka et al., 2003). Preclinical evidence in a pericyte-deficient mouse model supports the hypothesis that BBB breakdown leads to extravascular accumulation of blood-derived toxic fibrin deposits, with enlargement of PVS and early white matter damage preceding alterations caused by hypoxia in the cortex (Montagne et al., 2018). Alterations to PVS are also associated with systemic inflammation (Schiltz and Sawchenko, 2003), which affects BBB integrity. Pro-inflammatory cytokines induce inflammatory cells to aggregate around the brain vasculature and degrade the extracellular matrix, resulting in BBB dysfunction and alterations to the brain clearance system (Bechmann et al., 2001; Guillemin and Brew, 2004; Rosenberg, 2017). It has also been proposed that the impairment of the glymphatic flow through PVS enlargement might reduce the clearance of metabolic waste products, including Aβ and Tau (Rasmussen et al., 2018), whose deposits could further impair the perivascular drainage, leading to their ulterior accumulation in a ‘feed-forward’ process. Since the signal measured in PVS strictly depends on the CSF signal, it is possible that the lower PVS volume fraction observed in the asMTL of patients with MCI may represent a consequence of an early occlusion and/or obstruction of the perivascular spaces, resulting in loss of CSF signal and decreased detectability of PVS prior to its subsequent dilation.
The diverging relationship between PVS volume fraction and cognitive status within the CSO-WM and asMTL suggests PVS alterations in the early stages of cognitive decline may follow heterogenous trajectories of dysfunction depending on the cerebral area. In fact, PVS and their associated perforating arteries present specific morphological features in different brain regions (notably, basal ganglia and centrum semiovale) (Adachi et al., 1998) and therefore their alterations might be caused by multiple types of pathological processes, possibly resulting in different types of clinical and neuroimaging manifestations. It is also possible that the observed association between normal cognitive status and higher asMTL PVS volume reflects the greater amount of compensatory supply to or clearance from the MTL in CN compared to MCI, which might represent a protective mechanism against cognitive impairment. However, whether perivascular flow impairment with reduced clearance is attributed to different pathological phenomena in the asMTL and CSO-WM remains to be explored by future studies.
While our results suggest PVS may represent a novel indicator of early pathophysiological processes leading to cognitive impairment, several limitations exist. The present study utilizes a cross-sectional design, which limits our ability to attribute observed PVS differences to a pathological origin. Because aging is associated with the dysfunction of the clearance system (Kress et al., 2014), future longitudinal studies that focus on examining the alteration of the PVS as a function of the pathophysiology and cognitive decline are demanded to further validate our findings and to evaluate the efficacy of PVS mapping as a surrogate for brain clearance and vascular health. Another limitation is the potential error in automated segmentation approach, similar to any other automated technique. Here we applied a technique that was developed and validated on Human Connectome Project data, which has higher resolution than ADNI (0.7 mm3 versus 1 mm3). To address this limitation, we manually assessed 25 randomly selected data and evaluated the accuracy of our methodology. We noted high accuracy of the automated technique, especially when FLAIR data was used to correct the misclassified white matter hyperintensities.
Given the limited sensitivity and specificity of T1w images to vascular presence and integrity, we were not able to examine the mechanisms underlying the observed PVS differences. To ensure that the results we found in asMTL were not confounded by the presence of white matter hyperintensities, that we excluded from the study, we compared voxels that were segmented as white matter hyperintensities in FLAIR images across CN and MCI and found no significant difference (p=0.7). It is also fundamental to consider that the MRI-based PVS analysis strongly relies on the image resolution: higher resolution corresponds to increased PVS detection and improved segmentation (Barisano et al., 2018; Madai et al., 2012; Zong et al., 2016). Small PVS remain still undetected on MRI or are not discernible from noise. This limitation made it difficult to identify on MRI the submillimeter pathological changes in PVS, which are hypothetically supposed to occur at the very early pre-clinical stages of the disease. It is difficult to separate the vasculature from the perivascular space itself with the current resolutions and contrasts available with MRI. It is also possible that the observed PVS reductions may be driven by restrictions within the vasculature itself. Recently, it has been shown that the vascular reserve in hippocampus is associated with cognitive performance (Perosa et al., 2020). Finally, quantitative characteristics of the PVS using non-invasive techniques, such as diffusion MRI, could be used to extract submillimeter information (Sepehrband et al., 2019b, 2019c).
Conclusions
In conclusion, we observed that PVS presence and distribution are different in individuals with mild cognitive impairment compared to healthy controls. Our results demonstrate in vivo that PVS volume fraction of the CSO-WM is higher in MCI compared to CN, and that this difference is mostly found in females. Moreover, we showed PVS volume fraction is significantly lower within the asMTL of patients with MCI compared to CN, and the lower PVS content in this region was associated with higher aggregation of tau neurofibrillary tangles. Together, these results suggest PVS alterations in the asMTL may represent an early feature of AD pathology. This discovery encourages further investigation of the cerebral PVS in terms of pathophysiology, diagnostic role, and new potential therapeutic strategies for cognitive dysfunction.
Supplementary Material
Highlights.
We report perivascular space (PVS) differences in mild cognitive impairment
PVS changes in anterosuperior medial temporal lobe associated with Tau uptake
PVS differences were independent of Amyloid uptake
Cognitively impaired females had higher PVS volume fraction in white matter
PVS volume fraction changes in participants with history of hypertension
Acknowledgement
This work was supported by NIH grants: 2P41EB015922-21, 1P01AG052350-01 and USC ADRC 5P50AG005142 and 1P30AG066530-01. This research reported in this publication was also supported by the National Institute of Mental Health of the NIH under Award Number RF1MH123223. The content is solely the responsibility of the authors and does not necessarily represent the official views of the NIH.
ADNI: Data collection and sharing for this project was funded by the Alzheimer’s Disease Neuroimaging Initiative (ADNI) (National Institutes of Health Grant U01 AG024904) and DOD ADNI (Department of Defense award number W81XWH-12-2-0012). ADNI is funded by the National Institute on Aging, the National Institute of Biomedical Imaging and Bioengineering, and through generous contributions from the following: AbbVie, Alzheimer’s Association; Alzheimer’s Drug Discovery Foundation; Araclon Biotech; BioClinica, Inc.; Biogen; Bristol-Myers Squibb Company; CereSpir, Inc.; Cogstate; Eisai Inc.; Elan Pharmaceuticals, Inc.; Eli Lilly and Company; EuroImmun; F. Hoffmann-La Roche Ltd and its affiliated company Genentech, Inc.; Fujirebio; GE Healthcare; IXICO Ltd.; Janssen Alzheimer Immunotherapy Research & Development, LLC.; Johnson & Johnson Pharmaceutical Research & Development LLC.; Lumosity; Lundbeck; Merck & Co., Inc.; Meso Scale Diagnostics, LLC.; NeuroRx Research; Neurotrack Technologies; Novartis Pharmaceuticals Corporation; Pfizer Inc.; Piramal Imaging; Servier; Takeda Pharmaceutical Company; and Transition Therapeutics. The Canadian Institutes of Health Research is providing funds to support ADNI clinical sites in Canada. Private sector contributions are facilitated by the Foundation for the National Institutes of Health (www.fnih.org). The grantee organization is the Northern California Institute for Research and Education, and the study is coordinated by the Alzheimer’s Therapeutic Research Institute at the University of Southern California. ADNI data are disseminated by the Laboratory for Neuro Imaging at the University of Southern California.
Footnotes
Publisher's Disclaimer: This is a PDF file of an unedited manuscript that has been accepted for publication. As a service to our customers we are providing this early version of the manuscript. The manuscript will undergo copyediting, typesetting, and review of the resulting proof before it is published in its final form. Please note that during the production process errors may be discovered which could affect the content, and all legal disclaimers that apply to the journal pertain.
Disclosure statement
Authors have no conflict of interest to declare.
Verification
Authors have no any actual or potential conflicts of interest including any financial, personal or other relationships with other people or organizations within three years of beginning the work submitted that could inappropriately influence (bias) their work.
None of the authors has contracts relating to this research through which it or any other organization may stand to gain financially now or in the future.
None of the authors has other agreements of authors or their institutions that could be seen as involving a financial interest in this work.
This work was supported by NIH grants: 2P41EB015922-21, 1P01AG052350-01 and USC ADRC 5P50AG005142. The content is solely the responsibility of the authors and does not necessarily represent the official views of the NIH.
Data collection and sharing for this project was funded by the Alzheimer’s Disease Neuroimaging Initiative (ADNI) (National Institutes of Health Grant U01 AG024904) and DOD ADNI (Department of Defense award number W81XWH-12-2-0012). ADNI is funded by the National Institute on Aging, the National Institute of Biomedical Imaging and Bioengineering, and through generous contributions from the following: AbbVie, Alzheimer’s Association; Alzheimer’s Drug Discovery Foundation; Araclon Biotech; BioClinica, Inc.; Biogen; Bristol-Myers Squibb Company; CereSpir, Inc.; Cogstate; Eisai Inc.; Elan Pharmaceuticals, Inc.; Eli Lilly and Company; EuroImmun; F. Hoffmann-La Roche Ltd and its affiliated company Genentech, Inc.; Fujirebio; GE Healthcare; IXICO Ltd.; Janssen Alzheimer Immunotherapy Research & Development, LLC.; Johnson & Johnson Pharmaceutical Research & Development LLC.; Lumosity; Lundbeck; Merck & Co., Inc.; Meso Scale Diagnostics, LLC.; NeuroRx Research; Neurotrack Technologies; Novartis Pharmaceuticals Corporation; Pfizer Inc.; Piramal Imaging; Servier; Takeda Pharmaceutical Company; and Transition Therapeutics. The Canadian Institutes of Health Research is providing funds to support ADNI clinical sites in Canada. Private sector contributions are facilitated by the Foundation for the National Institutes of Health (www.fnih.org). The grantee organization is the Northern California Institute for Research and Education, and the study is coordinated by the Alzheimer’s Therapeutic Research Institute at the University of Southern California. ADNI data are disseminated by the Laboratory for Neuro Imaging at the University of Southern California.
All authors have reviewed the contents of the manuscript being submitted, approve of its contents and validate the accuracy of the data.
Reference:
- Adachi M, Hosoya T, Haku T, Yamaguchi K, 1998. Dilated Virchow-Robin spaces: MRI pathological study. Neuroradiology 40, 27–31. [DOI] [PubMed] [Google Scholar]
- Arba F, Quinn TJ, Hankey GJ, Lees KR, Wardlaw JM, Ali M, 2018. Enlarged perivascular spaces and cognitive impairment after stroke and transient ischemic attack. Int. J. Strok 13, 47–56. 10.1177/1747493016666091 [DOI] [PubMed] [Google Scholar]
- Avants BB, Tustison N, Song G, 2009. Advanced Normalization Tools (ANTS). Insight J 1–35. [Google Scholar]
- Avants BB, Tustison NJ, Song G, Cook PA, Klein A, Gee JC, 2011. A reproducible evaluation of ANTs similarity metric performance in brain image registration. Neuroimage 54, 2033–2044. [DOI] [PMC free article] [PubMed] [Google Scholar]
- Baker SL, Lockhart SN, Price JC, He M, Huesman RH, Schonhaut D, Faria J, Rabinovici G, Jagust WJ, 2017a. Reference tissue–based kinetic evaluation of 18F-AV-1451 for tau imaging. J. Nucl. Med 58, 332–338. [DOI] [PMC free article] [PubMed] [Google Scholar]
- Baker SL, Maass A, Jagust WJ, 2017b. Considerations and code for partial volume correcting [(18)F]-AV-1451 tau PET data. Data Br 15, 648–657. 10.1016/j.dib.2017.10.024 [DOI] [PMC free article] [PubMed] [Google Scholar]
- Bakker ENTP, Bacskai BJ, Arbel-Ornath M, Aldea R, Bedussi B, Morris AWJ, Weller RO, Carare RO, 2016. Lymphatic Clearance of the Brain: Perivascular, Paravascular and Significance for Neurodegenerative Diseases. Cell. Mol. Neurobiol 36 10.1007/s10571-015-0273-8 [DOI] [PMC free article] [PubMed] [Google Scholar]
- Banerjee G, Kim HJ, Fox Z, Jager HR, Wilson D, Charidimou A, Na HK, Na DL, Seo SW, Werring DJ, 2017. MRI-visible perivascular space location is associated with Alzheimer’s disease independently of amyloid burden. Brain 140, 1107–1116. 10.1093/brain/awx003 [DOI] [PubMed] [Google Scholar]
- Barisano G, Sepehrband F, Ma S, Jann K, Cabeen R, Wang DJ, Toga AW, Law M, 2018. Clinical 7 T MRI: Are we there yet? A review about magnetic resonance imaging at ultra-high field. Br. J. Radiol 91, 20180492. [DOI] [PMC free article] [PubMed] [Google Scholar]
- Battisti-Charbonney A, Fisher J, Duffin J, 2011. The cerebrovascular response to carbon dioxide in humans. J. Physiol 589, 3039–3048. [DOI] [PMC free article] [PubMed] [Google Scholar]
- Beak HW, Choi HJ, Byun MS, Choe YM, Yi D, Han JY, Lee YJ, Woo JI, Lee DY, 2015. Prevalence of enlarged perivascular spaces in a memory clinic population. Alzheimer’s Dement. J. Alzheimer’s Assoc 11, P146. [Google Scholar]
- Bechmann I, Priller J, Kovac A, Bontert M, Wehner T, Klett FF, Bechmann I, Priller J, Kovac A, Bo M, Stuschke M, Dirnagl U, Nitsch R, 2001. Immune surveillance of mouse brain perivascular spaces by blood-borne macrophages. Eur. J. Neurosci 14, 1651–1658. [DOI] [PubMed] [Google Scholar]
- Bennett M, Cantini M, Reboud J, Cooper JM, Roca-Cusachs P, Salmeron-Sanchez M, 2018. Molecular clutch drives cell response to surface viscosity. Proc. Natl. Acad. Sci. U. S. A 115, 1192–1197. 10.1073/pnas.1710653115 [DOI] [PMC free article] [PubMed] [Google Scholar]
- Blair LJ, Frauen HD, Zhang B, Nordhues BA, Bijan S, Lin Y-C, Zamudio F, Hernandez LD, Sabbagh JJ, Selenica M-LB, Dickey CA, 2015. Tau depletion prevents progressive blood-brain barrier damage in a mouse model of tauopathy. Acta Neuropathol. Commun 3, 8 10.1186/s40478-015-0186-2 [DOI] [PMC free article] [PubMed] [Google Scholar]
- Braak H, Braak E, 1996. Evolution of the neuropathology of Alzheimer’s disease. Acta Neurol. Scand 94, 3–12. 10.1111/j.1600-0404.1996.tb05866.x [DOI] [PubMed] [Google Scholar]
- Braak H, Braak E, 1991. Neuropathological stageing of Alzheimer-related changes. Acta Neuropathol 82, 239–259. 10.1109/ICINIS.2015.10 [DOI] [PubMed] [Google Scholar]
- Brendel M, Högenauer M, Delker A, Sauerbeck J, Bartenstein P, Seibyl J, Rominger A, 2015. Improved longitudinal [18F]-AV45 amyloid PET by white matter reference and VOI-based partial volume effect correction. Neuroimage 108, 450–459. 10.1016/j.neuroimage.2014.11.055 [DOI] [PubMed] [Google Scholar]
- Cabeen RP, Laidlaw DH, Toga AW, 2018. Quantitative Imaging Toolkit : Software for Interactive 3D Visualization, Data Exploration, and Computational Analysis of Neuroimaging Datasets, in: ISMRM-ESMRMB Abstracts pp. 12–14. [Google Scholar]
- Carare RO, Bernardes-Silva M, Newman TA, Page AM, Nicoll JAR, Perry VH, Weller RO, 2008. Solutes, but not cells, drain from the brain parenchyma along basement membranes of capillaries and arteries: Significance for cerebral amyloid angiopathy and neuroimmunology. Neuropathol. Appl. Neurobiol 34, 131–144. 10.1111/j.1365-2990.2007.00926.x [DOI] [PubMed] [Google Scholar]
- Charidimou A, Boulouis G, Pasi M, Van Etten ES, Haley K, Ayres A, Schwab KM, Greenberg SM, 2017. MRI-visible perivascular spaces in cerebral amyloid angiopathy and hypertensive arteriopathy. Am. Acad. Neurol 88, 1157–64. [DOI] [PMC free article] [PubMed] [Google Scholar]
- Charidimou A, Hong YT, Jäger HR, Fox Z, Aigbirhio FI, Fryer TD, Menon DK, Warburton EA, Werring DJ, Baron J, 2015. White Matter Perivascular Spaces on Magnetic Resonance Imaging - Marker of Cerebrovascular Amyloid Burden? Stroke 46, 1707–1709. 10.1161/STROKEAHA.115.009090 [DOI] [PubMed] [Google Scholar]
- Charidimou A, Jäger RH, Peeters A, Vandermeeren Y, Laloux P, Baron J, Werring DJ, 2014. White Matter Perivascular Spaces Are Related to Cortical Superficial Siderosis in Cerebral Amyloid Angiopathy. Stroke 45, 2930–2935. 10.1161/STROKEAHA.114.005568 [DOI] [PubMed] [Google Scholar]
- Charidimou A, Meegahage R, Fox Z, Peeters A, Vandermeeren Y, Laloux P, Baron J-C, Jäger HR, Werring DJ, 2013. Enlarged perivascular spaces as a marker of underlying arteriopathy in intracerebral haemorrhage: a multicentre MRI cohort study. J Neurol Neurosurg Psychiatry 84, 624–629. [DOI] [PMC free article] [PubMed] [Google Scholar]
- Chen K, Roontiva A, Thiyyagura P, Lee W, Liu X, Ayutyanont N, Protas H, Luo JL, Bauer R, Reschke C, Bandy D, Koeppe RA, Fleisher AS, Caselli RJ, Landau S, Jagust WJ, Weiner MW, Reiman EM, 2015. Improved Power for Characterizing Longitudinal Amyloid- PET Changes and Evaluating Amyloid-Modifying Treatments with a Cerebral White Matter Reference Region. J. Nucl. Med 56, 560–566. 10.2967/jnumed.114.149732 [DOI] [PubMed] [Google Scholar]
- Chen W, Song X, Zhang Y, 2011a. Assessment of the Virchow-Robin Spaces in Alzheimer Disease, Mild Cognitive Impairment, and Normal Aging, Using High-Field MR Imaging. AJNR 32, 1490–5. [DOI] [PMC free article] [PubMed] [Google Scholar]
- Chen W, Song X, Zhang Y, Initiative ADN, 2011b. Assessment of the Virchow-Robin Spaces in Alzheimer disease, mild cognitive impairment, and normal aging, using high-field MR imaging. Am. J. Neuroradiol 32, 1490–1495. [DOI] [PMC free article] [PubMed] [Google Scholar]
- Clark CM, Schneider JA, Bedell BJ, Beach TG, Bilker WB, Mintun MA, Pontecorvo MJ, Hefti F, Carpenter AP, Flitter ML, Krautkramer MJ, Kung HF, Coleman RE, Doraiswamy PM, Fleisher AS, Sabbagh MN, Sadowsky CH, Reiman EP, Zehntner SP, Skovronsky DM, Group A-AS, 2011. Use of florbetapir-PET for imaging beta-amyloid pathology. JAMA 305, 275–283. 10.1001/jama.2010.2008 [DOI] [PMC free article] [PubMed] [Google Scholar]
- Corder EH, Saunders AM, Strittmatter WJ, Schmechel DE, Gaskell PC, Small GW, Roses AD, Haines JL, Pericak-Vance MA, 1993. Gene dose of apolipoprotein E type 4 allele and the risk of Alzheimer’s disease in late onset families. Science (80-. ) 261, 921–923. 10.1126/science.8346443 [DOI] [PubMed] [Google Scholar]
- Da Mesquita S, Louveau A, Vaccari A, Smirnov I, Cornelison RC, Kingsmore KM, Contarino C, Onengut-Gumuscu S, Farber E, Raper D, 2018. Functional aspects of meningeal lymphatics in ageing and Alzheimer’s disease. Nature 560, 185–191. [DOI] [PMC free article] [PubMed] [Google Scholar]
- Dale A, Fischl B, Sereno MI, 1999. Cortical Surface-Based Analysis: I. Segmentation and Surface Reconstruction. Neuroimage 9, 179–194. 10.1006/nimg.1998.0395 [DOI] [PubMed] [Google Scholar]
- De Long WB, 1973. Anatomy of the middle cerebral artery: The temporal branches. Stroke 4, 412–418. 10.1161/01.STR.4.3.412 [DOI] [PubMed] [Google Scholar]
- Desikan RS, Ségonne F, Fischl B, Quinn BT, Dickerson BC, Blacker D, Buckner RL, Dale AM, Maguire RP, Hyman BT, Albert MS, Killiany RJ, 2006. An automated labeling system for subdividing the human cerebral cortex on MRI scans into gyral based regions of interest. Neuroimage 31, 968–980. 10.1016/j.neuroimage.2006.01.021 [DOI] [PubMed] [Google Scholar]
- Diedrichsen J, 2006. A spatially unbiased atlas template of the human cerebellum. Neuroimage 33, 127–138. 10.1016/j.neuroimage.2006.05.056 [DOI] [PubMed] [Google Scholar]
- Diem AK, MacGregor Sharp M, Gatherer M, Bressloff NW, Carare RO, Richardson G, 2017. Arterial Pulsations cannot Drive Intramural Periarterial Drainage: Significance for A$β$ Drainage. Front. Neurosci 11, 1–9. 10.3389/fnins.2017.00475 [DOI] [PMC free article] [PubMed] [Google Scholar]
- Dinov I, Lozev K, Petrosyan P, Liu Z, Eggert P, 2010. Neuroimaging Study Designs, Computational Analyses and Data Provenance Using the LONI Pipeline. PLoS One 5, e13070 10.1371/journal.pone.0013070 [DOI] [PMC free article] [PubMed] [Google Scholar]
- Dinov ID, Van Horn JD, Lozev KM, Magsipoc R, Petrosyan P, Liu Z, MacKenzie-Graham A, Eggert P, Parker DS, Toga AW, 2009. Efficient, distributed and interactive neuroimaging data analysis using the LONI pipeline. Front. Neuroinform 3. [DOI] [PMC free article] [PubMed] [Google Scholar]
- Doubal FN, MacLullich AMJ, Ferguson KJ, Dennis MS, Wardlaw JM, 2010. Enlarged perivascular spaces on MRI are a feature of cerebral small vessel disease. Stroke 41, 450–454. [DOI] [PubMed] [Google Scholar]
- Faraco G, Iadecola C, 2013. Hypertension: a harbinger of stroke and dementia. Hypertension 62, 810–7. 10.1038/jid.2014.371 [DOI] [PMC free article] [PubMed] [Google Scholar]
- Ferguson SC, Blane A, Perros P, McCrimmon RJ, Best JJK, Wardlaw J, Deary IJ, Frier BM, 2003. Cognitive ability and brain structure in type 1 diabetes: relation to microangiopathy and preceding severe hypoglycemia. Diabetes 52, 149–156. [DOI] [PubMed] [Google Scholar]
- Fischl B, 2012. FreeSurfer. Neuroimage 62, 774–781. [DOI] [PMC free article] [PubMed] [Google Scholar]
- Fischl B, Dale AM, 2000. Measuring the thickness of the human cerebral cortex from magnetic resonance images. Proc. Natl. Acad. Sci 97, 11050 LP–11055. [DOI] [PMC free article] [PubMed] [Google Scholar]
- Fischl B, Salat DH, Busa E, Albert M, Dieterich M, Haselgrove C, Van Der Kouwe A, Killiany R, Kennedy D, Klaveness S, 2002. Whole brain segmentation: automated labeling of neuroanatomical structures in the human brain. Neuron 33, 341–355. [DOI] [PubMed] [Google Scholar]
- Fischl B, Salat DH, van der Kouwe AJW, Makris N, Ségonne F, Quinn BT, Dale AM, 2004a. Sequence-independent segmentation of magnetic resonance images. Neuroimage 23, S69–S84. 10.1016/j.neuroimage.2004.07.016 [DOI] [PubMed] [Google Scholar]
- Fischl B, Sereno MI, Dale A, 1999. Cortical Surface-Based Analysis: II: Inflation, Flattening, and a Surface-Based Coordinate System. Neuroimage 9, 195–207. 10.1006/nimg.1998.0396 [DOI] [PubMed] [Google Scholar]
- Fischl B, van der Kouwe A, Destrieux C, Halgren E, Ségonne F, Salat DH, Busa E, Seidman LJ, Goldstein J, Kennedy D, Caviness V, Makris N, Rosen B, Dale AM, 2004b. Automatically Parcellating the Human Cerebral Cortex. Cereb. Cortex 14, 11–22. 10.1093/cercor/bhg087 [DOI] [PubMed] [Google Scholar]
- Folstein MF, Robins LN, Helzer JE, 1983. The mini-mental state examination. Arch. Gen. Psychiatry 40, 812. [DOI] [PubMed] [Google Scholar]
- Francis F, Ballerini L, Wardlaw JM, 2019. Perivascular spaces and their associations with risk factors, clinical disorders and neuroimaging features: A systematic review and meta-analysis. Int. J. Stroke 14, 359–371. [DOI] [PubMed] [Google Scholar]
- Frangi AF, Niessen WJ, Vincken KL, Viergever MA, 1998. Multiscale vessel enhancement filtering, in: International Conference on Medical Image Computing and Computer-Assisted Intervention Springer, pp. 130–137. 10.1007/BFb0056195 [DOI] [Google Scholar]
- Guillemin GJ, Brew BJ, 2004. Microglia, macrophages, perivascular macrophages, and pericytes: a review of function and identificatio. J. Leukoc. Biol 75 10.1189/jlb.0303114.1 [DOI] [PubMed] [Google Scholar]
- Hadaczek P, Yamashita Y, Mirek H, Tamas L, Bohn MC, Noble C, Park JW, Bankiewicz K, 2006. The “perivascular pump” driven by arterial pulsation is a powerful mechanism for the distribution of therapeutic molecules within the brain. Mol. Ther 14, 69–78. [DOI] [PMC free article] [PubMed] [Google Scholar]
- Hilal S, Tan CS, Adams HHH, Habes M, Mok V, Venketasubramanian N, Hofer E, Ikram MK, Abrigo J, Vernooij MW, Chen C, Hosten N, Volzke H, Grabe HJ, Schmidt R, Ikram MA, 2018. Enlarged perivascular spaces and cognition: A meta-analysis of 5 population-based studies. Neurology 91, e832–e842. 10.1212/WNL.0000000000006079 [DOI] [PMC free article] [PubMed] [Google Scholar]
- Ho J, Tumkaya T, Aryal S, Choi H, Claridge-Chang A, 2019. Moving beyond P values: data analysis with estimation graphics. Nat. Methods 16, 565–566. [DOI] [PubMed] [Google Scholar]
- Hughes CP, Berg L, Danziger WL, Coben LA, Martin RL, 1982. A new clinical scale for the staging of dementia. Br. J. Psychiatry 140, 566–572. 10.1192/bjp.140.6.566 [DOI] [PubMed] [Google Scholar]
- Hurford R, Charidimou A, Fox Z, Cipolotti L, Jager R, Werring DJ, 2014. MRI-visible perivascular spaces : relationship to cognition and small vessel disease MRI markers in ischaemic stroke and TIA. J Neurol Neurosurg Psychiatry 85, 522–525. 10.1136/jnnp-2013-305815 [DOI] [PMC free article] [PubMed] [Google Scholar]
- Iadecola C, 2017. The Neurovascular Unit Coming of Age: A Journey through Neurovascular Coupling in Health and Disease. Neuron 96, 17–42. 10.1016/j.neuron.2017.07.030 [DOI] [PMC free article] [PubMed] [Google Scholar]
- Iliff JJ, Nedergaard M, 2013. Is there a cerebral lymphatic system? Stroke 44, S93––5. 10.1161/STROKEAHA.112.678698 [DOI] [PMC free article] [PubMed] [Google Scholar]
- Iliff JJ, Wang M, Liao Y, Plogg BA, Peng W, Gundersen GA, Benveniste H, Vates GE, Deane R, Goldman SA, Nagelhus EA, Nedergaard M, 2012. A paravascular pathway facilitates CSF flow through the brain parenchyma and the clearance of interstitial solutes, including amyloid β. Sci. Transl. Med 4, 1–11. 10.1126/scitranslmed.3003748 [DOI] [PMC free article] [PubMed] [Google Scholar]
- Iliff JJ, Wang M, Zeppenfeld DM, Venkataraman A, Plog BA, Liao Y, Deane R, Nedergaard M, 2013. Cerebral arterial pulsation drives paravascular CSF-interstitial fluid exchange in the murine brain. J. Neurosci 33, 18190–9. 10.1523/JNEUROSCI.1592-13.2013 [DOI] [PMC free article] [PubMed] [Google Scholar]
- Ishikawa M, Yamada S, Yamamoto K, 2018. Dilated perivascular spaces in the centrum semiovale begin to develop in middle age. J. Alzheimer’s Dis 61, 1619–1626. 10.3233/JAD-170755 [DOI] [PubMed] [Google Scholar]
- Jagust WJ, Landau SM, Shaw LM, Trojanowski JQ, Koeppe RA, Reiman EM, Foster NL, Petersen RC, Weiner MW, Price JC, Mathis CA, Initiative ADN, 2009. Relationships between biomarkers in aging and dementia. Neurology 73, 1193–1199. 10.1212/WNL.0b013e3181bc010c [DOI] [PMC free article] [PubMed] [Google Scholar]
- Jeong EH, Lee YJ, Kim SJ, Lee J-H, 2015. Is the Severity of Dilated Virchow-Robin Spaces Associated with Cognitive Dysfunction? Dement. Neurocognitive Disord 14, 114–119. [Google Scholar]
- Jiménez-Balado J, Riba-Llena I, Garde E, Valor M, Gutiérrez B, Pujadas F, Delgado P, 2018. Prevalence of hippocampal enlarged perivascular spaces in a sample of patients with hypertension and their relation with vascular risk factors and cognitive function. J. Neurol. Neurosurg. Psychiatry 89, 651–656. [DOI] [PubMed] [Google Scholar]
- Joshi AD, Pontecorvo MJ, Clark CM, Carpenter AP, Jennings DL, Sadowsky CH, Adler LP, Kovnat KD, Seibyl JP, Arora A, Saha K, Burns JD, Lowrey MJ, Mintun MA, Skovronsky DM, 2012. Performance Characteristics of Amyloid PET with Florbetapir F 18 in Patients with Alzheimer’s Disease and Cognitively Normal Subjects. J. Nucl. Med 53, 378–384. 10.2967/jnumed.111.090340 [DOI] [PubMed] [Google Scholar]
- Kalaria RN, Ballard C, 1999. Overlap between pathology of Alzheimer disease and vascular dementia. Alzheimer Dis. Assoc. Disord [DOI] [PubMed] [Google Scholar]
- Kang J-H, Korecka M, Figurski MJ, Toledo JB, Blennow K, Zetterberg H, Waligorska T, Brylska M, Fields L, Shah N, 2015. The Alzheimer’s disease neuroimaging initiative 2 biomarker core: a review of progress and plans. Alzheimer’s Dement 11, 772–791. [DOI] [PMC free article] [PubMed] [Google Scholar]
- Kepe V, 2013. Amyloid PET Imaging. PET Clin 8, 431–445. 10.1016/j.cpet.2013.08.002 [DOI] [PubMed] [Google Scholar]
- Khachaturian ZS, Kuller LH, Khachaturian AS, 2019. Strategic goals and roadmap for dementia prevention by stroke prevention. Alzheimer’s Dement 15, 865–869. 10.1016/j.jalz.2019.06.003 [DOI] [PubMed] [Google Scholar]
- Kisler K, Nelson AR, Montagne A, Zlokovic BV, 2017. Cerebral blood flow regulation and neurovascular dysfunction in Alzheimer disease. Nat. Rev. Neurosci 18, 419–434. 10.1038/nrn.2017.48 [DOI] [PMC free article] [PubMed] [Google Scholar]
- Klarenbeek P, van Oostenbrugge RJ, Lodder J, Rouhl RPW, Knottnerus ILH, Staals J, 2013. Higher ambulatory blood pressure relates to enlarged Virchow-Robin spaces in first-ever lacunar stroke patients. J. Neurol 260, 115–121. [DOI] [PMC free article] [PubMed] [Google Scholar]
- Korecka M, Waligorska T, Figurski M, Toledo JB, Arnold SE, Grossman M, Trojanowski JQ, Shaw LM, 2014. Qualification of a surrogate matrix-based absolute quantification method for amyloid-β 42 in human cerebrospinal fluid using 2D UPLC-tandem mass spectrometry. J. Alzheimer’s Dis 41, 441–451. [DOI] [PMC free article] [PubMed] [Google Scholar]
- Kress BT, Iliff JJ, Xia M, Wang M, Wei HS, Zeppenfeld D, Xie L, Kang H, Xu Q, Liew JA, 2014. Impairment of paravascular clearance pathways in the aging brain. Ann. Neurol 76, 845–861. [DOI] [PMC free article] [PubMed] [Google Scholar]
- Landau SM, Breault C, Joshi AD, Pontecorvo M, Mathis CA, Jagust WJ, Mintun MA, Initiative ADN, 2013a. Amyloid-β imaging with Pittsburgh compound B and florbetapir: comparing radiotracers and quantification methods. J. Nucl. Med 54, 70–77. 10.2967/jnumed.112.109009 [DOI] [PMC free article] [PubMed] [Google Scholar]
- Landau SM, Fero A, Baker SL, Koeppe R, Mintun M, Chen K, Reiman EM, Jagust WJ, 2015. Measurement of longitudinal β-amyloid change with 18F-florbetapir PET and standardized uptake value ratios. J. Nucl. Med 56, 567–574. [DOI] [PMC free article] [PubMed] [Google Scholar]
- Landau SM, Lu M, Joshi AD, Pontecorvo M, Mintun MA, Trojanowski JQ, Shaw LM, Jagust WJ, Initiative ADN, 2013b. Comparing positron emission tomography imaging and cerebrospinal fluid measurements of β-amyloid. Ann. Neurol 74, 826–836. 10.1002/ana.23908 [DOI] [PMC free article] [PubMed] [Google Scholar]
- Landau SM, Mintun MA, Joshi AD, Koeppe RA, Petersen RC, Aisen PS, Weiner MW, Jagust WJ, Initiative ADN, 2012. Amyloid deposition, hypometabolism, and longitudinal cognitive decline. Ann. Neurol 72, 578–586. 10.1002/ana.23650 [DOI] [PMC free article] [PubMed] [Google Scholar]
- Landau SM, Thomas BA, Thurfjell L, Schmidt M, Margolin R, Mintun M, Pontecorvo M, Baker SL, Jagust WJ, Initiative ADN, 2014. Amyloid PET imaging in Alzheimer’s disease: a comparison of three radiotracers. Eur. J. Nucl. Med. Mol. Imaging 41, 1398–1407. [DOI] [PMC free article] [PubMed] [Google Scholar]
- Lin J, Wang D, Lan L, Fan Y, 2017. Multiple Factors Involved in the Pathogenesis of White Matter Lesions. Biomed Res Int 2017, 9372050 10.1155/2017/9372050 [DOI] [PMC free article] [PubMed] [Google Scholar]
- Louveau A, Herz J, Alme MN, Salvador AF, Dong MQ, Viar KE, Herod SG, Knopp J, Setliff JC, Lupi AL, 2018. CNS lymphatic drainage and neuroinflammation are regulated by meningeal lymphatic vasculature. Nat. Neurosci 21, 1380–1391. [DOI] [PMC free article] [PubMed] [Google Scholar]
- Maass A, Landau S, Horng A, Lockhart SN, Rabinovici GD, Jagust WJ, Baker SL, La Joie R, 2017. Comparison of multiple tau-PET measures as biomarkers in aging and Alzheimer’s disease. Neuroimage 157, 448–463. 10.1016/j.neuroimage.2017.05.058 [DOI] [PMC free article] [PubMed] [Google Scholar]
- MacLullich AMJ, Wardlaw JM, Ferguson KJ, Starr JM, Seckl JR, Deary IJ, 2004. Enlarged perivascular spaces are associated with cognitive function in healthy elderly men. J. Neurol. Neurosurg. Psychiatry 75, 1519–1523. [DOI] [PMC free article] [PubMed] [Google Scholar]
- Madai VI, von Samson-Himmelstjerna FC, Bauer M, Stengl KL, Mutke MA, Tovar-Martinez E, Wuerfel J, Endres M, Niendorf T, Sobesky J, 2012. Ultrahigh-field mri in human ischemic stroke - a 7 Tesla study. PLoS One 7 10.1371/journal.pone.0037631 [DOI] [PMC free article] [PubMed] [Google Scholar]
- Malone K, Amu S, Moore AC, Waeber C, 2019. The immune system and stroke: from current targets to future therapy. Immunol. Cell Biol 97, 5–16. [DOI] [PubMed] [Google Scholar]
- Manjón JV, Coupé P, Martí-Bonmatí L, Collins DL, Robles M, 2010. Adaptive non-local means denoising of MR images with spatially varying noise levels. J. Magn. Reson. Imaging 31, 192–203. [DOI] [PubMed] [Google Scholar]
- Marchi N, Banjara M, Janigro D, 2016. Blood–brain barrier, bulk flow, and interstitial clearance in epilepsy. J. Neurosci. Methods 34, 352–359. 10.1177/0963721414541462.Self-Control [DOI] [PMC free article] [PubMed] [Google Scholar]
- Montagne A, Nation DA, Sagare AP, Barisano G, Sweeney MD, Chakhoyan A, Pachicano M, Joe E, Nelson AR, D’Orazio LM, 2020. APOE4 leads to blood–brain barrier dysfunction predicting cognitive decline. Nature 581, 71–76. [DOI] [PMC free article] [PubMed] [Google Scholar]
- Montagne A, Nikolakopoulou AM, Zhao Z, Sagare AP, Si G, Lazic D, Barnes SR, Daianu M, Ramanathan A, Go A, Lawson EJ, Wang Y, Mack WJ, Thompson PM, Schneider JA, Varkey J, Langen R, Mullins E, Jacobs RE, Zlokovic BV, 2018. Pericyte degeneration causes white matter dysfunction in the mouse central nervous system. Nat. Med 24, 326. [DOI] [PMC free article] [PubMed] [Google Scholar] [Retracted]
- Moon SW, Dinov ID, Kim J, Zamanyan A, Hobel S, Thompson PM, Toga AW, 2015. Structural neuroimaging genetics interactions in Alzheimer’s disease. J. Alzheimer’s Dis 48, 1051–1063. 10.3233/JAD-150335 [DOI] [PMC free article] [PubMed] [Google Scholar]
- Mormino EC, Kluth JT, Madison CM, Rabinovici GD, Baker SL, Miller BL, Koeppe RA, Mathis CA, Weiner MW, Jagust WJ, Initiative ADN, 2009. Episodic memory loss is related to hippocampal-mediated beta-amyloid deposition in elderly subjects. Brain 132, 1310–1323. 10.1093/brain/awn320 [DOI] [PMC free article] [PubMed] [Google Scholar]
- Morris JC, 1993. The clinical dementia rating (cdr): Current version and scoring rules. Neurology 43, 2412–2414. 10.1212/wnl.43.11.2412-a [DOI] [PubMed] [Google Scholar]
- Nation Daniel A., Sweeney MD, Montagne A, Sagare AP, D’Orazio LM, Pachicano M, Sepehrband F, Nelson AR, Buennagel DP, Harrington MG, Benzinger TLS, Fagan AM, Ringman JM, Schneider LS, Morris JC, Chui HC, Law M, Toga AW, Zlokovic BV, 2019. Blood–brain barrier breakdown is an early biomarker of human cognitive dysfunction. Nat. Med 25, 270–276. 10.1038/s41591-018-0297-y [DOI] [PMC free article] [PubMed] [Google Scholar]
- Nation Daniel A, Sweeney MD, Montagne A, Sagare AP, D’Orazio LM, Pachicano M, Sepehrband F, Nelson AR, Buennagel DP, Harrington MG, Benzinger TLS, Fagan AM, Ringman JM, Schneider LS, Morris JC, Chui HC, Law M, Toga AW, Zlokovic BV, 2019. Blood–brain barrier breakdown is an early biomarker of human cognitive dysfunction. Nat. Med 10.1038/s41591-018-0297-y [DOI] [PMC free article] [PubMed] [Google Scholar]
- Nedergaard M, 2013. Garbage truck of the brain. Science (80-. ) 340, 1529–1530. 10.1126/science.1240514 [DOI] [PMC free article] [PubMed] [Google Scholar]
- Nonaka H, Akima M, Hatori T, Nagayama T, Zhang Z, Ihara F, 2003. The Microvasculature of the Cerebral White Matter : Arteries of the Subcortical White Matter. J. Neuropathol. Exp. Neurol 62, 154–161. [DOI] [PubMed] [Google Scholar]
- Panza F, Solfrizzi V, Torres F, Mastroianni F, Colacicco AM, Basile AM, Capurso C, D’Introno A, Del Parigi A, Capurso A, 2000. Apolipoprotein E in Southern Italy: protective effect of ε2 allele in early-and late-onset sporadic Alzheimer’s disease. Neurosci. Lett 292, 79–82. [DOI] [PubMed] [Google Scholar]
- Park L, Uekawa K, Garcia-Bonilla L, Koizumi K, Murphy M, Pistik R, Younkin L, Younkin S, Zhou P, Carlson G, Anrather J, Iadecola C, 2017. Brain Perivascular Macrophages Initiate the Neurovascular Dysfunction of Alzheimer Abeta Peptides. Circ. Res 121, 258–269. 10.1161/CIRCRESAHA.117.311054 [DOI] [PMC free article] [PubMed] [Google Scholar]
- Passiak BS, Liu D, Kresge HA, Cambronero FE, Pechman KR, Osborn KE, Gifford KA, Hohman TJ, Schrag MS, Davis LT, 2019. Perivascular spaces contribute to cognition beyond other small vessel disease markers. Neurology 92, e1309–e1321. [DOI] [PMC free article] [PubMed] [Google Scholar]
- Pearson ES, D”’agostino RB, Bowman KO, 1977. Tests for departure from normality: Comparison of powers. Biometrika 64, 231–246. 10.1093/biomet/64.2.231 [DOI] [Google Scholar]
- Perlmutter JS, Powers WJ, Herscovitch P, Fox PT, Raichle ME, 1987. Regional asymmetries of cerebral blood flow, blood volume, and oxygen utilization and extraction in normal subjects. J. Cereb. Blood Flow Metab 7, 64–67. [DOI] [PubMed] [Google Scholar]
- Perosa V, Priester A, Ziegler G, Cardenas-Blanco A, Dobisch L, Spallazzi M, Assmann A, Maass A, Speck O, Oltmer J, Heinze HJ, Schreiber S, Düzel E, 2020. Hippocampal vascular reserve associated with cognitive performance and hippocampal volume. Brain 143, 622–634. 10.1093/brain/awz383 [DOI] [PMC free article] [PubMed] [Google Scholar]
- Potter GM, Doubal FN, Jackson CA, Chappell FM, Sudlow CL, Dennis MS, Wardlaw JM, 2015. Enlarged perivascular spaces and cerebral small vessel disease. Int. J. stroke 10, 376–381. [DOI] [PMC free article] [PubMed] [Google Scholar]
- Qiu C, Kivipelto M, Agüero-Torres H, Winblad B, Fratiglioni L, 2004. Risk and protective effects of the APOE gene towards Alzheimer’s disease in the Kungsholmen project: variation by age and sex. J. Neurol. Neurosurg. Psychiatry 75, 828–833. [DOI] [PMC free article] [PubMed] [Google Scholar]
- Ramirez J, Berezuk C, McNeely AA, Gao F, McLaurin J, Black SE, 2016. Imaging the perivascular space as a potential biomarker of neurovascular and neurodegenerative diseases. Cell. Mol. Neurobiol 36, 289–299. [DOI] [PMC free article] [PubMed] [Google Scholar]
- Ramirez J, Berezuk C, McNeely AA, Scott CJM, Gao F, Black SE, 2015a. Visible Virchow-Robin spaces on magnetic resonance imaging of Alzheimer’s disease patients and normal elderly from the Sunnybrook dementia study. J. Alzheimer’s Dis 43, 415–424. 10.3233/JAD-132528 [DOI] [PubMed] [Google Scholar]
- Ramirez J, Berezuk C, McNeely AA, Scott CJM, Gao F, Black SE, 2015b. Visible Virchow-Robin spaces on magnetic resonance imaging of Alzheimer’s disease patients and normal elderly from the Sunnybrook Dementia Study. J. Alzheimer’s Dis 43, 415–424. [DOI] [PubMed] [Google Scholar]
- Rasmussen MK, Mestre H, Nedergaard M, 2018. The glymphatic pathway in neurological disorders. Lancet Neurol 17, 1016–1024. [DOI] [PMC free article] [PubMed] [Google Scholar]
- Reilhac A, Rousset OG, Comtat C, Frouin V, Gregoire M-C, Evans AC, n.d. A correction algorithm for partial volume effects in 3D PET imaging: principle and validation. 2000 IEEE Nucl. Sci. Symp. Conf. Rec. (Cat. No.00CH37149) 10.1109/nssmic.2000.949232 [DOI] [Google Scholar]
- Reuter M, Fischl B, 2011. Avoiding Asymmetry-Induced Bias in Longitudinal Image Processing. Neuroimage 57, 19–21. 10.1016/j.neuroimage.2011.02.076 [DOI] [PMC free article] [PubMed] [Google Scholar]
- Reuter M, Rosas HD, Fischl B, 2010. Highly Accurate Inverse Consistent Registration: A Robust Approach. Neuroimage 53, 1181–1196. 10.1016/j.neuroimage.2010.07.020 [DOI] [PMC free article] [PubMed] [Google Scholar]
- Reuter M, Schmansky NJ, Rosas HD, Fischl B, 2012. Within-Subject Template Estimation for Unbiased Longitudinal Image Analysis. Neuroimage 61, 1402–1418. 10.1016/j.neuroimage.2012.02.084 [DOI] [PMC free article] [PubMed] [Google Scholar]
- Riba-Llena I, Nafrıa C, Mundet X, Lopez-Rueda A, Fernandez-Cortinas I, Jarca CI, Jimenez-Balado J, Domingo M, Tovar JL, Orfila F, Pujadas F, A.-S. J, Maisterra O, Montaner J, Delgado P, 2016. Assessment of enlarged perivascular spaces and their relation to target organ damage and mild cognitive impairment in patients with hypertension. Eur. J. Neurol 23, 1044–1050. 10.1111/ene.12979 [DOI] [PubMed] [Google Scholar]
- Rosenberg GA, 2017. Extracellular matrix inflammation in vascular cognitive impairment and dementia. Clin. Sci 131, 425–437. 10.1042/CS20160604 [DOI] [PubMed] [Google Scholar]
- Rouhl RPW, Van Oostenbrugge RJ, Knottnerus ILH, Staals JEA, Lodder J, 2008. Virchow-Robin spaces relate to cerebral small vessel disease severity. J. Neurol 255, 692–696. [DOI] [PubMed] [Google Scholar]
- Schiltz JC, Sawchenko PE, 2003. Signaling the brain in systemic inflammation: the role of perivascular cells. Front Biosci 8, s1321–s1329. [DOI] [PubMed] [Google Scholar]
- Schöll M, Lockhart SN, Schonhaut DR, O’Neil JP, Janabi M, Ossenkoppele R, Baker SL, Vogel JW, Faria J, Schwimmer HD, 2016. PET imaging of tau deposition in the aging human brain. Neuron 89, 971–982. [DOI] [PMC free article] [PubMed] [Google Scholar]
- Segonne F, Dale AM, Busa E, Glessner M, Salat D, Hahn HK, Fischl B, 2004. A hybrid approach to the skull stripping problem in MRI. Neuroimage 22, 1060–1075. 10.1016/j.neuroimage.2004.03.032 [DOI] [PubMed] [Google Scholar]
- Segonne F, Pacheco J, Fischl B, 2007. Geometrically accurate topology-correction of cortical surfaces using nonseparating loops. IEEE Trans Med Imaging 26, 518–529. [DOI] [PubMed] [Google Scholar]
- Sepehrband F, Barisano G, Sheikh-Bahaei N, Cabeen RP, Choupan J, Law M, Toga AW, 2019a. Image processing approaches to enhance perivascular space visibility and quantification using MRI. Sci. Rep 9, 12351 10.1038/s41598-019-48910-x [DOI] [PMC free article] [PubMed] [Google Scholar]
- Sepehrband F, Cabeen RP, Barisano G, Sheikh-Bahaei N, Choupan J, Law M, Toga AW, 2019b. Nonparenchymal fluid is the source of increased mean diffusivity in preclinical Alzheimer’s disease. Alzheimer’s Dement. Diagnosis, Assess. Dis. Monit 11, 348–354. 10.1016/j.dadm.2019.03.002 [DOI] [PMC free article] [PubMed] [Google Scholar]
- Sepehrband F, Cabeen RP, Choupan J, Barisano G, Law M, Toga AW, 2019c. Perivascular space fluid contributes to diffusion tensor imaging changes in white matter. Neuroimage 197, 243–254. 10.1016/j.neuroimage.2019.04.070 [DOI] [PMC free article] [PubMed] [Google Scholar]
- Sepehrband F, Lynch KM, Cabeen RP, Gonzalez-Zacarias C, Zhao L, D’Arcy M, Kesselman C, Herting MM, Dinov ID, Toga AW, Clark KA, 2018. Neuroanatomical morphometric characterization of sex differences in youth using statistical learning. Neuroimage 172, 217–227. 10.1016/j.neuroimage.2018.01.065 [DOI] [PMC free article] [PubMed] [Google Scholar]
- Sled JG, Zijdenbos AP, Evans AC, 1998. A nonparametric method for automatic correction of intensity nonuniformity in MRI data. IEEE Trans. Med. Imaging 17, 87–97. 10.1109/42.668698 [DOI] [PubMed] [Google Scholar]
- Sta Cruz S, Dinov ID, Herting MM, Gonzalez-Zacarias C, Kim H, Toga AW, Sepehrband F, 2019. Imputation Strategy for Reliable Regional MRI Morphological Measurements. Neuroinformatics 10.1007/s12021-019-09426-x [DOI] [PMC free article] [PubMed] [Google Scholar]
- Sweeney MD, Sagare AP, Zlokovic BV, 2018. Blood–brain barrier breakdown in Alzheimer disease and other neurodegenerative disorders. Nat. Rev. Neurol 14, 133. [DOI] [PMC free article] [PubMed] [Google Scholar]
- Thomas T, Thomas G, McLendon C, Sutton T, Mullan M, 1996. β-Amyloid-mediated vasoactivity and vascular endothelial damage. Nature 380, 168. [DOI] [PubMed] [Google Scholar]
- Toga AW, Crawford KL, 2010. The informatics core of the Alzheimer’s Disease Neuroimaging Initiative. Alzheimer’s Dement 6, 247–256. 10.1016/j.jalz.2010.03.001 [DOI] [PMC free article] [PubMed] [Google Scholar]
- Torri F, Dinov ID, Zamanyan A, Hobel S, Genco A, Petrosyan P, Clark AP, Liu Z, Eggert P, Pierce J, Knowles JA, Ames J, Kesselman C, Toga AW, Potkin SG, Vawter MP, Macciardi F, 2012. Next generation sequence analysis and computational genomics using graphical pipeline workflows. Genes (Basel) 3, 545–575. 10.3390/genes3030545 [DOI] [PMC free article] [PubMed] [Google Scholar]
- Troili F, Cipollini V, Moci M, Morena E, Palotai M, Rinaldi V, Romano C, Ristori G, Giubilei F, Salvetti M, Orzi F, Guttmann CRG, Cavallari M, 2020. Perivascular Unit : This Must Be the Place. The Anatomical Crossroad Between the Immune, Vascular and Nervous System. Front. Neuroanat 14, 1–17. 10.3389/fnana.2020.00017 [DOI] [PMC free article] [PubMed] [Google Scholar]
- Tustison NJ, Avants BB, Cook PA, Zheng Y, Egan A, Yushkevich PA, Gee JC, 2010. N4ITK: improved N3 bias correction. IEEE Trans. Med. Imaging 29, 1310–1320. [DOI] [PMC free article] [PubMed] [Google Scholar]
- Valdés Hernández M. del C., Ballerini L, Glatz A, Muñoz Maniega S, Gow AJ, Bastin ME, Starr JM, Deary IJ, Wardlaw JM, 2019. Perivascular spaces in the centrum semiovale at the beginning of the 8th decade of life: effect on cognition and associations with mineral deposition. Brain Imaging Behav 10.1007/s11682-019-00128-1 [DOI] [PMC free article] [PubMed] [Google Scholar]
- Wardlaw Joanna M., Benveniste H, Nedergaard M, Zlokovic Ef BV, Mestre H, Lee H, Doubal FN, Brown R, Ramirez J, Macintosh BJ, Tannenbaum A, Ballerini L, Rungta RL, Boido D, Sweeney M, Montagne A, Charpak S, Joutel A, Smith KJ, Black SE, Hurvitz Brain H, Zlokovic BV, Mestre H, Lee H, Doubal FN, Brown R, Ramirez J, Macintosh BJ, Tannenbaum A, Ballerini L, Rungta RL, Boido D, Sweeney M, Montagne A, Charpak S, Joutel A, Smith KJ, Black SE, 2020. Perivascular Spaces in the Brain: Anatomy, Physiology, and Contributions to Pathology of Brain Diseases, Nature Reviews Neurology. Nature Research 10.1038/s41582-020-0312-z [DOI] [PubMed] [Google Scholar]
- Wardlaw Joanna M, Benveniste H, Nedergaard M, Zlokovic BV, Mestre H, Lee H, Doubal FN, Brown R, Ramirez J, MacIntosh BJ, 2020. Perivascular spaces in the brain: anatomy, physiology and pathology. Nat. Rev. Neurol 1–17. [DOI] [PubMed] [Google Scholar]
- Waters AB, Mace RA, Sawyer KS, 2018. Identifying errors in Freesurfer automated skull stripping and the incremental utility of manual intervention [DOI] [PubMed]
- Wechsler D, 1987. Manual for the Wechsler memory scale-revised San Antonio, TX: Psychol. Corp. [Google Scholar]
- Weiner MW, Veitch DP, Aisen PS, Beckett LA, Cairns NJ, Green RC, Harvey D, Jack CR, Jagust W, Morris JC, Petersen RC, Salazar J, Saykin AJ, Shaw LM, Toga AW, Trojanowski JQ, 2017. The Alzheimer’s Disease Neuroimaging Initiative 3: Continued innovation for clinical trial improvement. Alzheimer’s Dement 13, 561–571. 10.1016/j.jalz.2016.10.006 [DOI] [PMC free article] [PubMed] [Google Scholar]
- Weller R, Subash M, Preston S, Mazanti I, Carare R, 2008. Perivascular drainage of amyloid-b peptides from the brain and its failure in cerebral amyloid angiopathy and Alzheimer’s disease. Brain Pathol 18, 253–266. [DOI] [PMC free article] [PubMed] [Google Scholar]
- Weller RO, Subash M, Preston SD, Mazanti I, Carare RO, 2008. SYMPOSIUM: Clearance of Aβ from the Brain in Alzheimer’s Disease: Perivascular Drainage of Amyloid-β Peptides from the Brain and Its Failure in Cerebral Amyloid Angiopathy and Alzheimer’s Disease. Brain Pathol 18, 253–266. 10.1111/j.1750-3639.2008.00133.x [DOI] [PMC free article] [PubMed] [Google Scholar]
- Wiest-Daesslé N, Prima S, Coupé P, Morrissey SP, Barillot C, 2008. Rician noise removal by non-local means filtering for low signal-to-noise ratio MRI: Applications to DT-MRI, in: Lecture Notes in Computer Science (Including Subseries Lecture Notes in Artificial Intelligence and Lecture Notes in Bioinformatics) 10.1007/978-3-540-85990-1-21 [DOI] [PMC free article] [PubMed] [Google Scholar]
- Xu Z, Xiao N, Chen Y, Huang H, Marshall C, Gao J, Cai Z, Wu T, Hu G, Xiao M, 2015. Deletion of aquaporin-4 in APP/PS1 mice exacerbates brain Aβ accumulation and memory deficits. Mol. Neurodegener 10, 58. [DOI] [PMC free article] [PubMed] [Google Scholar]
- Zhang X, Ding L, Yang L, Qin W, Yuan J, Li S, Hu W, 2016. Brain Atrophy Correlates with Severe Enlarged Perivascular Spaces in Basal Ganglia among Lacunar Stroke Patients. PLoS One 11, 1–9. 10.1371/journal.pone.0149593 [DOI] [PMC free article] [PubMed] [Google Scholar]
- Zhu Y-C, Tzourio C, Soumaré A, Mazoyer B, Dufouil C, Chabriat H, 2010. Severity of dilated Virchow-Robin spaces is associated with age, blood pressure, and MRI markers of small vessel disease: a population-based study. Stroke 41, 2483–2490. [DOI] [PubMed] [Google Scholar]
- Zhu YC, Dufouil C, Soumaré A, Mazoyer B, Chabriat H, Tzourio C, 2010. High degree of dilated virchow-robin spaces on MRI is associated with increased risk of dementia. J. Alzheimer’s Dis 22, 663–672. 10.3233/JAD-2010-100378 [DOI] [PubMed] [Google Scholar]
- Zong X, Park SH, Shen D, Lin W, 2016. Visualization of perivascular spaces in the human brain at 7T: Sequence optimization and morphology characterization. Neuroimage 125, 895–902. 10.1016/j.neuroimage.2015.10.078 [DOI] [PubMed] [Google Scholar]
Associated Data
This section collects any data citations, data availability statements, or supplementary materials included in this article.