Abstract
Figurines of obese or pregnant women (“Venus figurines”) from Upper Paleolithic Europe rank among the earliest art, and endured from 38,000 to 14,000 BP, one of the most arduous climatic periods in human history. We propose that the Venus representation relates to human adaptation to climate change. During this period humans faced advancing glaciers and falling temperatures that led to nutritional stress, regional extinctions and a reduction in the population. We analyzed Paleolithic figurines of obese women to test whether the more obese figurines are from sites during the height of the glacial advance and closer to the glacial fronts. Figurines are less obese as distance from the glaciers increases. Because survival required sufficient nutrition for child-bearing women, we hypothesize that the over-nourished woman became an ideal symbol of survival and beauty during episodes of starvation and climate change in Paleolithic Europe.
Keywords: Nutrition, Obesity, Starvation, Venus Figurine, Pregnancy, Climate Change
Introduction
Obesity is rare in hunter-gatherer cultures. Nevertheless, dozens of hand-held figurines of obese women have been identified that date to Ice Age European hunter-gatherers from 38,000 to 14,000 years BP (before present) (1, 2). Several counterintuitive aspects characterize these figurines. First, they often show realistic features of obesity, despite the accepted view that obesity was rare among these peoples (Supplemental Figure 1A). Most figurines are also naked, or nearly so, which seems ironic for their proximity to the glaciers (3). The figurines also focus on the torso and sexual features, and the head is typically faceless with small arms and no feet. However, the glossing over of details in carving of the figurines was not from lack of skill, for other carvings, such as the lifelike Brassempouy (Supplemental Figure 1B) attests to rendering individualized portraits. Many figurines are in or near child-bearing years, with some appearing pregnant while others showing abdominal obesity or expanded fat in the buttocks (steatopygy), suggestive of overnutrition. A few figures of women are on the verge of puberty, and occasional figurines of middle-aged women are known. However, obesity is restricted to female figurines, as the known male figurines are elongated and slender (Supplemental Figure 1C).
That obese figurines are always women, of which some are pregnant, has led to the long-standing interpretation that these figurines represent fertility or beauty (hence the general adoption of the term ‘Venus’ figurines) (2). Yet it has been difficult to test this hypothesis. Here we suggest that the meaning of the figurines can be best explained by understanding the climatic and environmental changes that were occurring during that time and how these factors affected their nutrition and survival. Specifically, we hypothesize that the figurines were meant to enhance survival of the hunting and gathering band. Especially during pregnancy, obesity helped assure survival during episodes of severe food shortage. To provide background for this hypothesis, we briefly discuss climate change in Paleolithic Europe and how it affected nutrition among early modern humans.
Climatic Change in Upper Paleolithic Europe
Early modern humans, known as the Aurignacians, entered Europe around 48,000 thousand years ago during a brief warming interval following the Glacial Maximum (4). They arrived from the East and migrated up the Danube River just below the mile-high glaciers that formed a massif across northern Europe (5). During this warm interglacial interlude, newly exposed plains supported mammals like mammoth, horse and reindeer that were harvested by bone-tipped spear hunting technology. During the summer and fall, fish, berries, nuts and edible plants supplemented a diet otherwise heavy in meat.
Initially the environment was mild enough for highly mobile hunter-gatherer bands of 20 to 40 individuals to spread throughout Europe, reaching Italy and southern Spain by 43,000 BP (5). Then, around 38,000 BP the temperatures fell as the ice sheets once again advanced, placing pressure on the Aurignacians to devise new subsistence strategies. Some sought refuge in Italy and southwestern Europe (France and Spain) while the genetically distinct Gravettians may have displaced remaining Aurignacian bands in Central Europe around 36,000 BP (6, 7).
The Gravettians had better-quality ‘backed’ stone projectile points, which provided a technological edge in increasingly harsher environs. They penetrated even farther north to regions above 50° North Latitude, where they would travel seasonally up to 800 km following herds of horse and reindeer (5).
Yet, temperatures fell a significant 4–8 degrees Celsius beginning ca. 28,000 BP, which culminated in the Last Glacial Maximum at 22,000 BP (5). Temperatures during the coldest months may have reached minus 10–15 degrees Celsius (8). Less rainfall fell and the plant growing season shortened (5). In these extreme conditions, some human populations near the glaciers succumbed, whereas others relocated to sheltered, forested valleys south (9). As large game became overhunted, survival relied on smaller animals, such as hare, rabbits, marmots and birds (10).
The shortage of food during the harsher times of the year dramatically reduced population size (9, 11, 12). One estimate suggests that the population fell to a nadir between 29,000 and 25,000 BP, when the population declined to one-third that of the prior period (33,000–29,000 BP)(9). Reflecting nutritional intake, stature fell an average of 3 to 4 inches by 22,000 BP (5, 13). Also indicating nutritional stress, dental striations (enamel hypoplasia), changed from being relatively infrequent during the early Upper Paleolithic (16%), to being comparatively commonplace (29%) by 22,000 BP (5).
It was during the ebb and flow over 24,000 years of the last glaciation (38 to 14k BP) that most figurines of obese women were made. We therefore tested the hypothesis that the severity of obesity might be greatest during the periods of nutritional stress and advancing glaciers based on empirical measurements of the figurines as they related to location relative to the glaciers.
Obesity in Female Figurines Correlates with Climate Change
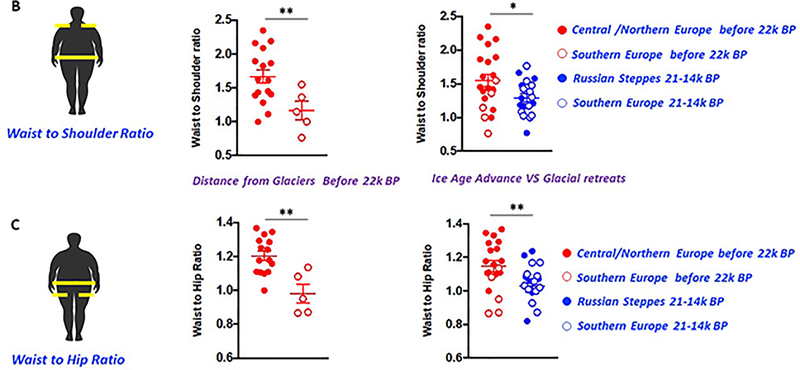
We hypothesized that the degree of obesity of the female figurines related to changes in climate and proximity to the glaciers by systematically measuring the waist-hip and waist-shoulder ratios of all known female ‘Venus’ figurines (https://www.donsmaps.com/venus.html). We excluded figurines made from material that limited their dimensions (for example, engravings on antlers), or were unfinished or fragmentary. Measurements of 3–4 images per figurine were analyzed using the ImageJ software (www.imagej.net), pooled, averaged and ratios calculated. To ensure unbiased determination of data, images were coded randomly and measurements were made by an independent person unfamiliar with the story. Once all measurements were performed, data was decodified and analyzed. Data were presented as the means ± SEM using Prism and statistical analysis performed by unpaired 2-tail t test.
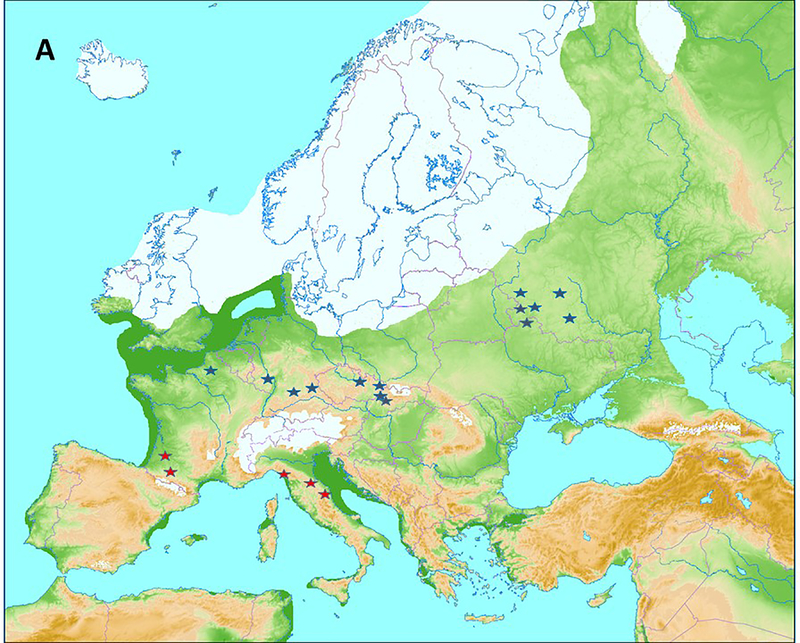
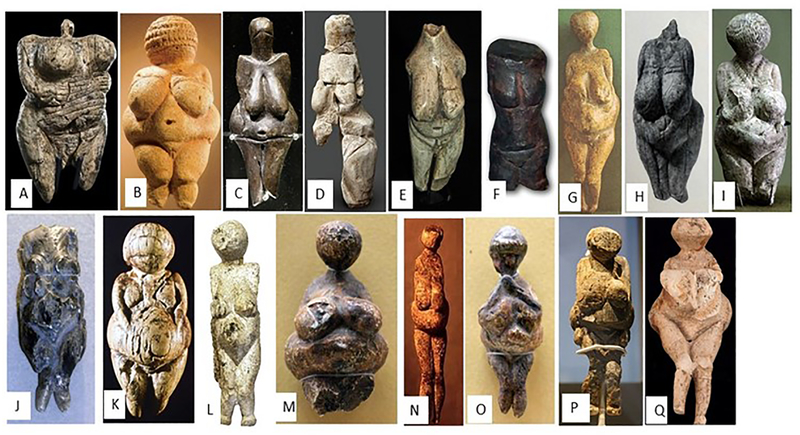
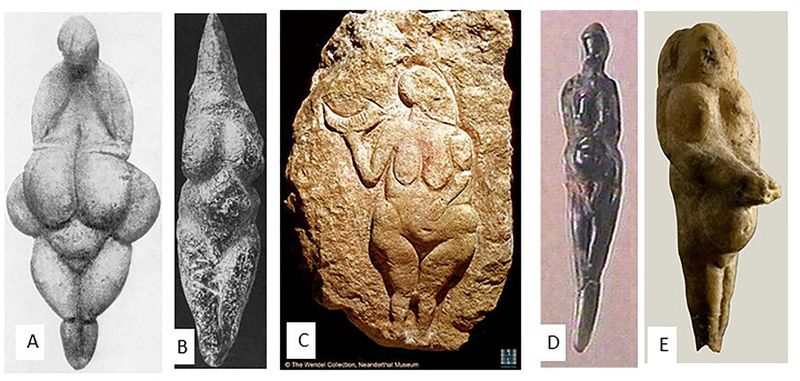
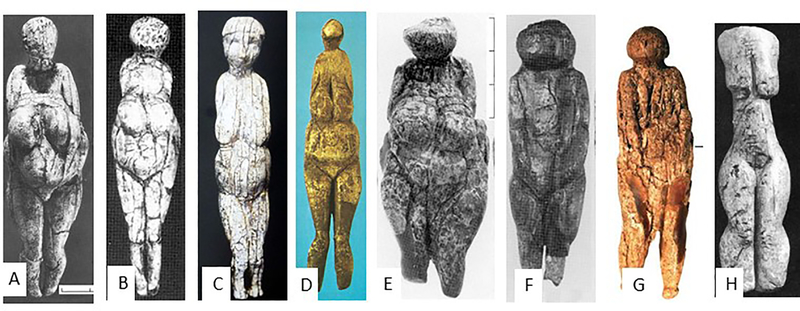
Figurines were grouped into four clusters based on whether they were made at the time when the glaciers were advancing (38K to 22K BP) or retreating (21K to 14K BP) or whether they were proximate to the glaciers (Northern Europe and along the rivers in the Russian steppes flowing into the Black Sea) or distant from the glaciers (Southern Europe, including Iberia, southern France, and Italy). Figure 1A shows a map of the sites of known Venuses in Europe and Russia during the period when the glaciers were advancing. Photographs of the figurines with approximate age and site of location is shown in Figure 2 with examples of measurement in Supplemental Figure 2.
Figure 1. Venus Figurine Locations Related to the Glaciers.
A. The map shows the Weichselian advance of the Last Glacial Maximum (circa 22k BP, from Wikipedia, Creative Commons, commons.wikimediaorg/wiki/File:Weichsel-Würm-Glaciation.png). Shown are sites (stars) where Venuses were found (38k-22k). Close to the glacier are the clusters of Venuses including Northern Europe and Russia (blue stars) and southern Europe (Italy, France and Spain) (red stars). B. Waist to shoulder ratio in figurines during the ice age (<22k BP; red symbols) and after the glacial era (21–14k BP; blue symbols). Relative areas to the glaciers are illustrated with solid (close) or clear (distant) to the glaciers. C. Waist to hip ratio in figurines during the ice age (<22k BP; red symbols) and after the glacial era (21–14k BP; blue symbols). Relative areas to the glaciers are depicted with solid (close) or clear (distant) to the glaciers. Data presented is the average ratio of all images analyzed for each figurine. *P < 0.05, **P < 0.01
Figure 2. Venus Figurines from Europe and the Steppes of Russia (38 to 14k BP).
Photos are provided with permission from Don Hitchcock at https://www.donsmaps.com/venus.html.
A. Venus Figurines from Northern France, Central Europe and Russia During the Ice Age (22k-38k BP). A. Hohle Fels, Germany, 38K; B. Willendorf, Germany 28K; C. Dolne Vestonice, Czech, 26K; D. Renancourt, France 23K; E. Maravany, Slovakia 23K, F. Petrokovice, Czech, 23K; G. Kostenki no.3, Russia, 25K; H. Kostenki no.4, Russia, 25K; I. Kostenki, Russia, 25K; J. Kostenki, no. 2, Russia, 25K; K. Kostenki, Russia, 25K; L. Kostenki, Russia, 25K; M. Gagarino, Russia 22K; N. Tall Gagarino, Russia 22K; O. Prayer Gagarino, Russia 22K; P. Gagarino, Russia, 22K; Q. Kotylevo, Russia, 23K. Photos are from (https://www.donsmaps.com/venus.html).
B Venus Figurines from Southern Europe During the Ice Age (38–22K BP). A, Lespuge Venus, France, 25K; B, Savigagno Venus, Italy, 24–23 BP; C, Laussal Venus, France, 24k; D, Polichinelle Venus, Grimaldi, Italy 24K; E. Frassasi Venus, Italy, 24K (28–20k). Photos are from (https://www.donsmaps.com/venus.html).
C Venus Figurines from Russia after Ice Age (21K BP or Later). A-F, Venuses from Avdeevo, Russia (near Kursk), 20K BP; G. Zaraisk, Russia, 19K; H. Yeliseevichi, Russia, 15K. Photos are from (https://www.donsmaps.com/venus.html).
D Venus Figurines from Southern Europe (after Ice Age, 21K BP or later). A, Abri Pataud, France 21K; B Red Ochre Venus, Grimaldi Italy, 19k; C, Perforated Neck Venus, Grimaldi, Italy, 17k BP; D, Monpazier Venus, France, 21k (surface find); E Abrachiale Venus, Grimaldi, Italy 20–19K (stylistic dating); F. Macomer Venus, Sardinia, Italy, 15k; G. Parabita Venus, Italy, 17k; H. Parabita Venus, Italy, 17k; I Menton Venus, Grimaldi, Italy, 20K (21–18K); J, Losange Venus, Grimaldi, Italy 20K (21–19K), K Goiter Venus, Grimaldi, Italy, 16k (17–14K). Photos are from (https://www.donsmaps.com/venus.html).
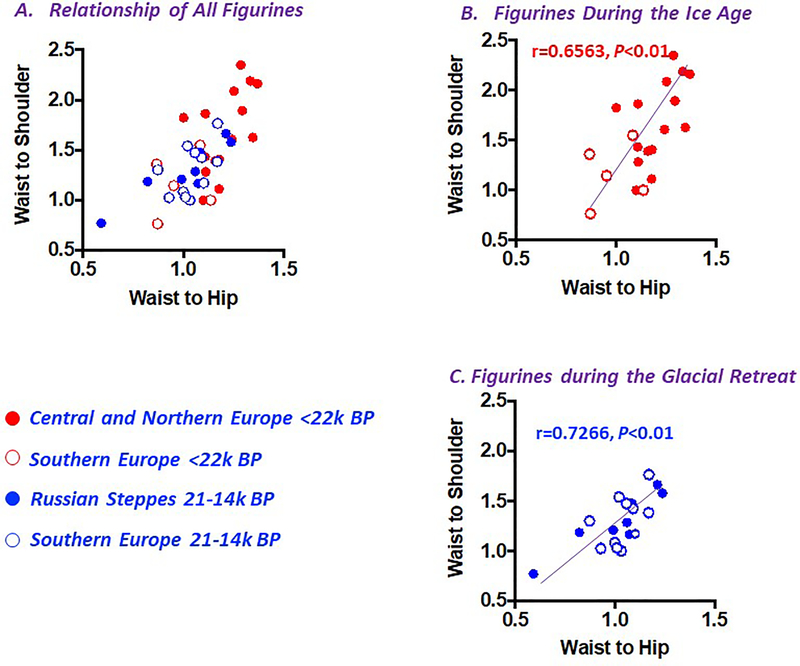
During the period of advancing glaciers, the figurines located closer to the glaciers (Northern/Central Europe and Russia) had both greater waist-shoulder (Figure 1B) and waist hip (Figure 1C) ratios than those from Southern Europe (Supplemental Table 1). Likewise, the female figurines dated during the period of advancing glaciers showed greater waist-shoulder and waist-hip ratios than those after the Last Glacial Maximum, when the glaciers retreated. There was also a positive correlation between the waist-shoulder and waist hip ratios in the individual figurines (Figure 3).
Figure 3.
The Relationship of Waist-Shoulder and Waist-Hip Ratios Among the Venuses.
Two New ‘Venus’ Figurines
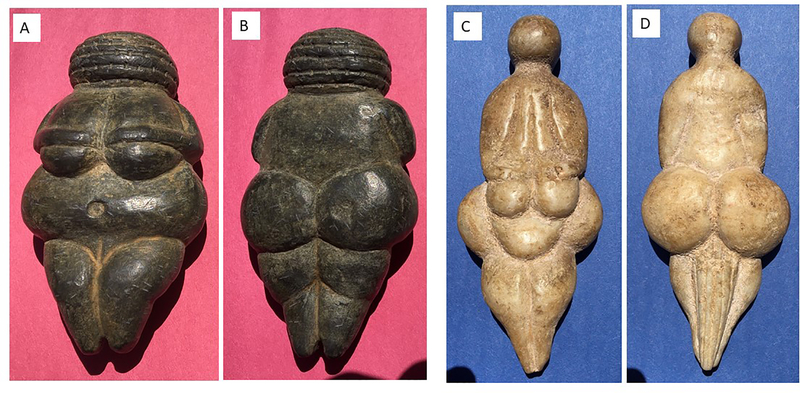
We photographed and measured two additional and heretofore unknown ‘Venus’ figurines from private collections. Authenticity of the figurines has been confirmed by microscopic analysis documenting mineralogical surface deposition accumulated over some thirty millennia. We include these as part of the consultable record, and especially since many of the known figurines originally came from private collections made in the late nineteenth and early twentieth centuries prior to systematic archeology.
The first figurine (Venus F-1, black basalt, 10 cm length) is from Central Europe and has similar features with the Venus of Willendorf: the figure is faceless and wears a snood (hair covering), with small arms crossing over the breasts and significant abdominal obesity and is likely from the same time period (Figure 4A). The second figurine (Venus F-2, limestone with calcified cave deposits still evident on the recessed portions, 15 cms, approximately 25k BP) resembles the LesPugue Venus with rolls of fat shown (Figure 2B), a loin cloth on the back, and was found close to the glaciers of the Pyrenees Mountains during that time.
Figure 4.
The Black Venus (F-1), estimated at slightly more than 30 k BP, and the LesPugue-like Venus (F-2), estimated at about 25 k BP.
Discussion
‘Venus’ figurines are one of the most significant and earliest artistic representations of humans. With their accentuated sexual features, they are usually interpreted as symbols of fertility and beauty–and more imaginatively as goddesses. Their facial features were deemphasized to omit individual characteristics, so that they represent a generic template. Most figurines were meant to be handheld, spanning 6 to 16 cm in length, and were made from mammoth ivory, horn, stone, or rarely clay. Some were also threaded and worn as amulets. The rich surface polish (patina) of the ivory and lithic figurines suggest they had been handled as heirlooms over many generations. Here we propose they conveyed ideals in body size for young women, and especially for those who lived in proximity to glaciers.
To address this hypothesis, we performed systematic measurements on all published Venuses from Upper Paleolithic Europe. We evaluated obesity as a culturally normative practice to counter nutritional stress for women engaged in child-bearing. The photos and measurements (Fig 1 and 2) support a relationship in which the degree of obesity is greatest for figurines closest to the glacial front compared to those farthest away. Specifically, the body size proportions were highest when the glaciers were advancing, whereas obesity decreased when the climate warmed and glaciers retreated. Significantly, the end of the Last Glacial Maximum 22k BP marks the climatic shift as the bodies of the figurines became leaner, especially in southern Europe. Thus, as peoples experienced nutritional stress they carved fatter figurines, and depicted leaner figurines when securing food became more predictable.
These comparisons suggest that starvation and nutritional stress directly related to how the figurines were portrayed. Conveying how nutritional stress could be mitigated through buildup of body fat may also have carried spiritual or magical meaning. Women entering the child-bearing years would have handled the figurines to increase weight gain necessary for reproductive success. The figurine would represent a desired likeness of the woman in which the image had power to bring about a healthier mother and child, spanning conception, a precarious pregnancy, childbirth, and nursing. Increased fat would provide both a source of energy during gestation through the weaning of a baby, and as well as much needed insulation.
Increased body fat likely provided an adaptive strategy in the frigid weather, especially between latitudes 49–52 degrees along the glacial front, which was the site of the northernmost settlements of early humans during the Ice Age (running roughly through Northern Europe). Promoting obesity helped to ensure that a small band would survive into the next generation. Indeed, bringing a child to the point of weaning could require enduring two arctic-like winters per child. Women require more fat than men, with approximately 17% body fat to support menstruation, and 22% body fat to support ideal gestation. In the absence of food, an average sized woman would require 16 kg of fat to provide the calories needed to carry a baby to birth and breastfeed for upwards of three months (14). Low fat stores not only can result in amenorrhea, but can also lead to fetal death if a mother loses the ability to breast feed (14).
Limitations to our study include the fact that the measurements were made from photographs and we were not able to include circumferential measurements. Moreover, the exact age each figurine was not always known and in some cases were based on associated finds and /or stylistic attributes. It is also possible that that the shift to leaner figurines could have represented a shift in location to the south, and especially in Spain, cultural changes, ethnic subgroups or other changes unrelated to climatic stress.
In summary, environmental and nutritional stress of the Upper Paleolithic period correlates with the appearance of figurines of obese women among hunter-gatherers in Europe, as they adapted to environmental stressors that reduced population and, stature, and in some regions, resulted in outright extinction. During this period, the figurines emerged as an ideological tool to help improve fertility and survival of the mother and newborns. The aesthetics of art thus had a significant function in emphasizing health and survival to accommodate increasingly austere climatic conditions.
Supplementary Material
What is known about the Subject
Venus Figurines are the oldest art sculptures of humans known and tend to be of women who are obese or pregnant
These Figurines tend to show realistic obesity despite the fact that obesity was thought to be rare in this hunter-gatherer population
Current thinking is that they may have represented beauty or fertility figures but there is little supporting evidence
What is new from this Perspective
No approach has evaluated the relationship of the figurines of obese women with climatic and environmental changes that were occurring during that time
The time period associated with the Upper Paleolithic figurines correlates with advancing glaciers, falling temperatures, nutritional stress and starvation
Here we show that the Figurines show greater obesity during the time of the glacier advance and less during the glacier retreat, and that the figurines of women closest to the glaciers show the greatest obesity
These studies support the hypothesis that ‘Venus’ Figurines were survival symbols since obesity would have helped women carry pregnancies and breast feed babies during periods of severe food shortage
Clinical Practices
These findings give insight into the history of obesity in human culture but not any clinical practice points
Acknowledgements
Supported in part by NIH 1RO1DK108408.
Footnotes
Competing Interests.
The authors declare no competing interests.
References
- 1.Bray GA. History of Obesity In: Williams G, Frühbeck G (eds). Obesity: Science to Practice. John Wiley and Sons: London, 2009, p 604 pp. [Google Scholar]
- 2.Dixson AF, Dixson BJ. Venus Figurines of the European Paleolithic: Symbols of Fertility or Attractiveness? Journal of Anthropology 2011;2011: 1–11. [Google Scholar]
- 3.Soffer O, Adovasio J,M,, Hyland DC. The “Venus Figurines”. Current Anthropology 2000;41: 511–536. [Google Scholar]
- 4.Cortes-Sanchez M, Jimenez-Espejo FJ, Simon-Vallejo MD, Stringer C, Lozano Francisco MC, Garcia-Alix A, et al. An early Aurignacian arrival in southwestern Europe. Nat Ecol Evol 2019;3: 207–212. [DOI] [PubMed] [Google Scholar]
- 5.Holt BM, Formicola V. Hunters of the Ice Age: The biology of Upper Paleolithic people. Am J Phys Anthropol 2008;Suppl 47: 70–99. [DOI] [PubMed] [Google Scholar]
- 6.Bicho N, Cascalheira J, Goncalves C. Early Upper Paleolithic colonization across Europe: Time and mode of the Gravettian diffusion. PLoS One 2017;12: e0178506. [DOI] [PMC free article] [PubMed] [Google Scholar]
- 7.Fu Q, Posth C, Hajdinjak M, Petr M, Mallick S, Fernandes D, et al. The genetic history of Ice Age Europe. Nature 2016;534: 200–205. [DOI] [PMC free article] [PubMed] [Google Scholar]
- 8.Davies W, Valdes P, Ross C, Andel T. The Human Presence in Europe during the Last Glacial Period III: Site Clusters, Regional Climates and Resource Attractions; 2003, pp 191–220. [Google Scholar]
- 9.Maier A Population and Settlement Dynamics from the Gravettian to the Magdalenian. Mitteilungen der Gesellschaft für Urgeschichte 2017;26 83–101. [Google Scholar]
- 10.Stiner MC, Munro ND, Surovell TA, Tchernov E, Bar-Yosef O. Paleolithic population growth pulses evidenced by small animal exploitation. Science 1999;283: 190–194. [DOI] [PubMed] [Google Scholar]
- 11.Gamble C, Davies W, Pettitt P, Richards M. Climate change and evolving human diversity in Europe during the last glacial. Philos Trans R Soc Lond B Biol Sci 2004;359: 243–253; discussion 253–244. [DOI] [PMC free article] [PubMed] [Google Scholar]
- 12.Maier A, Zimmermann A. Populations headed south? The Gravettian from a palaeodemographic point of view. Antiquity 2017;91: 573–588. [Google Scholar]
- 13.Formicola V, Giannecchini M. Evolutionary trends of stature in upper Paleolithic and Mesolithic Europe. J Hum Evol 1999;36: 319–333. [DOI] [PubMed] [Google Scholar]
- 14.Frisch RE. Critical fatness hypothesis. Am J Physiol 1997;273: E231–232. [DOI] [PubMed] [Google Scholar]
Associated Data
This section collects any data citations, data availability statements, or supplementary materials included in this article.


