
Figure 2:
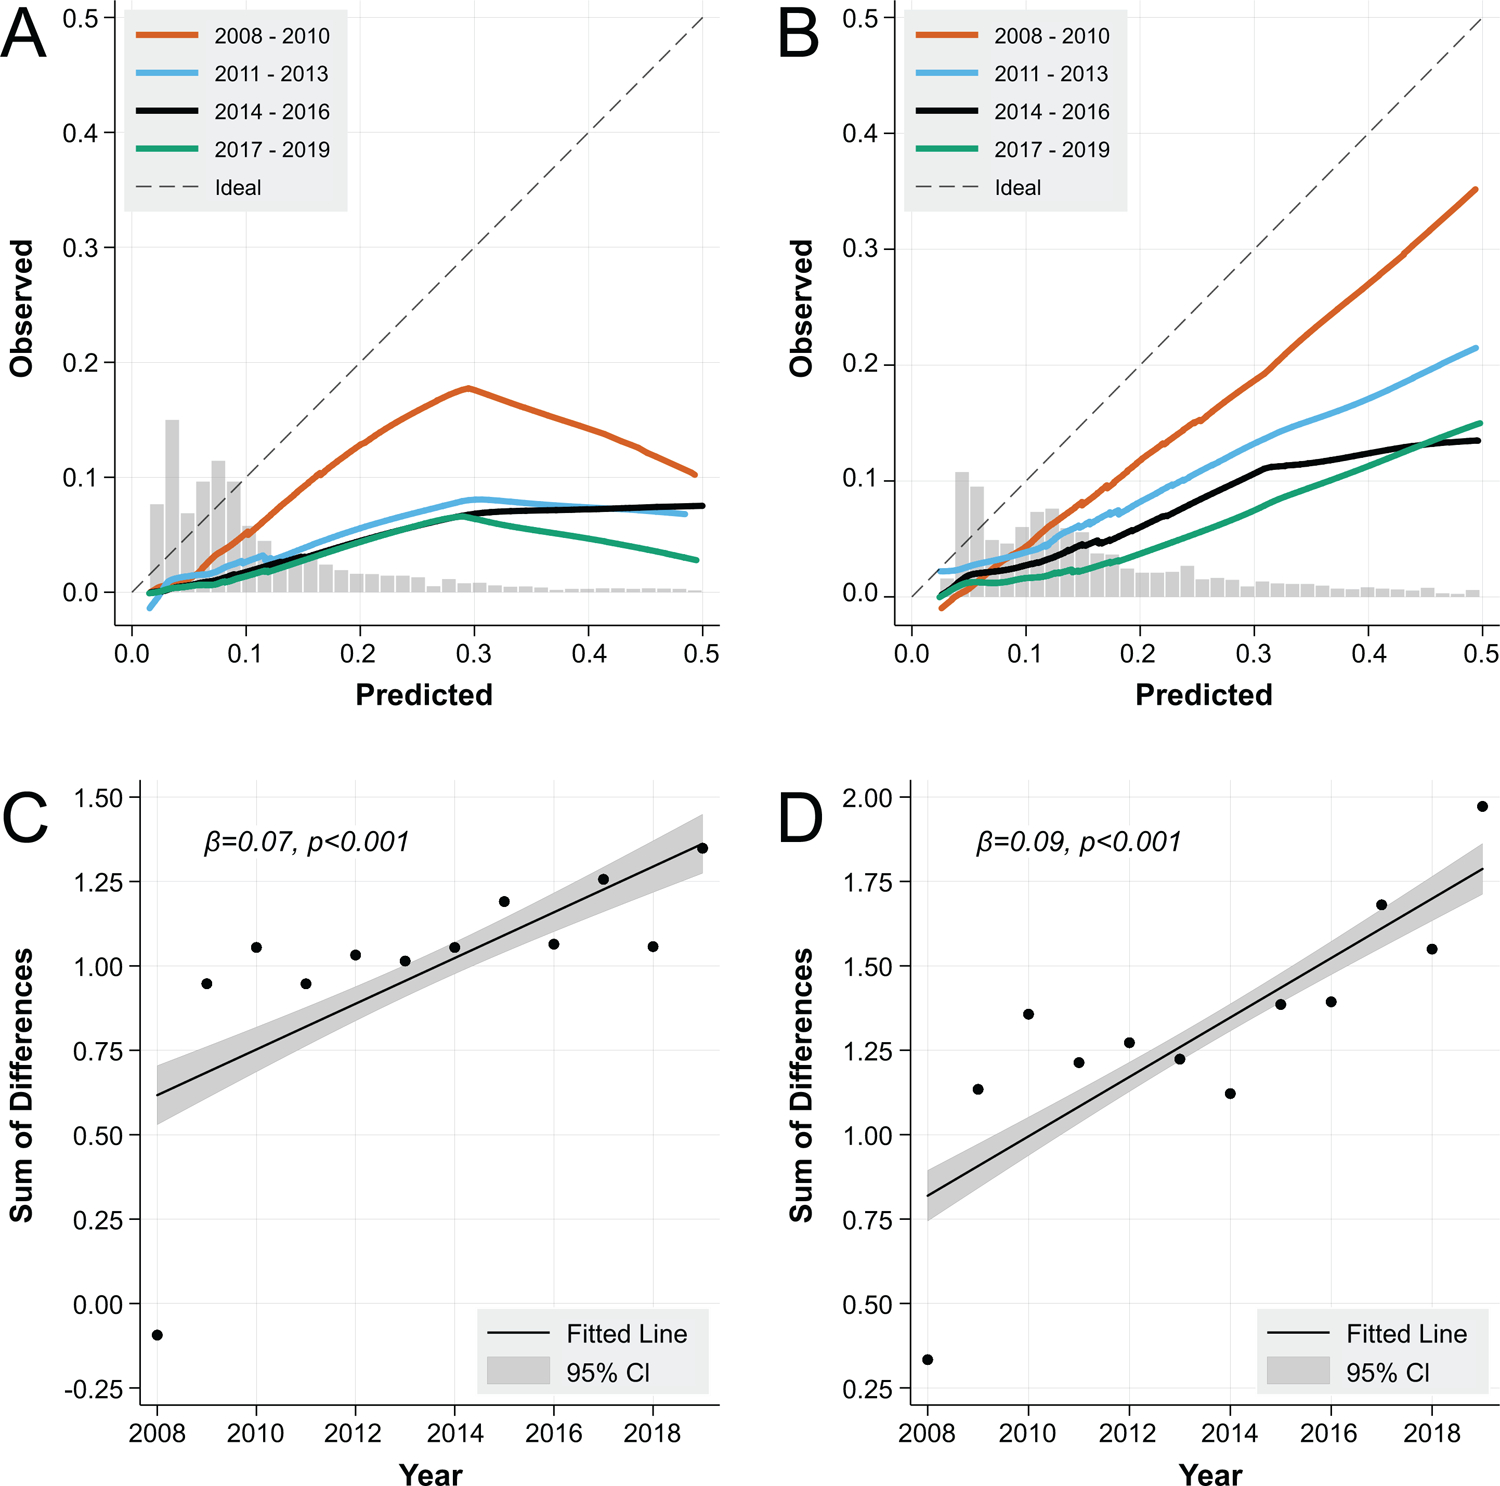
Post-operative Mortality Calibration of the Mayo Score over Time at 30 Days (A) and 90 Days (B), and Sum of Differences between Predicted and Observed Mortality over Time at 30 Days (C) and 90 Days (D)
Caption: * Overlaid histograms indicate the distribution of contributing data points