Abstract
Olsalazine (Olsa) is a broad-spectrum anti-cancer agent acting as a DNA methylation inhibitor. When conjugated to 2-cyano-6-aminobenzothiazole and a peptide substrate specific for the tumor-overexpressed enzyme furin, it can self-assemble into nanoparticles that can be detected by chemical exchange saturation transfer magnetic resonance imaging (CEST MRI). We report here that these nano-assemblies can also be detected with high specificity in furin-overexpressing tumor cells by Raman spectroscopy with a distinct scattering signature and demonstrate the utility of this sensing mechanism in vitro and in vivo. Our findings suggest that Raman spectroscopy could be used for high-resolution image-guided surgery to precisely delineate tumor margins during and after resection in real-time as well as to determine microscopic tumor invasion and multifocal locoregional tumor spread, which are currently impossible to visualize with available imaging technologies including CEST MRI.
Keywords: Raman spectroscopy, furin, self-assembly, nanoparticles, olsalazine
Graphical Abstract

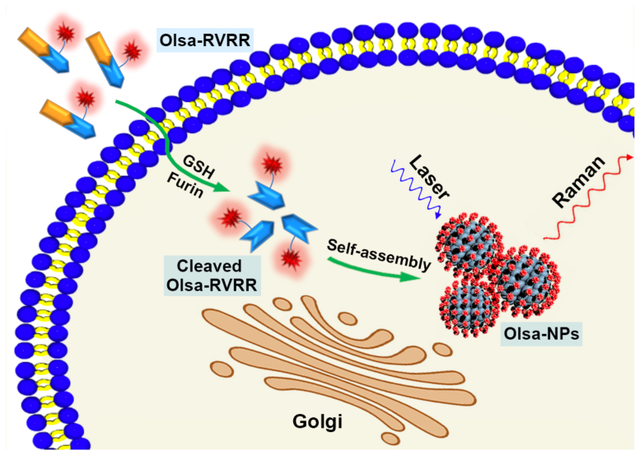
Based on a furin-mediated CBT-Cys click condensation reaction followed by intracellular nanoparticle self-assembly, we report the development of a new furin-specific Raman reporter Olsa-RVRR, and demonstrate its in vitro and in vivo utility in tumor detection.
Raman spectroscopy has received considerable attention for in vivo imaging of biochemical constituents present in cells and tissues without jeopardizing the internal structure and altering their function.[1] The innate advantages of label-free imaging, minimum sample preparation, non-invasiveness and higher spatial resolution when compared to magnetic resonance imaging (MRI) and computed tomography (CT) have led to its use in complex situations such as surgical margin assessment and brain surgery requiring real-time feedback.[2] We and others have used Raman spectroscopy scattering of photons upon interaction with molecular vibrations to obtain quantitative spatiomolecular maps from live, intact biological samples within a few minutes.[3] By virtue of its molecular specificity and innate immunity to photobleaching, Raman spectroscopy offers a promising route for automated recognition of tumor onset, progression and response to therapy.[4] Despite these unique features, its widespread use for objective cancer detection has been limited by the spectral congestion among overlapping features emanating from the myriad constituents of the cellular and tissue matrices. Hence, development of targeted Raman scattering agents for sensing of biomarkers characteristic of tumor progression is highly desired.
Many approaches for Raman-based targeted molecular analysis have been reported, of which surface-enhanced Raman spectroscopy (SERS) remains the most widely used. In comparison to spontaneous Raman spectroscopy, SERS requires the presence of additional metal nanostructures as an integral component, as the signal enhancement principally arises from the proximity of the Raman reporter to the intensely localized plasmonic field of the metallic nanoparticles.[5] Yet, this enhancement comes at a significant cost as introduction of metallic nanoparticles may perturb the native chemical and mechanical intracellular environment while toxicity and clearance issues remain major concerns for in vivo applications. Resonance Raman spectroscopy has also been employed to enhance the detection sensitivity,[6] but its in vivo use is limited by the low penetration depth due to the need of ultraviolet (UV) lasers. In addition, efficient probe design requires the incident laser frequency to match the electronic transition state, thereby restricting the design possibilities.[7]
Recently, by employing a biocompatible condensation reaction between 2-cyano-6-aminobenzothiazole (CBT) and L-cysteine (L-Cys), we reported a “smart” strategy of intracellular self-assembly of olsalazine nanoparticles (Olsa-NPs) for enhancing both the chemical exchange saturation transfer (CEST) MRI signal and anti-tumor therapeutic effects in vivo.[8] While such intracellular self-assembly of nanoparticles as reporters has also been investigated for fluorescence imaging[9], MRI[10], positron emission tomography (PET)[11], and bioluminescence imaging[12], the potential for organizing molecules into supramolecular structures to tailor Raman signals has been surprisingly underappreciated. Here, by leveraging the in situ click condensation reaction, we propose a new class of Raman reporters that exhibit distinct intracellular signatures in furin-overexpressing cells, and demonstrate its use for targeted detection of tumor cells in vitro and in a subcutaneous xenograft tumor model. As the spectral fingerprint is unique to this Raman reporter, it permits unambiguous tumor detection in comparison to other optical methods, such as fluorescence-based imaging, where tissue autofluorescence may lead to false-positive signals. The Olsa-based nanoparticles are not prone to removal by the reticuloendothelial system (RES) and maintain their sensitivity due to absence of any photodegradation. In addition to delineation of primary tumors, our work may enable detection of microscopic locoregional tumor deposits in the future, which are nearly impossible to visualize with extant imaging technologies. Specifically, our current findings may pave the way for dual imaging modality agents that combine the sensitivity of CEST MRI with the molecular specificity and resolution of Raman spectroscopy that would be useful in pre- and intra-operative realms, respectively.
Intracellular self-assembling approaches typically harness small molecules to translocate the cell membrane and prepare NPs in situ that offer unique signals and longer retention time. Since signal enhancement/differentiation can also occur through uncontrolled self-assembly that would result in unpredictable spectral variations, using specific dysregulated tumor biomarkers as a forum to direct the assembly of nanomaterial building blocks is critical to accurate and reproducible tumor imaging. We present here such a paradigm for designing Raman probes upon furin-mediated intracellular self-assembly. Furin, a well-characterized proprotein convertase, plays an important role in many diseases and its upregulation in cancer cells is linked to tumor metastasis. It has been reported that furin is highly linked to a large spectrum of cancers[13] including head and neck squamous cell carcinoma[14], breast cancer[15], ovarian cancer[16], glioblastoma[17], and colon cancer.[18]
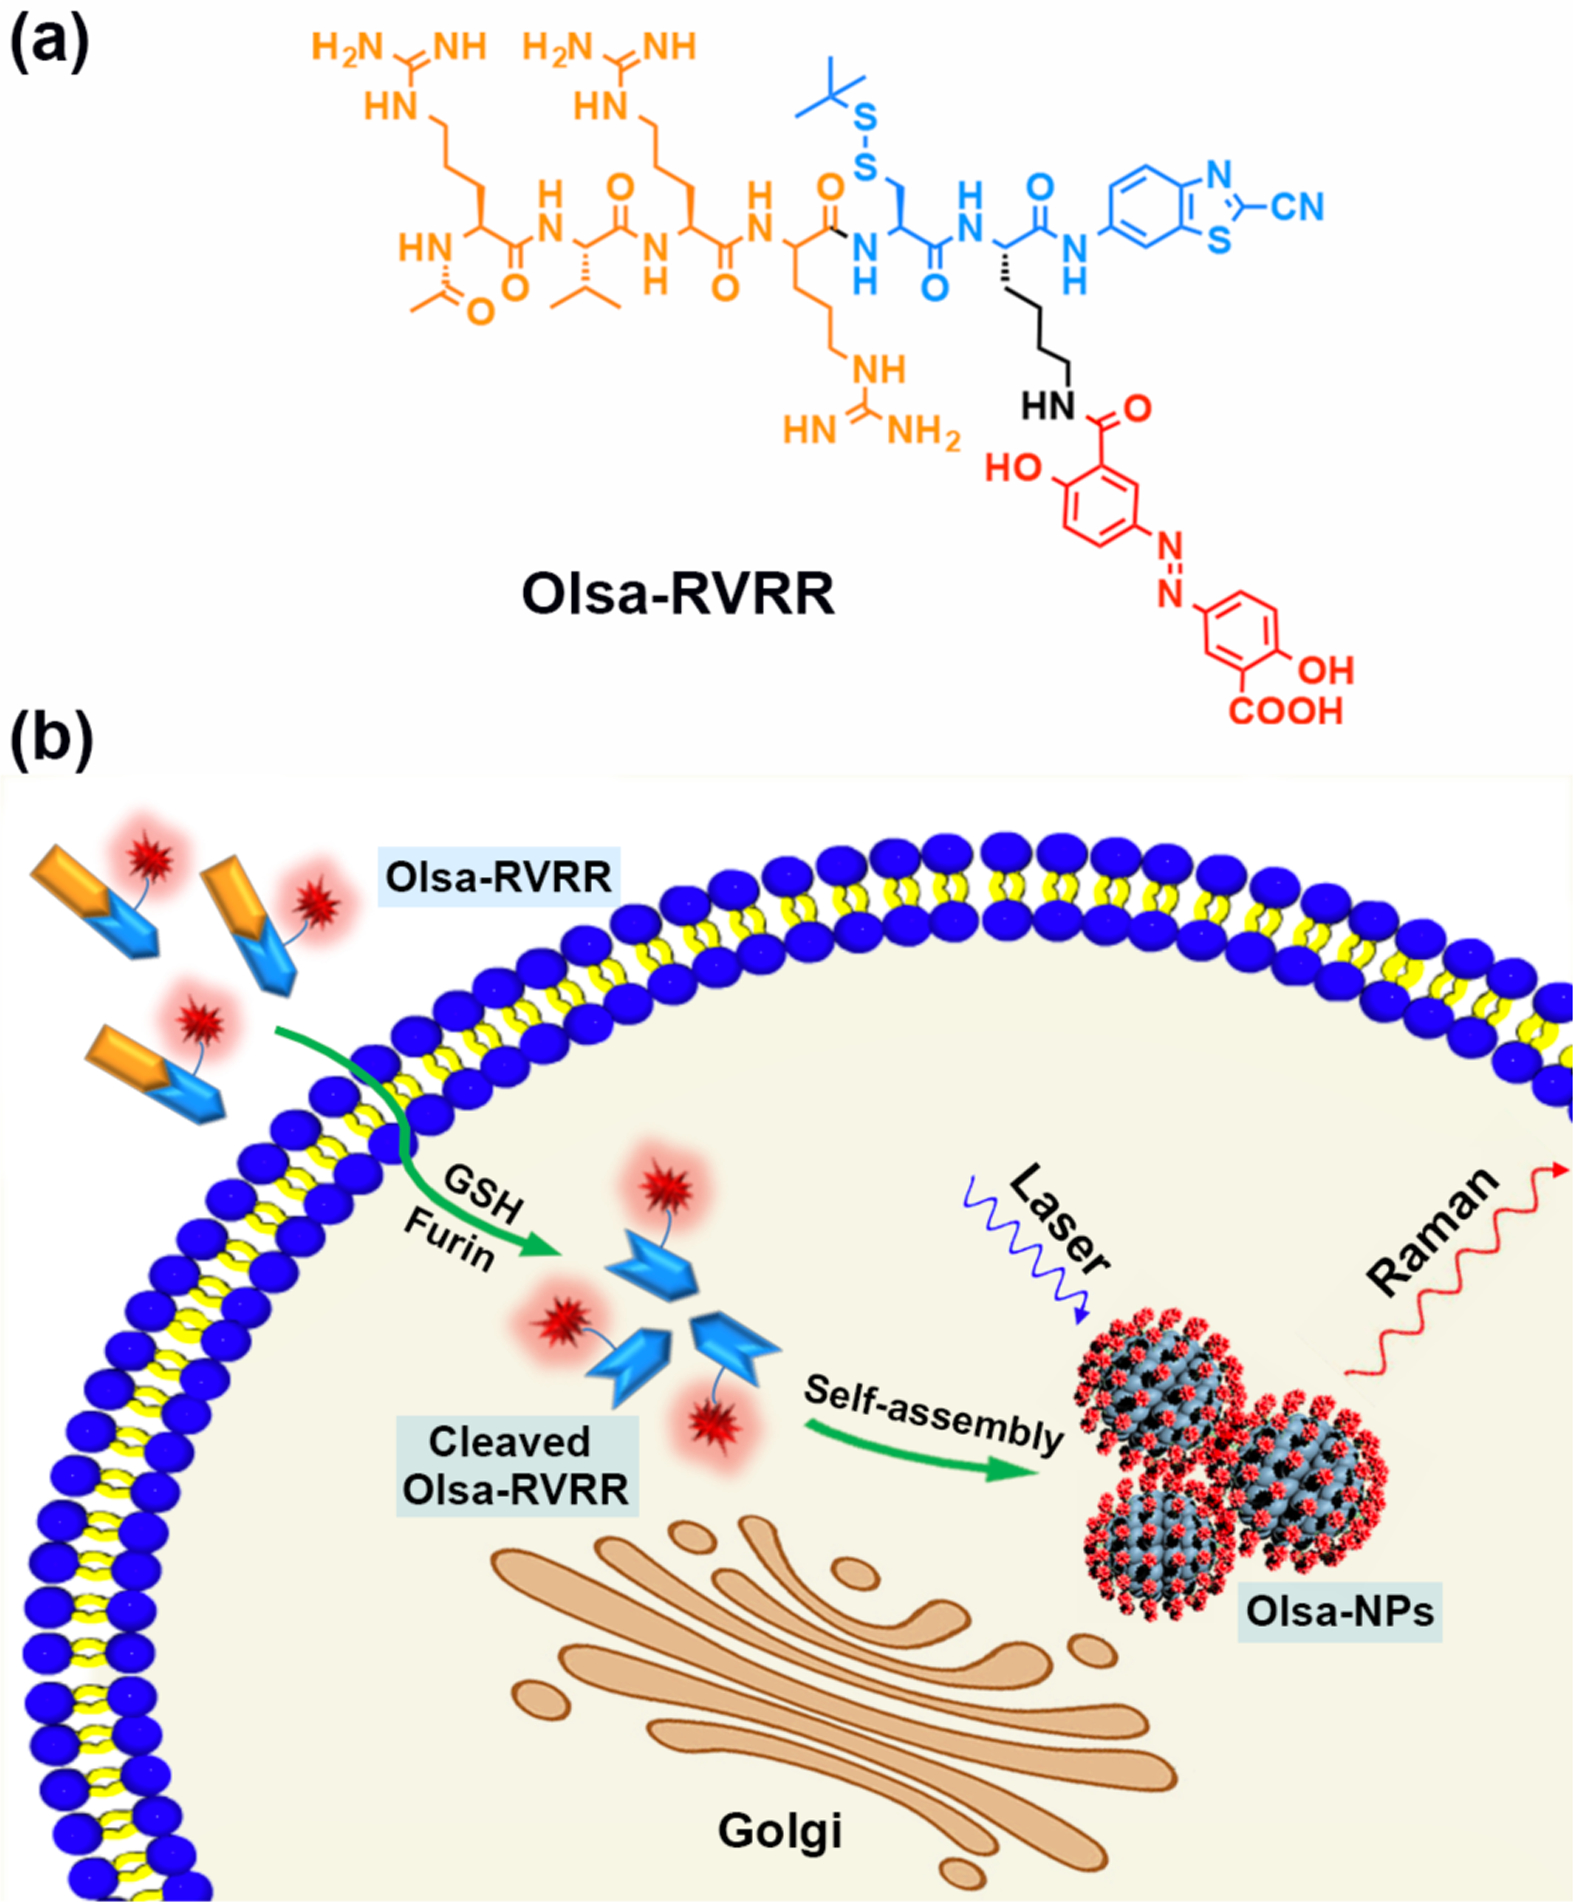
Figure 1 shows a conceptual outline of self-assembly of Olsa-NPs using the furin-specific substrate RVRR. The inclusion of the positively charged peptide RVRR facilitates penetration of the agent across the membrane, in addition to offering a substrate for cleavage by furin. Upon penetration of single Olsa-RVRR molecules into furin-overexpressing tumor cells, the disulfide bond is reduced by glutathione (GSH) and the RVRR peptide substrate is cleaved by furin. A biocompatible click condensation reaction[9a] occurs then between the exposed cysteine (Cys) and 2-cyanobenzothiazole (CBT) group resulting in the formation of hydrophobic oligomers (mostly dimers), which subsequently self-assemble into Olsa-NPs. This process not only enhances the intracellular concentration of Olsa, but also prolongs its retention time leading to a strong Raman signal that is markedly absent in cells lacking furin expression. To the best of our knowledge, this represents the first realization of an in situ self-assembled Raman probe devoid of a plasmonic NP.
Figure 1.

a) Chemical structure of the Raman probe Olsa-RVRR. It contains a RVRR substrate for cell membrane penetration and furin cleavage (orange), a latent cysteine (Cys) motif and 2-cyano-benzothiazole (CBT) structure for CBT-Cys click condensation reaction (blue), and an olsalazine (red) conjugated lysine (Lys) motif. b) Schematic illustration of intracellular furin-mediated self-assembly of Olsa-NPs.
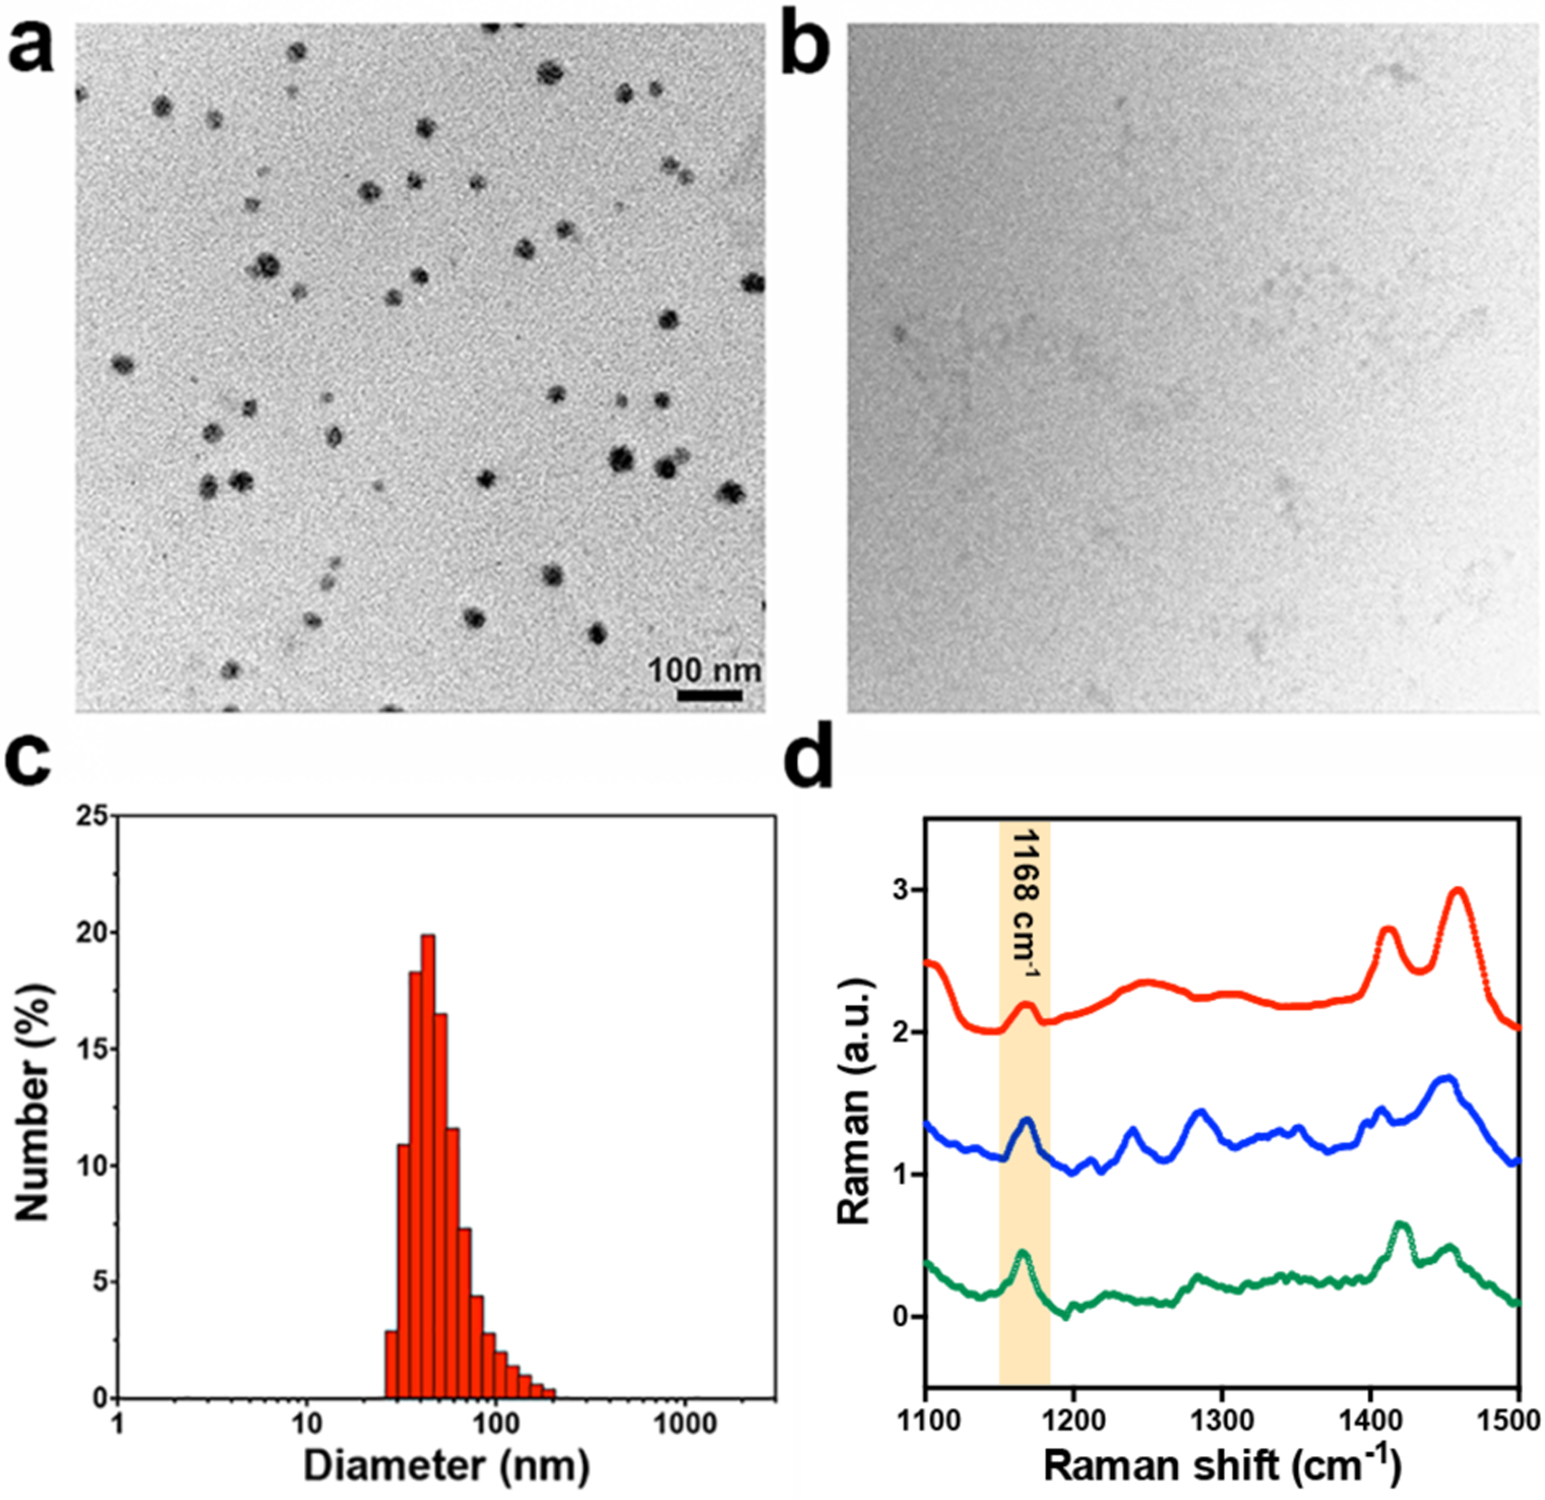
After synthesizing and characterizing Olsa-RVRR (Figure S1), we first examined the generation of Olsa-NPs after treatment of Olsa-RVRR with furin and GSH. After co-incubation of 25 μM Olsa-RVRR with 250 μM GSH and 0.5 nmol U−1 furin for 12 h at 37 °C, transmission electron microscopy (TEM) and dynamic light scattering (DLS) were performed. TEM demonstrated that Olsa-NPs had an average diameter of 24.53±4.59 nm (Figure 2a). In contrast, the Olsa-RVRR solution without added furin did not produce any nanoaggregates (Figure 2b). DLS measurements revealed an average hydrodynamic diameter of 52.21±11.74 nm underscoring the prevalence of dimers and a smaller content of other oligomers (Figure 2c). Two control compounds CTR1 and CTR2 were also synthesized to confirm that the self-assembly Olsa-NPs was indeed specific to furin. CTR1 is an isomer of Olsa-RVRR, but with the scrambled peptide sequence RKRCRV instead of the furin substrate RVRR. Therefore, it cannot be cleaved by furin to initiate the condensation reaction between CBT and Cys (Figure S2). CTR2 is an Olsa-conjugated KCRVRR sequence that is short of the CBT motif (Figure S3). Thus, neither CTR1 nor CTR2 can generate Olsa-NPs after the addition of GSH and furin, which was confirmed by TEM measurements (Figure S4).
Figure 2.

TEM image of 25 μM Olsa-RVRR after a) and before b) co-incubation of 250 μM GSH and 0.5 nmol U−1 furin for 12 h. c) DLS size distribution of Olsa-NPs after incubation of 25 μM Olsa-RVRR + 250 μM GSH + 0.5 nmol U−1 furin for 12 h. d) Raman spectra of 100 μM Olsalazine (green), 100 μM Olsa-RVRR (blue) and Olsa-NPs (red, obtained by the incubation of 100 μM Olsa-RVRR + 1 mM GSH + 0.5 nmol U−1 furin for 12 h).
We next investigated the Raman-scattering signatures of the Olsa-RVRR and the formed Olsa-NPs. The Raman spectra recorded from Olsa is shown in Fig. 2d with a distinct feature at 1168 cm−1 and other expected CH2 and C=O deformation and wagging modes in the 1400–1470 cm−1 region. Simulation studies of the Olsa molecule and its vibrational modes using Gaussian software suggest that the peak arises from a combination of N-H bending and ring breathing mode of tri-substituted benzene, which is consistent with prior reports that detail spectral profiles of similar molecules in the literature.[19] These prominent Raman features also did not undergo perceptible shifts following GSH/furin-induced self-assembly of the Olsa-NPs.
To assess the efficacy of Olsa-NPs formation in offering a differential Raman signal, we first tested the furin-overexpressing human colon carcinoma cell line HCT116. Cells were cultured on quartz slides and incubated with 100 μM Olsa-RVRR, Olsa (i.e., without RVRR conjugation), CTR1, or CTR2 for 3 hours, and then fixed with 4% paraformaldehyde (PFA) before Raman imaging. A confocal Raman microscope was used for acquisition of the hyperspectral dataset (x-y-λ) using a 785 nm laser as the excitation source. We constructed Raman images of the examined cells from the intensity of the 1168 cm−1 feature (corresponding to Olsa-NPs) and the 1440 cm−1 feature characteristic of CH2 bending mode in proteins and lipids. The shape of the cells can be clearly demarcated from the 1440 cm−1 Raman image, which shows a direct correspondence with the bright field images. Notably, a clear Raman peak is observed at 1168 cm−1 inside HCT116 cells after incubation with Olsa-RVRR (Figure 3a). This peak is highly specific for the presence of Olsa-NPs and is hardly seen anywhere else in the cytoplasm (Figure S5). Expectedly, untreated HCT116 cells exhibited undetectable signal levels at 1168 cm−1 (Figure 3b). Additionally, for the three control compounds (Olsa, CTR1, and CTR2), which as explained above do not result in intracellular self-assembly of the nanoparticles, the Raman signals at 1168 cm−1 are conspicuous (Figure 3b). These results confirm that the accumulation of Olsa-NPs and the resulting Raman signal is, indeed, derived from condensation-induced self-assembly of nanoaggregates. In order to further test the furin specificity of the Raman signature, we also incubated the furin-negative fibroblast cell line CCD-18Co with Olsa-RVRR. The lack of the characteristic Raman signal also proves that the formation of Olsa-NPs is furin-mediated (Figure S6). To quantify the intracellular Olsa-NP content, we next performed Raman analysis on HCT116 cell pellets for each of the incubation conditions. The intensity values, computed as area under the curve at ~1168 cm−1 following peak normalization, are shown in Figure 3c. Consistent with the Raman imaging results for plated cells, Olsa-RVRR incubated cell pellets showed significantly higher Raman intensity for the 1168 cm−1 peak compared to untreated cells and the control groups. Together, the in vitro imaging study results verify the higher intracellular concentration of Olsa-NP when the furin-overexpressing cells are incubated with Olsa-RVR while the dramatic differences in spectral intensity levels suggests higher imaging sensitivity and better long-term stability for Raman imaging of the targeted cells.
Figure 3.

In vitro cellular Raman imaging. a) Bright field and Raman images recorded from furin-overexpressing HCT116 cells incubated with Olsa-RVRR. The 1168 cm−1 signal (red) corresponds to Olsa-NP, while the 1440 cm−1 signal (green) corresponds to the CH2 bending mode from intrinsic cellular components. Scale bar = 10 μm. b) Composite Raman images of HCT116 cells without and with incubation of Olsa alone (without RVRR), CTR1, and CTR2, respectively, showing the clear absence of Olsa-NP signature. Scale bar = 5 μm. c) Intensity values plotted as area under the curve at ~1168 cm−1 following peak normalization. Number of samples = 17 for each group; *p <0.0001 for Olsa-RVRR compared to all other groups.
Finally, to evaluate the performance of the Olsa-RVRR probes for in vivo tumor detection, we performed a proof-of-concept study where SCID mice (n=3 for each group, 6–8 weeks old, 20–25 g, Jackson Laboratory) were subcutaneously injected with HCT 116 cells in both the left and right flank. When tumors reached a volume of 100–200 mm3, either 0.2 mmol kg–1 body weight (278 mg kg–1) Olsa-RVRR, 0.2 mmol kg–1 body weight (69 mg kg–1) Olsa, 0.2 mmol kg–1 body weight (278 mg kg–1) CTR1, or 0.2 mmol kg–1 body weight (246 mg kg–1) CTR2 was injected intravenously in the mice.
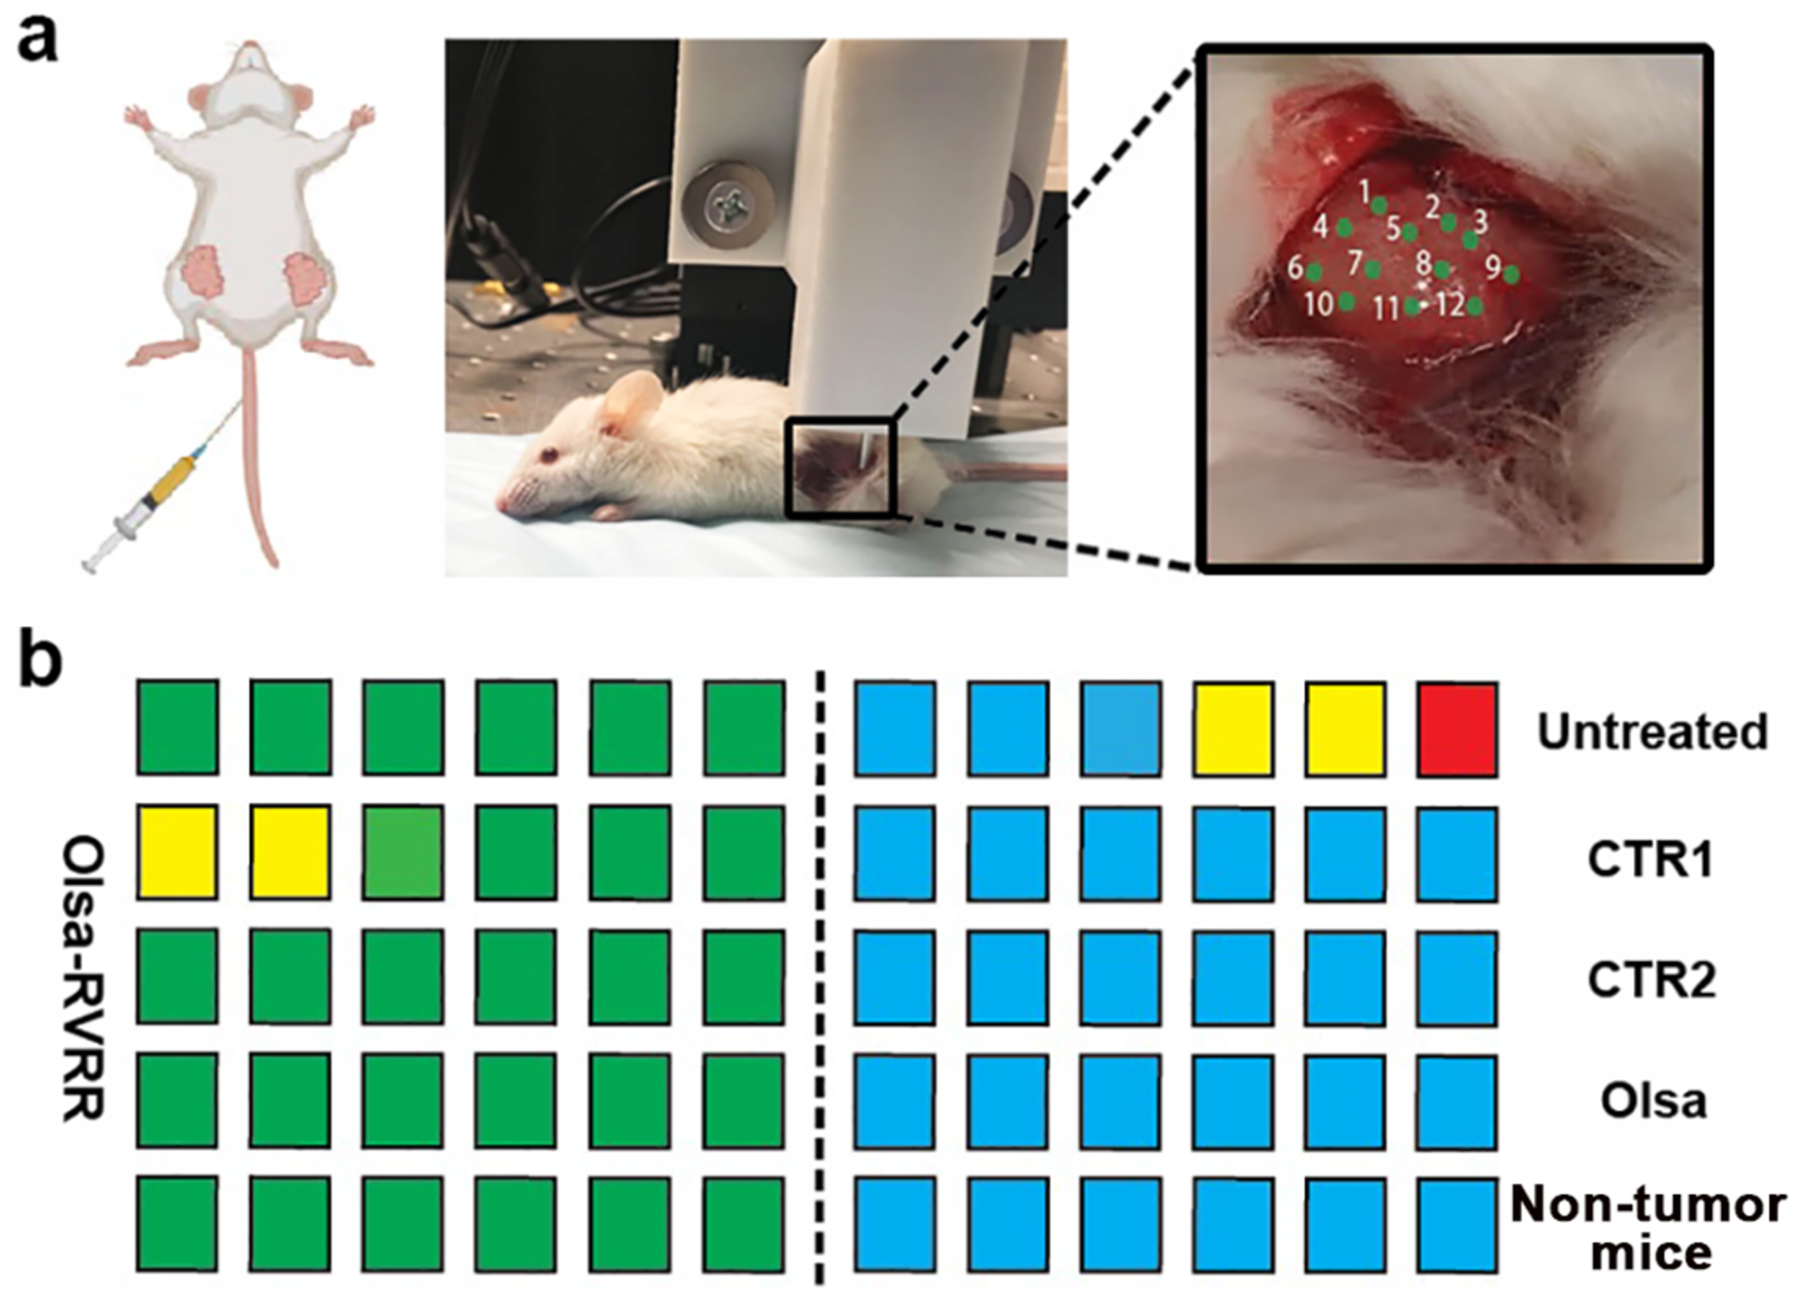
Two hours post-injection of compounds, when maximum tumor accumulation occurs,[8] tumors were exposed with a skin incision and a fiber-optic probe-based custom-built portable Raman system was used to scan the tumor region. To capture the tumor heterogeneity and potential variance arising from differential accumulation of Olsa-NP in each group, spatially distinct Raman spectra from each specimen (Figure 4a) were acquired and used after normalization in the ensuing analysis. Since the tumors consist of several endogenous Raman-active constituents, notably in the extracellular matrix, comparison of single peak intensities alone may not offer a robust diagnostic framework. Hence, we developed support vector machine (SVM)-based decision models[20] for translating the spectroscopic measurements in the tumors to identification of whether that particular specimen had an accumulation of Olsa-NP owing to the presence of furin-overexpressing tumor cells.
Figure 4.

In vivo Raman spectroscopic tumor detection. a) SCID tumor-bearing mice were injected i.v. with different compounds (Olsa-RVRR, CTR1, CTR2, Olsa). Two other groups bore no tumors and were untreated, respectively. Two hours post-injection, the tumor was exposed and Raman spectra were collected using a fiber-optic-based probe from 12 spatially distinct regions as indicated. b) Results of leave-one-tumor-out support vector machine classification of Raman spectra. The predictions are shown for the following binary classification tasks: Olsa-RVRR vs. untreated, Olsa-RVRR vs. CTR 1, Olsa-RVRR vs. CTR 2, Olsa-RVRR vs. Olsa, and Olsa-RVRR vs. non-tumor bearing mice. 6 tumors were included each group in the analyses. The classification results are displayed for on a per-tumor basis. Green box: correctly classified as Olsa-RVRR; blue box: correctly classified as untreated /CTR 1 /CTR 2 /Olsa /or non-tumor mice; red box: misclassified; and yellow box: unclassified.
Leave-one-tumor-out cross-validation analysis was performed, which involved training five separate binary SVM classifiers, corresponding to the five sets of comparisons - Olsa-RVRR treated vs one of untreated, CTR1, CTR2, Olsa, or non-tumor bearing mice. Briefly, a leave-one-tumor-out analysis offers a rigorous approach for examining the performance of the decision models,[4b] and refers to the removal of all spectra belonging to each tumor from the training data and the use of the resultant binary SVM classifier for predicting the class identity of the spectra belonging to the left-out tumor.
The developed SVM classifiers offered 100% classification accuracy for three of the binary comparisons, namely Olsa-RVRR vs. CTR2, Olsa and non-tumor-bearing mice (Figure 4b). For the comparison with CTR1, two of the Olsa-RVRR treated samples were unclassified while a similar number were unclassified and a single tumor misclassified for the comparison with untreated tumor. Taken together, this corresponds to a correct classification rate of 91.7% and a misclassification rate of 1.7%. These results provide strong evidence that in vivo Raman measurements can accurately differentiate between the Olsa-RVRR treated tumors and other control groups as a result of the accumulation of the Olsa motif in HCT116 tumors after injection of Olsa-RVRR. The tumor Raman signal was much higher than that for muscle tissue in the Olsa-RVRR treated group (Figure S7). Notably, the Raman signal of non-tumor bearing mice flanks after Olsa-RVRR injection were also significantly lower than that seen for the tumor, further affirming the key role of the furin-mediated self-assembly process.
In summary, based on a furin-mediated CBT-Cys click condensation reaction followed by intracellular nanoparticle self-assembly, we report the development of a new intratumoral furin-specific Raman reporter Olsa-RVRR. We demonstrated in situ imaging of furin-overexpressing tumor cells treated with Olsa-RVRR using Raman microscopy, and in vivo detection of such tumors by leveraging a combination of endoscope-compatible fiber optic-based Raman probe and machine learning. Since Olsa is a DNA methylation inhibitor that acts as a potential broad-spectrum anticancer drug[21], Olsa-RVRR has significant potential for serving not only as a dual-modality imaging agent (CEST MRI and Raman) for tumor resection but also offering targeted therapy.
Supplementary Material
Acknowledgements
This project was supported by the Pearl and Yueh-Heng Yang Foundation (YY), NIH P41 EB024495 (JWMB), NIH R01 EB030376 (JWMB), NIH R01 CA238025 (IB), NIH 2P41 EB015871-31 (IB), and NIH DP2 GM128198 (IB). We thank Dr. Michael T. McMahon for experimental assistance.
Footnotes
Publisher's Disclaimer: This manuscript has been accepted after peer review and appears as an Accepted Article online prior to editing, proofing, and formal publication of the final Version of Record (VoR). This work is currently citable by using the Digital Object Identifier (DOI) given below. The VoR will be published online in Early View as soon as possible and may be different to this Accepted Article as a result of editing. Readers should obtain the VoR from the journal website shown below when it is published to ensure accuracy of information. The authors are responsible for the content of this Accepted Article.
Supplementary information for this article is given via a link at the end of the document.
Conflict of interest
The authors declare no conflict of interest.
Contributor Information
Yue Yuan, The Russell H. Morgan Department of Radiology and Radiological, Science, Division of MR Research, The Johns Hopkins University School of Medicine, Baltimore, Maryland, United States; Cellular Imaging Section and Vascular Biology Program, Institute for Cell Engineering, The Johns Hopkins University School of Medicine, Baltimore, Maryland, United States; Department of Chemistry, University of Science and Technology of China, Hefei, Anhui, China.
Piyush Raj, Department of Mechanical Engineering, The Johns Hopkins University, Baltimore, Maryland, United States.
Jia Zhang, The Russell H. Morgan Department of Radiology and Radiological, Science, Division of MR Research, The Johns Hopkins University School of Medicine, Baltimore, Maryland, United States.
Soumik Siddhanta, Department of Mechanical Engineering, The Johns Hopkins University, Baltimore, Maryland, United States; Department of Chemistry, Indian Institute of Technology Delhi, Hauz Khas, New Delhi 110016, India..
Ishan Barman, The Russell H. Morgan Department of Radiology and Radiological, Science, Division of MR Research, The Johns Hopkins University School of Medicine, Baltimore, Maryland, United States; Department of Mechanical Engineering, The Johns Hopkins University, Baltimore, Maryland, United States; Department of Oncology, The Johns Hopkins University School of Medicine, Baltimore, MD, USA.
Jeff W.M. Bulte, The Russell H. Morgan Department of Radiology and Radiological, Science, Division of MR Research, The Johns Hopkins University School of Medicine, Baltimore, Maryland, United States Cellular Imaging Section and Vascular Biology Program, Institute for Cell Engineering, The Johns Hopkins University School of Medicine, Baltimore, Maryland, United States.
References
- [1].Butler HJ, Ashton L, Bird B, Cinque G, Curtis K, Dorney J, Esmonde-White K, Fullwood NJ, Gardner B, Martin-Hirsch PL, Walsh MJ, McAinsh MR, Stone N, Martin FL, Nature protocols 2016, 11, 664–687. [DOI] [PubMed] [Google Scholar]
- [2].a Hollon T, Lewis S, Freudiger CW, Sunney Xie X, Orringer DA, Neurosurgical focus 2016, 40, E9; [DOI] [PMC free article] [PubMed] [Google Scholar]; b Kong K, Rowlands CJ, Varma S, Perkins W, Leach IH, Koloydenko AA, Williams HC, Notingher I, Proc Natl Acad Sci U S A 2013, 110, 15189–15194. [DOI] [PMC free article] [PubMed] [Google Scholar]
- [3].a Paidi SK, Rizwan A, Zheng C, Cheng M, Glunde K, Barman I, Cancer Res 2017, 77, 247–256; [DOI] [PMC free article] [PubMed] [Google Scholar]; b Kallepitis C, Bergholt MS, Mazo MM, Leonardo V, Skaalure SC, Maynard SA, Stevens MM, Nat Commun 2017, 8, 14843; [DOI] [PMC free article] [PubMed] [Google Scholar]; c Kang JW, So PT, Dasari RR, Lim DK, Nano letters 2015, 15, 1766–1772. [DOI] [PMC free article] [PubMed] [Google Scholar]
- [4].a Auner GW, Koya SK, Huang C, Broadbent B, Trexler M, Auner Z, Elias A, Mehne KC, Brusatori MA, Cancer Metastasis Rev 2018, 37, 691–717; [DOI] [PMC free article] [PubMed] [Google Scholar]; b Paidi SK, Diaz PM, Dadgar S, Jenkins SV, Quick CM, Griffin RJ, Dings RPM, Rajaram N, Barman I, Cancer Res 2019, 79, 2054–2064. [DOI] [PMC free article] [PubMed] [Google Scholar]
- [5].a Huefner A, Kuan WL, Barker RA, Mahajan S, Nano letters 2013, 13, 2463–2470; [DOI] [PMC free article] [PubMed] [Google Scholar]; b Kang JW, So PTC, Dasari RR, Lim DK, Nano letters 2015, 15, 1766–1772; [DOI] [PMC free article] [PubMed] [Google Scholar]; c Panikkanvalappil SR, Hira SM, Mahmoud MA, El-Sayed MA, J Am Chem Soc 2014, 136, 15961–15968. [DOI] [PMC free article] [PubMed] [Google Scholar]
- [6].Li Y, Heo J, Lim CK, Pliss A, Kachynski AV, Kuzmin AN, Kim S, Prasad PN, Biomaterials 2015, 53, 25–31. [DOI] [PubMed] [Google Scholar]
- [7].Kuzmin AN, Pliss A, Lim CK, Heo J, Kim S, Rzhevskii A, Gu B, Yong KT, Wen S, Prasad PN, Sci Rep 2016, 6, 28483. [DOI] [PMC free article] [PubMed] [Google Scholar]
- [8].Yuan Y, Zhang J, Qi X, Li S, Liu G, Siddhanta S, Barman I, Song X, McMahon MT, Bulte JWM, Nat Mater 2019, 18, 1376–1383. [DOI] [PMC free article] [PubMed] [Google Scholar]
- [9].a Liang G, Ren H, Rao J, Nature chemistry 2010, 2, 54–60; [DOI] [PMC free article] [PubMed] [Google Scholar]; b Ye DJ, Shuhendler AJ, Cui LN, Tong L, Tee SS, Tikhomirov G, Felsher DW, Rao JH, Nature chemistry 2014, 6, 519–526. [DOI] [PMC free article] [PubMed] [Google Scholar]
- [10].Yuan Y, Ding Z, Qian J, Zhang J, Xu J, Dong X, Han T, Ge S, Luo Y, Wang Y, Zhong K, Liang G, Nano letters 2016, 16, 2686–2691. [DOI] [PubMed] [Google Scholar]
- [11].Shen B, Jeon J, Palner M, Ye D, Shuhendler A, Chin FT, Rao J, Angew Chem Int Ed 2013, 52, 10511–10514. [DOI] [PMC free article] [PubMed] [Google Scholar]
- [12].Yuan Y, Wang F, Tang W, Ding Z, Wang L, Liang L, Zheng Z, Zhang H, Liang G, ACS Nano 2016, 10, 7147–7153. [DOI] [PubMed] [Google Scholar]
- [13].Jaaks P, Bernasconi M, Int J Cancer 2017, 141, 654–663. [DOI] [PubMed] [Google Scholar]
- [14].Bassi DE, Mahloogi H, Al-Saleem L, De Cicco RL, Ridge JA, Klein-Szanto AJP, Mol Carcinogen 2001, 31, 224–232. [DOI] [PubMed] [Google Scholar]
- [15].Cheng M, Watson PH, Paterson JA, Seidah N, Chretien M, Shiu RPC, International Journal of Cancer 1997, 71, 966–971. [DOI] [PubMed] [Google Scholar]
- [16].Page RE, Klein-Szanto AJP, Litwin S, Nicolas E, Al-Jumaily R, Alexander P, Godwin AK, Ross EA, Schilder RJ, Bassi DE, Cell Oncol 2007, 29, 289–299. [DOI] [PMC free article] [PubMed] [Google Scholar]
- [17].Leitlein J, Aulwurm S, Waltereit R, Naumann U, Wagenknecht B, Garten W, Weller M, Platten M, Journal of immunology (Baltimore, Md. : 1950) 2001, 166, 7238–7243. [DOI] [PubMed] [Google Scholar]
- [18].Scamuffa N, Siegfried G, Bontemps Y, Ma LM, Basak A, Cherel G, Calvo F, Seidah NG, Khatib AM, J Clin Invest 2008, 118, 352–363. [DOI] [PMC free article] [PubMed] [Google Scholar]
- [19].a Watts PJ, Tudor A, Church SJ, Hendra PJ, Turner P, Melia CD, Davies MC, Pharm Res 1991, 8, 1323–1328; [DOI] [PubMed] [Google Scholar]; b https://opus.bibliothek.uniwuerzburg.de/frontdoor/index/index/docId/1780.
- [20].Thissen U, Ustun B, Melssen WJ, Buydens LM, Anal Chem 2004, 76, 3099–3105. [DOI] [PubMed] [Google Scholar]
- [21].Mendez-Lucio O, Tran J, Medina-Franco JL, Meurice N, Muller M, ChemMedChem 2014, 9, 560–565. [DOI] [PubMed] [Google Scholar]
Associated Data
This section collects any data citations, data availability statements, or supplementary materials included in this article.


