

Abstract
Cholesterol is physiologically indispensable for mammals, as illustrated by its abundance of up to 50% of plasma membrane lipids; in contrast, only 5% of lipids in the endoplasmic reticulum (ER) are cholesterol 1. The ER enzyme sterol O-acyltransferase 1 (also named acyl-coA:cholesterol acyltransferase, ACAT1) transfers a long chain fatty acid to cholesterol to form cholesteryl esters that coalesce into cytosolic lipid droplets. Under conditions of cholesterol overload, ACAT1 maintains the low cholesterol concentration of the ER and thereby plays an essential role in cholesterol homeostasis 2,3. Notably, ACAT1 is implicated in Alzheimer’s disease 4, atherosclerosis 5, and cancers 6. Here, we report a cryo-EM structure of human ACAT1 in complex with nevanimibe 7, an inhibitor that is in clinical trials for the treatment of congenital adrenal hyperplasia. The holoenzyme is a tetramer made up of two homodimers. Each ACAT1 monomer harbors nine transmembrane helices (TMs). Nevanimibe and an endogenous acyl-CoA are observed in a cavity created by TMs 4–9. The cavity contains a histidine previously shown to be required for catalytic activity. Our structural data along with biochemical analysis provide a physical model to explain the process of cholesterol esterification. This work also provides interaction details between nevanimibe and ACAT1 to accelerate the development of ACAT1 inhibitors to treat related diseases.
Introduction
Cholesterol is an essential structural component of cell membranes and is also a precursor for bile acids and steroid hormones 8. Cells obtain cholesterol from endogenous biosynthesis in the ER 9 and from exogenous delivery via low-density-lipoprotein (LDL) receptors 3. ACAT1 is an ER enzyme that transfers a fatty acyl group from acyl-CoA to the 3β-hydroxyl moiety of cholesterol 2. The synthesized cholesteryl esters coalesce to form cytoplasmic lipid droplets that store and sequester cholesterol preventing the formation of cholesterol crystals that are lethal to cells 10.
ACAT1 is the founding member of the membrane-bound O-acyltransferase (MBOAT) enzyme family whose members are distributed widely in prokaryotic and eukaryotic cells 11,12. Eukaryotic MBOATs, such as hedgehog acyltransferase, ghrelin acyltransferase and Porcupine, attach fatty acids to proteins or small molecules 11,12. Although all MBOATs catalyze acyl transfer, they exhibit almost no sequence identities. The structure of one MBOAT that modifies protective cell-wall polymers in bacteria has been reported recently 13 , but none of the eukaryotic members have had their structures elucidated.
Two Human ACATs exist, designated as ACAT1 and ACAT2 14–17 (Extended Data Fig.1). ACAT1 is found in all nucleated eukaryotic cells where its products are incorporated into cytosolic lipid droplets. ACAT2 is produced primarily in hepatocytes and intestinal epithelial cells. Its products are translocated to the ER lumen where they are incorporated into secreted lipoproteins. When purified in detergents, full-length ACAT1 behaves like a homotetramer; while, truncated ACAT1, with a cytosolic N-terminal 65 amino acid deletion, behaves like a dimer18. Remarkably, the Vmax of the homodimer is 5-fold higher than the Vmax of the homotetramer 18. Mutagenesis studies have identified His460, an intramembrane histidine residue in putative helix 7, as a requirement for catalytic activity 19. This finding led to a proposed mechanism in which His460 mediates the transfer of the fatty acyl group. Previous studies showed that blocking ACAT1 alleviates neurologic damage in a mouse model of Alzheimer’s disease 4. In addition, reducing ACAT1 activity decreases plaque size and cholesterol ester content in the aorta of hypercholesteremic mice 5; in contrast, a clinical study showed that the ACAT inhibitor pactimibe could not slow atherosclerosis in patients with coronary disease 20. Pharmacological inhibition of ACAT1 has been shown to reduce proliferation of cancer cells in vitro 6. These findings evoke the necessity of an ACAT1 structure due to its potential as a therapeutic target, and the need for more potent ACAT1 inhibitors.
Structure of the ACAT1 tetrameric enzyme
We expressed full-length human ACAT1 in HEK293 cells and measured its activity with a previously reported fluorescence-based acyltransferase assay in vitro 21. Briefly, we incubated recombinant ACAT1 with oleoyl-CoA and mixed micelles containing POPC with or without cholesterol. After incubation at 37°C, we added 7-Diethylamino-3-(4-maleimidophenyl)-4-methylcoumarin, which reacts with the sulfhydryl group of free coenzyme A to form a fluorescent adduct. The biochemical assay shows that recombinant ACAT1 presents proper biochemical activity in the presence of cholesterol in vitro (Fig. 1b). Nevanimibe has a ~0.23 µM IC50 to inhibit cholesterol esterification by ACAT1 (Fig.1c).
Fig. 1. Functional characterization of human ACAT1 and nevanimibe in vitro.
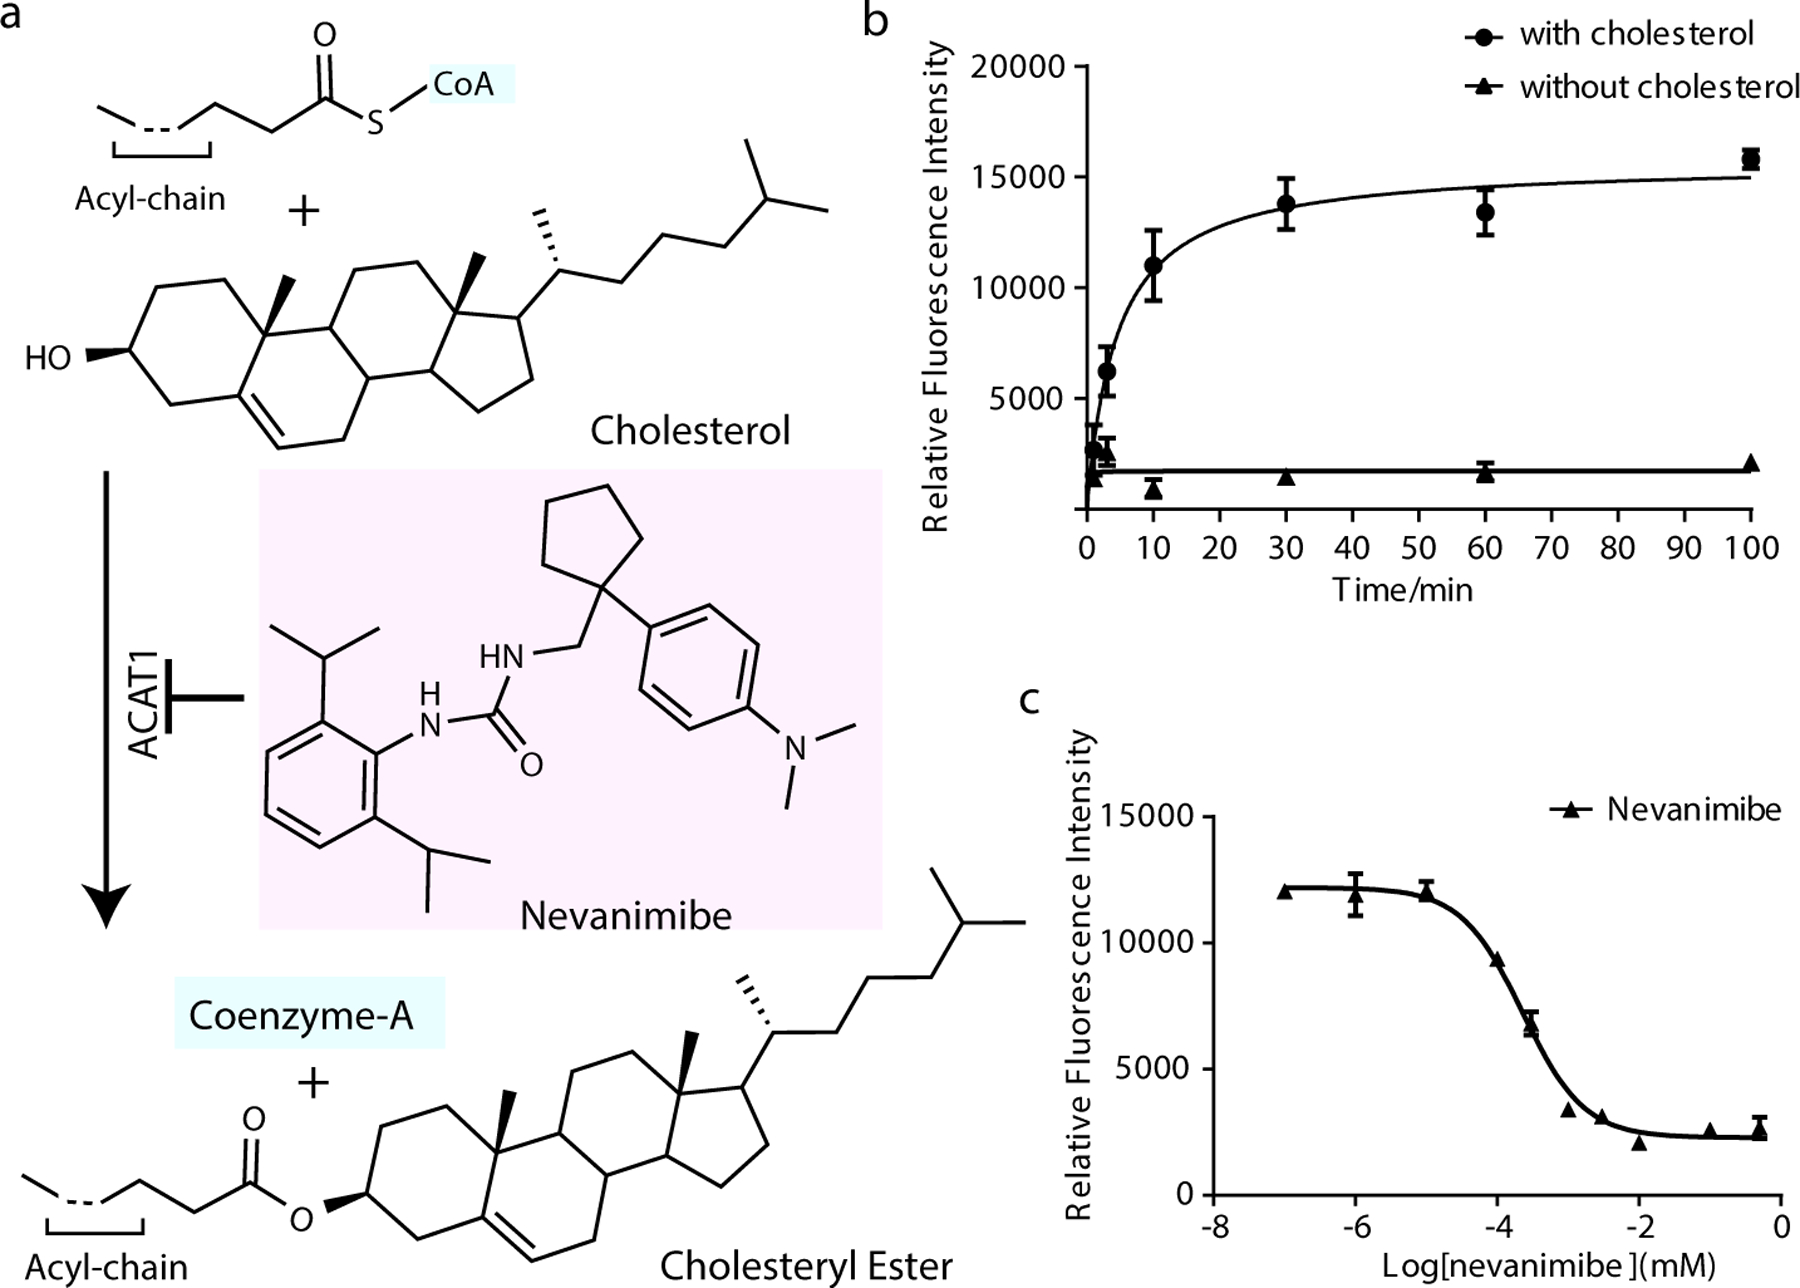
a. Cholesterol esterification. The chemical structures of cholesterol, acyl-CoA and nevanimibe are shown. b. Time curve of the cholesterol esterification by ACAT1 with oleoyl-CoA. No activity was detected when cholesterol is absent in the mixed micelles. c. Nevanimibe inhibits the activity of ACAT1 in vitro. The calculation is performed by GraphPad Prism7 showing logIC50= −3.641±0.123 (IC50=0.23±0.06 µM). In the activity assays, ACAT1 activity was measured by monitoring the released sulfhydryl (-SH) group of coenzyme A. The fluorescent product is detected with excitation and emission wavelengths of 355 and 460 nm, respectively. Data are mean ± s.d. (n=3 technically independent experiments). Each experiment was reproduced at least two times on separate occasions with similar results.
When co-purified with nevanimibe, the recombinant ACAT1 reveals a single peak in the detergent on the size exclusion chromatography (SEC), making it suitable for structural investigation (Extended Data Fig. 2). We purified the ACAT1 in the presence of nevanimibe without adding cholesterol, acyl-CoA or any other fatty acid. Then, we determined the structure of ACAT1 at 3.67-Å resolution by cryo-electron microscopy (cryo-EM) (Fig. 2a, Extended Data Figs. 3–6 and Table 1). The ACAT1 holoenzyme contains two dimers which are related by C2 symmetry (Fig. 2b). Therefore, C2 symmetry was assumed during data processing. We termed the four ACAT1 molecules “ACAT1-A and ACAT1-B” in dimer1 and “ACAT1-C and ACAT1-D” in dimer2 (Fig. 2b and c). The local resolution of the transmembrane helix core is about 3~3.5Å in the cryo-EM map (Extended Data Figs. 5b). The secondary structural elements along with details of most amino acids are well defined (Extended Data Figs. 6).
Fig. 2. Overall structure of human ACAT1 Holoenzyme.
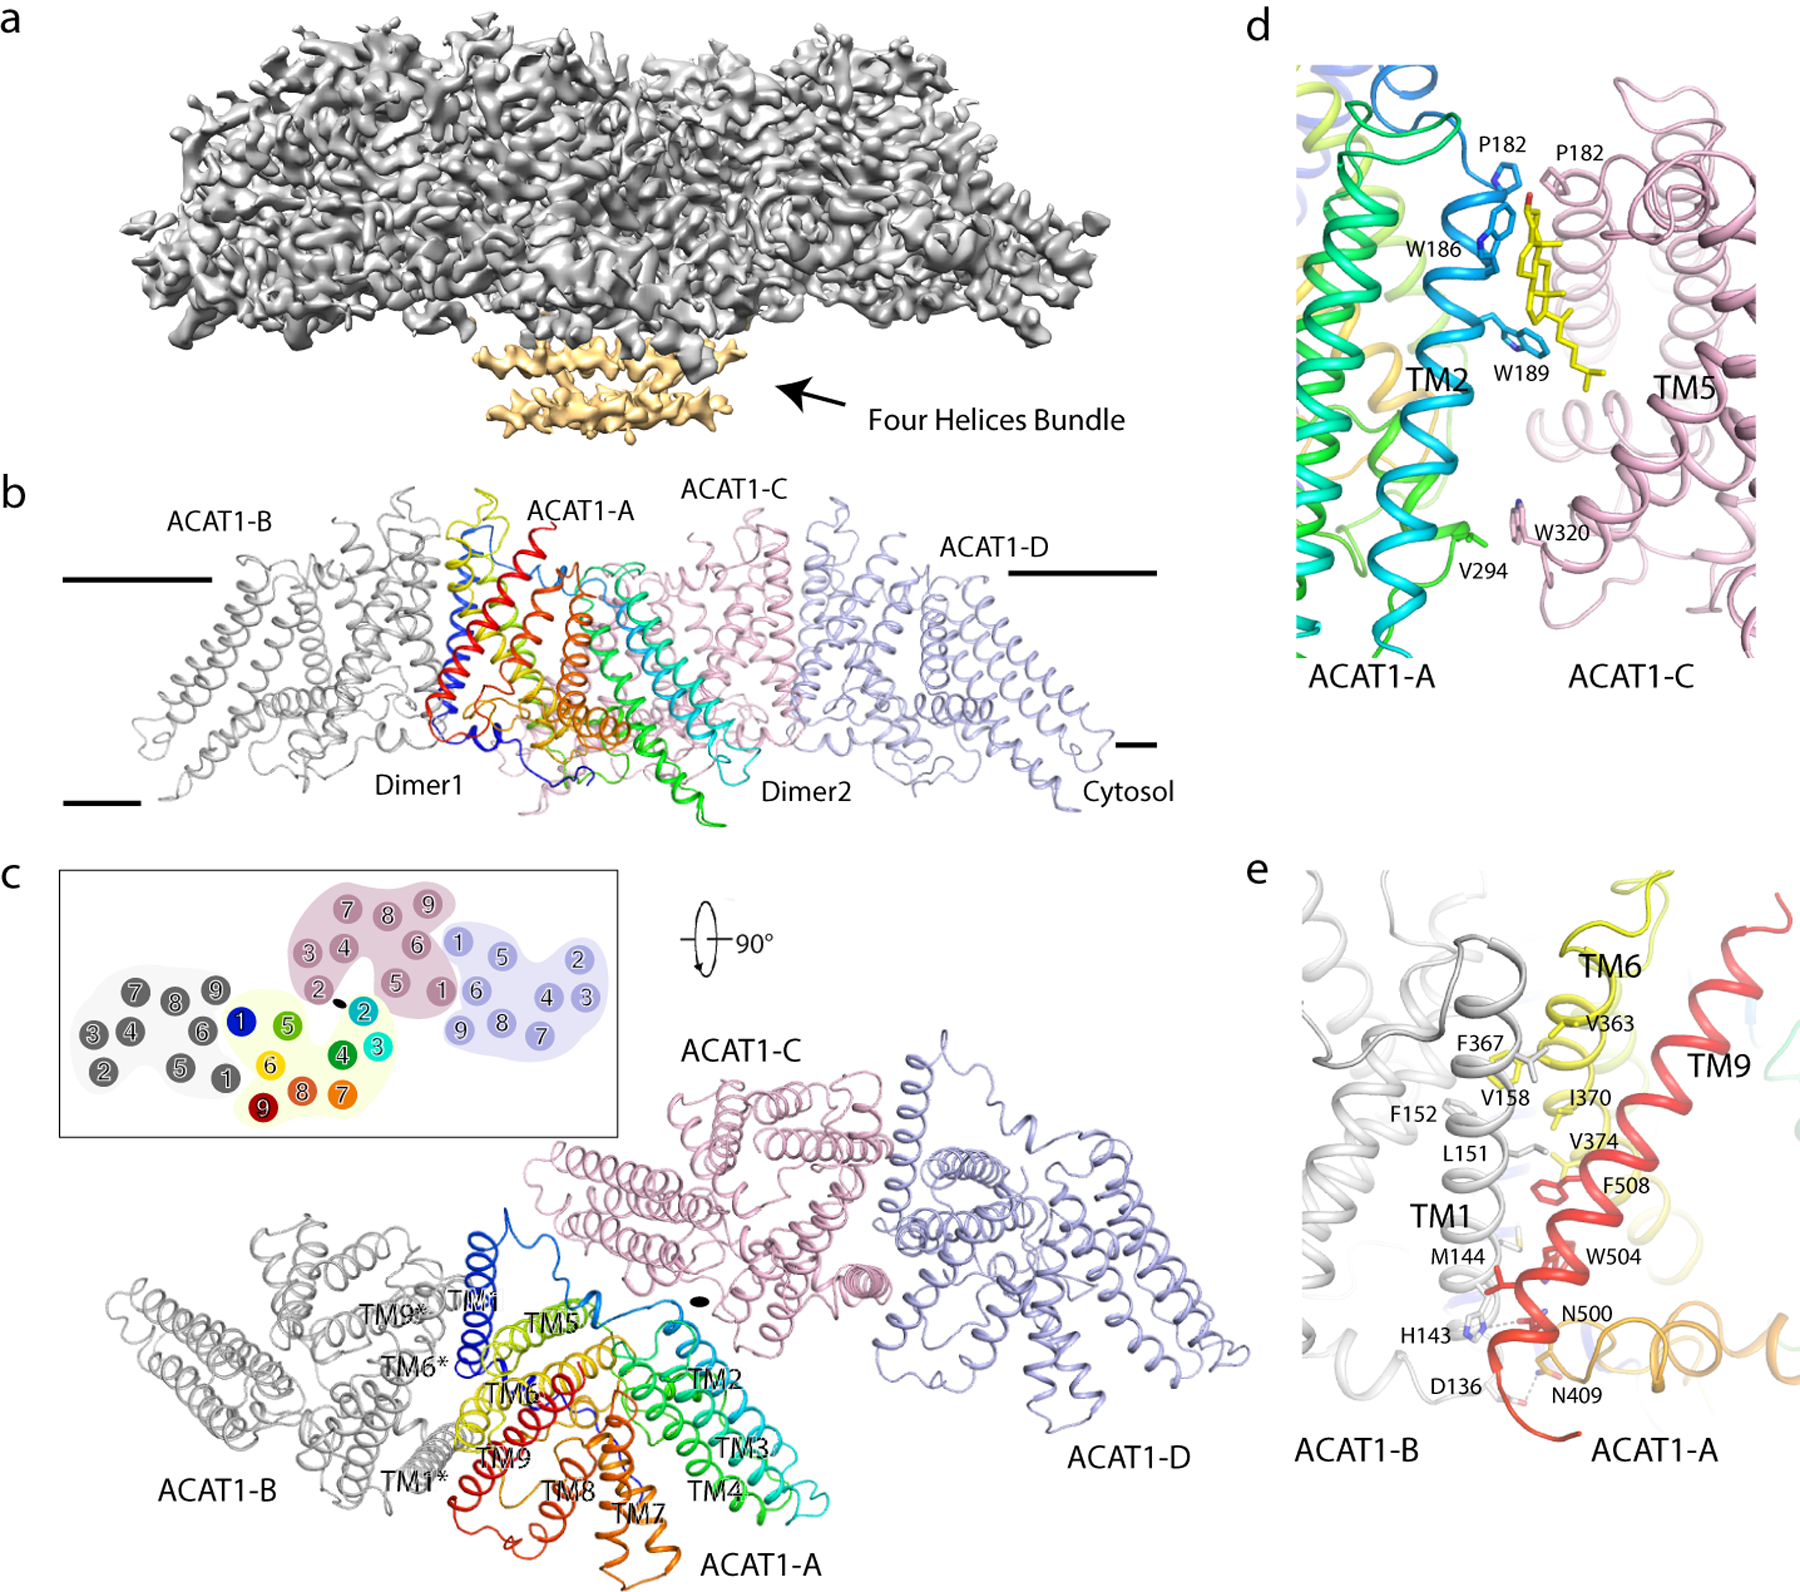
a. Cryo-EM map of human ACAT1. The cytosolic four helices bundle of ACAT1 is colored in yellow and indicated. b. Overall structure showing ACAT tetramer viewed from the side of the membrane. c. The top view of the holoenzyme containing two dimers. Labeled TM1, TM6 and TM9 are located at the interface and are involved in dimer assembly. d. Structural details of interface between dimers. The putative cholesterol (yellow) is shown as a lipid representative. e. Structural details of interface between monomers. Residues that contribute to tetramer assembly, as well as residues used in interactions are labeled.
The cryo-EM structure of the ACAT1 tetramer is consistent with the predictions from a previous biochemical study 18. Each ACAT1 monomer has nine transmembrane helices (TMs 1–9) (Fig. 2c). The N-terminal portion of each of the ACAT1 monomers folds into a distinct four-helix bundle on the cytosolic side (Fig. 2a) and clearly mediates the tetramerization in accordance with the previous study 18. Due to the limited local resolution of the helices (Extended Data Figs. 5b), the identity of each helix could not be distinguished, and they are not included in the final model. The ACAT1 variant with a N-terminal cytosolic helix deletion can only form a dimer 18 suggesting that the cytosolic helix is a major contributor for tetrameric assembly. The dimer-dimer interface between the TMs of ACAT1-A and ACAT1-C comprises about 340 Å2. Besides the N-terminal cytosolic helices, residues Pro182, Val294, and Trp320 also contribute to tetramer assembly (Fig. 2d). Notably, two lipid molecules were observed in the interface of the two dimers. The density map of these two lipids reveals a heterogeneous property. Based on the best fit using the cryo-EM map, we interpreted both of these densities as cholesterol (Fig. 2d); however, the presence of other lipids in this position cannot be excluded.
The dimer interface between ACAT1-A and ACAT1-B comprises about 1850 Å2 (Fig. 2e). TM1, TM6 and TM9 are involved in the assembly of the dimer. Although no symmetry was assumed within the dimer during cryo-EM data processing, ACAT1-A and ACAT1-B share nearly identical conformations with a 0.349 root-mean-square deviation. It is interesting to compare the structure of ACAT1 with the only other structurally characterized MBOAT, prokaryotic DltB that contains 11 TMs. Although no sequence identity between ACAT1 and DltB has been detected, TMs 4–11 of DltB show a topology similar to that of TMs 2–9 of ACAT1 (Extended Data Fig. 7a). Moreover, the putative catalytic His460 of ACAT1 aligns well with His336, the catalytic residue of DltB (Extended Data Fig. 7b).
Architecture of the catalytic cavity
ACAT1 has a hydrophobic cavity formed by TMs 4–9. Several small-molecule densities are present in this cavity that is predicted to lie in the leaflet of the ER membrane (Fig. 3a and b). Nevanimibe is observed in this cavity to form polar contacts with the catalytic His460 19 (Fig. 3c). Residue Trp420 stabilizes the inhibitor through a π-π interaction with an interplanar distance of 4Å (Fig. 3c). The carbonyl oxygen of nevanimibe very likely forms a hydrogen bond with Asn421, and the residues Phe254, Phe258, Phe384, Tyr417, and Val 424 are also involved in binding to nevanimibe (Fig. 3c). The position of nevanimibe suggests that it inhibits ACAT activity by sterically blocking access of substrates to the catalytic His460 residue. This is reminiscent of the inhibition mechanism of sterol reductase in the cholesterol biosynthetic pathway 22, where the inhibitors directly block sterol substrate entry.
Fig. 3. Overall structure of monomeric ACAT1 and its ligands.
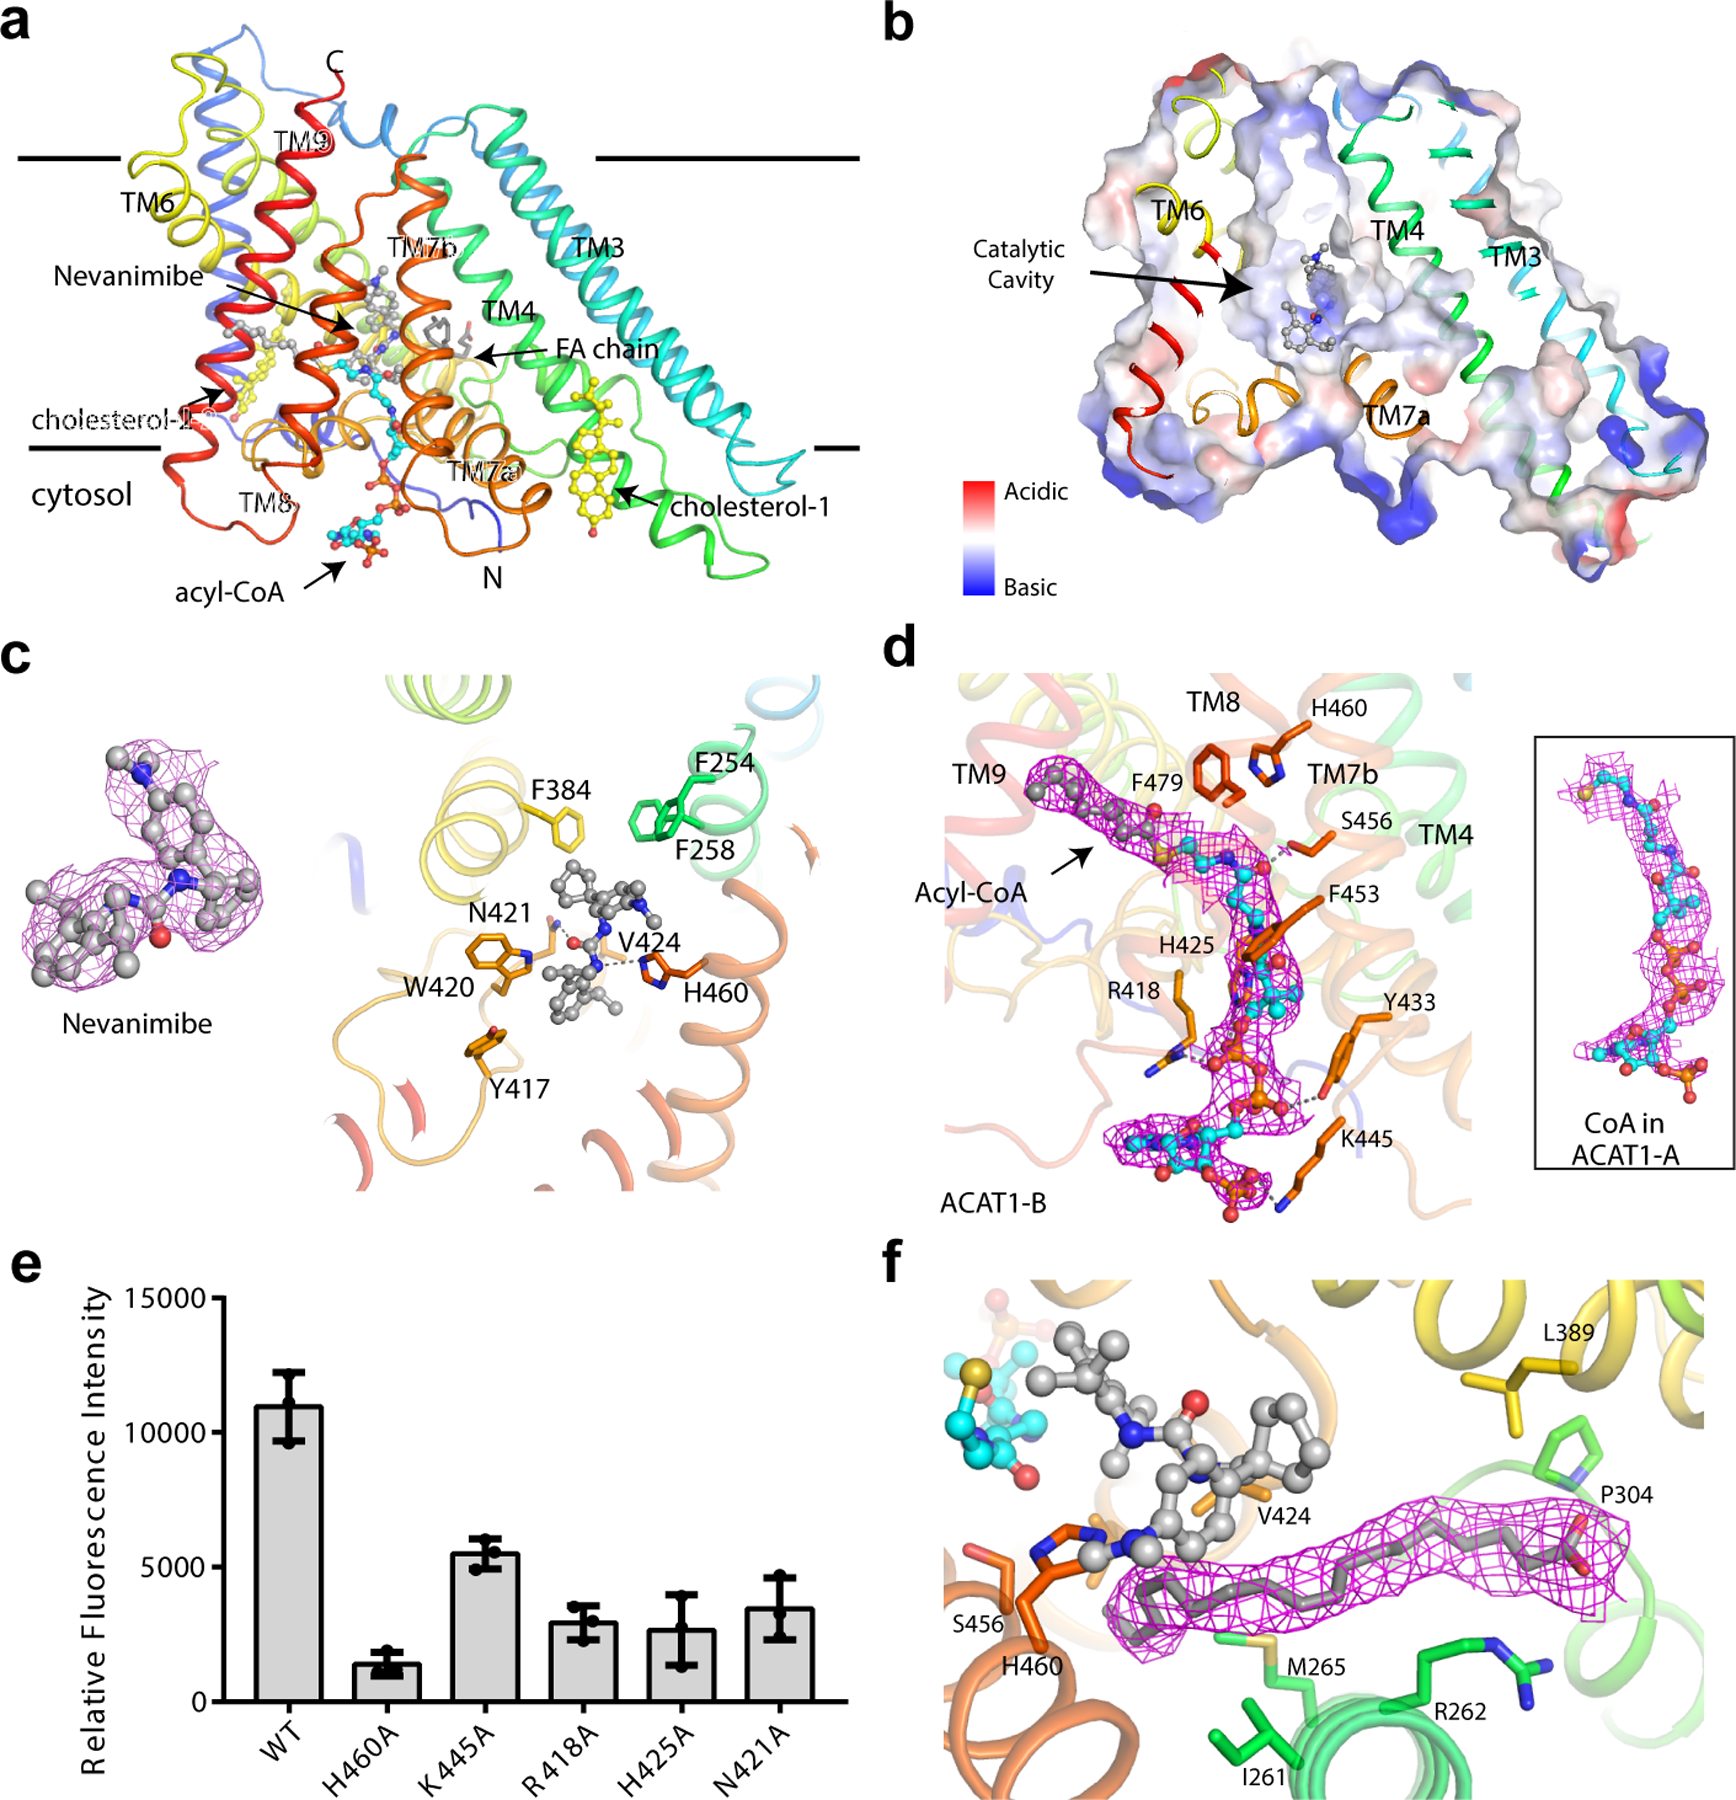
a. ACAT1 with nevanimibe (grey) and a fatty acid (FA) chain (grey) in the hydrophobic cavity created by TMs 4–9, as well as one coenzyme A (cyan) and two cholesterol molecules (yellow) on the cytosolic leaflet. b. Electrostatic surface representation of catalytic cavity. c. Interaction of nevanimibe with cavity residues. d. Overall view of the acyl-CoA with the bound residues in ACAT1-B. e. Functional validation of the acyl-CoA binding site and catalytic residues. Data are mean ± s.d. (n=3 technically independent experiments). Each experiment was reproduced at least two times on separate occasions with similar results. f. Details of the FA chain with cavity residues. Cryo-EM maps of nevanimibe, acyl-CoA, CoA and FA chain are shown at 5, 5, 5, and 7σ level, respectively. Residues are represented as sticks; dashed line represents hydrophilic interactions.
In ACAT1-B and ACAT1-D, the acyl-CoA substrate is observed in the cytosolic site whose fatty acid chain extends through TM8 and TM9 to reach the center of the lipid bilayer (Fig. 3d). A similar density is observed in ACAT1-A and ACAT1-C with a shorter length that perfectly fits coenzyme A, one of the products of cholesteryl esterification (Fig. 3d). Residues Arg418, His425, Tyr433, Lys445, and Ser456, which lie on the cytosolic leaflet of the protein, all have hydrophilic interactions with coenzyme A, while Phe453 and Phe479 contribute hydrophobic contacts (Fig. 3d). The structural analysis shows that 3’-phosphoadenosine of coenzyme A has few contacts with the cytosolic residues of ACAT1. This ensures the energetically favorable release of coenzyme A from its binding site after transfer of the fatty acid to cholesterol.
The Phe453Cys and Phe479Cys mutants had been shown to abolish the activity of ACAT1 23. The previous studies also showed that Ser456 is required for activity24. Our mutagenesis analysis confirmed that Arg418, His425 and Lys445 are required for the ACAT1 activity in vitro (Fig. 3e and Extended Data Fig. 8). These findings support our structural observation that acyl-CoA substrate enters the catalytic core through this route. In the current structure, the tail of acyl-CoA is pushed away from the catalytic core by nevanimibe. When nevanimibe is removed from the catalytic cavity, there is no more steric hindrance allowing the thioester bond of acyl-CoA to interact with His460. Our mutagenesis data show that Asn421, which binds to nevanimibe, is also required for the cholesterol esterification (Fig. 3e). This implies that Asn421 may be involved in stabilizing the reaction intermediate.
Besides acyl-CoA, a fatty acid-like density is present in the catalytic core (Fig. 3a and f). We interpreted this density as oleic acid, but the presence of other fatty acids in this position cannot be excluded. One end of this fatty acid chain is within 4–5Å of both the nevanimibe molecule and the catalytic His460. Residues Ile261, Met265, Pro304, Leu389, Val 424, and Leu428 make numerous hydrophobic contacts with this chain. Residue Arg262 is located close to the putative carboxylate group of the fatty acid chain and seemingly detains the fatty acid chain in the cavity (Fig. 3f). We speculate that this fatty acid molecule can provide the rigidity of the membrane cavity necessary to grant the cholesterol substrate access to the catalytic His460 (see the next section).
Working model of ACAT1
This structure reveals a hydrophobic tunnel open to the lumenal leaflet of the ER membrane (Fig. 4a). Residues in TM2, TM4, TM5 and TM6 create this tunnel. Nevanimibe blocks catalytic residue His460, located in the center of the tunnel, preventing access to it from the ER membrane (Fig. 4a). When we subtract nevanimibe from the structure, His460 becomes exposed to the membrane environment (Fig. 4b). Docking results by PatchDock 25 show that cholesterol could fit into this tunnel; particularly, the 3β-hydroxyl group of cholesterol can reach His460 where the esterification could be initiated (Fig. 4c). To verify this docking result, we generated two mutants T380E and F384E to abolish the cholesterol substrate entrance. Activity assays with this mutant support our hypothesis (Fig. 4d and Extended Data Fig. 8). Remarkably, in the tetrameric state, the cholesterol entrances in ACAT1-A and ACAT1-C are blocked by the dimer-dimer interface (Fig. 4e). The cholesterol can only access the catalytic core through the tunnel of ACAT1-B and ACAT1-D. The blocking of cholesterol entry by the dimer-dimer interface might explain previous data showing that the ACAT tetramer has a much lower Vmax than the dimer 18.
Fig. 4. The entrance of cholesterol substrate.
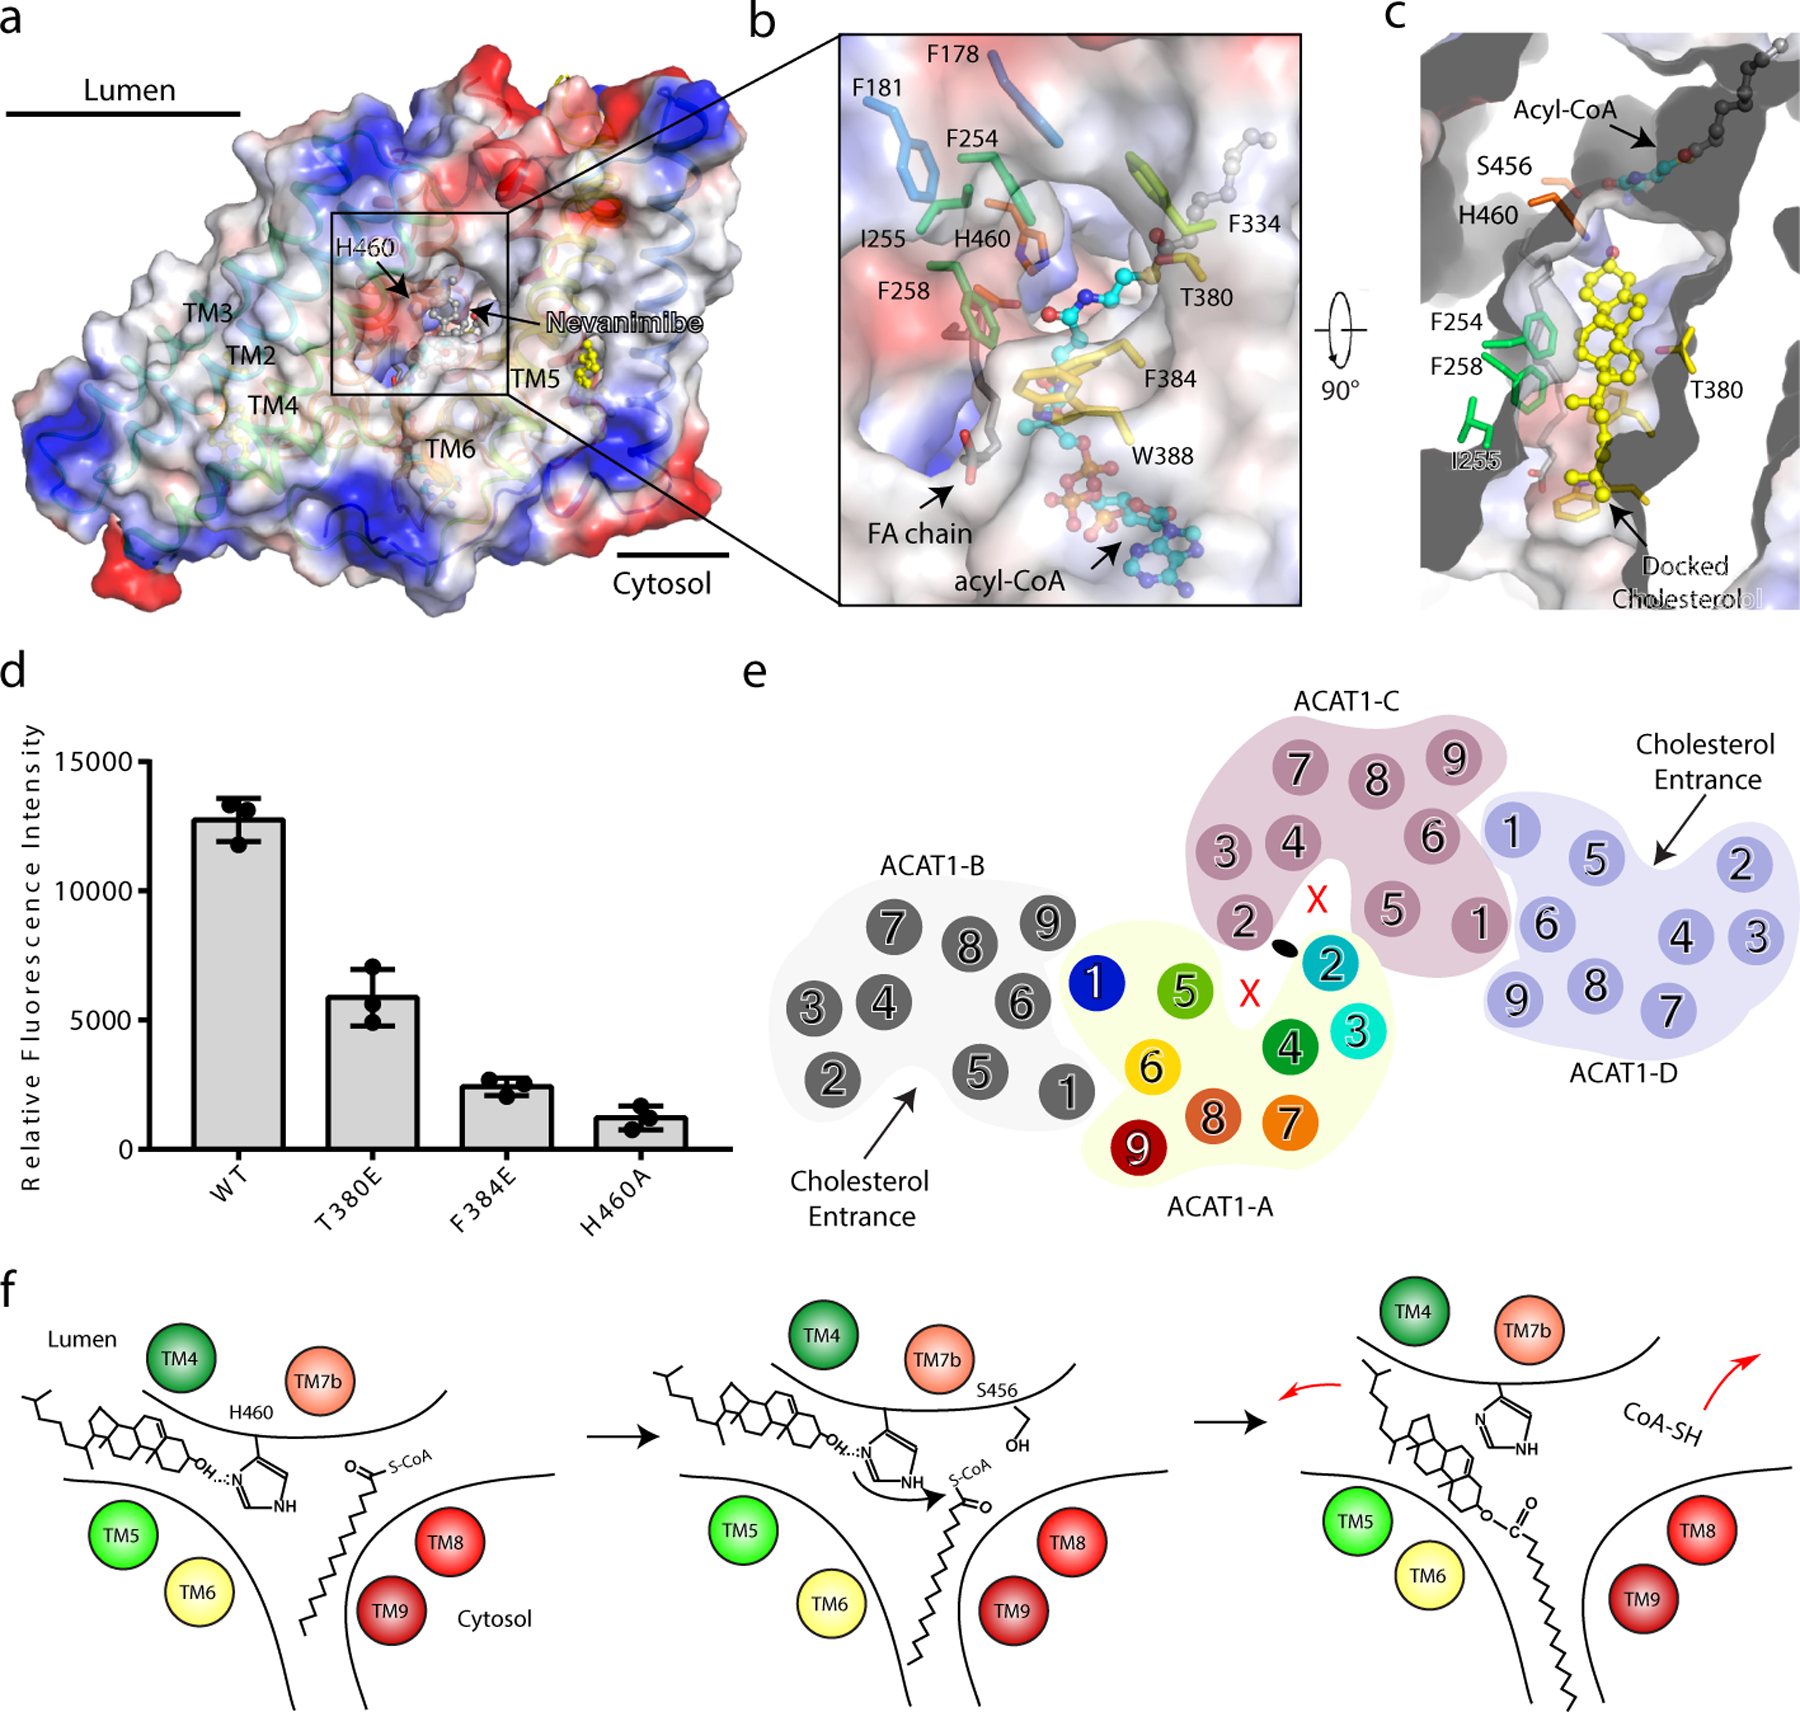
a. Electrostatic surface representation of the cavity in the lumenal leaflet of membrane. His460 is blocked by nevanimibe in the cavity. b. A close-up view of the putative entrance of cholesterol from the membrane cavity. His460 is exposed after removing nevanimibe. c. Top view of catalytic cavity after docking the cholesterol by PatchDock 25. d. Functional validation of cholesterol entrance. Data are mean ± s.d. (n=3 technically independent experiments). Each experiment was reproduced at least two times on separate occasions with similar results. e. The tetrameric state of ACAT1 prevents the access of cholesterol substrates into the cavities of ACAT1-A and ACAT1-C. f. Proposed reaction mechanism for cholesterol esterification. The putative reaction substrates and cholesteryl ester are shown.
Based on these observations, we propose a working model of ACAT1-mediated cholesterol esterification (Fig. 4f). The acyl-CoA enters the catalytic cavity through the cytosolic site (Fig. 3a) and cholesterol enters the catalytic cavity through the lumenal leaflet tunnel (Fig. 4a). His460 would serve as a base to deprotonate the 3β-hydroxyl group of cholesterol. The acyl-CoA can be stabilized through interactions with the residues located in the cytosolic site (Fig. 3d). This reactive cholesterol intermediate would then attack the acyl-CoA to form the cholesteryl ester product. Residues in the catalytic core, like Ser456 and Asn421, may stabilize the intermediate product, since biochemical analysis shows that mutations of these residues can abolish the reaction 19 (Fig. 3e). However, there is a technical barrier to specify the role of each residue. The ester product is released into the ER membrane through the same pore that cholesterol entered. As cholesterol esters accumulate in the lipid bilayer, they would split the bilayer and pinch off to form lipid droplets that are coated by a phospholipid monolayer. The close juxtaposition of two substrates (cholesterol and the acyl chain) in ACAT1 is reminiscent of the active site of sterol reductase in the cholesterol biosynthetic pathway, where the sterol substrate is adjacent to the reducing cofactor NADPH in the central cavity 26.
A biochemical assay showed that cholesterol is the most efficient allosteric activator 27. We observed a cholesterol molecule in our structure, which is located in a hydrophobic pocket surrounded by TMs 3, 4 and 7a in the cytosolic leaflet (Extended Data Fig. 9a). We envision that this additional cholesterol may stabilize TM4 and TM7a in a configuration that allows the cholesterol substrate to enter the tunnel (Fig. 4c). A second cholesterol molecule in our structure is located in a hydrophobic pocket flanked by TMs1, 5 and 6 (Extended Data Fig. 9b). The sterol ring makes a hydrophobic contact with Trp408 that might affect the conformation of Trp420 and Asn421 in the catalytic core. This interaction would keep TM6 in a conformation that allows the cholesterol substrate to enter the hydrophobic tunnel (Fig. 4c). Interestingly, this cholesterol is located at the interface of ACAT1-A and ACAT1-B and may also play a role in stabilizing the ACAT1 dimer (Extended data Fig. 9c). To validate the physiological importance of these two putative allosteric sites, we introduced two mutations on each site and measured the ACAT1 activity of these mutants. The mutations on Phe382 and Trp408 lead to a 90% loss of ACAT1 activity, whereas the mutations on Arg272 and Trp438 did not affect ACAT1 activity (Extended data Fig. 8 and 9d). These data suggest that the cholesterol binding site among TMs 1, 5, and 6 (Extended data Fig. 9c) plays a primary role in cholesterol mediated ACAT1 activation. Fully elucidating this mechanism of allosteric activation requires further study.
Discussion
In this manuscript, we report the cryo-EM structure of human ACAT1 with its inhibitor nevanimibe. ACAT1 was captured in an intermediate state where several small molecules are present surrounding the active site, including the acyl-CoA substrate molecule and the nevanimibe inhibitor. These findings help us to understand the catalysis of cholesterol esterification and also reveal the mode of action of the ACAT inhibitor nevanimibe.
Mammalian cells obtain cholesterol through LDL receptor-mediated uptake of LDL particles . Niemann-Pick Protein C1 (NPC1) and NPC2 collaborate to export cholesterol from the lysosomal membrane and shuttle it to the ER 28–30. The cholesterol concentration in the ER is crucial for the SREBP pathway activation 8. If the concentration of cholesterol exceeds 5%, the SREBP pathway will be turned off to prevent cholesterol biosynthesis and LDL-derived cholesterol uptake. Since the SREBP pathway monitors cholesterol concentration, free cholesterol will first interact with the SREBP cleavage-activating protein named SCAP, an ER cholesterol sensor 8. ACAT1 senses free cholesterol by its allosteric site. At low cholesterol concentrations, ACAT1 will not efficiently catalyze esterification; however, at higher concentrations, excessive cholesterol can promote esterification allosterically. This mechanism would ensure that ACAT1 activity can be regulated by the concentration of free cholesterol in the membrane to maintain cholesterol homeostasis of the ER.
Methods
Protein expression and purification
The cDNA of human ACAT1 (GenBank: BC028940.1) was cloned into pEG BacMam with a C-terminal Flag-tag. The protein was expressed using baculovirus-mediated transduction of mammalian HEK-293S GnTI− cells (ATCC). For nevanimibe-bound proteins, 10 µM ligand was added in all purification steps. At 48 hours post infection, the cells were disrupted by sonication in buffer A, containing 20 mM Hepes, pH 7.5, 150 mM NaCl with 1 mM PMSF and 5 μg/mL leupeptin. After low speed centrifugation, the resulting supernatant was incubated in buffer B with 1% (w/v) Lauryl Matose Neopentyl Glycol (LMNG, Anatrace) for 1 hour at 4 °C. The lysate was centrifuged again, and the supernatant was loaded onto a Flag-M2 affinity column (Sigma-Aldrich). After washing twice, the protein was eluted in 20 mM Hepes, pH 7.5, 150 mM NaCl, 100 µg/mL 3×Flag peptide, 0.01% LMNG or 0.06% digitonin and concentrated. The concentrated protein was purified by Superose 6 Increase size-exclusion chromatography column (GE Healthcare) in a buffer containing buffer A and 0.06% (w/v) Digitonin (ACROS Organics) for cryo-EM study (Extended Data Fig. 2) or 1% Chaps (Anatrace) for activity assay (Extended Data Fig. 8). Point mutations were introduced into the coding region of ACAT1 by site-directed mutagenesis using the QuikChange II XL Site-Directed Mutagenesis Kit (Agilent Technologies, Santa Clara, CA). The coding region of each plasmid was sequenced to ensure integrity of the construct.
Fluorescence-based ACAT1 Assay
ACAT activity was measured by monitoring released CoA from an acyltransferase-mediated reaction 21. The sulfhydryl (-SH) group of CoA can react with 7-Diethylamino-3-(4-maleimido- phenyl)-4-methylcoumarin (CPM) and the resulting highly fluorescent product is readily detected. Mixed micelles with 2 mM cholesterol/10 mM POPC/18.6 mM taurocholate in reaction buffer containing 100 mM Hepes pH 7.5 and 150 mM NaCl were prepared as described previously 31. The assay was carried out in a total volume of 20 µL under the following conditions: 15 µL mixed micelle, 2.5 µL protein (at 7.2 µM concentration) and 2.5 µL 400 µM oleoyl-CoA. The reaction was initiated by addition of oleoyl-CoA and incubated at 37 °C for 3 minutes (Fig. 1c) or the indicated time (Fig. 1b). For the functional validations (Figs. 3e, 4d and Extended Data Fig. 9d), the assay was carried out in a total volume of 10 µL under the following conditions: 7 µL mixed micelle, 2.6 µL protein (at 1.14 µM concentration) and 0.4 µL 1.25 mM oleoyl-CoA. The reaction was initiated by addition of protein and incubated at 37 °C for 60 minutes. The reaction was terminated by adding 3 µL 10% SDS. Then 90 µL 50 µM CPM in reaction buffer was added to the reaction system and the mixture was transferred to 96 well plate. The plate was incubated at room temperature for 30 minutes, followed by detection of fluorescent signal using a BioTek Synergy Neo2 Hybrid Multi-Mode Reader (excitation 355 nm; emission 460 nm). Relative fluorescence intensity was obtained by subtracting the fluorescence intensity of oleoyl-CoA free reaction system for the corresponding protein. To measure the IC50, different concentrations of nevanimibe as indicated were added to the mixed micelle. Then the protein was added, and the mixture was incubated at 37 °C for 3 minutes. The reaction was started and terminated as described above.
EM Sample Preparation, Imaging and Processing for 200 kV Cryo-TEM
For 200 kV Cryo-TEM, the nevanimibe-bound ACAT1 sample was crosslinked by addition of 0.1% glutaraldehyde (Sigma-Aldrich) and incubated at room temperature for 30min. Then, the reaction was terminated by addition of 50mM Tris, pH8.0 at room temperature for 10 min. The cross-linked sample was further purified by Superose 6 Increase size-exclusion chromatography column (GE Healthcare) in a buffer containing buffer A and 0.06% (w/v) Digitonin (Extended Data Fig.3a). The sample (4 mg/ml) was applied to Quantifoil R1.2/1.3 400 mesh Au holey carbon grids (Quantifoil). The grids were then blotted and plunged into liquid ethane for flash freezing using a Vitrobot Mark IV (FEI). The grids were imaged in a 200 keV Talos Arctica (FEI) with a Gatan K3 Summit direct electron detector (Gatan). Data were collected at 0.89 Å/pixel with a dose rate of 32 electrons per physical pixel per second. Images were recorded for 1.5 second exposures in 50 subframes with a total dose of 60 electrons per Å2.
Motion correction was performed using the program MotionCor2 32. The contrast transfer function (CTF) was estimated using CTFFIND4 33. To generate ACAT1 templates for automatic picking, around 3000 particles were manually picked and classified by 2D classification in RELION-3 34. After auto-picking, the low-quality images and false-positive particles were removed manually. The remaining 165,508 particles were extracted for subsequent 2D. A low-resolution cryo-EM map of ACAT, which was generated from 3200 particles by RELION-3, was used as the initial model for 3D classification. The best class, containing 70,964 particles, was selected for the initial 3D-refinement, followed by Bayesian polishing and CTF refinement with beam tilt correction in RELION-3. The resulting particles were used for the final 3D-refinement with a soft mask and solvent-flattened FSCs yielded a reconstruction at 8.3 Å revealing clear secondary structural elements. The resolution was estimated using “post-processing” with the FSC criteria of 0.143.
EM Sample Preparation and Imaging for 300 kV Cryo-TEM
The nevanimibe-bound ACAT1 sample (4mg/ml native protein, not cross-linked) was applied to Quantifoil R1.2/1.3 300 or 400 mesh Au holey carbon grids (Quantifoil). The grids were then blotted and plunged into liquid ethane for flash freezing using a Vitrobot Mark IV (FEI). The grids were imaged in a 300 keV Titan Krios (FEI) with a Gatan K3 Summit direct electron detector (Gatan). Data were collected at 0.833 Å/pixel with a dose rate of 23 electrons per physical pixel per second. Images were recorded for 1.8 second exposures in 60 subframes with a total dose of 60 electrons per Å2.
Imaging Processing and 3D reconstruction for 300keV Cryo-TEM
The images were collected in two sessions (4124 images from 400 mesh, 5180 images from 300 mesh Au holey carbon grids, Extended Data Fig.3). Dark subtracted images were first normalized by gain reference that resulted in a pixel size of 0.833 Å. Motion correction was performed using the program MotionCor2 32. The contrast transfer function (CTF) was estimated using CTFFIND4 33. To generate ACAT1 templates for automatic picking, around 3000 particles were manually picked and classified by 2D classification in RELION-3 34. After auto-picking, low-quality images and false-positive particles were removed manually. About 1.5/1.9 million (from 400/300 mesh grid) particles of ACAT1 with nevanimibe were extracted. We used the cryo-EM structure of human ACAT1 which was determined by us with the data collected from a 200keV Arctica (FEI) low-pass filtered to 40 Å as the initial model with a C2 symmetry for 3D classification. The best class, containing 305,921/373,608 particles, provided a 6.1/6.8 Å map after 3D auto-refinement without a mask in RELION-3.
For the particles from the 400 mesh grid, CTF refinement and Bayesian polishing of particles were then performed using RELION-3. The 3D refinement using a soft mask and solvent-flattened Fourier shell correlations (FSCs) yielded a reconstruction at 4.3 Å. Then, a 3D Classification without image alignment was performed. The resulting 242,501 particles were refined using a soft mask and solvent-flattened Fourier shell correlations (FSCs) yielded a reconstruction at 4.23 Å. For the particles from the 300 mesh grid, Bayesian polishing was then performed using RELION-3. The 3D refinement using a soft mask and solvent-flattened Fourier shell correlations (FSCs) yielded a reconstruction at 5.8 Å.
Then, a 2D Classification was performed. The resulting 240,113 particles refined without a mask yielded a reconstruction at 5.7 Å. Finally, we combined these two datasets with a total of 482,614 particles and performed a masked 3D Classification without image alignment. The best class including 263,839 particles refined using a soft mask and solvent-flattened Fourier shell correlations (FSCs) yielded a reconstruction at 4.1 Å. Applying a soft mask in RELION-3 post-processing yielded a final cryo-EM map of 4.1 Å. Two rounds of CTF refinements were performed and the resulting particles were refined using a soft mask and solvent-flattened Fourier shell correlations (FSCs) yielded a reconstruction at 3.71 Å. Applying a soft mask in RELION-3 post-processing yielded a final cryo-EM map of 3.67 Å. Resolution was estimated using the Fourier shell correlation (FSC) 0.143 criterion.
Model Construction
To obtain better side-chain densities for model building, we sharpened the map using post-processing in RELION-3 with a B-factor value of −150 Å2. The initial model was built using phenix.maptomodel 35 and then manually adjusted using COOT 36. Large aromatic/hydrophobic residues were assigned to facilitate the register of the transmembrane helices. The densities of residues 1–117 of human ACAT1 were not resolved nor built. Residues 285–288 and 351–357 were built with alanine due to limited local resolution.
Model Refinement and Validation
The model was refined in real space using PHENIX 35 and also in reciprocal space using Refmac with secondary-structure restraints and stereochemical restraints 37,38. For cross-validations, the final model was refined against one of the half maps generated by 3D auto-refine and the model vs. map FSC curves were generated in the Comprehensive validation module in PHENIX.PHENIX and MolProbity 39 were used to validate the final model. Local resolutions were estimated using Resmap 40. Structure Figures were generated using PyMOL (http://www.pymol.org) and Chimera 41.
Extended Data
Extended Data Fig. 1. Sequence alignment of human (hs) ACAT1 and ACAT2, hamster (cg) ACAT1 and ACAT2, chicken (gg) ACAT1 and zebrafish (dr) ACAT1.
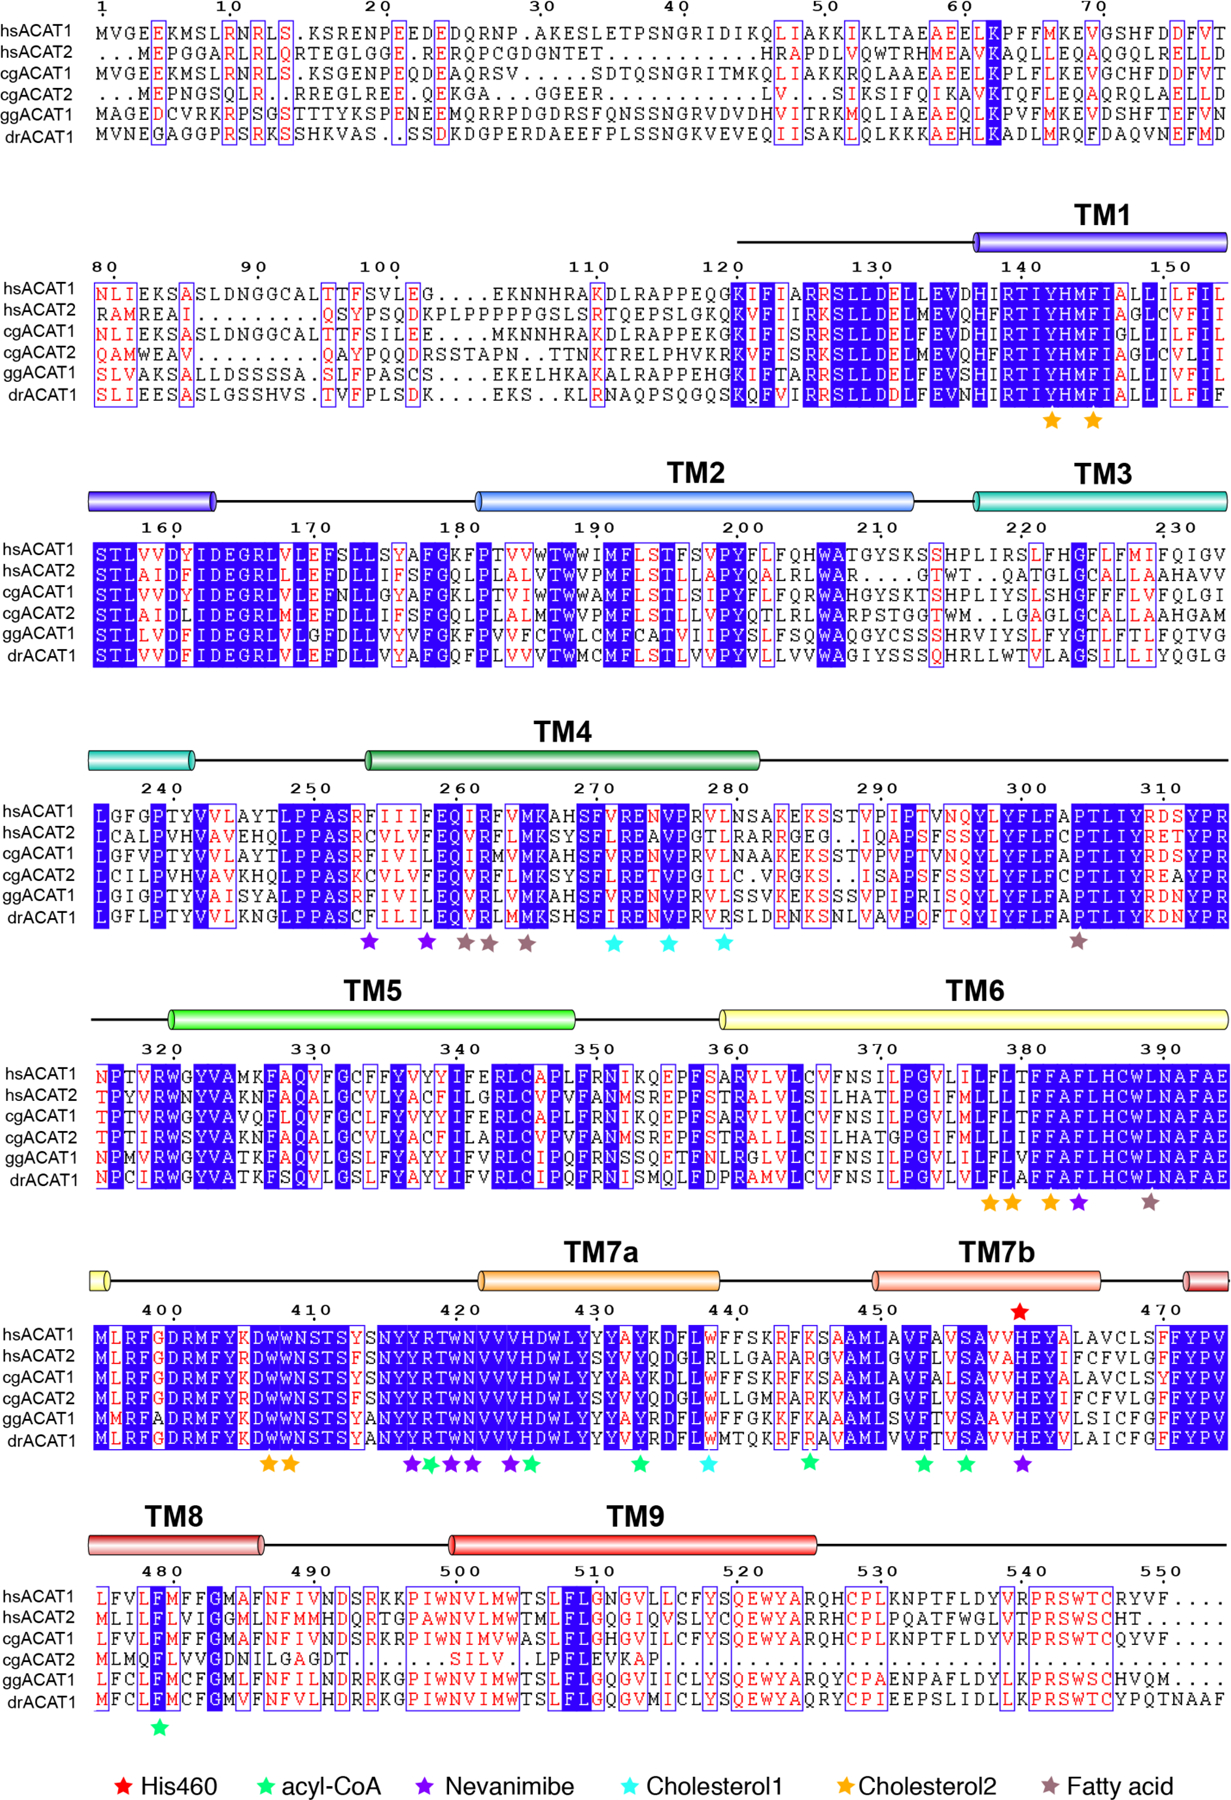
The transmembrane helices and the residue numbers of human ACAT1 are indicated above the protein sequence. The specific residues necessary for ligand binding are labeled with an asterisk.
Extended Data Fig. 2. Expression and purification of human ACAT1 protein with nevanimibe.
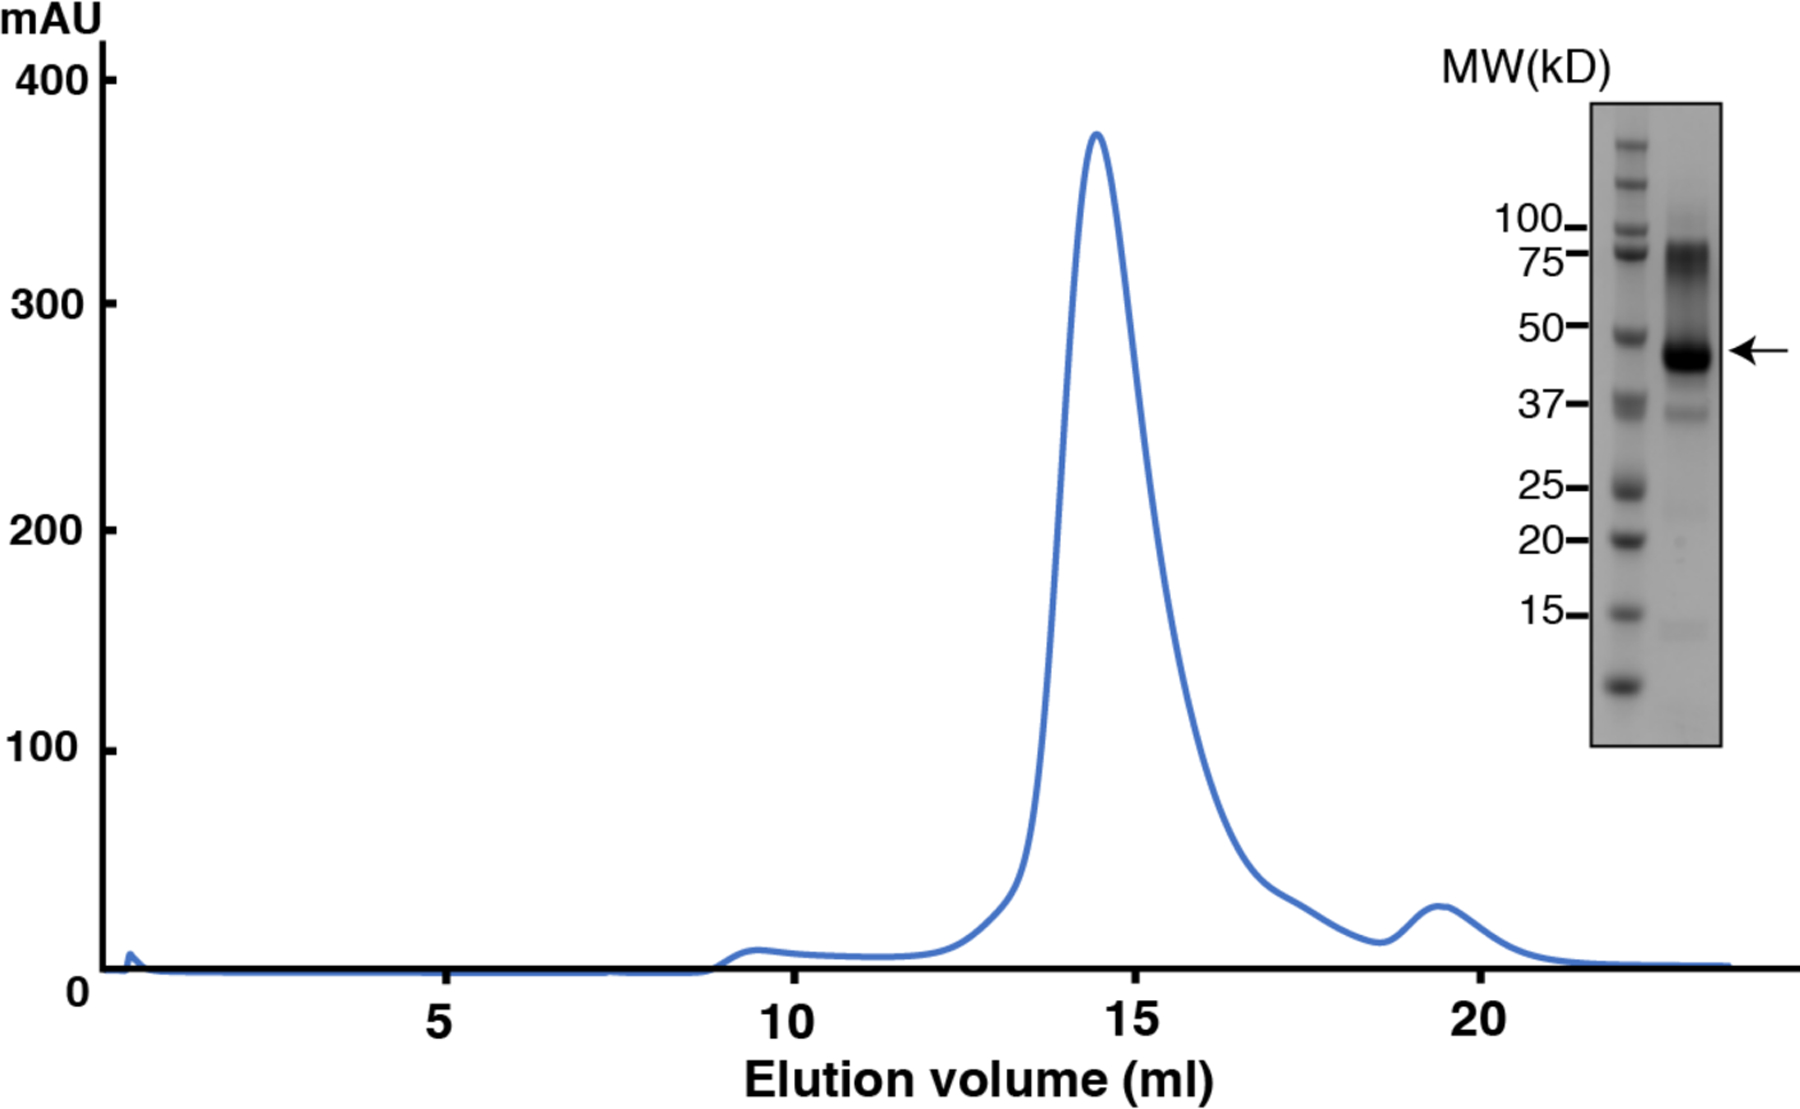
Representative Superose 6 increase 10/30 gel-filtration chromatogram of ACAT1. The peak fraction of ACAT1 is shown on SDS-PAGE with molecular markers. The ACAT1 protein is indicated by arrow.
Extended Data Fig. 3. Data processing for data acquired on a 200 keV Cryo-TEM.
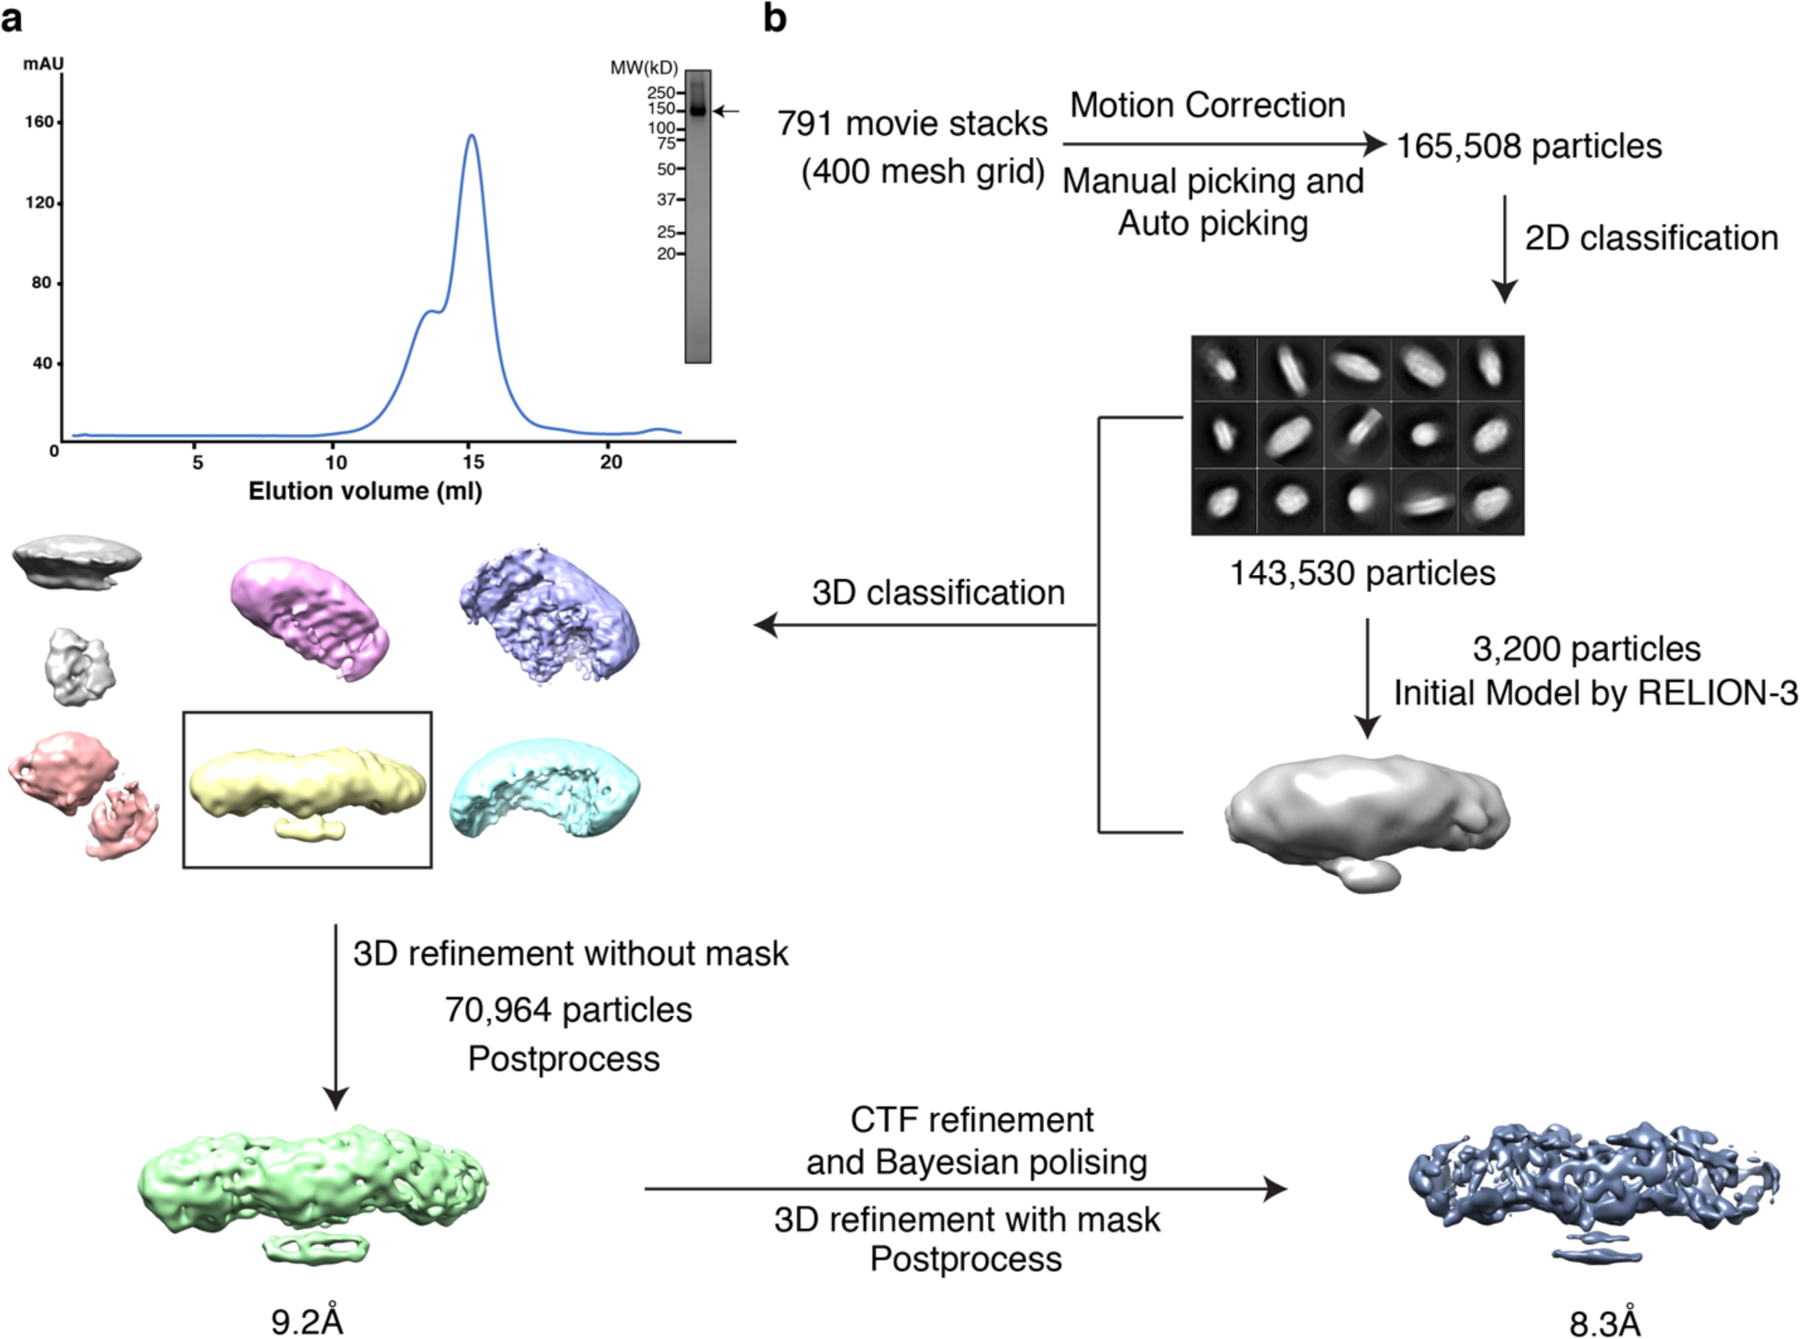
a. Representative Superose 6 increase 10/30 gel-filtration chromatogram of cross-linked ACAT1. The peak fraction of ACAT1 is shown on SDS-PAGE with molecular markers. The ACAT1 protein is indicated by arrow. b. The data processing workflow in RELION-3. The cryo-EM 3D classes and refinement results are shown.
Extended Data Fig. 4. Data processing for data acquired on a 300 keV Cryo-TEM.
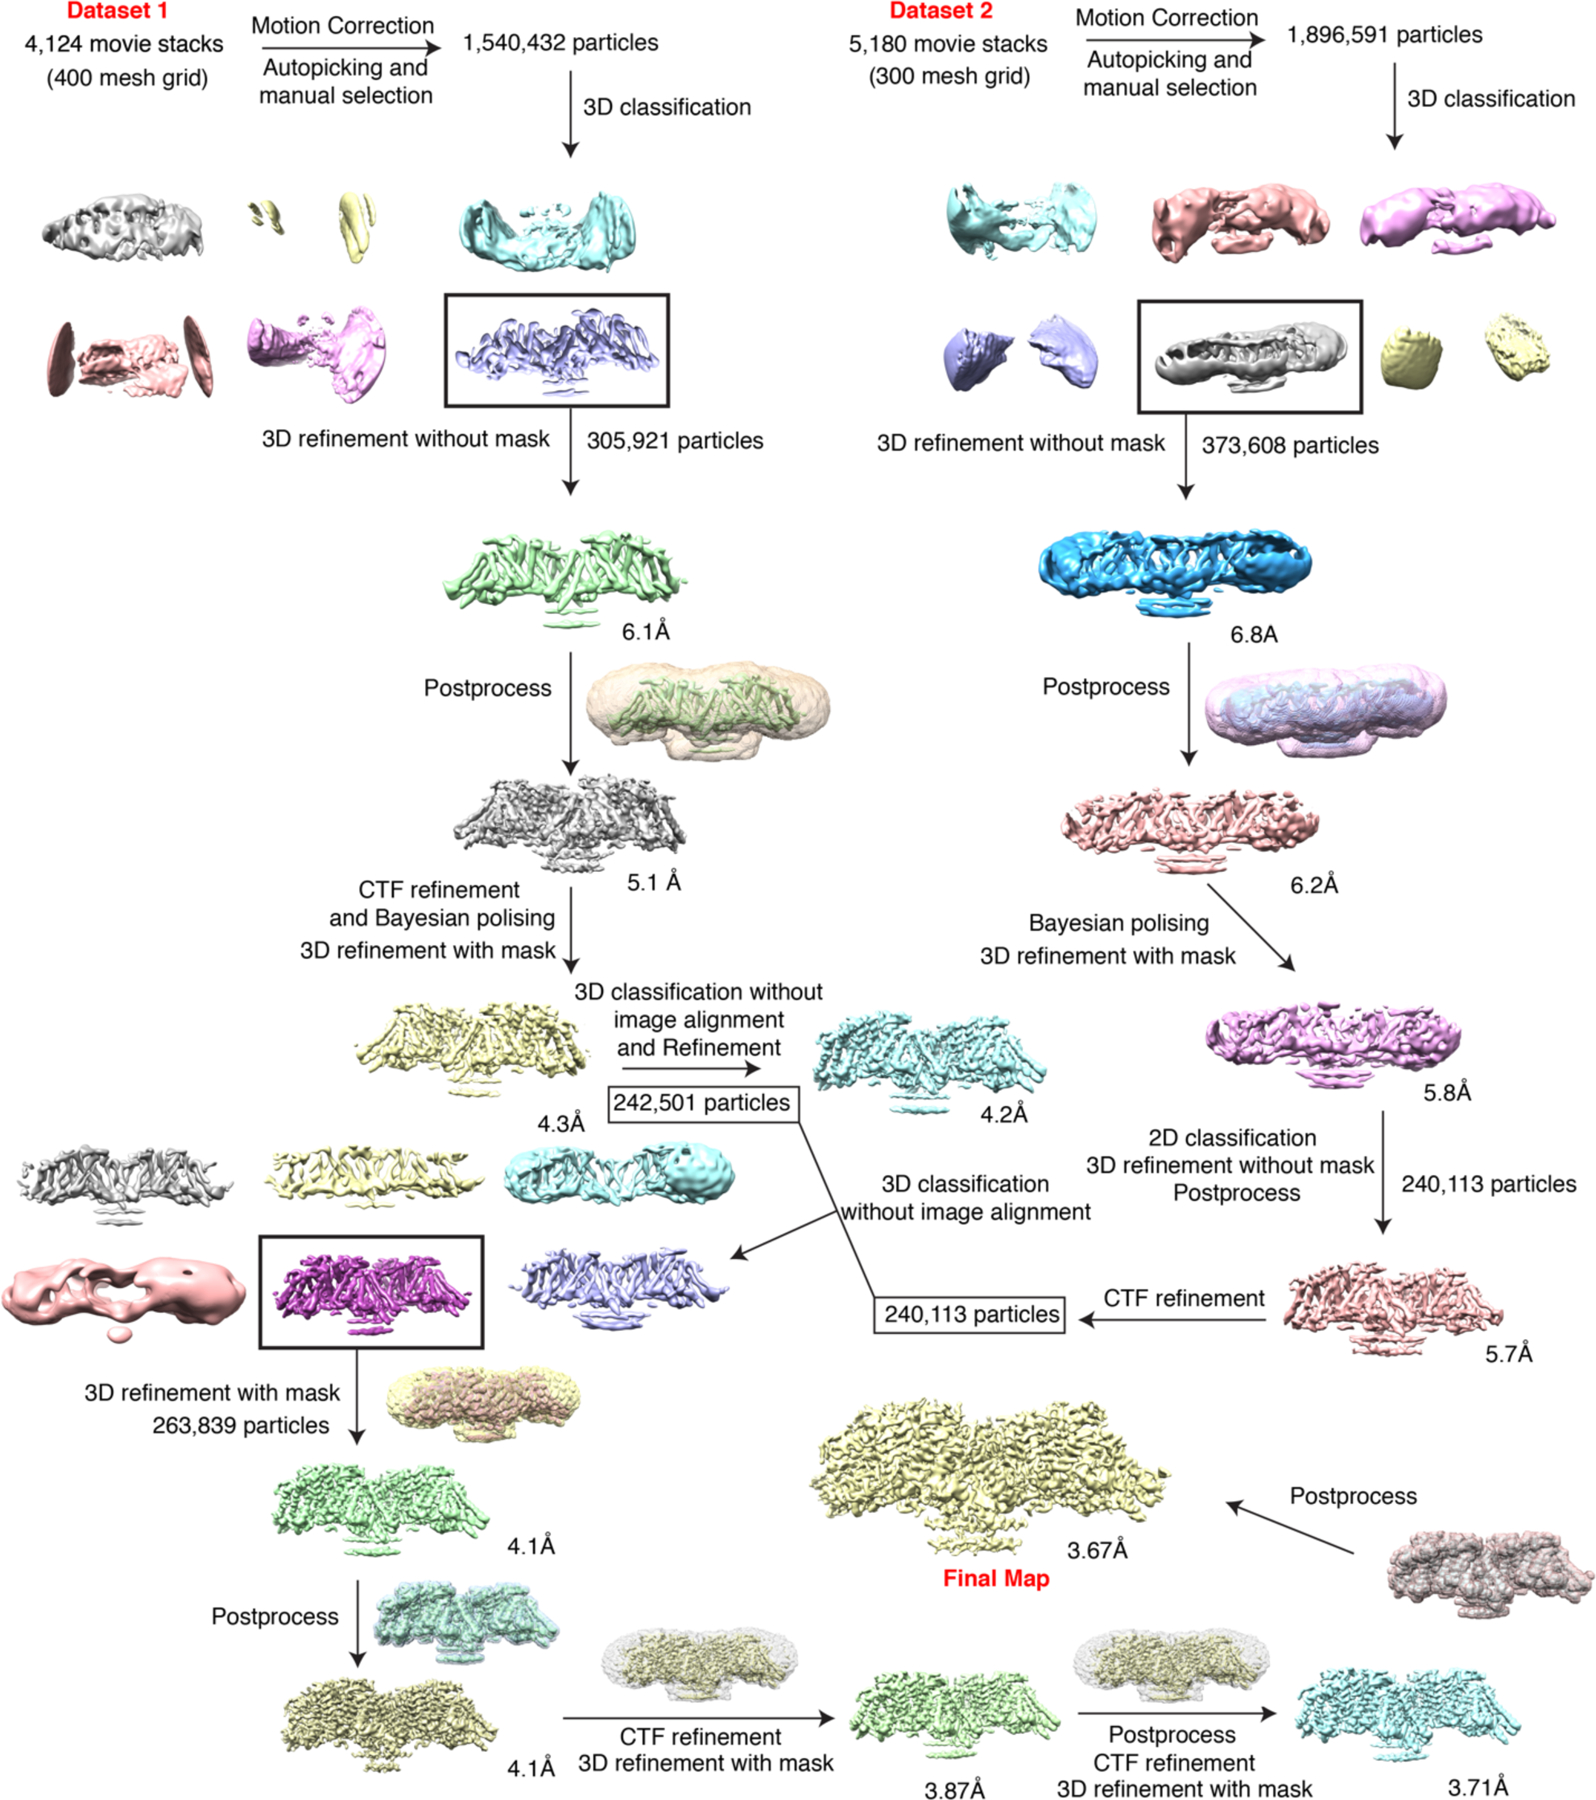
The data processing workflow in RELION-3. The cryo-EM 3D classes as well as the masks used for the refinement are shown. The final cryo-EM map after RELION-3 refinement sharpened using postprocess with a B-factor value of −150 Å2.
Extended Data Fig. 5. FSC curve and local resolution estimation.
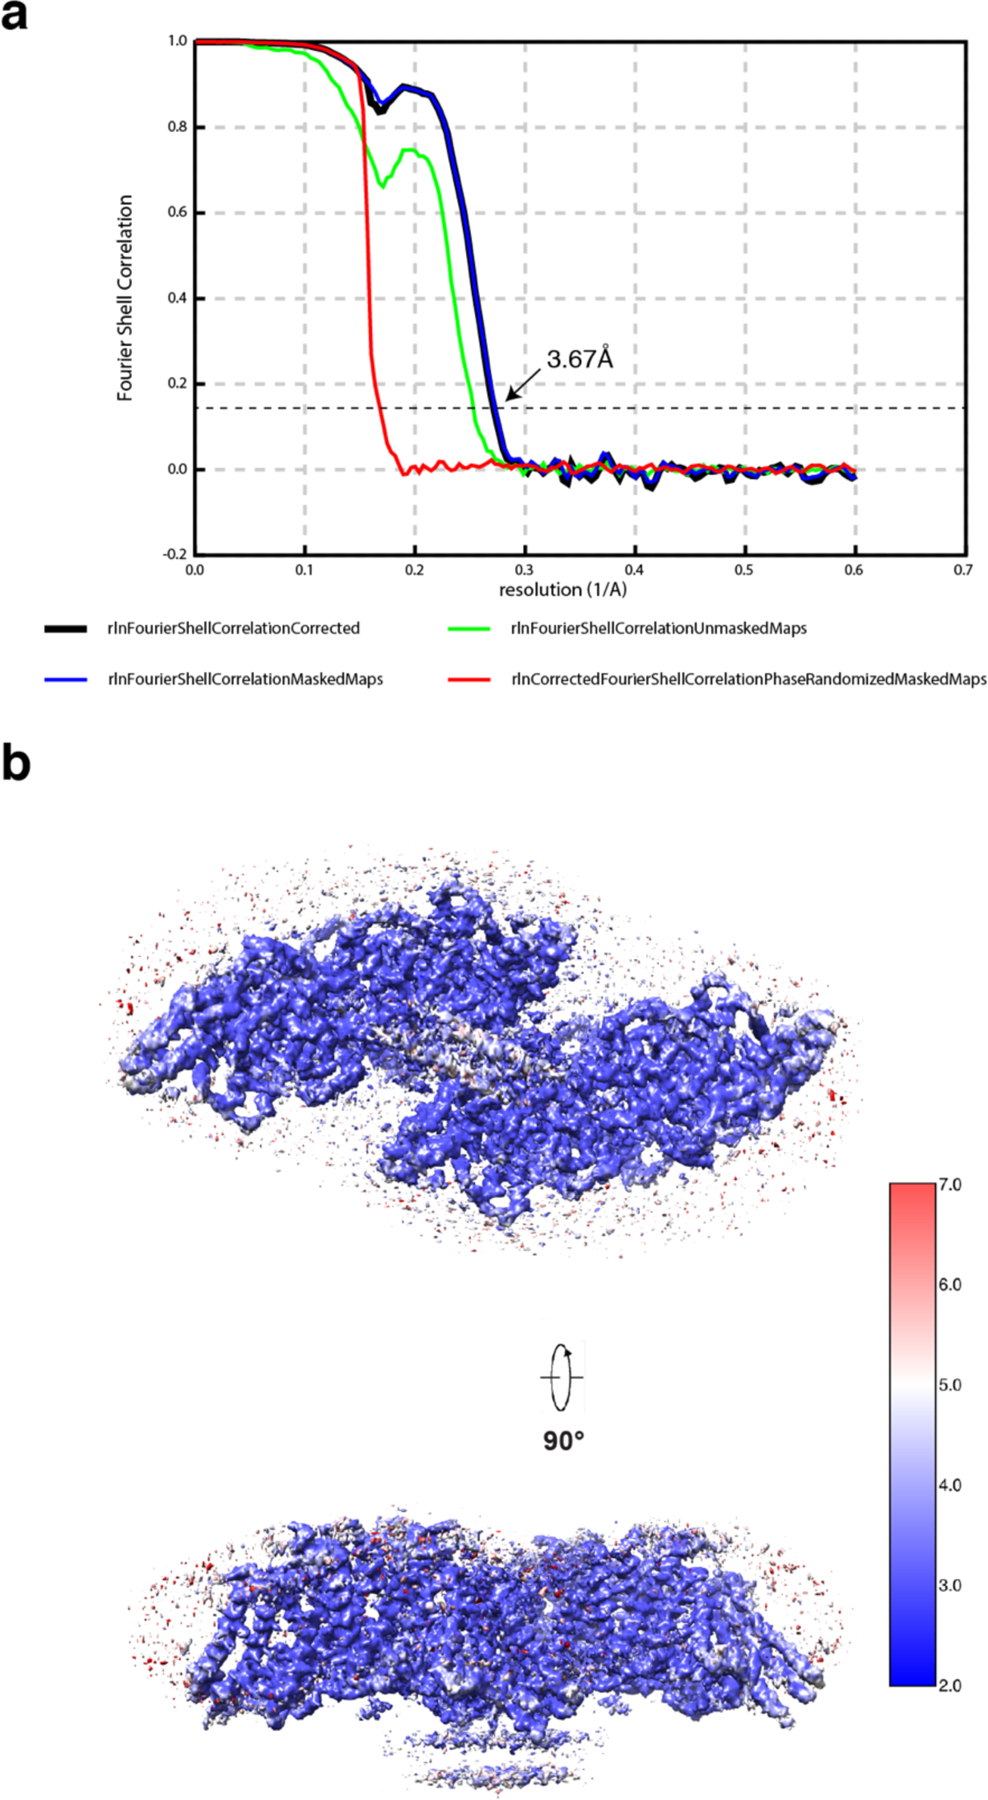
a. Fourier shell correlation (FSC) curve as a function of resolution using RELION-3 output. b. Density maps of structure colored by local resolution estimation using ResMap.
Extended Data Fig. 6. cryo-EM map of structural elements.
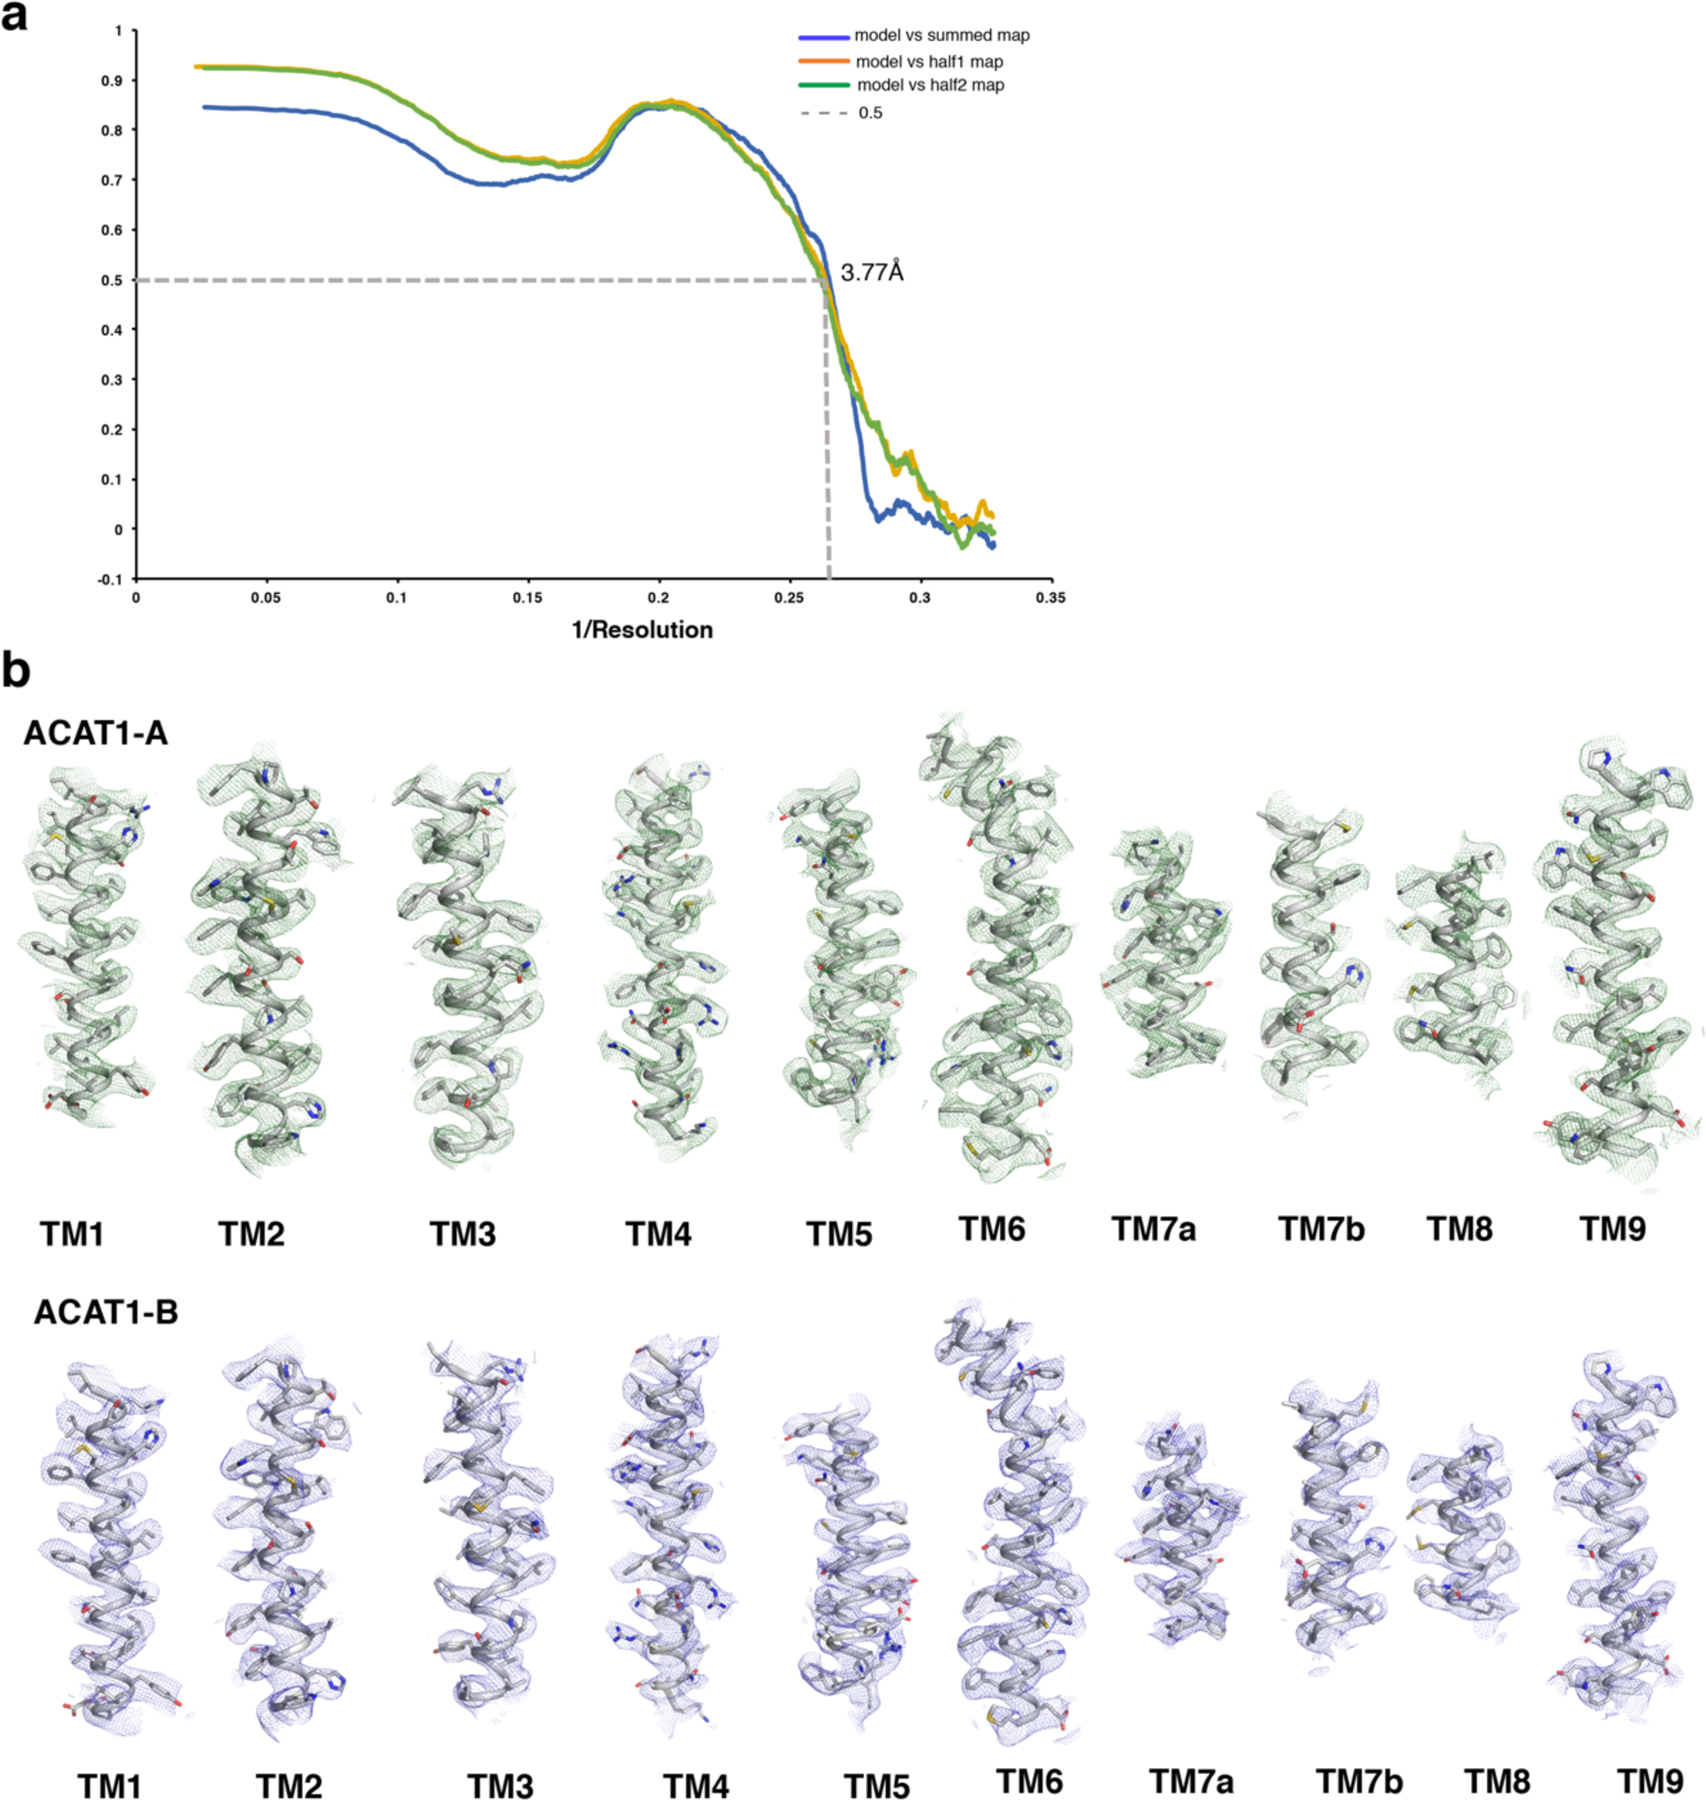
a. The FSC curves calculated between the refined structure model and the half map used for refinement (blue), the other half map (gray) and the full map (yellow). b. The major helices of ACAT1-A and ACAT1-B. EM density map and model of the complex are shown in mesh and cartoon. Cryo-EM maps are shown at 5σ level.
Extended Data Fig. 7. Structural comparison of ACAT1 and DltB.
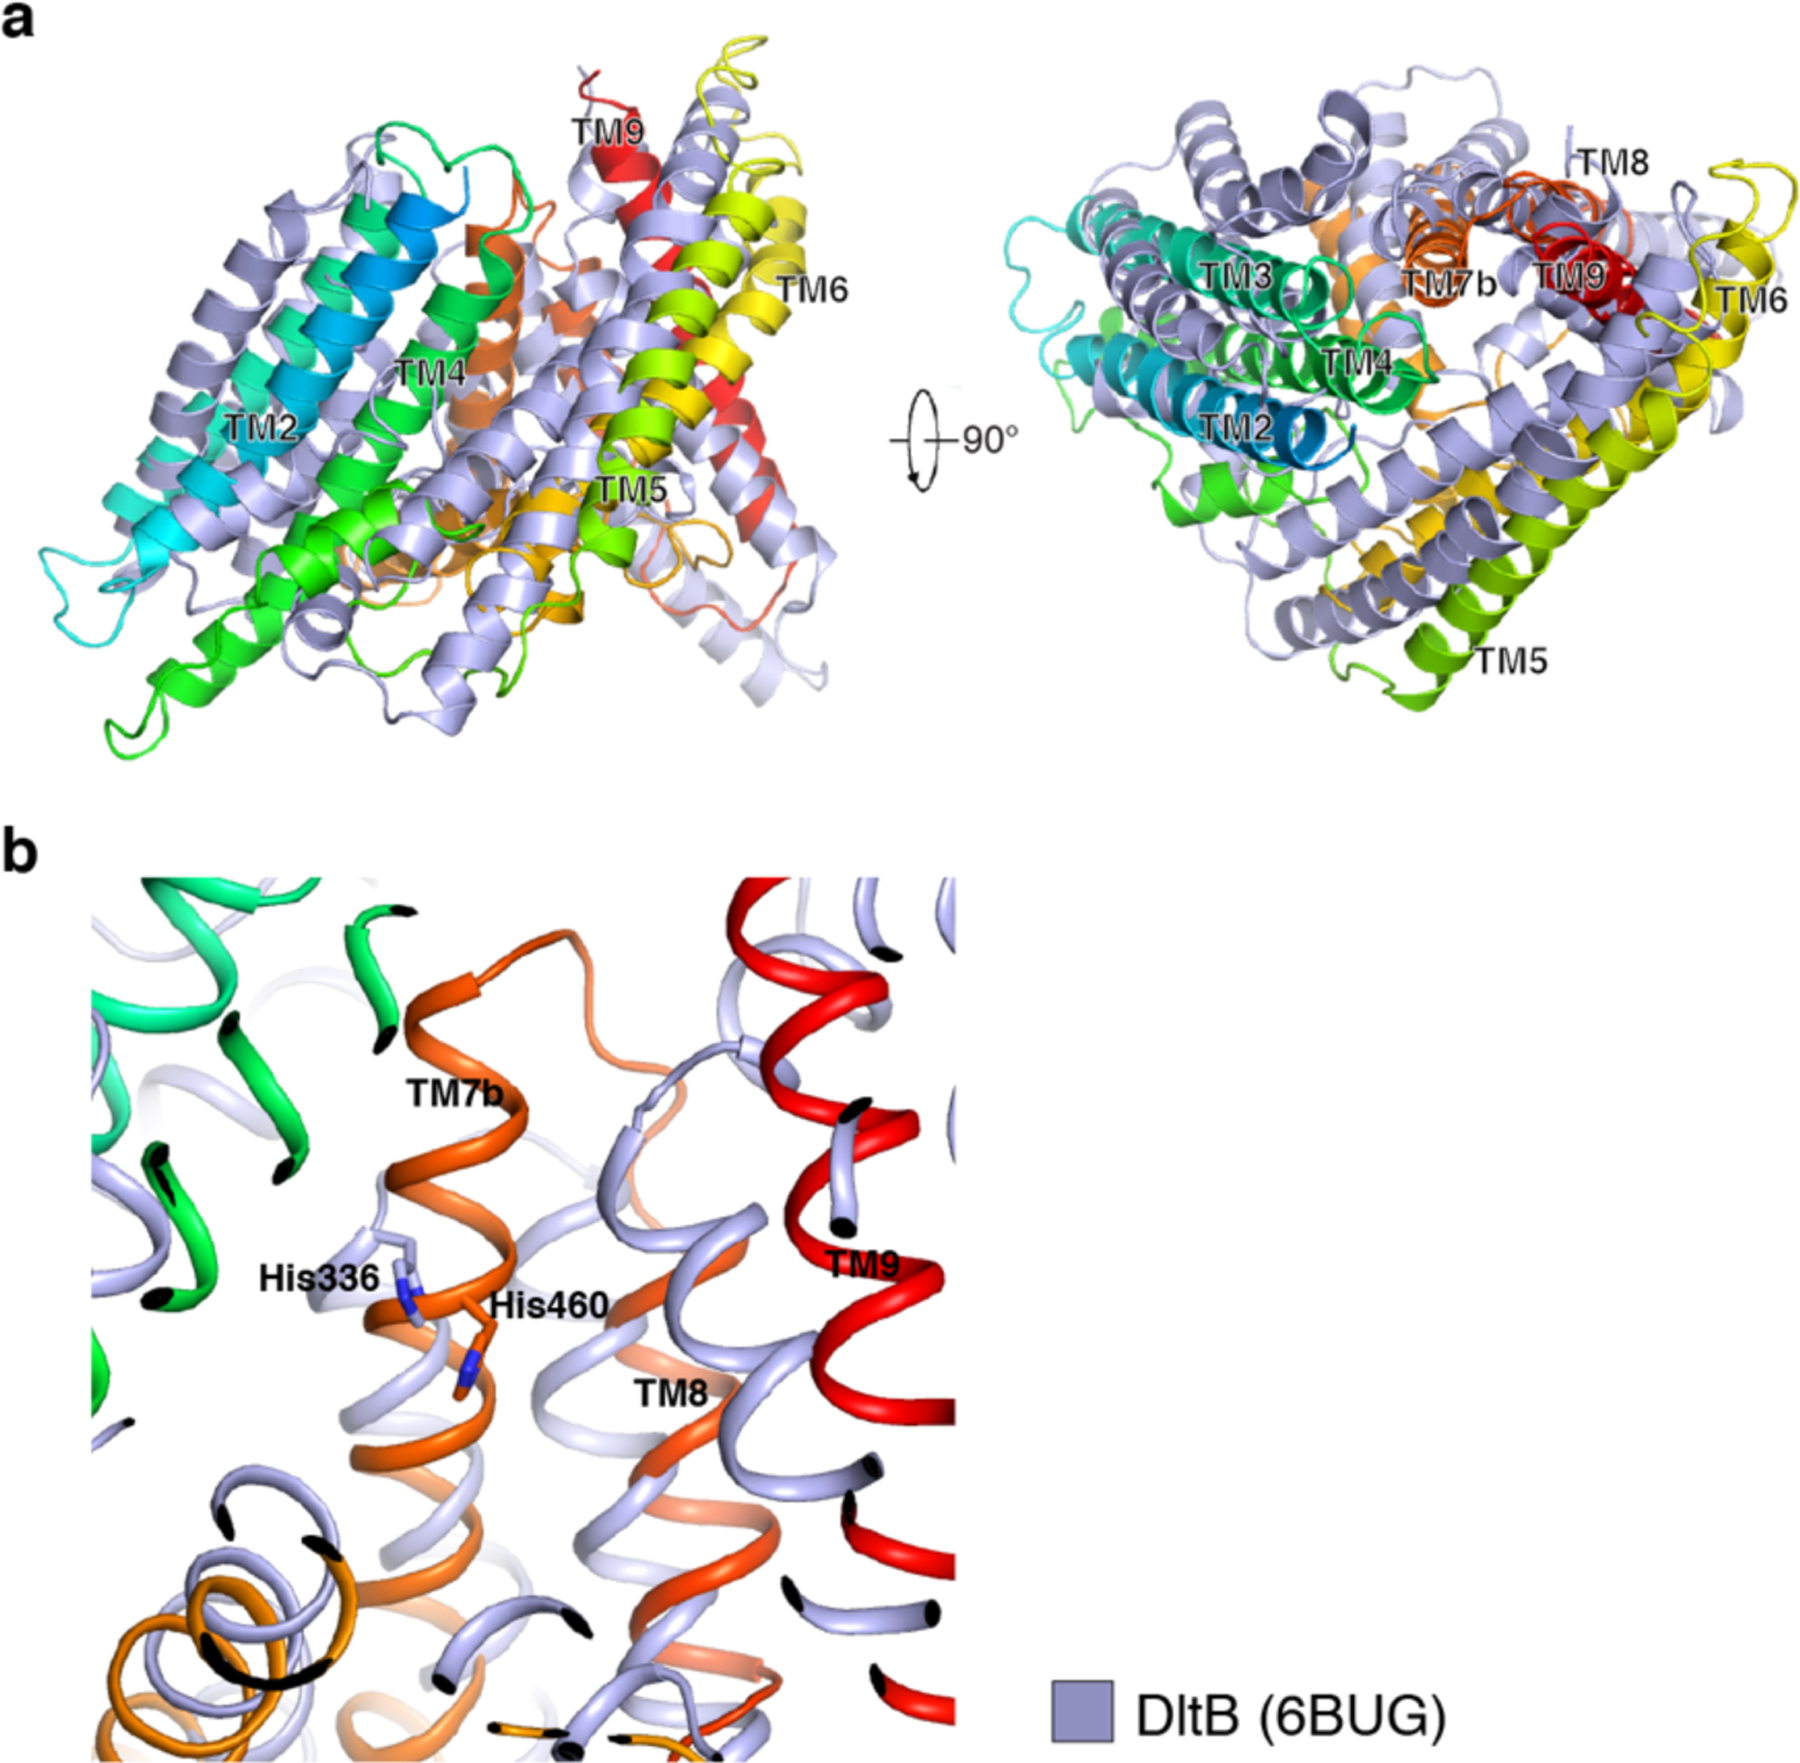
a. Structural comparison from parallel to the membrane view (left) and from the lumen view (right). b. Structural comparison of the catalytic sites of ACAT1 and DltB. The catalytic Histidine residues are shown in sticks.
Extended Data Fig. 8. Purification of human ACAT1 variants for activity assays.
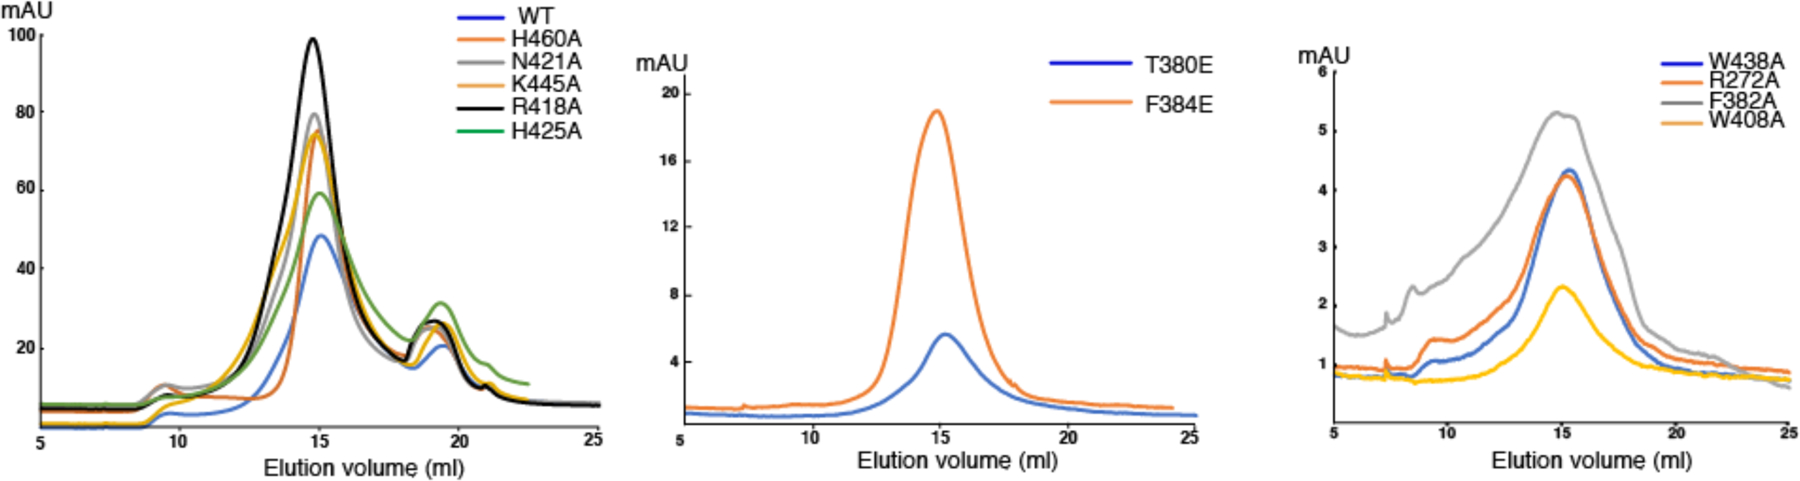
Representative Superose 6 increase 10/30 gel-filtration chromatogram of ACAT1 variants in buffer containing 20 mM Hepes, pH 7.5, 150 mM NaCl and 1% Chaps.
Extended Data Fig. 9. The putative allosteric sites in the ACAT1.
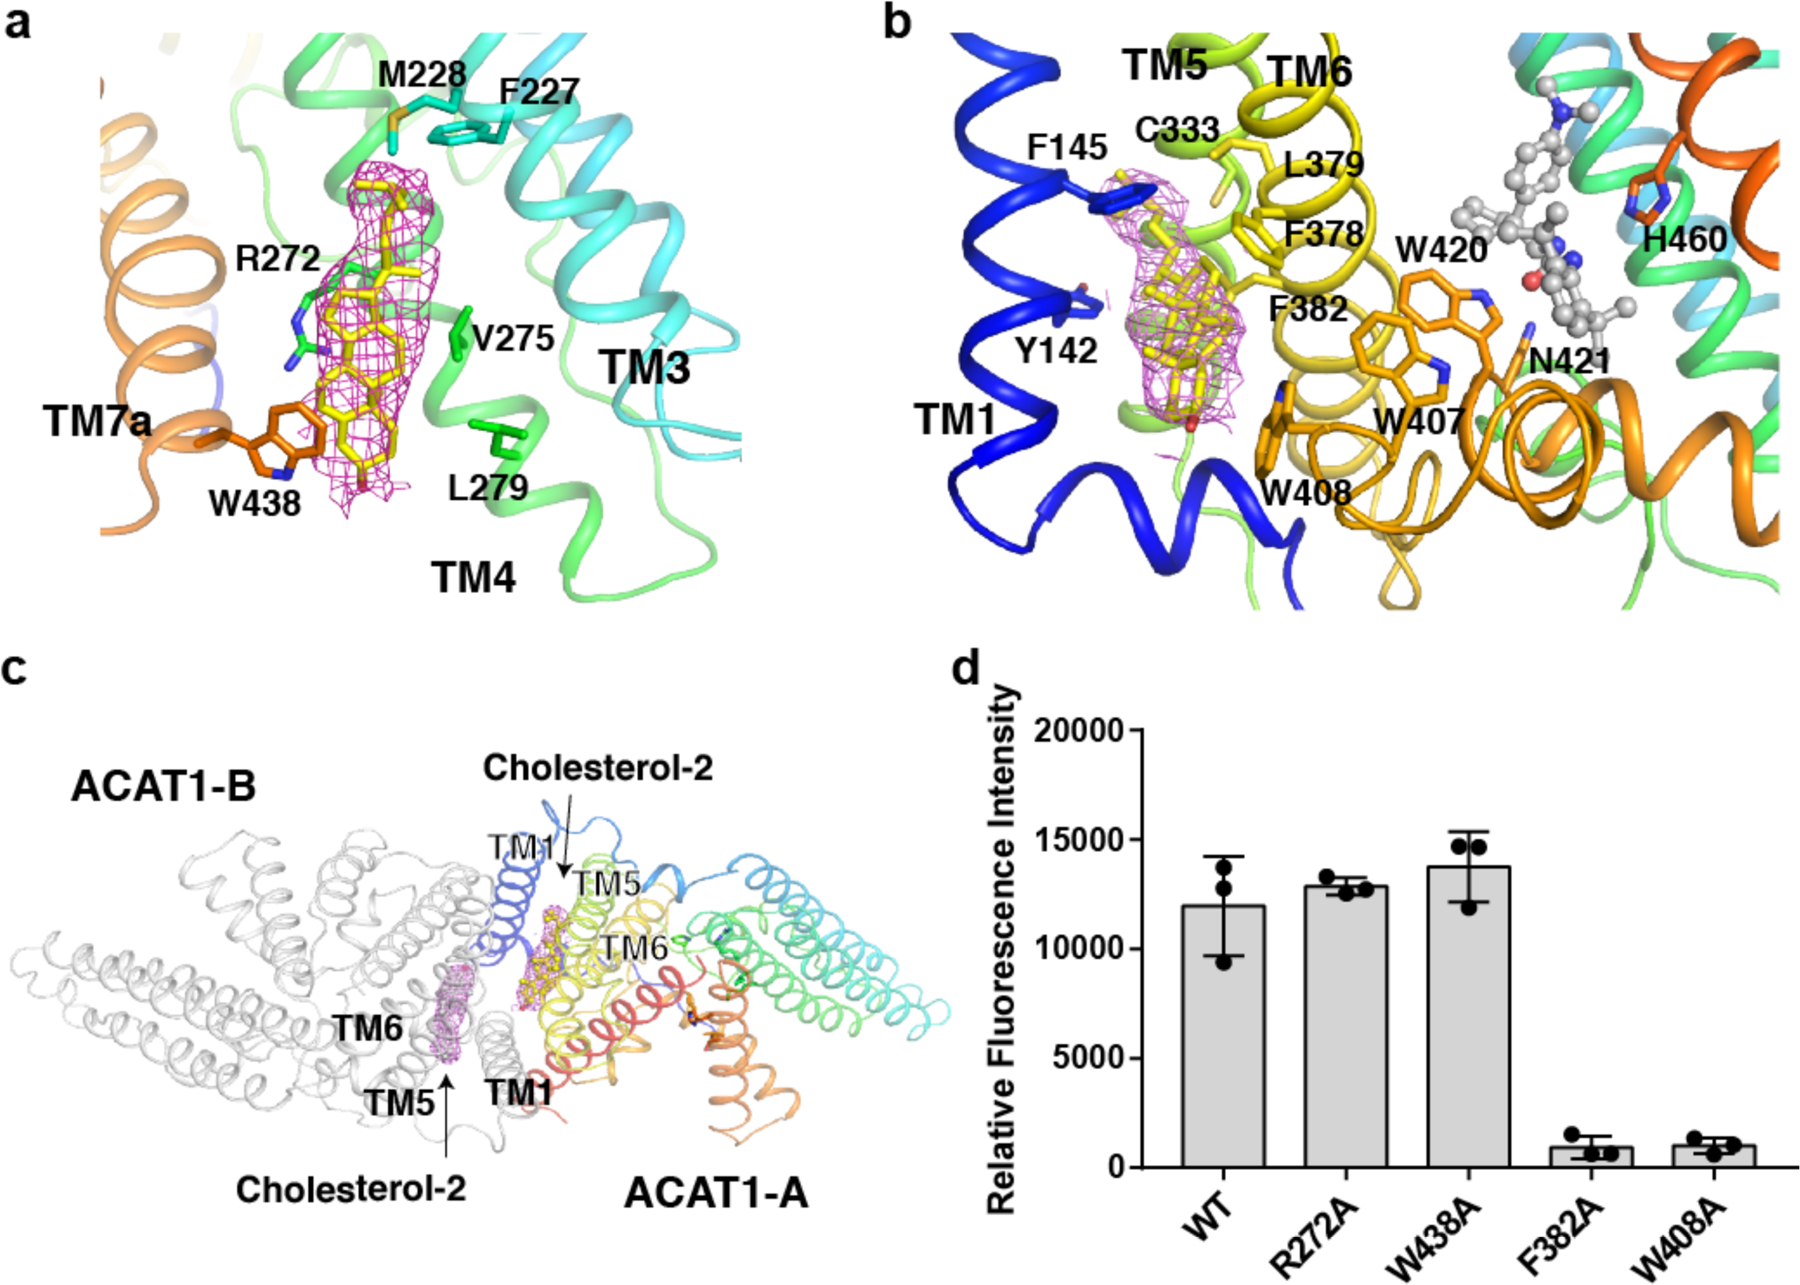
a. Putative allosteric site 1. Cholesterol (yellow) may have hydrophobic contact with residues to stabilize TM4. b. Putative allosteric site 2. Cholesterol (yellow) may have hydrophobic contact with residues to stabilize TM6. c. Putative allosteric site 2 in ACAT1 dimer. The Cryo-EM maps of cholesterol are shown at 5σ level. d. Functional validation of the putative allosteric sites. Data are mean ± s.d. (n=3 independent experiments).
Extended Data Table 1.
Cryo-EM data collection, refinement and validation statistics
| ACAT1-nevanimibe (EMDB-21390) (PDB-6VUM) | |
|---|---|
| Data collection and processing | |
| Magnification | 60024 |
| Voltage (kV) | 300 |
| Electron exposure (e–/Å2) | 60 |
| Defocus range (μm) | −1.0 to −2.0 |
| Pixel size (Å) | 0.833 |
| Symmetry imposed | C2 |
| Initial particle images (no.) | 3,437,023 |
| Final particle images (no.) | 263,839 |
| Map resolution (Å) | 3.67 |
| FSC threshold | 0.143 |
| Refinement | |
| Model resolution (Å) | 3.77 |
| FSC threshold | 0.5 |
| Map sharpening B factor (Å2) | −150 |
| Model composition | |
| Non-hydrogen atoms | 14388 |
| Protein residues | 1636 |
| Ligands | 22 |
| B factors (Å2) | |
| Protein | 115.83 |
| Ligand | 74.13 |
| R.m.s. deviations | |
| Bond lengths (Å) | 0.008 |
| Bond angles (°) | 1.191 |
| Validation | |
| MolProbity score | 1.80 |
| Clashscore | 4.15 |
| Poor rotamers (%) | 1.12 |
| Ramachandran plot | |
| Favored (%) | 89.31 |
| Allowed (%) | 10.69 |
| Disallowed (%) | 0 |
Acknowledgements:
We thank M. Brown and J. Goldstein for their invaluable support throughout the project. Data were collected at the UT Southwestern Medical Center Cryo-EM Facility (funded in part by the CPRIT Core Facility Support Award RP170644). We thank D. Stoddard for assistance in data collection, R. DeBose-Boyd, L. Esparza and L. Friedberg for technical support, E. Coutavas, E. Debler for discussion and A. Lemoff at the UT Southwestern Proteomics Core for mass spectrometry identification. This work was supported by NIH grant P01 HL020948, R01 GM134700 and R01 GM135343, the Endowed Scholars Program in Medical Science of UT Southwestern Medical Center, O’Donnell Junior Faculty Funds, Welch Foundation (I-1957) (to X.L.). X.Q. is the recipient of a DDBrown Fellow of the Life Sciences Research Foundation. X.L. is a Damon Runyon-Rachleff Innovator supported by the Damon Runyon Cancer Research Foundation (DRR-53–19) and a Rita C. and William P. Clements Jr. Scholar in Biomedical Research at UT Southwestern Medical Center.
Footnotes
Competing interests The authors declare no competing interests.
Data Availability
The 3D cryo-EM density map has been deposited in the Electron Microscopy Data Bank under the accession numbers EMD-21390. Atomic coordinate for the atomic model has been deposited in the Protein Data Bank under the accession numbers 6VUM. All other data is available from the corresponding authors upon reasonable request.
References:
- 1.Radhakrishnan A, Goldstein JL, McDonald JG & Brown MS Switch-like control of SREBP-2 transport triggered by small changes in ER cholesterol: a delicate balance. Cell metabolism 8, 512–521, doi: 10.1016/j.cmet.2008.10.008 (2008). [DOI] [PMC free article] [PubMed] [Google Scholar]
- 2.Rogers MA et al. Acyl-CoA:cholesterol acyltransferases (ACATs/SOATs): Enzymes with multiple sterols as substrates and as activators. J Steroid Biochem Mol Biol 151, 102–107, doi: 10.1016/j.jsbmb.2014.09.008 (2015). [DOI] [PMC free article] [PubMed] [Google Scholar]
- 3.Goldstein JL & Brown MS The LDL receptor. Arteriosclerosis, thrombosis, and vascular biology 29, 431–438, doi: 10.1161/ATVBAHA.108.179564 (2009). [DOI] [PMC free article] [PubMed] [Google Scholar]
- 4.Hutter-Paier B et al. The ACAT inhibitor CP-113,818 markedly reduces amyloid pathology in a mouse model of Alzheimer’s disease. Neuron 44, 227–238, doi: 10.1016/j.neuron.2004.08.043 (2004). [DOI] [PubMed] [Google Scholar]
- 5.Yagyu H et al. Absence of ACAT-1 attenuates atherosclerosis but causes dry eye and cutaneous xanthomatosis in mice with congenital hyperlipidemia. The Journal of biological chemistry 275, 21324–21330, doi: 10.1074/jbc.M002541200 (2000). [DOI] [PubMed] [Google Scholar]
- 6.Yang W et al. Potentiating the antitumour response of CD8(+) T cells by modulating cholesterol metabolism. Nature 531, 651–655, doi: 10.1038/nature17412 (2016). [DOI] [PMC free article] [PubMed] [Google Scholar]
- 7.LaPensee CR et al. ATR-101, a Selective and Potent Inhibitor of Acyl-CoA Acyltransferase 1, Induces Apoptosis in H295R Adrenocortical Cells and in the Adrenal Cortex of Dogs. Endocrinology 157, 1775–1788, doi: 10.1210/en.2015-2052 (2016). [DOI] [PubMed] [Google Scholar]
- 8.Brown MS, Radhakrishnan A & Goldstein JL Retrospective on Cholesterol Homeostasis: The Central Role of Scap. Annual review of biochemistry 87, 783–807, doi: 10.1146/annurev-biochem-062917-011852 (2018). [DOI] [PMC free article] [PubMed] [Google Scholar]
- 9.Porter FD & Herman GE Malformation syndromes caused by disorders of cholesterol synthesis. Journal of lipid research 52, 6–34, doi: 10.1194/jlr.R009548 (2011). [DOI] [PMC free article] [PubMed] [Google Scholar]
- 10.Xu Y, Du X, Turner N, Brown AJ & Yang H Enhanced acyl-CoA:cholesterol acyltransferase activity increases cholesterol levels on the lipid droplet surface and impairs adipocyte function. The Journal of biological chemistry 294, 19306–19321, doi: 10.1074/jbc.RA119.011160 (2019). [DOI] [PMC free article] [PubMed] [Google Scholar]
- 11.Masumoto N et al. Membrane bound O-acyltransferases and their inhibitors. Biochem Soc Trans 43, 246–252, doi: 10.1042/BST20150018 (2015). [DOI] [PubMed] [Google Scholar]
- 12.Hofmann K A superfamily of membrane-bound O-acyltransferases with implications for wnt signaling. Trends in biochemical sciences 25, 111–112, doi: 10.1016/s0968-0004(99)01539-x (2000). [DOI] [PubMed] [Google Scholar]
- 13.Ma D et al. Crystal structure of a membrane-bound O-acyltransferase. Nature 562, 286–290, doi: 10.1038/s41586-018-0568-2 (2018). [DOI] [PMC free article] [PubMed] [Google Scholar]
- 14.Chang CC, Huh HY, Cadigan KM & Chang TY Molecular cloning and functional expression of human acyl-coenzyme A:cholesterol acyltransferase cDNA in mutant Chinese hamster ovary cells. The Journal of biological chemistry 268, 20747–20755 (1993). [PubMed] [Google Scholar]
- 15.Anderson RA et al. Identification of a form of acyl-CoA:cholesterol acyltransferase specific to liver and intestine in nonhuman primates. The Journal of biological chemistry 273, 26747–26754, doi: 10.1074/jbc.273.41.26747 (1998). [DOI] [PubMed] [Google Scholar]
- 16.Cases S et al. ACAT-2, a second mammalian acyl-CoA:cholesterol acyltransferase. Its cloning, expression, and characterization. The Journal of biological chemistry 273, 26755–26764, doi: 10.1074/jbc.273.41.26755 (1998). [DOI] [PubMed] [Google Scholar]
- 17.Oelkers P, Behari A, Cromley D, Billheimer JT & Sturley SL Characterization of two human genes encoding acyl coenzyme A:cholesterol acyltransferase-related enzymes. The Journal of biological chemistry 273, 26765–26771, doi: 10.1074/jbc.273.41.26765 (1998). [DOI] [PubMed] [Google Scholar]
- 18.Yu C et al. Role of the N-terminal hydrophilic domain of acyl-coenzyme A:cholesterol acyltransferase 1 on the enzyme’s quaternary structure and catalytic efficiency. Biochemistry 41, 3762–3769, doi: 10.1021/bi0120188 (2002). [DOI] [PubMed] [Google Scholar]
- 19.Guo ZY, Lin S, Heinen JA, Chang CC & Chang TY The active site His-460 of human acyl-coenzyme A:cholesterol acyltransferase 1 resides in a hitherto undisclosed transmembrane domain. The Journal of biological chemistry 280, 37814–37826, doi: 10.1074/jbc.M508384200 (2005). [DOI] [PubMed] [Google Scholar]
- 20.Nissen SE et al. Effect of ACAT inhibition on the progression of coronary atherosclerosis. The New England journal of medicine 354, 1253–1263, doi: 10.1056/NEJMoa054699 (2006). [DOI] [PubMed] [Google Scholar]
- 21.Cao J et al. Targeting Acyl-CoA:diacylglycerol acyltransferase 1 (DGAT1) with small molecule inhibitors for the treatment of metabolic diseases. The Journal of biological chemistry 286, 41838–41851, doi: 10.1074/jbc.M111.245456 (2011). [DOI] [PMC free article] [PubMed] [Google Scholar]
- 22.Long T et al. Structural basis for human sterol isomerase in cholesterol biosynthesis and multidrug recognition. Nature communications 10, 2452, doi: 10.1038/s41467-019-10279-w (2019). [DOI] [PMC free article] [PubMed] [Google Scholar]
- 23.Guo ZY, Chang CC & Chang TY Functionality of the seventh and eighth transmembrane domains of acyl-coenzyme A:cholesterol acyltransferase 1. Biochemistry 46, 10063–10071, doi: 10.1021/bi7011367 (2007). [DOI] [PubMed] [Google Scholar]
- 24.Das A, Davis MA & Rudel LL Identification of putative active site residues of ACAT enzymes. Journal of lipid research 49, 1770–1781, doi: 10.1194/jlr.M800131-JLR200 (2008). [DOI] [PMC free article] [PubMed] [Google Scholar]
- 25.Schneidman-Duhovny D, Inbar Y, Nussinov R & Wolfson HJ PatchDock and SymmDock: servers for rigid and symmetric docking. Nucleic acids research 33, W363–367, doi: 10.1093/nar/gki481 (2005). [DOI] [PMC free article] [PubMed] [Google Scholar]
- 26.Li X, Roberti R & Blobel G Structure of an integral membrane sterol reductase from Methylomicrobium alcaliphilum. Nature, doi: 10.1038/nature13797 (2014). [DOI] [PMC free article] [PubMed]
- 27.Liu J, Chang CC, Westover EJ, Covey DF & Chang TY Investigating the allosterism of acyl-CoA:cholesterol acyltransferase (ACAT) by using various sterols: in vitro and intact cell studies. The Biochemical journal 391, 389–397, doi: 10.1042/BJ20050428 (2005). [DOI] [PMC free article] [PubMed] [Google Scholar]
- 28.Li X, Saha P, Li J, Blobel G & Pfeffer SR Clues to the mechanism of cholesterol transfer from the structure of NPC1 middle lumenal domain bound to NPC2. Proceedings of the National Academy of Sciences of the United States of America 113, 10079–10084, doi: 10.1073/pnas.1611956113 (2016). [DOI] [PMC free article] [PubMed] [Google Scholar]
- 29.Pfeffer SR NPC intracellular cholesterol transporter 1 (NPC1)-mediated cholesterol export from lysosomes. The Journal of biological chemistry 294, 1706–1709, doi: 10.1074/jbc.TM118.004165 (2019). [DOI] [PMC free article] [PubMed] [Google Scholar]
- 30.Long T et al. Structural basis for itraconazole-mediated NPC1 inhibition. Nature communications 11, 152, doi: 10.1038/s41467-019-13917-5 (2020). [DOI] [PMC free article] [PubMed] [Google Scholar]
Method References:
- 31.Chang CC et al. Recombinant acyl-CoA:cholesterol acyltransferase-1 (ACAT-1) purified to essential homogeneity utilizes cholesterol in mixed micelles or in vesicles in a highly cooperative manner. The Journal of biological chemistry 273, 35132–35141, doi: 10.1074/jbc.273.52.35132 (1998). [DOI] [PubMed] [Google Scholar]
- 32.Li X et al. Electron counting and beam-induced motion correction enable near-atomic-resolution single-particle cryo-EM. Nature methods 10, 584–590, doi: 10.1038/nmeth.2472 (2013). [DOI] [PMC free article] [PubMed] [Google Scholar]
- 33.Rohou A & Grigorieff N CTFFIND4: Fast and accurate defocus estimation from electron micrographs. Journal of structural biology 192, 216–221, doi: 10.1016/j.jsb.2015.08.008 (2015). [DOI] [PMC free article] [PubMed] [Google Scholar]
- 34.Zivanov J et al. New tools for automated high-resolution cryo-EM structure determination in RELION-3. eLife 7, doi: 10.7554/eLife.42166 (2018). [DOI] [PMC free article] [PubMed] [Google Scholar]
- 35.Adams PD et al. PHENIX: a comprehensive Python-based system for macromolecular structure solution. Acta crystallographica. Section D, Biological crystallography 66, 213–221, doi: 10.1107/S0907444909052925 (2010). [DOI] [PMC free article] [PubMed] [Google Scholar]
- 36.Emsley P & Cowtan K Coot: model-building tools for molecular graphics. Acta crystallographica. Section D, Biological crystallography 60, 2126–2132, doi: 10.1107/S0907444904019158 (2004). [DOI] [PubMed] [Google Scholar]
- 37.Luu W, Hart-Smith G, Sharpe LJ & Brown AJ The terminal enzymes of cholesterol synthesis, DHCR24 and DHCR7, interact physically and functionally. Journal of lipid research 56, 888–897, doi: 10.1194/jlr.M056986 (2015). [DOI] [PMC free article] [PubMed] [Google Scholar]
- 38.Murshudov GN, Vagin AA & Dodson EJ Refinement of macromolecular structures by the maximum-likelihood method. Acta crystallographica. Section D, Biological crystallography 53, 240–255, doi: 10.1107/S0907444996012255 (1997). [DOI] [PubMed] [Google Scholar]
- 39.Chen VB et al. MolProbity: all-atom structure validation for macromolecular crystallography. Acta crystallographica. Section D, Biological crystallography 66, 12–21, doi: 10.1107/S0907444909042073 (2010). [DOI] [PMC free article] [PubMed] [Google Scholar]
- 40.Kucukelbir A, Sigworth FJ & Tagare HD Quantifying the local resolution of cryo-EM density maps. Nature methods 11, 63–65, doi: 10.1038/nmeth.2727 (2014). [DOI] [PMC free article] [PubMed] [Google Scholar]
- 41.Pettersen EF et al. UCSF Chimera--a visualization system for exploratory research and analysis. Journal of computational chemistry 25, 1605–1612, doi: 10.1002/jcc.20084 (2004). [DOI] [PubMed] [Google Scholar]
Associated Data
This section collects any data citations, data availability statements, or supplementary materials included in this article.
Data Availability Statement
The 3D cryo-EM density map has been deposited in the Electron Microscopy Data Bank under the accession numbers EMD-21390. Atomic coordinate for the atomic model has been deposited in the Protein Data Bank under the accession numbers 6VUM. All other data is available from the corresponding authors upon reasonable request.