

Abstract
The acute systemic inflammatory response syndrome (SIRS) and multiorgan dysfunction (MOD) that occur in large burn injuries may be attributed, in part, to immunosuppressive responses such as decreased lymphocytes. However, the mitochondrial bioenergetics of lymphocytes after severe burn injury are poorly understood. The purpose of this study was to examine mitochondrial function of lymphocytes following severe burns in a swine model. Anesthetized Yorkshire swine (n = 17) sustained 40% total body surface area full-thickness contact burns. Blood was collected at pre-injury (Baseline; BL) and at 24 and 48 h after injury for complete blood cell analysis, flow cytometry, cytokine analysis, and ficoll separation of intact lymphocytes for high-resolution mitochondrial respirometry analysis. While neutrophil numbers increased, a concomitant decrease was found in lymphocytes (P < 0.001) after burn injury, which was not specific to CD4+ or CD8+ lymphocytes. No changes in immune cell population were observed from 24 h to 48 h post-injury. IL 12-23 decreased while a transient increase in IL 4 was found from BL to 24h (P < 0.05). CRP progressively increased from BL to 24h (P < 0.05) and 48h (P < 0.001) post-injury. Routine and maximal mitochondrial respiration progressively increased from BL to 24h (P < 0.05) and 48 h post-injury (P < 0.001). No changes were found in leak respiration or residual oxygen consumption. When considering the reduction in lymphocyte number, the total peripheral lymphocyte bioenergetics per volume of blood significantly decreased from BL to 24h and 48h (P < 0.05). For the first time, we were able to measure mitochondrial activity in intact lymphocyte mitochondria through high-resolution respirometry in a severely burned swine model. Our data showed that the non-specific reduction in peripheral T cells after injury was larger than the increased mitochondrial activity in those cells, which may be a compensatory mechanism for the total reduction in lymphocytes. Additional studies in the metabolic activation of T cell subpopulations may provide diagnostic or therapeutic targets after severe burn injury.
Keywords: Burn, mitochondria, lymphocyte, swine, oxidative phosphorylation
Introduction
Burn injury is a worldwide concern, with approximately 11 million burn victims requiring medical attention annually.1 Fortunately, the incidence of burn injuries in the United States has been decreasing,2 although there were over 400,000 burn cases in the United States in 2008.1 Additionally, while most burns are acutely survivable, approximately 300,000 deaths globally can be attributed to burn injury each year.1 Even when a burn patient survives the initial insult, various complications can cause significant morbidity and mortality.
Systemic hyper-metabolic and hyper-inflammatory stress responses are hallmarks of severe burn injury that covers over 20% of the total body surface area (TBSA).3 There is a distinct temporal response to the injury pattern of severe burns. The initial phase, typically within the first 48 h post-injury, is termed the “ebb phase” and is characterized by a decrease in cardiac output and metabolic rate.4 Subsequently, the “flow phase” is marked by increased cardiac output and metabolic rate with concurrent increases in cytokine levels,4,5 which can persist long after the burn wound has healed. This injury response may lead to the development of multiple organ dysfunction (MOD),6 and increase the risk of sepsis and infection, increasing morbidity and mortality.7 The innate and adaptive immune responses may play a key role in the metabolic switch from the ebb to flow phases; however, this is largely unstudied.
The lymphocyte immunophenotype is a reflection of immune system function.8 CD4+T cells and CD8+T cells comprise a large portion of T-lymphocytes. CD4+T cells have multiple functions that are crucial in regulating the response of the innate and adaptive immune systems.9 CD8+T cells also have diverse roles in combating pathogens in the immune response and have a symbiotic supportive role with CD4+T cells.10 Especially in the context of increased susceptibility to infectious complications, burn-induced immunosuppression facilitates the development of MOD, SIRS, and sepsis following severe burns.11 For example, a reduction in peripheral lymphocyte population has been shown in both human and animal studies,8,12–15 In addition to the decreased population, it was shown that these cells are also less active after thermal injury.16 Whether an underlying cause of this depressed activation is due to the altered metabolic capacity of lymphocytes in the acute time frame post-burn has not been studied in detail.
In this regard, mitochondria are ubiquitous organelles present in living cells that provide cellular energy predominantly by oxidative phosphorylation. Proper lymphocyte mitochondrial function is necessary for maintaining immune cell function by playing a central role in, for example, activation signaling and immunophenotype differentiation.17 It has been suggested that altered mitochondrial function may play a role in the suppressed immune response in severe burn injury and sepsis.18–21 However, whether the mitochondrial activity is up-regulated or depressed remains unclear. For example, Cheng and colleagues found a reduction in maximum oxygen consumption in peripheral blood mononuclear cells,22 whereas Sjovall and colleagues found increased mitochondrial respiratory capacity in peripheral blood immune cells of septic patients.18
Studies specific to burn injury have shown altered mitochondrial activity in specific organs such as adipose tissues,23 skeletal muscle,24,25 and lung and heart tissues.26 However, the mitochondrial function of peripheral immune cells following burn injury (specifically the function of electron transport chain in mitochondrial oxidative phosphorylation) has not been studied in detail. The overall purpose of this study was to examine peripheral lymphocyte populations and mitochondrial function following 40% TBSA burn in a swine model. We find that while mitochondrial activity of each T cell increased post-burn, this increased activity is not sufficient to account for the drop in overall T cell number.
Methods
Animals
This study utilized adult female Yorkshire swine weighing 41.7 ± 3.0 kg (Midwest Research Swine, Gibbon, MN) that were free of parasites and infection. Animals were singly housed with ad libitum access to water and allowed to acclimate to the facilities for at least 7 d prior to any procedures. This research was conducted in compliance with the Animal Welfare Act, the implementing Animal Welfare Regulations, and the principles of the Guide for the Care and Use of Laboratory Animals, National Research Council. The facility’s Institutional Animal Care and Use Committee approved all research conducted in this study. The facility where this research was conducted is fully accredited by AAALAC International.
Thermal injury and care were performed as previously described.6,27 Briefly, after an overnight fast, animals were anesthetized with an intramuscular (IM) injection of tiletamine-zolazepam (Telazol, 6 mg/kg), intubated, and put on a ventilator with 1%–3% isoflurane. Prior to the administration of burn injury, hair was removed with clippers followed by shaving cream and razor on the dorsum, flanks, and legs. Then the shaved area was cleaned with chlorohexidine. Standard vascular cut down procedures were conducted to insert two i.v. lines into the left and right jugular veins for blood sampling and i.v. fluid resuscitation. These i.v. lines were secured in place and tunneled to the back of the neck for ease of access. Animals were then given an IM injection (0.1–0.24 mg/kg) of Buprenex-HCl Sustained Release (Veterinary Technologies/ZooPharm, Windsor, CO) for analgesia, which has been shown efficacious for 72 h. Custom designed brass blocks connected to a thermocouple were heated to 100°C and were applied to the skin for 30 s to produce full thickness burns.28 This was repeated until approximately 40% of the TBSA was reached. Afterward, the burn wounds were covered using Ioban Antimicrobial dressings (3M, St. Paul, MN).
Following the burn procedure, animals received resuscitation treatment with i.v. fluids at 15 ml/kg/d. Additionally, oral fluids were given at 15 ml/kg/d with oral rehydration solution (ORS; 75 mOsm/l sodium, 65 mOsm/l chloride, 75 mOsm/l Glc, 20 mOsm/l potassium, and 10 mOsm/l citrate). All animals had unlimited access to dry pelleted pig diet. Animal health and behavior were continuously monitored through interaction and a remote vivarium camera. Light sedation with Midazolam (0.1–0.25 mg/kg) was given when animals (n = 4/17) showed indication of stress or discomfort.
Blood analysis
Baseline (BL) blood samples were taken before thermal injury and at 24 and 48 h after injury for biochemical, mitochondrial, and complete blood cell analysis. Blood samples were collected in K2EDTA-treated BD Vacutainer tubes (Becton Dickinson and Company, Franklin Lakes, NJ). BL, 24 h, and 48 h blood samples were sent to a core biochemistry facility for complete blood cell analysis utilizing the Abbott Cell-Dyn® 3700 Hematology Analyzer system (Abbott Park, IL).
Flow cytometry
To determine CD3+, CD4+ and CD8+T cell population, 200 μl of fresh whole blood collected in a K2EDTA tube was stained with 15 μl of mouse anti-porcine CD3e-FITC (Southern Biotech, Birmingham, AL), 5 μl PE-CYTM7 mouse anti-pig CD4a (BD Biosciences), 2.5 μl PE mouse anti-pig C8a (BD Biosciences, Franklin Lakes, NJ), and 20 μl mouse anti-pig CD45: Alexa Fluor® 647 (Bio-Rad Antibodies, Hercules, CA). Negative isotype controls recommended by the supplier for the previously mentioned Abs were used in a separate tube. Abs were incubated at room temperature for 15 min in a dark space protected from light. After the incubation period, red blood cells were lysed twice with 2.7 ml deionized water for 30 s and subsequent neutralization with 0.3 ml 10× PBS, followed by centrifugation at 1000 g for 5 min at 22°C. Then cells were washed and centrifuged twice with 2 ml 1× PBS. White blood cell (WBC) pellets were resuspended in 1 ml of 1× PBS and data were collected by flow cytometry (BD FACSCantoTMII, BD Biosciences) utilizing BD FACSDIVATM Software (BD Biosciences). Cell population was calculated by using AccuCount Rainbow Fluorescent Particles (106 beads/ml, Spherotech, Lake Forest, IL). Data acquisition was made until 1000 events of AccuCount beads were collected. Lymphocyte population analyses and graphs were made with FLOWJOv10 software (Ashland, OR).
Cytokine analysis
Plasma analyses for C-reactive protein (CRP), IL 12-23, and IL 4 levels were measured by ELISA according to the manufacturer’s protocol (R&D Systems, Minneapolis, MN). Each sample was analyzed in duplicate on a 96-well plate and was read by a microplate reader (Molecular Devices, San Jose, CA).
Mitochondria analysis
Fresh whole blood (2 ml) collected in a K2EDTA-treated BD Vacutainer tube (BD Biosciences) was mixed with 2 ml of 1× Hank’s Balanced Salt Solution (GIBCO® HBSS, Thermo Fisher Scientific, Grand Island, NY). Lymphocytes were isolated using the Ficoll-Paque PLUS (GE Healthcare, Pataskala, OH) procedure according to the manufacturer’s instructions. Approximately 2 ml of plasma from the supernatant was collected for later resuspension of the lymphocytes, which was completed after two washes in HBSS and centrifugation. Cells were counted using the Advia 120 Hematology System (Siemens, Malvern, PA) to ensure a pure lymphocyte population.
Lymphocyte mitochondrial respiration was measured in a 2 ml closed-chamber high-resolution respirometry oxygraph-2k (Oroboros Instruments, Innsbruck, Austria) at a concentration of 1.0 × 10⁶ cells/ml in a constant temperature of 37°C. The oxygen flux (negative time derivative of oxygen concentration) was recorded with DatLab Software (Oroboros Instruments). Air calibrations were performed daily prior to mitochondrial analyses. A substrate-inhibitor-uncoupler-titration (SUIT) protocol for intact cells according to the manufacturer’s instructions was followed for each sample.18,29 Once lymphocytes were put into the closed chamber, respiration supported by substrates in their own plasma was allowed to stabilize to determine physiological levels of Routine (basal) respiration. Afterward, 5 mM of oligomycin, an ATP synthase inhibitor, was added to determine Leak respiration representing uncoupled respiration without producing ATP. Then, the protonophore, carbonyl cyanide p-(trifluoro-methoxy) phenyl-hydrazone (FCCP, 1 mM), was titrated to induce maximal oxygen flux (MOF) potential. Lastly, complex I and complex III were inhibited by adding rotenone (1.0 mM) and antimycin A (5.0 mM), respectively, to determine the residual oxygen flux (ROX). ROX is considered non-mitochondrial respiration.
Statistical analysis
Statistical analyses were conducted using GraphPad Prism software v7 (San Diego, CA). The D’Agostino-Pearson omnibus test for normality was done for all values. An ordinary one-way ANOVA with Tukey’s multiple comparisons test, with a single pooled variance was performed on each normally distributed dataset. A non-parametric Kruskal-Wallis test with Dunn’s multiple comparisons was performed for non-normal data sets or data sets with unequal variances. Values are presented as mean ± SE. Statistical significance was determined when P < 0.05.
Results
Blood analysis
Complete blood cell analysis (Table 1) showed a significant increase from BL to 24h in total WBC (16.9 ± 0.6 vs 19.9 ± 0.9 103 cells/μl, P < 0.01, respectively), primarily driven by an increase in neutrophils from BL to 24 h (4.3 ± 0.4 vs 11.8 ± 1.1 103 cells/μl, P < 0.001, respectively). Conversely, lymphocyte numbers decreased from BL to 24h (11.2 ± 0.7 vs 7.2 ± 0.4 103 cells/μl, P < 0.001, respectively). No significant differences were found in the number of monocytes (Figure 1). Total WBC and their proportion did not change from 24 h to 48 h (P > 0.05). Hemoconcentration was also observed as indicated by increased red blood cells (5.6 ± 0.1 vs 6.5 ± 0.2 106 cells/μl, P < 0.001), hemoglobin (9.7 ± 0.1 vs 11.1 ± 0.3 g/dl, P < 0.001), and hematocrit (29.6 ± 0.5 vs 34.3 ± 0.8%, P < 0.001) from BL to 24 h. However, after 48 h, red blood cells, hemoglobin, and hematocrit returned to BL levels (P < 0.001 vs 24h).
Table 1.
Complete blood cell analysis.
| BL | 24 h | 48 h | |
|---|---|---|---|
| White blood cells (103/μl) | 16.9 ± 0.6 | 19.9 ± 0.9* | 19.3 ± 1.0 |
| Red blood cells (106/μl) | 5.6 ± 0.1 | 6.5 ± 0.2*** | 5.8 ± 0.1+++ |
| Hemoglobin (g/dl) | 9.7 ± 0.1 | 11.1 ± 0.3*** | 9.9 ± 0.2+++ |
| Hematocrit (%) | 29.6 ± 0.5 | 34.3 ± 0.8*** | 30.4 ± 0.6+++ |
| Neutrophils (103/μl) | 4.3 ± 0.4 | 11.8 ± 1.1*** | 11.4 ± 0.9*** |
| Monocytes (103/μl) | 1.0 ± 0.5 | 0.5 ± 0.1 | 0.7 ± 0.1 |
| Lymphocytes (103/μl) | 11.2 ± 0.7 | 7.2 ± 0.4*** | 6.9 ± 0.4*** |
| Platelets (103/μl) | 298 ± 10.1 | 290 ± 12.6 | 271 ± 13.3* |
Values are represented as mean ± SE. *P < 0.05 vs BL; ***P < 0.001 vs BL; +++P < 0.001 vs 24 h
Figure 1.
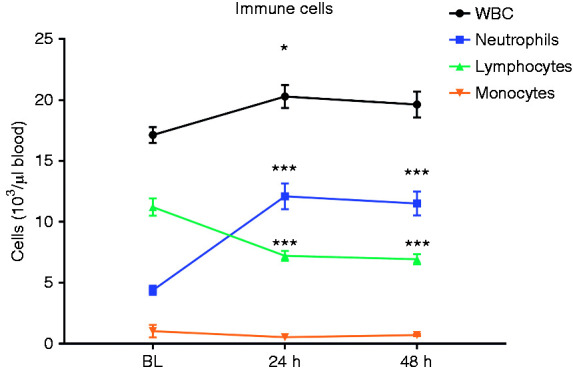
Immune cell population determined by complete blood cell analysis from pre-injury (BL) to 24 h and 48 h post-injury. n = 17. *P < 0.05 vs BL, ***P < 0.001.
Flow cytometry
Flow cytometry analysis (Figure 2) found a significant reduction from BL to 24 h in CD3+ T cells (2693 ± 525 vs 714 ± 117 cells/μl, P < 0.01). CD3+ T cells at 48 h (736 ± 193 cells/μl) remains significantly lower than BL (P < 0.01) but was not different from 24 h (P > 0.05). Similarly, a reduction was found in CD4+ T cells from BL to 24 h (442 ± 104 vs 134 ± 22 cells/μl, P < 0.05, respectively) and 48 h (138 ± 24 cells/μl, P < 0.05). CD8+ T cells decreased from BL to 24 h (867 ± 134 vs 237 ± 32 cells/μl, P < 0.001, respectively) and 48 h (209 ± 29 cells/μl, P < 0.001 vs BL).
Figure 2.

Severe burn injury induces changes in lymphocyte population determined by flow cytometry. Histograms for CD3+ T cells (a), CD4+ T cells (b), and CD8+ T cells (c). We found significant reductions in CD3+ T cells (a), CD4+ T cells (b), and CD8+ T cells (c) at 24 and 48 h post-burn injury compared with pre-injury BL levels. n = 14. *P < 0.05 vs BL, **P < 0.01 vs BL, ***P < 0.001 vs BL.
Cytokine analyses
Our plasma cytokine analysis for IL 12-23 showed significant reductions from BL to 24 h (30.4 ± 1.87 vs 25.8 ± 1.69 μg/μl plasma, P < 0.05, respectively) and 48 h (24.6 ± 1.53 μg/μl plasma, P < 0.001 vs BL). Similar to the changes in T-cell populations, IL 12-23 levels were not different between 24 h and 48 h (Figure 3a). IL 4 significantly increased from BL to 24 h (8.65 ± 0.89 vs 10.8 ± 1.31 ng/ml plasma, P < 0.05, respectively), but returned to BL level after 48 h (9.55 ± 0.98 ng/ml plasma, P < 0.05 vs 24 h) (Figure 3b). CRP increased from BL to 24 h (52.9 ± 25.3 and 314 ± 22.5 μg/ml plasma, P < 0.05, respectively) and 48 h (448 ± 24.0 μg/ml plasma, P < 0.001 vs BL). We also found that CRP significantly increased from BL to 24 h to 48 h (P < 0.05) (Figure 3c).
Figure 3.

Cytokine analyses in plasma at BL, 24 h and 48 h post-burn injury measured by ELISA revealed a significant reduction in IL 12-23 (a) at 24 h and 48 h vs BL. IL 4 levels increased at 24 h but returned to BL level after 48 h (b). CRP levels continued to rise from BL to 24 h and further at 48 h (c). n = 12. *P < 0.05 vs BL, ***P < 0.001 vs BL, +P < 0.05 vs 24h.
Mitochondrial respiration
Representative tracings for high-resolution respirometry are shown in Figure 4. We found significant increases in routine respiration from BL to 24 h (5.58 ± 0.37 vs 7.93 ± 0.74 pmol O2/s/106 cells, P < 0.05, respectively) and 48 h (8.88 ± 0.65 pmol O2/s/106 cells, P < 0.001 vs BL). Routine respiration was not different between 24 h and 48 h (Figure 5a). No significant changes were found in leak respiration among BL (2.82 ± 0.32 pmol O2/s/106 cells), 24 h (3.6 ± 0.51 pmol O2/s/106 cells), and 48 h (3.5 ± 0.42 pmol O2/s/106 cells) time points as shown in Figure 5b. MOF potential increased from BL to 24 h (10.6 ± 0.81 vs 16.0 ± 1.07 pmol O2/s/106 cells, P < 0.05). MOF potential at 48 h (20.1 ± 1.094 pmol O2/s/106 cells) was also significantly greater than BL (P < 0.001) but not different from 24 h (P > 0.05) (Figure 5c). There were no changes in ROX from BL (1.22 ± 0.24 pmol O2/s/106 cells) to 24 h (1.07 ± 0.21 pmol O2/s/106 cells) or 48 h (1.31 ± 0.23 pmol O2/s/106 cells).To determine total lymphocyte mitochondrial activity per volume of blood, we normalized basal routine respiration to the population of CD3+ T cells and found that total mitochondrial activity per volume of blood significantly decreased from BL to 24 h (13.3 ± 2.25 vs 5.08 ± 1.38 pmol O2/s/ml blood, P < 0.05) and 48 h (4.42 ± 0.88 pmol O2/s/ml blood, P < 0.05 vs BL). Total mitochondrial activity was not different between 24 h and 48 h (Figure 5d).
Figure 4.
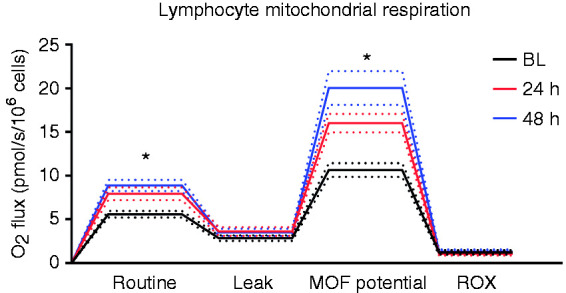
Representative tracings of lymphocyte mitochondria high-resolution respirometry (Oroboros Instruments, Innsbruck, Austria). Routine, Leak, MOF potential, and ROX respiratory states are shown for BL, 24 h and 48 h post-injury. Dotted lines represent SEM, n = 16. MOF: maximum oxygen flux, ROX: residual oxygen consumption. *P < 0.05 vs BL.
Figure 5.

Analysis of mitochondrial respiration at BL, 24 h, and 48 h after severe burns. The basal (Routine) respiration is oxygen flux supported by substrates within its own plasma which shows increased levels following burn injury (a). No significant changes were found in Leak respiration after the addition of the ATP synthase inhibitor, oligomycin (b). MOF potential (c) is determined by titration of FCCP. MOF potential significantly increased at 24 h and 48 h after burn injury. No changes were found in non-mitochondrial ROX (d). Lymphocyte bioenergetic activity reflected per volume of blood (e) shows a significant reduction at 24 h and 48 h after injury. n = 16. FCCP: carbonyl cyanide p-(trifluoro-methoxy) phenyl-hydrazone. MOF: maximum oxygen flux; ROX: residual oxygen consumption. *P < 0.05 vs BL, ***P < 0.001 vs BL.
Discussion
Severe burn injury results in complex systemic biochemical changes and a multi-faceted pathophysiological response.3 The hallmarks of severe burn injury are characterized by an early “ebb” phase within the first 48 h where metabolic activity is decreased, followed by the “flow” phase where metabolic demands are profoundly increased.4,5 It was postulated that these are protective mechanisms for victims of severe burns. Suppression of metabolic demands during the ebb phase allows for conservation of energy in vital organs.30 Thereafter, the hyper-metabolic drive ensues as a response to thermoregulation.31 If left unchecked, the burn-induced hyper-metabolism and hyper-inflammatory conditions lead to physiologic exhaustion and renders the burn victims prone to infectious complications such as sepsis,3,31 thereby increasing morbidity and mortality.3,6,7,32,33 Previous studies with over 900 patients observed profound hyper-inflammation and altered organ function from the early acute period after burn injury and persisting up to 3 yr after injury.5,14–16,34 While mitochondrial dysfunction in specific tissues has been shown to contribute to hyper-metabolism after severe burns,24–26,35 the role of mitochondrial function in immune cells during the acute phase post-burn injury has not been extensively studied.
The aim of this study was to investigate the changes in T cell population and mitochondrial activity in the first 48 h following severe burn injury. Due to the accidental nature of burn injury, we sought an animal model in order to obtain pre- and post-burn injury samples. While rodent models have been used in burn studies, large animal models (e.g., swine) have similar skin structure and healing properties, and more closely mimic the burn-induced hyper-metabolism seen in humans.36–38 The current porcine model of burn injury is also in agreement with previous reports showing a dampened adaptive immune response due to burns. The primary findings of the current report are that there are increases in phosphorylative capacity of lymphocytes post-burn. Moreover, while these cells are metabolically hyperactive in producing ATP, they do not sufficiently atone for overall reductions in lymphocyte numbers after burn injury.
Our blood cell analysis found that total WBC increased significantly, which was attributed largely to the profound increase in neutrophils found at 24 h and 48 h over BL levels. Given the massive amounts of tissue destruction in burn injury, this response of the innate immune system acutely following injury can have deleterious consequences. Alternatively, a significant reduction in lymphocyte population was found after 24 h, which was unchanged after 48 h. Flow cytometry data also indicated that this change in circulating lymphocytes was not specific to T-cell subpopulations. Specifically, CD3+, CD4+, and CD8+ T lymphocytes were much lower at 24 h post-injury, with no appreciable recovery by 48 h post-burn injury. This reduction in circulating lymphocytes is not attributed to the dilution of whole blood with i.v. fluids, as we observed hemoconcentration after 24 h. It has been shown previously that burn injury increases spontaneous T cell apoptosis,39 which has been associated with biomarkers such as glucocorticoids, Fas ligand,40 NO,21,41 and TNF-α42. Although not examined in the current study, lymphocyte apoptosis may be responsible for the reduction in cell number seen herein.
Our cytokine analysis showed decreased levels of IL 12-23 from BL to 24 h and 48 h post-injury. Similar to T cell populations, IL 12-23 was unchanged from 24 h and 48 h and our data did not show any trend returning to the baseline level. Conversely, we found a significant increase in IL 4 from BL to 24 h, with a significant reduction from 24 h to 48 h. These cytokine data may indicate a suppression of Th1 differentiation and an up-regulation of Th2 cells from BL to 24 h. This shift to preferring Th2 cells has also been demonstrated in previous burn studies in mice models.43,44 We can postulate that the reduction in Th1 may affect the downward cascade to suppress macrophages and cytotoxic T cells. Takagi and colleagues suggested that the preferential switch from Th1 to Th2 may render burn victims more susceptible to infections.44 Additionally, their work with recombinant human growth hormone (rhGH) treatment to burn injury found that rhGH returns the immune response towards a Th1-dominant phenotype and protects burn survivors from infections and further complications. Conversely, it was suggested that Th2 cells direct tissue repair and wound healing.45 Further investigations into T cell subtypes will help us understand their role in burn recovery and prevention of infections to improve outcomes in severely burned victims.
Mitochondria in immune cells play a critical role in establishing immune cell phenotype and function.17 It is widely accepted that glycolysis plays a role in immune cell activation.17 However, Sena et al. found in their mice study that, in the absence of Glc metabolism, mitochondrial metabolism (particularly mitochondrial complex III activity and ROS signaling) is sufficient to support T cell activation in vitro, and CD4+ and CD8+ T cell expansion in vivo.46 We found that the oxidative phosphorylation and the MOF potential in T cell mitochondria is significantly increased at 24 h and 48 h following burn injury. This is similar to what was found in intact peripheral blood immune cells in non-burned septic patients.18 It is important to note the novelty of our method of measuring mitochondria in intact T cells suspended in a closed chamber. After isolating T cells from peripheral blood, we re-suspended the cells in their own plasma instead of a manufactured cell medium. The substrates and metabolites in plasma are providing the necessary fuel for mitochondrial activity, and the routine measurements are a physiological representation of what is occurring in vivo. Our data show that lymphocyte mitochondria are not suppressed, but rather they are hyperactive acutely after severe burn injury. This would appear reasonable that the energy demand of the immune system would immediately increase for immune cell activation and proliferation in the acute time frame. However, as the burn victim becomes hyper-metabolic at the organism level, the physiological exhaustion of the immune system may ensue, thereby suppressing the immune response.
Our data showed no significant changes in leak respiration in the presence of increased routine respiration. Thus, we can assume that there are no increases in mitochondrial uncoupling, and mitochondrial energy production is not lost as heat. This may also infer that the increased respiratory response in the basal state predominantly goes towards phosphorylation and ATP generating capacity, although we did not measure ATP levels directly. As a measure of mitochondrial efficiency, the proportion of respiration that is used for ATP production (i.e., coupling control ratio)47 was similar at all timepoints (∼70%), representing an optimal condition to meet increased metabolic demands. Alternatively, in skeletal muscle it has been shown that the increase in oxygen utilization is utilized for uncoupled thermogenic purposes,24 thereby creating an environment of the metabolic deficit and contributing to whole-body hyper-metabolism post-injury.
The MOF potential represents a supra-physiologic capacity of the electron transport chain induced by protonophores dissipating membrane potential by compromising the integrity of the inner membrane. We found that MOF potential, like routine respiration, increases within 24 h after burn injury and is further elevated 48 h post-injury. This shows that there is an increased proton pumping capacity of complex I–IV of the electron transport chain after burn injury, indicating that there may have been morphological changes in T cell mitochondria to increase its functional capacity. Immune cell mitochondria can preferentially switch from oxidative phosphorylation to glycolysis.17,48 Glycolytic activity may increase upon T cell activation, although our data suggest that oxidative phosphorylation in mitochondria is also increased after burn injury, which seems like an ideal occurrence to support T cell activity. However, the overall bioenergetics per volume of blood (i.e., accounting for the reduction in lymphocyte number) remains low following severe burn injury, and still significantly less at 24 h and 48 h post-burn compared with pre-burn levels. This is attributed largely to the diminished population of peripheral T cells. We believe that the increased activity of T cell mitochondria may represent a potential mechanism to compensate for reduced lymphocyte populations.
There are some limitations to our study. First, our method for mitochondrial analysis did not allow us to measure glycolytic activity. Therefore, we were not able to determine the full spectrum of metabolic activity in T cells. Due to a low yield in recovering cells from flow cytometry, we were unable to determine metabolic activity and functions of specific phenotypes of T cell subpopulations (e.g., helper T cells, cytotoxic T cells, regulatory T cells, etc.) after sorting them. Also, our study only contained one terminal timepoint, and the more chronic effects of burn injury on immune cell mitochondria remain the province of future investigation. Lastly, changes in plasma substrates that may occur after burn injury may affect oxygen consumption of lymphocytes in their routine state. Due to limitation of lymphocyte availability in our sample collection, we were not able to measure mitochondrial respiration in a separate respiration media. Despite these limitations, we were able to measure physiologically relevant lymphocyte mitochondrial respiration utilizing a novel high-resolution respirometry method showing the impact of severe burn injury on T cell metabolic regulation.
In conclusion, we found a significant reduction in peripheral lymphocytes with simultaneous increased metabolic activity per lymphocyte. To our knowledge, this is the first study to measure lymphocyte mitochondrial function utilizing a novel high-resolution respirometry method in lymphocytes post-burn. We found that lymphocyte mitochondrial activity was not blunted, but rather increased at 24 h and 48 h after severe burn injury. Thus, a suppressed immune system in the acute phase following severe burns may not be attributed to a reduction in energetic capacity, but rather a reduction in lymphocyte population. Although the first 48 h after severe burn injury is predominantly categorized in the hypometabolic ebb phase, we found that mitochondria in individual lymphocyte begin to show a hypermetabolic phenotype. Additional studies into the altered metabolism and function of T cell population temporally following burns may help us further understand the interplay of the innate and adaptive immune systems in this injury pattern.
Acknowledgements
Authors want to thank the Unites States Army Institute of Surgical Research (USAISR) Veterinary Support Branch and Laboratory Support for their assistance. T.C. was supported in part by an appointment to the Postgraduate Research Participation Program at the USAISR administered by the Oak Ridge Institute for Science and Education through an interagency agreement between the United States Department of Energy and USAMRMC.
Declaration of conflicting interests
The author(s) declared no potential conflicts of interest with respect to the research, authorship, and/or publication of this article. The opinions or assertions contained herein are the private views of the author and are not to be construed as official or as reflecting the views of the Department of the Army or the Department of Defense.
Funding
The author(s) disclosed receipt of the following financial support for the research, authorship, and/or publication of this article: CDMRP Award #W81XWH-16-2-0041 provided funding for this project.
ORCID iD
David M. Burmeister http://orcid.org/0000-0002-1256-0158
References
- 1.Peck MD. Epidemiology of burns throughout the world. Part I: Distribution and risk factors. Burns 2011; 37: 1087–1100. [DOI] [PubMed] [Google Scholar]
- 2.Smolle C, Cambiaso-Daniel J, Forbes AA, et al. Recent trends in burn epidemiology worldwide: A systematic review. Burns 2017; 43: 249–257. [DOI] [PMC free article] [PubMed] [Google Scholar]
- 3.Jeschke MG, Chinkes DL, Finnerty CC, et al. Pathophysiologic response to severe burn injury. Ann Surg 2008; 248: 387–400. [DOI] [PMC free article] [PubMed] [Google Scholar]
- 4.Wolfe RR. Acute versus chronic response to burn injury. Circ Shock 1981; 8: 105–115. [PubMed] [Google Scholar]
- 5.Jeschke MG, Gauglitz GG, Kulp GA, et al. Long-term persistance of the pathophysiologic response to severe burn injury. Plos One. 2011; 6. [DOI] [PMC free article] [PubMed] [Google Scholar]
- 6.Burmeister DM, McIntyre MK, Baker BA, et al. Impact of isolated burns on major organs: a large animal model characterized. Shock 2016; 46: 137–147. [DOI] [PubMed] [Google Scholar]
- 7.Church D, Elsayed S, Reid O, et al. Burn wound infections. Clin Microbiol Rev 2006; 19: 403–434. [DOI] [PMC free article] [PubMed] [Google Scholar]
- 8.Sayed S, Bakry R, El-Shazly M, et al. Effect of major burns on early and late activating markers of peripheral blood T lymphocytes. Ann Burns Fire Disasters 2012; 25: 17–21. [PMC free article] [PubMed] [Google Scholar]
- 9.Luckheeram RV, Zhou R, Verma AD, et al. CD4(+)T cells: differentiation and functions. Clin Dev Immunol 2012; 2012: 925135. [DOI] [PMC free article] [PubMed] [Google Scholar]
- 10.Mittrücker H-W, Visekruna A, Huber M. Heterogeneity in the differentiation and function of CD8(+) T Cells. Arch Immunol Ther Exp (Warsz.) 2014; 62: 449–458. [DOI] [PubMed] [Google Scholar]
- 11.Rendon JL, Choudhry MA. Th17 cells: critical mediators of host responses to burn injury and sepsis. J Leukoc Biol 2012; 92: 529–38. [DOI] [PMC free article] [PubMed] [Google Scholar]
- 12.Deveci M, Sengezer M, Bozkurt M, et al. Comparison of lymphocyte populations in cutaneous and electrical burn patients: a clinical study. Burns 2000; 26: 229–332. [DOI] [PubMed] [Google Scholar]
- 13.Fayazov AD, Shukurov SI, Shukurov BI, et al. Disorders of the immune system in severely burned patients. Ann Burns Fire Disasters 2009; 22: 121–130. [PMC free article] [PubMed] [Google Scholar]
- 14.Burleson DG, Vaughn GK, Mason AD, et al. Flow cytometric measurement of rat lymphocyte subpopulations after burn injury and burn injury with infection. Arch Surg 1987; 122: 216–220. [DOI] [PubMed] [Google Scholar]
- 15.Burleson DG, Mason AD, McManus AT, et al. Lymphocyte phenotype and function changes in burn patients after intravenous IgG therapy. Arch Surg 1988; 123: 1379–1382. [DOI] [PubMed] [Google Scholar]
- 16.Cioffi WG, Burleson DG, Pruitt BA. Leukocyte responses to injury. Arch Surg 1993; 128: 1260–1267. [DOI] [PubMed] [Google Scholar]
- 17.Weinberg SE, Sena LA, Chandel NS. Mitochondria in the regulation of innate and adaptive immunity. Immunity 2015; 42: 406–417. [DOI] [PMC free article] [PubMed] [Google Scholar]
- 18.Sjovall F, Morota S, Persson J, et al. Patients with sepsis exhibit increased mitochondrial respiratory capacity in peripheral blood immune cells. Crit Care 2013; 17. [DOI] [PMC free article] [PubMed] [Google Scholar]
- 19.Park DW, Zmijewski JW. Mitochondrial dysfunction and immune cell metabolism in sepsis. Infect Chemother 2017; 49: 10–21. [DOI] [PMC free article] [PubMed] [Google Scholar]
- 20.Ledderose C, Bao Y, Ledderose S, et al. Mitochondrial dysfunction, depleted purinergic signaling, and defective T cell vigilance and immune defense. J Infect Dis 2016; 213: 456–464. [DOI] [PMC free article] [PubMed] [Google Scholar]
- 21.Valenti L, Mathieu J, Chancerelle Y, et al. Nitric oxide inhibits spleen cell proliferative response after burn injury by inducing cytostasis, apoptosis, and necrosis of activated T lymphocytes: role of the guanylate cyclase. Cell Immunol 2003; 221: 50–63. [DOI] [PubMed] [Google Scholar]
- 22.Cheng SC, Scicluna BP, Arts RJW, et al. Broad defects in the energy metabolism of leukocytes underlie immunoparalysis in sepsis. Nat Immunol 2016; 17: 406–413. [DOI] [PubMed] [Google Scholar]
- 23.Sidossis LS, Porter C, Saraf MK, et al. Browning of subcutaneous white adipose tissue in humans after severe adrenergic stress. Cell Metab 2015; 22: 219–227. [DOI] [PMC free article] [PubMed] [Google Scholar]
- 24.Porter C, Herndon DN, Børsheim E, et al. Uncoupled skeletal muscle mitochondria contribute to hypermetabolism in severely burned adults. Am J Physiol Endocrinol Metab 2014; 307: E462–E467. [DOI] [PMC free article] [PubMed] [Google Scholar]
- 25.Porter C, Herndon DN, Sidossis LS, et al. The impact of severe burns on skeletal muscle mitochondrial function. Burns. 2013; 39: 1039–1047. [DOI] [PMC free article] [PubMed] [Google Scholar]
- 26.Szczesny B, Brunyanszki A, Ahmad A, et al. Time-dependent and organ-specific changes in mitochondrial function, mitochondrial DNA integrity, oxidative stress and mononuclear cell infiltration in a mouse model of burn injury. Plos One 2015; 10: 26. [DOI] [PMC free article] [PubMed] [Google Scholar]
- 27.Gomez BI, McIntyre MK, Gurney JM, et al. Enteral resuscitation with oral rehydration solution to reduce acute kidney injury in burn victims: evidence from a porcine model. PLOS One, 2018; 41: e0195615. [DOI] [PMC free article] [PubMed] [Google Scholar]
- 28.Burmeister DM, Ponticorvo A, Yang B, et al. Utility of spatial frequency domain imaging (SFDI) and laser speckle imaging (LSI) to non-invasively diagnose burn depth in a porcine model. Burns 2015; 41: 1242–1252. [DOI] [PMC free article] [PubMed] [Google Scholar]
- 29.Pesta D, Gnaiger E. High-resolution respirometry: OXPHOS protocols for human cells and permeabilized fibers from small biopsies of human muscle. Methods Mol Biol 2012; 810: 25–58. [DOI] [PubMed] [Google Scholar]
- 30.Auger C, Samadi O, Jeschke MG. The biochemical alterations underlying post-burn hypermetabolism. Biochim Biophys Acta 2017; 1863: 2633–2644. [DOI] [PMC free article] [PubMed] [Google Scholar]
- 31.Williams FN, Herndon DN, Jeschke MG. The hypermetabolic response to burn injury and interventions to modify this response. Clin Plast Surg 2009; 36: 583–596. [DOI] [PMC free article] [PubMed] [Google Scholar]
- 32.Jeschke MG, Gauglitz GG, Finnerty CC, et al. Survivors versus nonsurvivors postburn differences in inflammatory and hypermetabolic trajectories. Ann Surg 2014; 259: 814–823. [DOI] [PMC free article] [PubMed] [Google Scholar]
- 33.Burmeister DM, Gómez BI, Dubick MA. Molecular mechanisms of trauma-induced acute kidney injury: Inflammatory and metabolic insights from animal models. Biochim Biophys Acta 2017; 1863: 2661–2671. [DOI] [PubMed] [Google Scholar]
- 34.Szelig L, Rendeki S, Foldi V, Lantos J, Bogar L, Csontos C. Time course of CD marker expression in patients with burns and its prognostic value. Burns. 2014; 40: 575–582. [DOI] [PubMed] [Google Scholar]
- 35.Porter C, Herndon DN, Børsheim E, et al. Long-term skeletal muscle mitochondrial dysfunction is associated with hypermetabolism in severely burned children. J Burn Care Res 2016; 37: 53–63. [DOI] [PMC free article] [PubMed] [Google Scholar]
- 36.Abdullahi A, Amini-Nik S, Jeschke MG. Animal models in burn research. Cell Mol Life Sci 2014; 71: 3241–3255. [DOI] [PMC free article] [PubMed] [Google Scholar]
- 37.Singer AJ, Toussaint J, Chung WT, et al. Early versus delayed excision and grafting of full-thickness burns in a porcine model: a randomized study. Plast Reconstr Surg 2016; 137: 972E–979E. [DOI] [PubMed] [Google Scholar]
- 38.Sullivan TP, Eaglstein WH, Davis SC, et al. The pig as a model for human wound healing. Wound Repair Regen 2001; 9: 66–76. [DOI] [PubMed] [Google Scholar]
- 39.Patenaude J, D'Elia M, Hamelin C, et al. Burn injury induces a change in T cell homeostasis affecting preferentially CD4(+) T cells. J Leukoc Biol 2005; 77: 141–150. [DOI] [PubMed] [Google Scholar]
- 40.Fukuzuka K, Edwards CK, Clare-Salzler M, et al. Glucocorticoid and Fas ligand induced mucosal lymphocyte apoptosis after burn injury. J Trauma Injury Infect Crit Care. 2000; 49: 710–716. [DOI] [PubMed] [Google Scholar]
- 41.Valenti LM, Mathieu J, Chancerelle Y, et al. High levels of endogenous nitric oxide produced after burn injury in rats arrest activated T lymphocytes in the first G1 phase of the cell cycle and then induce their apoptosis. Exp Cell Res 2005; 306: 150–167. [DOI] [PubMed] [Google Scholar]
- 42.Wesche DE, Lomas-Neira JL, Perl M, et al. Leukocyte apoptosis and its significance in sepsis and shock. J Leukoc Biol 2005; 78: 325–337. [DOI] [PubMed] [Google Scholar]
- 43.Kavanagh EG, Kelly JL, Lyons A, et al. Burn injury primes naive CD4+ T cells for an augmented T-helper 1 response. Surgery 1998; 124: 269–276. [PubMed] [Google Scholar]
- 44.Takagi K, Suzuki F, Barrow RE, et al. Recombinant human growth hormone modulates Th1 and Th2 cytokine response in burned mice. Ann Surg 1998; 228: 106–111. [DOI] [PMC free article] [PubMed] [Google Scholar]
- 45.Sandler NG, Mentink-Kane MM, Cheever AW, et al. Global gene expression profiles during acute pathogen-induced pulmonary inflammation reveal divergent roles for Th1 and Th2 responses in tissue repair. J Immunol 2003; 171: 3655–3667. [DOI] [PubMed] [Google Scholar]
- 46.Sena LA, Li S, Jairaman A, et al. Mitochondria are required for antigen-specific t cell activation through reactive oxygen species signaling. Immunity. 2013; 38: 225–236. [DOI] [PMC free article] [PubMed] [Google Scholar]
- 47.Brand MD, Nicholls DG. Assessing mitochondrial dysfunction in cells. Biochem J 2011; 435: 297–312. Erratum in: Biochem J 2011; 437: 575. [DOI] [PMC free article] [PubMed] [Google Scholar]
- 48.Pearce EL, Poffenberger MC, Chang C-H, et al. Fueling immunity: insights into metabolism and lymphocyte function. Science 2013; 342: 1242454.24115444 [Google Scholar]