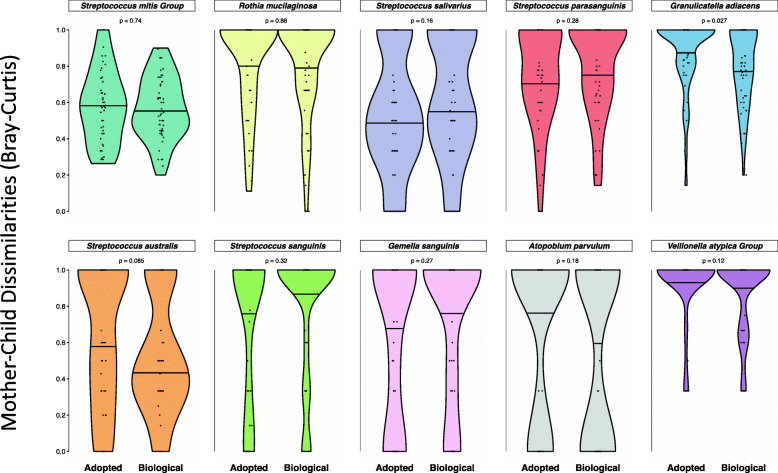
Fig. 7.
No influence of genetics on mother-child distances for individual species. Violin plots comparing the distribution of mother-child dissimilarities in the biologic and adoptive groups. For the 10 most abundant species, Bray-Curtis dissimilarities were generated based on presence/absence of strains for each species. Mother-child distances (dissimilarities) were not significantly different between the adoptive and biologic groups for any species. Wilcoxon rank sum test was used for statistical comparisons, and p values generated were corrected for false positives (Benjamini-Hochberg procedure) to generate q values shown. The 50th quantile of each distribution is marked for comparison. Data is based on the saliva/soft tissue swab samples

