Abstract
Background
Biogenic nanoparticles possess a capping of biomolecules derived from the organism employed in the synthesis, which contributes to their stability and biological activity. These nanoparticles have been highlighted for the control of phytopathogens, so there is a need to understand their composition, mechanisms of action, and toxicity. This study aimed to investigate the importance of the capping and compare the effects of capped and uncapped biogenic silver nanoparticles synthesized using the filtrate of Trichoderma harzianum against the phytopathogenic fungus Sclerotinia sclerotiorum. Capping removal, investigation of the composition of the capping and physico-chemical characterization of the capped and uncapped nanoparticles were performed. The effects of the nanoparticles on S. sclerotiorum were evaluated in vitro. Cytotoxicity and genotoxicity of the nanoparticles on different cell lines and its effects on nontarget microorganisms were also investigated.
Results
The capped and uncapped nanoparticles showed spherical morphology, with greater diameter of the uncapped ones. Functional groups of biomolecules, protein bands and the hydrolytic enzymes NAGase, β-1,3-glucanase, chitinase and acid protease from T. harzianum were detected in the capping. The capped nanoparticles showed great inhibitory potential against S. sclerotiorum, while the uncapped nanoparticles were ineffective. There was no difference in cytotoxicity comparing capped and uncapped nanoparticles, however higher genotoxicity of the uncapped nanoparticles was observed towards the cell lines. Regarding the effects on nontarget microorganisms, in the minimal inhibitory concentration assay only the capped nanoparticles inhibited microorganisms of agricultural importance, while in the molecular analysis of the soil microbiota there were major changes in the soils exposed to the uncapped nanoparticles.
Conclusions
The results suggest that the capping played an important role in controlling nanoparticle size and contributed to the biological activity of the nanoparticles against S. sclerotiorum. This study opens perspectives for investigations concerning the application of these nanoparticles for the control of phytopathogens. 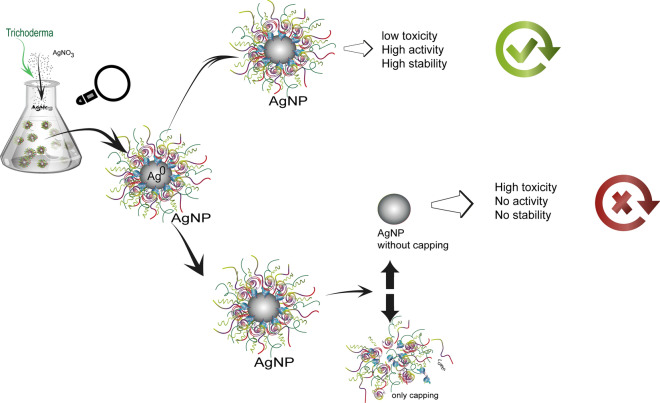
Keywords: Silver nanoparticles, Biogenic synthesis, Capping, Trichoderma harzianum, Hydrolytic enzymes, SDS-PAGE, FTIR
Background
The use of nanotechnology in the agricultural sector is increasing, making important contributions to improvements in areas including pest control. Among the new nanomaterials, silver nanoparticles (AgNPs) can be highlighted for the control of phytopathogenic microorganisms [1]. These nanoparticles can be synthesized using biological reducing agents and stabilizers, including fungi, bacteria, plants, and algae [2], involving action of the nitrate reductase enzyme and other metabolites [3]. Fungi can be considered as nanobiofactories for the fast and environmentally friendly synthesis of silver nanoparticles [1]. The nanoparticles are formed as a result of the interaction of a metallic precursor with enzymes, coenzymes, and other active substances derived from the organisms, with the resulting nanoparticles being capped with bioactive material [4, 5].
Metallic nanoparticles produced by biogenic synthesis generally possess this capping, which provides stability, while other substances can be added to provide specific activities that potentiate the effects of the nanoparticles [6, 7]. The capping of biogenic nanoparticles is composed of biomolecules and compounds derived from the metabolism of the fungus or other biological agent, such as extracellular proteins, enzymes, amino acids, and secondary metabolites [8, 9]. In the case of nanoparticles produced by chemical synthesis, it is necessary to add capping agents such as surfactants, proteins, and other biomolecules, in order to achieve electrosteric stability. These agents bind to the surfaces of the nanoparticles by means of covalent bonds or chemical interactions, and are not readily degraded [10–12].
Depending on its composition, the capping can also improve nanoparticle biocompatibility, providing an active surface for interaction with biological compounds and conjugation with substances such as medicines, antimicrobials, genetic material, and amino acids [9]. Bhunia et al. reported that silver nanoparticles capped with protein such as human hemoglobin presented greater biocompatibility, compared to uncapped nanoparticles [13]. These characteristics make biogenic nanoparticles more suitable for applications in the areas of health, agriculture, and the environment [14, 15]. However, an important consideration is that the surface capping may influence parameters such as the morphology, aggregation, and dissolution rate of the particles, in addition to affecting cytotoxicity [15]. Hence, before using these nanoparticles in the areas of health and agriculture, it is necessary to determine their physico-chemical characteristics and perform toxicity evaluations on cell lines and nontarget organisms due to their consequent realease into the environment [16].
White mold, a disease affecting more than 450 species of agricultural crops, is caused by the fungus Sclerotinia sclerotiorum, considered one of the most important phytopathogens worldwide. This fungus is able to form highly resistant structures (sclerotia) that can remain viable for years in the soil [17]. The control of this disease is based on the application of chemical fungicides and biological control agents, while some studies have reported the inhibitory effects of silver nanoparticles against phytopathogenic fungi [18–23]. In a previous study by our research group, silver nanoparticles were synthesized using the fungus Trichoderma harzianum, with and without stimulation of enzyme production, and were found to inhibit S. sclerotiorum mycelial growth and sclerotia germination in vitro [23].
Given the importance of the capping on nanoparticles, the aim of the present study was to compare the physico-chemical characteristics of capped and uncapped silver nanoparticles synthesized in our previous study [23], investigate the cappings using infrared spectroscopy, protein analyses, and enzymatic assays, and evaluate the biological activity of the nanoparticles against S. sclerotiorum, as well as their toxicity towards different cell lines and nontarget microorganisms.
Materials and methods
Materials
This study employed silver nanoparticles previously synthesized using the filtrate of Trichoderma harzianum, with enzyme production stimulated by the presence of the cell wall of Sclerotinia sclerotiorum, denoted AgNP-TSC (57.02 ± 1.75 nm; −18.70 ± 3.01 mV; polydispersity 0.49 ± 0.01), and nanoparticles produced without stimulation, denoted AgNP-TC (81.84 ± 0.67 nm; −18.30 ± 1.73 mV; polydispersity 0.52 ± 0.00) [23].
The cell lines V79 (Chinese hamster pulmonary fibroblast), 3T3 (albino Swiss mouse embryo fibroblast), and HaCat (human keratinocyte) were obtained from the Rio de Janeiro Cell Bank (Rio de Janeiro, Brazil). The agriculturally important microorganisms Bradyrhizobium japonicum, Pseudomonas aeruginosa, Bacillus thuringiensis, Beauveria bassiana, and the phytopathogen Sclerotinia sclerotiorum were donated. Thiazolyl Blue Tetrazolium Bromide (MTT) and resazurin were obtained from Sigma-Aldrich. Potato dextrose agar was purchased from Kasvi. Blueye Prestained protein molecular weight marker, the Apoptosis Annexin V AlexaFluor 488 and propidium iodide kit, the Qubit dsDNA HS DNA quantification kit, and SYBR Green were obtained from Invitrogen. Visking MWCO 12–14 kDa dialysis membranes were purchased from Serva. The PowerSoil kit for DNA extraction from soil was obtained from QIAGEN.
Removal of the nanoparticle cappings
In order to investigate possible differences between capped and uncapped nanoparticles, the capping was removed from half the volume of the samples, as described by Jain et al. [24]. The nanoparticle dispersions were centrifuged, the pellets were resuspended and boiled in 1% sodium dodecyl sulfate (SDS), and a further centrifugation was performed. The supernatants containing the cappings were stored at −20 ºC, prior to subsequent protein and enzyme analyses. Nanoparticles without cappings were obtained by boiling the pellets in 60 mM Tris-HCl pH 6.8, followed by dialysis using a Visking MWCO 12–14 kDa membrane. The procedure used to remove the capping from the nanoparticles resulted in two new uncapped samples, giving a total of four samples (two capped and two uncapped). The samples were labeled as follows: AgNP-TSC (capped silver nanoparticles, with stimulation), AgNP-TC (capped silver nanoparticles, without stimulation), AgNP-TS (uncapped silver nanoparticles, with stimulation), and AgNP-T (uncapped silver nanoparticles, without stimulation).
Characterization and stability evaluation of the biogenic nanoparticles
After removal of the nanoparticle cappings, the capped and uncapped nanoparticles and the corresponding T. harzianum filtrates were analyzed using UV-visible spectroscopy in the wavelength range 200–800 nm, with resolution of 1 nm, using a Shimadzu Multispec 1501 spectrophotometer. Measurements of the pH of the nanoparticles and the filtrates were performed immediately after capping removal at ambient temperature using a pH meter (HMMPB-210).
The techniques of dynamic light scattering (DLS) and microelectrophoresis were used to determine the hydrodynamic diameter, polydispersity, and zeta potential of the samples, employing a ZetaSizer Nano ZS90 analyzer (Malvern Instruments). The readings were made in triplicate, at 25 ºC, with a fixed angle of 90º. The stability of the nanoparticles was evaluated by repeating these analyses six and twelve months after the synthesis. The nanoparticle concentrations were obtained by nanoparticle tracking analysis (NTA), using a NanoSight LM 10 cell and NanoSight v. 2.3 software. The nanoparticles were dispersed in water to a standard working concentration of 1 × 10¹⁰ NPs.mL− 1.
Morphological analysis of the nanoparticles
The morphologies of the capped and uncapped nanoparticles were investigated using atomic force microscopy (AFM). Aliquots of the nanoparticles were diluted in ultrapure water and 10 µL volumes were dripped onto silicon AFM plates, followed by keeping in a desiccator until completely dry. The analyses were performed using an easyScan 2 atomic force microscope (Nanosurf, Switzerland) equipped with TapAl-G cantilevers (BudgetSensors, Bulgaria) and operated in noncontact mode at a scan rate of 90 Hz. The micrographs were interpreted using Gwyddion software.
Characteristics of the nanoparticle cappings
Fourier transform infrared spectroscopy (FTIR) analyses of the capped and uncapped nanoparticles were performed using a JASCO FT/IR-410 spectrometer. For this, KBr tablets were prepared using a proportion of 1.5% of the solid nanoparticles obtained by freeze-drying of aqueous dispersions. The spectra were acquired in the range from 4000 to 400 cm− 1, at 8 cm− 1 resolution, with 32 scans.
Analysis of proteins in the nanoparticle cappings
The sodium dodecyl sulfate polyacrylamide gel electrophoresis (SDS-PAGE) was used to investigate the presence of T. harzianum proteins in the filtrates used for the synthesis and in the cappings removed from the nanoparticles, as well as in the capped and uncapped nanoparticles. The assay was performed based on the methodology from Chowdhury et al. with some adaptations [25]. The samples were mixed with buffer (1:1 v:v ratio), heated at 95 ºC for 10 min, centrifuged at 14,000 rpm for 1 min, and loaded onto a 12% SDS-Polyacrilamide gel in the following order: (1) Blueye Prestained ladder (Invitrogen) 11–245 kDa molecular weight marker; (2) Filtrate from T. harzianum without stimulation; (3) Capping without stimulation; (4) AgNP-TC; (5) AgNP-T; (6) Filtrate of T. harzianum with stimulation; (7) Capping with stimulation; (8) AgNP-TSC; (9) AgNP-TS. Electrophoresis was performed at 200 V and 20 mA, until the dye reached the lower region of the gel. The gel was stained using ammoniacal silver solution and analysis of the protein profiles was performed visually, based on the molecular weight marker.
Specific activity of theTrichoderma harzianumhydrolytic enzymes
The protein concentrations in the filtrates, cappings, and nanoparticles AgNP-TSC, AgNP-TC, AgNP-TS and AgNP-T were determined using Bradford’s reagent and bovine serum albumin (1, 0.5, 0.25, and 0.125 mg.mL− 1) as standard [26]. Evaluation of the specific activities of the T. harzianum hydrolytic enzymes N-acetylglucosaminidase (NAGase), β-1,3-glucanase, chitinase, and acid protease in the filtrates, cappings, and nanoparticles was performed based on the methodology described by Qualhato et al. [27]. The assays employed 96-well microplates and the following samples: T. harzianum filtrate without stimulation; capping without stimulation; AgNP-TC; AgNP-T; T. harzianum filtrate with stimulation; capping with stimulation; AgNP-TSC; AgNP-TS.
Biological activity of the nanoparticles towards the phytopathogenSclerotinia sclerotiorum
The activity of the capped and uncapped nanoparticles for the control of S. sclerotiorum was evaluated using assays of the growth of the phytopathogen on potato dextrose agar supplemented with the samples at a concentration of 3 × 10⁹ NPs.mL− 1 [19, 23]. After 15 days of culture, the mycelium growth halos were measured and the numbers of new sclerotia were counted.
Cytotoxic and genotoxic potentials of the nanoparticles towards cell lines andAllium cepa
Cytotoxicity and genotoxicity analyses were performed to compare the effects of the capped nanoparticles (AgNP-TSC and AgNP-TC) and the corresponding uncapped nanoparticles (AgNP-TS and AgNP-T).
Cytotoxicity evaluation
The cytotoxicity of the samples was evaluated using the V79, 3T3, and HaCat cell lines. Assays of mitochondrial activity employed the Thiazolyl Blue Tetrazolium Bromide (MTT). Cell viability, apoptosis, and necrosis were determined by imaging cytometry. Cell viability was evaluated using the trypan blue dye exclusion method.
For the MTT assay, the cells were plated (5 × 10⁴ cells/well) and exposed to the nanoparticles at concentrations between 0.1 × 10⁹ and 3.5 × 10⁹ NPs.mL− 1 for 24 h. The MTT solution (5 mg.mL− 1) was added, followed by incubation for 3 h, fixation of the cells with DMSO, and absorbance reading at 540 nm. In the analyses using imaging cytometry and trypan blue exclusion, the cells were exposed for 1 h to the nanoparticles at 3 × 10⁹ NPs.mL− 1. The imaging cytometry analyses of cell viability, apoptosis, and necrosis were performed using the Annexin V AlexaFluor® 488 and propidium iodide kit (Invitrogen), according to the manufacturer’s instructions, with the readings obtained using a Tali™ Image Cytometer. In the trypan blue exclusion assay, immediately after the end of exposure to the nanoparticles at 3 × 10⁹ NPs.mL− 1, the cells were stained with trypan blue, followed by counting using an optical microscope, in triplicate, considering cells stained blue to be dead.
Genotoxicity evaluation
The genotoxicity of the nanoparticles was determined using Allium cepa and comet assays. The Allium cepa assay was performed as described by Lima et al. [28]. The exposure of Allium cepa roots to the nanoparticle samples was performed for 24 h, using concentrations of 1 × 10¹⁰ and 3 × 10⁹ NPs.mL− 1, followed by fixation and hydrolysis of the roots, preparation of slides (in triplicate), and analysis by optical microscopy. Out of the total number of cells, counting was made of those that presented cell division, giving the mitotic index (MI), and of these, those that presented chromosomal alterations, giving the alteration index (AI).
Comet assay was performed according to the methodology described by Singh et al. [29], with adaptations. The same cell lines used in the cytotoxicity assays were exposed for 1 h to the samples at 3 × 10⁹ NPs.mL− 1, followed by preparation of the slides, immersion in lysis solution for 1 h, neutralization, immersion in electrophoresis buffer for 20 min, and electrophoresis for 20 min at 22 V and 300 mA. The slides were then fixed, stained, and evaluated under a microscope, with visual scoring [30].
Toxicity of the nanoparticles towards nontarget microorganisms
Evaluation of minimum inhibitory concentration (MIC) towards microorganisms of agricultural importance
MIC assay was performed using the agriculturally important microorganisms Bradyrhizobium japonicum, Pseudomonas aeruginosa, Bacillus thuringiensis, and Beauveria bassiana. The microorganisms were cultured for 24 h, transferred to 96-well plates at a concentration of 5 × 10⁵ CFU.mL− 1, and exposed to the capped and uncapped nanoparticles at decreasing concentrations between 4.0 × 10⁹ and 1.0 × 10⁸ NPs.mL− 1. After incubation for 24 h at 37 ºC, resazurin solution (6.75 mg.mL− 1) was added and the plates were incubated for a further 24 h, followed by visual color assessment.
Molecular qPCR analyses of the effects of the nanoparticles on soil microbiota
Investigation was made of possible effects of the nanoparticles on soil bacteria that participate in the nitrogen cycle during the processes of fixation and denitrification. For this, the soil was exposed to the nanoparticles at a concentration of 3 × 10⁹ NPs.mL− 1, in microcosms containing 10 g of soil [31]. A control was also prepared using ultrapure water. The microcosms were kept in the dark at ambient temperature. On the day of exposure, DNA was extracted from an untreated soil sample (denoted soil zero), in order to obtain the initial conditions. Extractions of DNA from all the samples were then performed 15, 90, 180, and 360 days after exposure, using the PowerSoil DNA Isolation Kit (QIAGEN), followed by DNA quantification using the Qubit dsDNA HS kit, with a Qubit 3.0 fluorometer, and dilution to a final concentration of 100 ng mL− 1. Quantification of the genes of the nitrogen cycle bacteria was performed with specific primers, using the real-time polymerase chain reaction (qPCR) with Syber Green [32]. Relative quantification of the DNA was performed using the 16s rRNA gene as a reference. All the samples were analyzed in triplicate.
Statistical analyses
Statistical analyses employed one-way analysis of variance (ANOVA) followed by Tukey’s test (significance level of p < 0.05), performed using GraphPad Prism 7.0 software.
Results and discussion
Characterization and stability of the biogenic nanoparticles
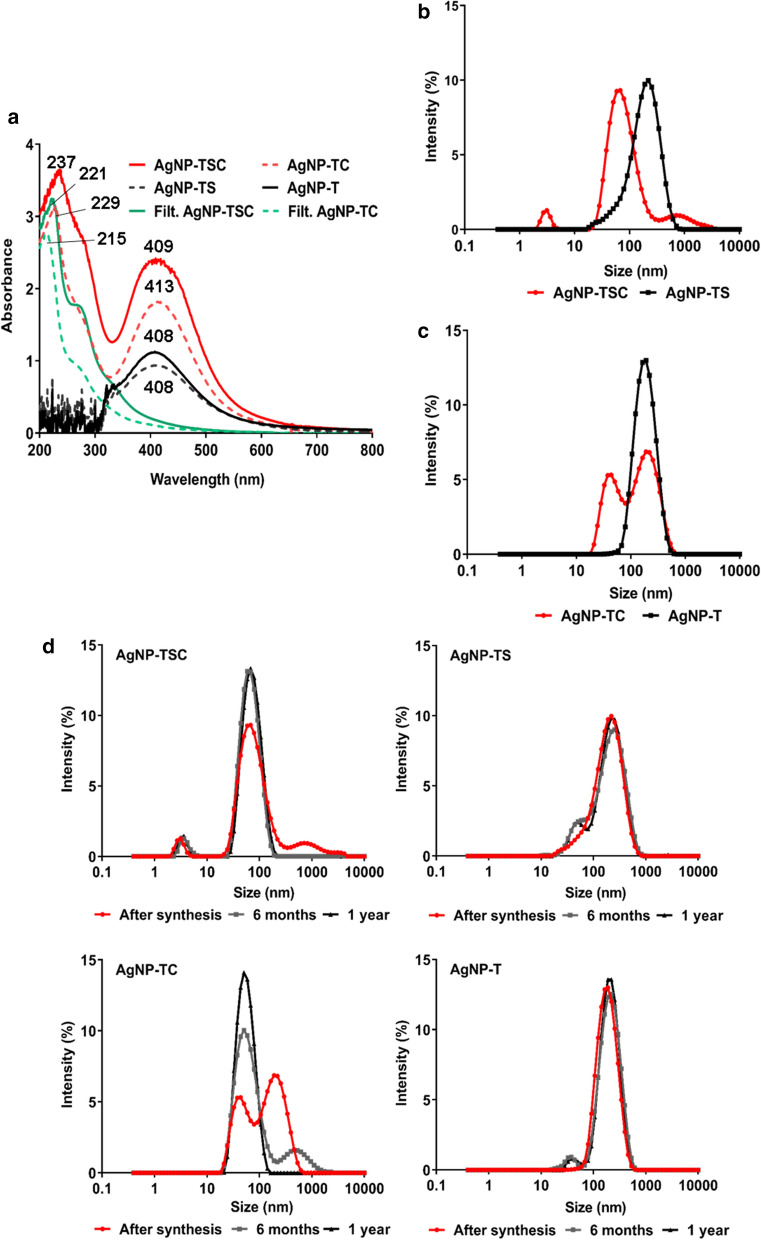
The UV-Vis analyses of all the samples showed absorbance peaks between 400 and 420 nm, characteristic of elemental silver (Ag0). The spectra for the capped nanoparticle samples AgNP-TSC and AgNP-TC showed peaks between 200 and 300 nm, which were similar to peaks in the corresponding filtrates and indicated the presence of organic compounds such as amino acid residues, secondary metabolites, and proteins. In the same region, noise signals were observed for the AgNP-TS and AgNP-T samples, which could be attributed to the process of removing the capping and eliminating the biomolecules (Fig. 1a).
Fig. 1.
Physico-chemical characterization of the nanoparticles. a UV-Vis spectra of the nanoparticles and the corresponding filtrates. b and c Hydrodynamic diameter distributions obtained by DLS. d: Stability evaluation of AgNP-TSC (capped, with stimulation), AgNP-TC (capped, without stimulation), AgNP-TS (uncapped, with stimulation), and AgNP-T (uncapped, without stimulation)
The nanoparticles presented different hydrodynamic diameter distributions, which could be attributed to the synthesis conditions employed, especially the presence or absence of a capping. The AgNP-TSC sample showed peaks at 3 nm (6.0%), 59 nm (88.3%), and 825 nm (5.6%) (Fig. 1b), while the AgNP-TC sample showed peaks at 32 nm (39.3%) and 190 nm (60.7%) (Fig. 1c). The formation of particle populations with different sizes for nanoparticles synthesized using biogenic routes has been observed previously [33, 34]. After removal of the cappings, these nanoparticles showed size distribution peaks at 220 nm (100%) for AgNP-TS (Fig. 1c) and at 190 nm (100%) for AgNP-T (Fig. 1c). Increase of the particle diameter after removal of the capping was probably due to subsequent aggregation of the nanoparticles [35].
Polydispersity index values of 0.49, 0.52, 0.42, and 0.25 were obtained for the AgNP-TSC, AgNP-TC, AgNP-TS, and AgNP-T samples, respectively. The lowest value for the AgNP-T sample reflected the smallest variation of nanoparticle size, although the larger diameter of these particles was indicative of aggregation followed by stabilization. In the case of the zeta potential, corresponding to the charge formed at the interface between the nanoparticles and the dispersion medium, all the samples presented negative values (−16.7, −16.3, −33.3, and − 15.2 mV for AgNP-TSC, AgNP-TC, AgNP-TS, and AgNP-T, respectively), with the AgNP-TS sample showing the highest electronegativity. Although a higher zeta potential generally indicates higher nanoparticle stability, the stability of biogenic nanoparticles is mainly influenced by the capping of biomolecules [12]. Different cappings produce different surface charges, which can influence the activity of the nanoparticles and their cytotoxicity [36, 37].
The stability of the nanoparticles was evaluated by DLS analyses performed 6 and 12 months after their synthesis (Fig. 1d). In most cases, no changes in nanoparticle hydrodynamic diameter were observed. An exception was the AgNP-TC sample, which initially presented a bimodal particle size distribution, while after 6 months there was a shift towards smaller diameter nanoparticles. After one year, there was the emergence of a monomodal distribution, with the nanoparticles presenting a smaller diameter than observed at the start of the experiment. A possible explanation is that soon after synthesis residues of T. harzianum remain in the colloidal solution of nanoparticles, which can cause them to agglomerate and present larger diameter populations through DLS technique. Over time these organic compounds of the fungus are degraded and the capped nanoparticles are dispersed from the agglomerates, presenting a monomodal distribution, that is, a single population of smaller diameter. Despite this change in diameter, both the capped nanoparticles continued to exhibit biological activity for the control of S. sclerotiorum after 12 months, with no evidence of color change, flocculation, or sedimentation. The maintenance of the activity could be attributed to the fungal biomolecules surrounding the nanoparticles, which provided steric stability [38]. The stability of nanoparticles in a dispersion is essential for ensuring their biological activity [39]. Also, regarding stability of biogenic nanoparticles it is important to emphasize that there are other factors which could be involved in the stability over time, in special the zeta potential of the particles as stated above.
The pH values of the dispersions of both types of capped nanoparticles were close to the values for the corresponding filtrates (pH 7.2–7.3). Lower values were obtained for the uncapped nanoparticles (pH 4.9–5.0), which was probably because the nanoparticles were not capped by compounds derived from the filtrate. During the synthesis, OH− ions supply electrons for the reduction of silver ions and are adsorbed on the surfaces of the nanoparticles, ensuring their stability and avoiding size changes, resulting in a more alkaline dispersion [14]. When the capping is removed, these OH− ions are lost, changing the pH of the dispersion and exposing the Ag0 nanoparticles to the aqueous solution, initiating an ionization process and consequent loss of stability [40]. Uncapped nanoparticles are more readily ionized in aqueous dispersions, with lower pH of the dispersion favoring their dissolution [24, 41].
Morphological analysis of the nanoparticles
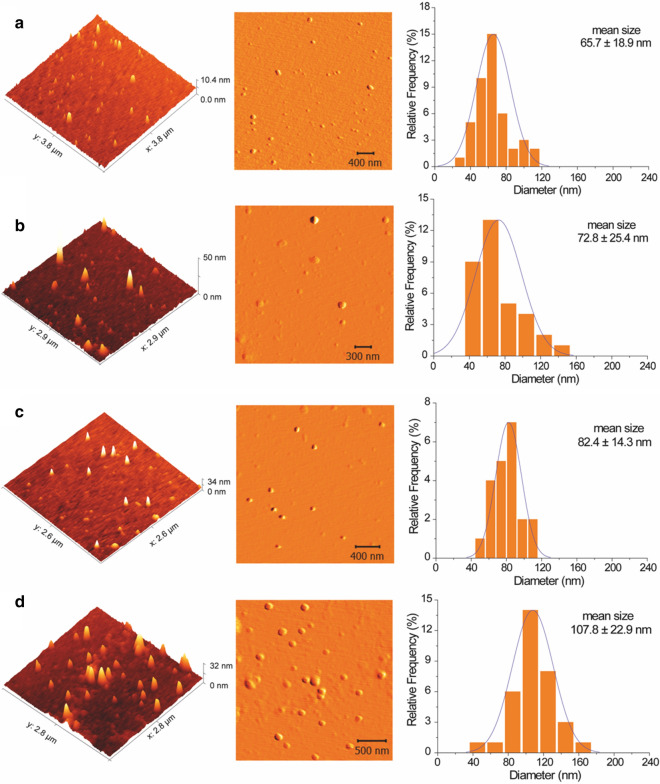
The use of atomic force microscopy showed that the four nanoparticle samples presented spherical morphology, while the uncapped nanoparticles had larger mean diameters (Fig. 2), in agreement with the diameter distributions obtained by DLS analysis. Previous work has found that the morphology and size of nanoparticles are directly influenced by the synthesis conditions [42].
Fig. 2.
Atomic force microscopy (AFM) images and size distributions of the capped nanoparticles AgNP-TSC (a) and AgNP-TC (b) and the uncapped nanoparticles AgNP-TS (c) and AgNP-T (d)
Characterization of the nanoparticle cappings
FTIR is an important tool for characterization of systems such as those produced here, enabling the identification of specific characteristics of the nanoparticles and their precursors. For example, the detection of proteins responsible for the biogenic synthesis and stability of silver nanoparticles has been reported in previous studies [25, 43, 44]. The interactions of nanoparticles with these proteins and amino acid residues can occur by means of covalent bonds to amino groups and cysteine residues, as well as by electrostatic connections involving carboxyl groups [38, 44]. Daphedar and Taranath used FTIR to detect bands of protein groups in the spectra for nanoparticles produced by biogenic synthesis and reported that the phytochemical components of the extract used in the synthesis (proteins, carboxylic acids, flavonoids, alcohols, and phenols) acted in the processes of reduction, capping formation, and stabilization [45].
In the present work, the infrared spectra for the capped nanoparticles (TSC and TC) presented bands characteristic of functional groups ascribed to the active fungal biomolecules (Fig. 3). A broad band at 3700−3000 cm− 1 could be attributed to O–H stretching vibrations of hydroxyl groups [46, 47]. A band at 2960 cm− 1 was due to stretching of the amide NH groups [46] in the structures of proteins and hydrolytic enzymes such as glucanases and chitinases. Bands at 2917 and 2850 cm− 1 were characteristic of C–H stretching [8, 48], while bands at 1637 and 1535 cm− 1 could be attributed to amides I and II, respectively [38, 47]. An intense band at 1371 cm− 1 was attributed to bending vibration of C–H of methyl groups [46, 49] and/or stretching of C–N of aromatic amines [8, 38, 47]. A low intensity band at 1249 cm− 1 corresponded to amine C–N stretching [47, 48]. Absorption at around 1024 cm− 1 was attributed to ether group C–O stretching [46, 47, 50]. The presence of these functional groups in the capped nanoparticles indicated that the capping was formed by structures derived from the fungus, such as proteins, hydrolytic enzymes, and amino acid residues produced by enzymatic proteolysis.
Fig. 3.
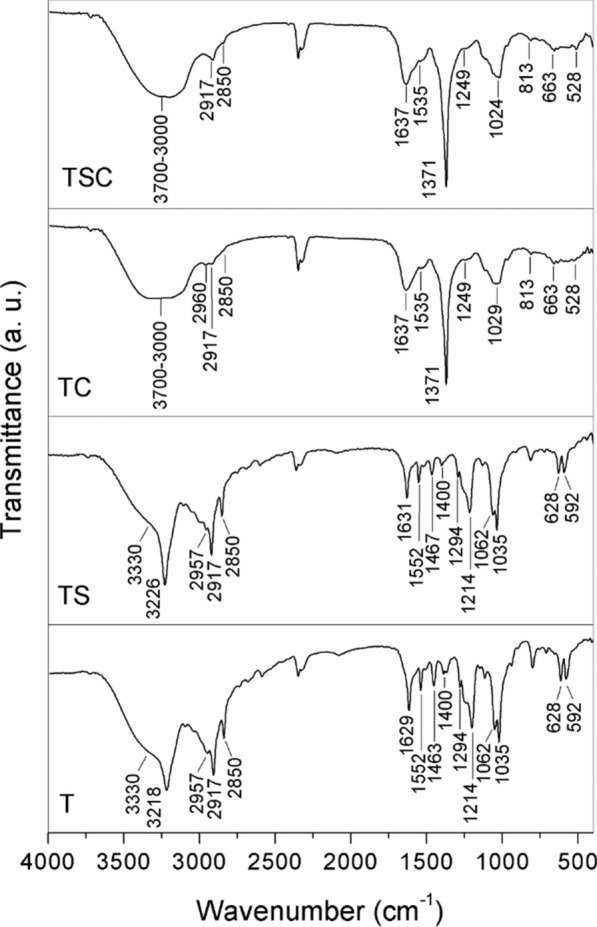
FTIR spectra of the capped (AgNP-TSC and AgNP-TC) and uncapped nanoparticles (AgNP-TS and AgNP-T)
The features observed in the absorption spectra were in agreement with previous results reported in the literature. Gurunathan et al. synthesized silver nanoparticles using filtrates of the bacterium Bacillus tequilensis and the fungus Calocybe indica, with the spectral bands for both nanoparticles being close to those found for the capped nanoparticles in the present study [36]. Jain et al. obtained similar results for silver nanoparticles synthesized using filtrate of the fungus Aspergillus flavus NJP08. In both studies, formation of a capping around the nanoparticles was attributed to the high capacity of C–O groups of amino acid residues to bind with metals, where the stability of the nanoparticles was due to the interactions with proteins [44].
The characteristic bands of the capped nanoparticles were not observed for the nanoparticles that had undergone the process of capping removal. These nanoparticles presented bands corresponding to the Tris-HCl buffer in which the nanoparticles were resuspended [51, 52]. A broad band at 3300 cm− 1 corresponded to O–H stretching, while a band at around 3226 cm− 1 could be attributed to symmetrical N–H stretching. Bands in the region between 2957 and 2850 cm− 1 were ascribed to symmetric and asymmetric stretching vibrations of CH2. Bands at 1629 and 1552 cm− 1 were characteristic of in-plane and out-of-plane symmetric angular deformation of NH2. Bands at 1463 and 1400 cm− 1 corresponded to CH2 deformation and C–C vibration, respectively. Bands at 1294 and 1214 cm− 1 were attributed to the deformations of OH, while signals at 1062 and 1035 cm− 1 were due to deformations of C–O. Finally, a doublet at 628 and 592 cm− 1 corresponded to C–C–C deformation. These results were in agreement with the work by Jain et al. who removed the capping from silver nanoparticles synthesized using the filtrate of Aspergillus sp. NJP02 [24]. The profile of the FTIR spectrum changed, with the vibrational bands corresponding to amide I, amide II, and aliphatic amine C–N stretching disappearing, hence confirming removal of the capping.
Analysis of proteins in the nanoparticle cappings
SDS-PAGE assay was performed in order to confirm that the proteins in the filtrate used for synthesis of the nanoparticles were retained in the cappings. The protein profiles of both filtrates exhibited bands that were also shown by the corresponding cappings, indicating that the filtrate proteins were also present in the layer surrounding the nanoparticles (Fig. 4).
Fig. 4.
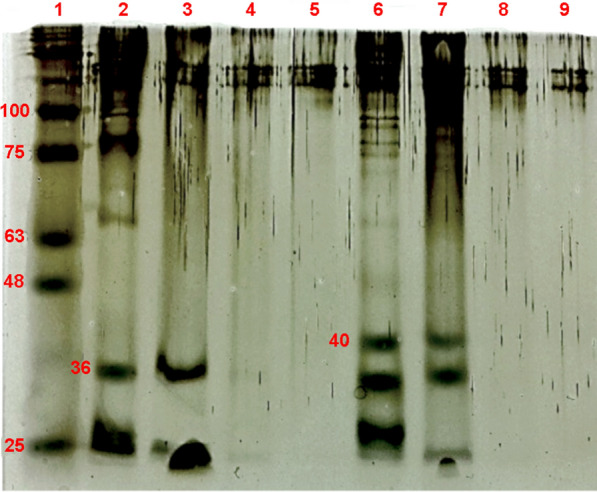
SDS-PAGE analysis of the nanoparticles and the corresponding filtrates and cappings: 1. Molecular weight marker, 11–245 kDa (Blueye Prestained ladder, Invitrogen); (2) Filtrate of T. harzianum without stimulation; (3) Capping without stimulation; (4) AgNP-TC; (5) AgNP-T; (6) Filtrate of T. harzianum with stimulation; (7) Capping with stimulation; (8) AgNP-TSC; (9) AgNP-TS
The filtrate and capping samples showed bands at 36 kDa and 40 kDa, corresponding to the molecular weights of the T. harzianum β-1,3-glucanase and chitinase enzymes, respectively, indicating the presence of these enzymes, which was confirmed by specific enzymatic activity analyses [53, 54]. No clear bands were observed for the capped and uncapped nanoparticle samples. In the case of the capped nanoparticles, the strong interactions between the proteins and the nanoparticles prevented the migration of proteins in the gel [44], while in the case of the uncapped nanoparticles, the proteins were eliminated from the samples during the processes of capping removal and dialysis.
The appearance of bands corresponding to the same molecular weight in the analyses of the filtrates and cappings provided confirmation that the filtrate proteins had capped the nanoparticles [44]. Similar results were reported by Rodrigues et al. who obtained the same protein bands (at 75, 122, 191, and 328 kDa) for the filtrate and the capping of nanoparticles synthesized using Aspergillus tubingensis, which confirmed the participation of the filtrate proteins in the nanoparticle synthesis process and their retention in the layer surrounding the nanoparticles [43]. Jain et al. used SDS-PAGE to analyze the filtrate of the fungus Aspergillus flavus, the nanoparticles synthesized using this fungus, and the capping of the nanoparticles, which was removed by boiling in 1% SDS. The fungus filtrate presented two intense bands at 35 and 32 kDa, while the 35 kDa band was also observed for the nanoparticle capping. The synthesis was suggested to occur in two stages, with the 32 kDa protein firstly reducing the silver ions to form nanoparticles, followed by bonding of the 35 kDa protein to the nanoparticles, making them stable [44]. Chowdhury et al. reported the presence of a band at 85 kDa for the filtrate and the capping of silver nanoparticles obtained using Macrophomina phaseolina, indicating the presence of fungal compounds enveloping the nanoparticles. The authors attributed this band to a component of the capping that conferred stability to the nanoparticles [25].
Specific activity ofTrichoderma harzianumhydrolytic enzymes
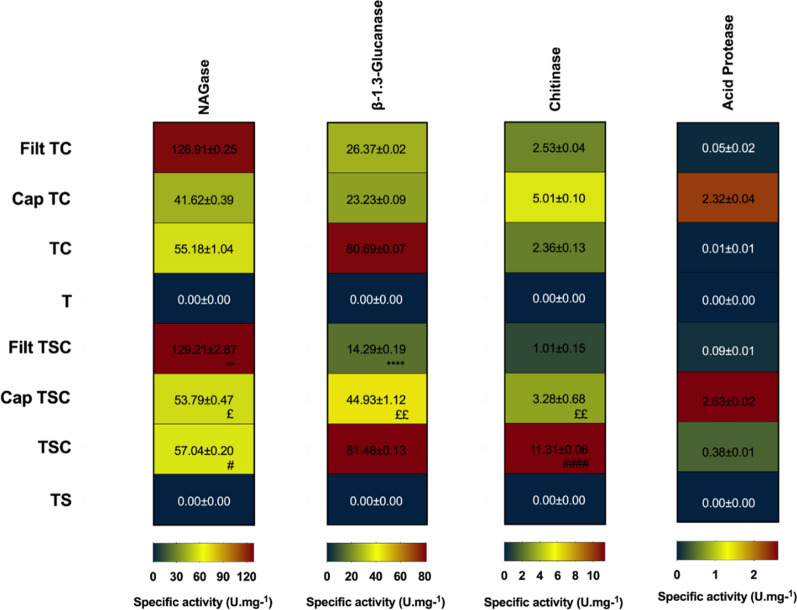
Determination of the specific activity of T. harzianum hydrolytic enzymes that act in the biological control of phytopathogens revealed the presence of these enzymes in the filtrates, cappings, and capped nanoparticles, while their activities were absent in the uncapped nanoparticle samples. Among the enzymes studied, the highest activity was generally observed for NAGase, followed by β-1,3-glucanase, while chitinase and acid protease showed low activities. The specific enzymatic activity profiles of the four enzymes are shown in Fig. 5.
Fig. 5.
Specific activity (U.mg− 1) of the Trichoderma harzianum hydrolytic enzymes N-acetylglucosaminidase (NAGase), β-1,3-glucanase, chitinase, and acid protease. Filt TSC: filtrate with stimulation; Cap TSC: capping with stimulation; TSC: capped nanoparticles with stimulation; TS: uncapped nanoparticles with stimulation; Filt TC: filtrate without stimulation; Cap TC: capping without stimulation; TC: capped nanoparticles without stimulation; T: uncapped nanoparticles without stimulation. Statistically significant differences (p < 0.05) are indicated by * for comparison between Filt TC and Filt TSC, £ for comparison between Cap TC and Cap TSC, and # for comparison between TC and TSC. The greater the number of symbols the greater the statistical significance
Higher β-1,3-glucanase activity was observed for the capped nanoparticles AgNP-TSC and AgNP-TC, while NAGase showed higher activity in both filtrates. The highest chitinase activity was observed for AgNP-TSC, followed by the capping of AgNP-TC, while the highest protease activity was found for the capping of AgNP-TSC. These differences could be explained by the processes to which the samples were submitted, such as removal of the capping, involving heating and centrifugation steps, which had different effects according to the particular enzymes.
The main finding of these analyses, in agreement with the SDS-PAGE and FTIR results, was that the enzymes from the filtrates remained in the cappings, as well as in the capped nanoparticles. This provided an explanation for the greater inhibitory activities of the capped nanoparticles towards the germination and mycelial growth of S. sclerotiorum, compared to the uncapped nanoparticles. It is likely that the enzymes present in the nanoparticle cappings could act synergistically with the nanoparticles, enhancing their effects, although further investigations will be needed to confirm this possibility.
The presence of proteins and enzymes in capped biogenic nanoparticles deserves special attention, given the importance of this capping in terms of the stability, biocompatibility, and possible enhanced biological activity of these nanoparticles.
Biological activity of the nanoparticles towards the phytopathogenSclerotinia sclerotiorum
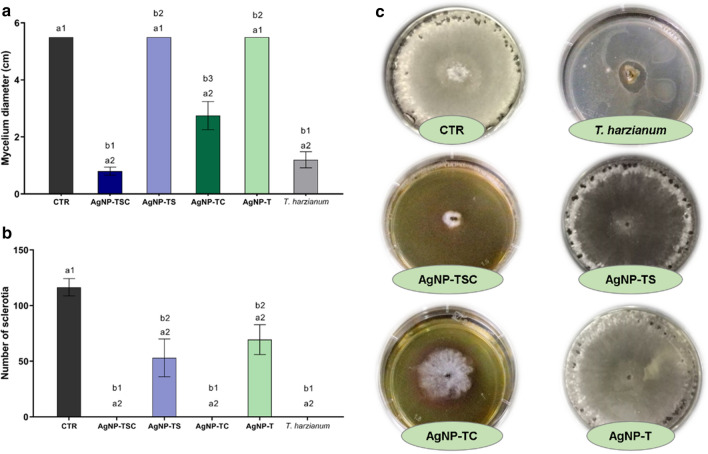
Evaluation was made of the biological activity of the nanoparticles in terms of S. sclerotiorum mycelium growth and new sclerotia formation, comparing the effects of the capped and uncapped nanoparticles in culture medium supplemented with the samples. Decreased mycelium growth was observed for the fungus exposed to the capped nanoparticles, for which no formation of new sclerotia was observed, with the best results using AgNP-TSC. In contrast, use of the uncapped nanoparticles resulted in mycelium growth throughout the areas of the plates, equivalent to the control plates, as well as the formation of new sclerotia (Fig. 6a and b). The visual appearances of the cultures are shown in Fig. 6c
Fig. 6.
Biological activities of the AgNP-TSC, AgNP-TS, AgNP-TC, and AgNP-T nanoparticles (3 × 10⁹ NPs.mL− 1) towards S. sclerotiorum. a Mycelium diameters; b numbers of new sclerotia; c visual appearances of the cultures. Statistical analysis: a. control × AgNP; b. AgNP × AgNP. Different numbers indicate statistically significant differences (p < 0.05)
The absence of any effect of the uncapped nanoparticles could have been due to their increased size, since larger nanoparticles have been found to present lower cytotoxicity [55, 56]. Another important finding was the presence of active compounds derived from T. harzianum in the capped nanoparticles, which could contribute to inhibition of the phytopathogen. Previous studies have found that during the processes of reduction of silver nitrate and binding to the surfaces of the nanoparticles, the proteins do not undergo deformations of the secondary and tertiary structures, or disruption of the covalent bonds [38, 44]. This suggests that the proteins did not suffer from loss of functionality, so they could contribute to the biological activity of the nanoparticles.
Depending on the characteristics and composition of the capping on biogenic nanoparticles, bonds formed with different molecules can result in new functionalities and improvements in colloidal stability [57], as well as mechanisms for the internalization of nanoparticles in cells [58]. Zewde et al. reported that the presence or absence of a capping, the type of capping, and its density could greatly influence the antimicrobial effects and the cytotoxicity potential of nanoparticles [12]. Such findings suggest that the nanoparticle capping could exert antifungal activity, enabling the control of S. sclerotiorum and contributing to maintenance of the antifungal properties of the nanoparticles themselves, providing them with greater stability.
Several previous studies have investigated the potential of biogenic nanoparticles for use in the control of phytopathogenic fungi. Elamawi et al. used filtrate of the fungus Trichoderma longibrachiatum to synthesize silver nanoparticles that were evaluated in vitro and presented inhibitory effects against the phytopathogenic fungi Fusarium verticillioides, Fusarium moniliforme, Penicillium brevicompactum, Helminthosporium oryzae, and Pyricularia grisea. FTIR analyses revealed bands corresponding to proteins bound to the surfaces of the nanoparticles, which appeared to contribute to stabilization of the particles and avoidance of agglomeration [39]. Abboud synthesized silver nanoparticles using Trichoderma harzianum and evaluated their effects against Fusarium oxysporum, Alternaria alternata, and Trichoderma harzianum. Concentration-dependent inhibition of fungal colony formation was observed [59]. Mishra et al. employed silver nanoparticles synthesized using the bacterium Stenotrophomonas sp. as a nanofungicide for the control of foliar phytopathogens such as Alternaria alternata, Curvularia lunata, and Bipolaris sorokiniana, as well as the phytopathogen Sclerotium rolfsii in soil. Exposure to the nanoparticles at low concentrations resulted in complete inhibition of the conidia and sclerotia of the foliar phytopathogens [60].
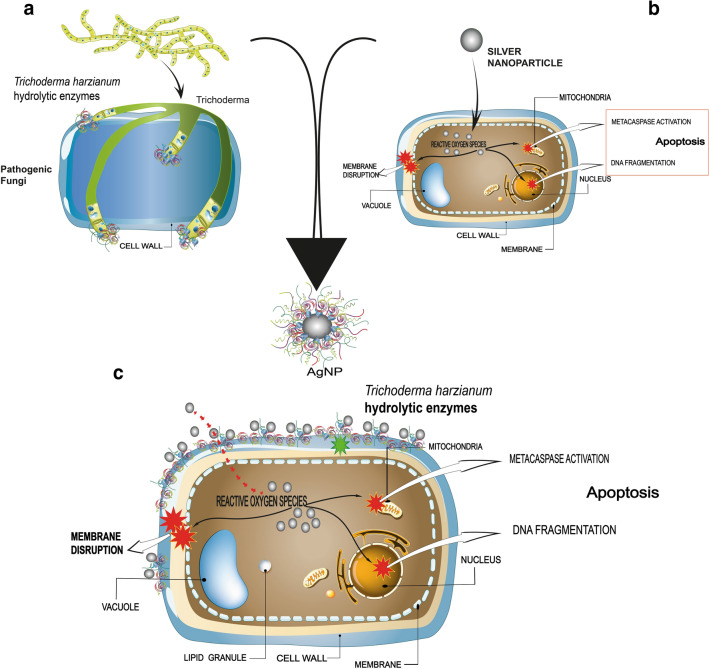
Trichoderma harzianum acts as an antagonist against phytopathogenic microorganisms through direct and indirect mechanisms. Mycoparasitism is a direct mechanism in which, initially, the carbohydrates of T. harzianum cell wall are bound to the phytopathogen lectins, followed by the hyphae winding, formation of appresoria and penetration into the target fungus hyphae. After this contact, hydrolytic enzymes such as chitinase and β-1,3-glucanase are released which corrupt the cell wall of the phytopathogen, thus allowing the establishment of parasitism (Fig. 7a) [61, 62].
Fig. 7.
Schematic representation of the possible mechanism of action of the capped silver nanoparticles against S. sclerotiorum. a degradation of pathogenic fungi cell wall by T. harzianum hydrolytic enzymes; b membrane disruption and oxidative stress in pathogenic fungi cells caused by silver nanoparticles; c synergistic effect of the biogenic silver nanoparticles and the capping hydrolytic enzymes against S. sclerotiorum
The mechanisms of silver nanoparticles against fungi are not completely elucidated, however according to some studies silver nanoparticles cause changes in the plasma membrane dynamics of fungal cells leading to loss of integrity, increased permeabilization and depolarization. In addition, silver nanoparticles release Ag+ ions that interact with oxygen causing an increase in the intracellular levels of reactive oxygen species and an accumulation of hydroxyl radicals. These highly reactive compounds can trigger mitochondrial dysfunction and disruption of ATP synthesis, DNA fragmentation and apoptosis (Fig. 7b) [63, 64].
From the result of our study, we raised the hypothesis of a synergistic effect between the nanoparticles and the capping against S. sclerotiorum. The capping of the nanoparticles presented active hydrolytic enzymes of Trichoderma harzianum which act by degrading carbohydrates in the cell wall of the phytopathogenic fungi [27, 53, 54]. After fungal cell wall degradation, the silver nanoparticles come into action.
These combined events of capping and silver nanoparticles probably make the fast action of biogenic nanoparticles due to the presence and action of enzymes present in the capping. However, although the effect of the capped nanoparticles on Sclerotinia sclerotiorum is a strong indication of this synergy, further studies are needed. Figure 7c shows a hypothetical representation of the synergy between the silver nanoparticles and their capping against S. sclerotiorum.
Although several previous studies have reported the potential of biogenic silver nanoparticles for the control of phytopathogens in agriculture, the approach used in the present study enabled evaluation of the importance of the capping for the quality and biological activity of the nanoparticles, opening perspectives for further detailed investigations to explore this feature of biogenic nanoparticles.
Cytotoxic and genotoxic effects of the nanoparticles in cell lines andAllium cepa
Cytotoxicity evaluation
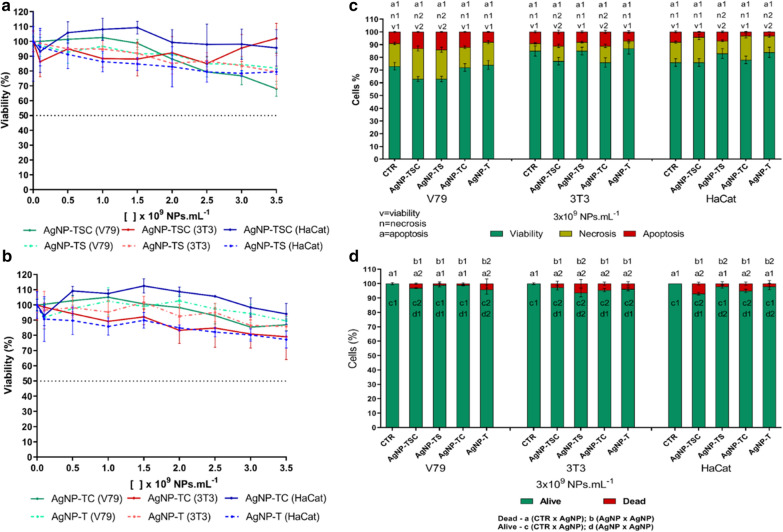
Use of the MTT assay revealed differences in the cytotoxicity of the capped and uncapped nanoparticles, notably in the HaCat cell line, where both types of uncapped nanoparticles showed greater cytotoxicity. However, IC50 values were not reached for any of the samples, indicating low cytotoxicity at the concentrations used in the exposures (Fig. 8a and b). The results of the viability assays using imaging cytometry and the trypan blue test agreed with the MTT assay, with low cell death indices (Fig. 8c and d).
Fig. 8.
Cytotoxicity evaluation of the AgNP-TSC, AgNP-TS, AgNP-TC, and AgNP-T nanoparticles. a MTT assay comparing AgNP-TSC and AgNP-TS; b MTT assay comparing AgNP-TC and AgNP-T; c imaging cytometry analysis of cell viability, necrosis, and apoptosis; d trypan blue exclusion assay. Statistical analysis: different numbers indicate statistically significant difference (p < 0.05)
The cytotoxicity of silver nanoparticles can vary greatly, depending on the type of particle and the synthesis process, since it is related to factors such as exposure time, concentration, temperature, particle size, capping, and cell line [15, 39]. An important point is that biogenic silver nanoparticles are usually less cytotoxic than commercial uncapped nanoparticles and silver ions [10]. Skladanowski et al. synthesized silver nanoparticles using Streptomyces sp. NH28 and used the MTT assay to evaluate their cytotoxicity towards the L929 mouse fibroblast cell line. No cytotoxicity was observed at the lowest exposure concentrations, at which cell viability was equivalent to that of the control, with IC50 only being reached using high concentrations [65]. Although cytotoxicity may be low or absent, it is also important to evaluate the genotoxic effects of new nanoparticles.
Genotoxicity evaluation
In the Allium cepa genotoxicity assays, the uncapped nanoparticles caused higher alteration indices, compared to the capped nanoparticles, at both exposure concentrations (Fig. 9a). Similar results were obtained in the comet assays, with the uncapped nanoparticles resulting in higher damage indices, compared to the capped nanoparticles (Fig. 9b). The V79 cell line presented higher sensitivity to all the samples, compared to the other cell lines.
Fig. 9.
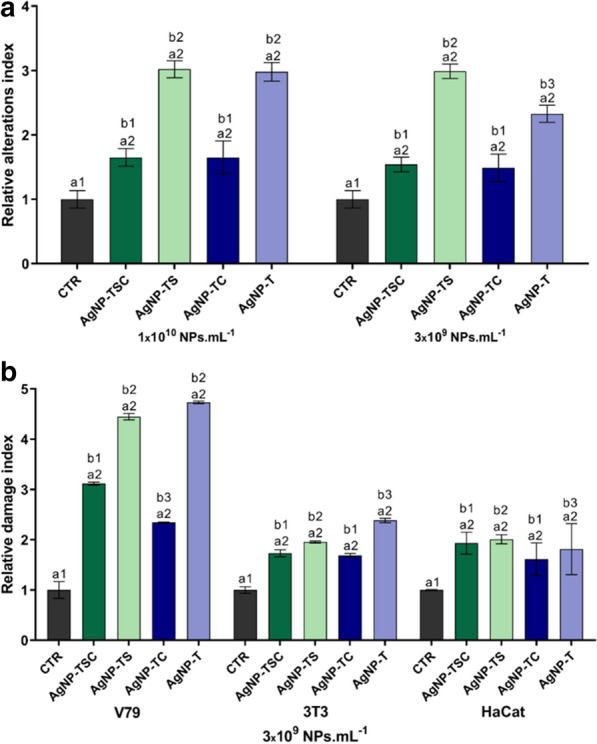
Genotoxicity evaluation of the AgNP-TSC, AgNP-TS, AgNP-TC, and AgNP-T samples. a Chromosomal alteration indices obtained using the Allium cepa test. b DNA damage indices obtained using comet assays. Statistical analysis: different numbers indicate statistically significant difference (p < 0.05)
The greater genotoxic effects caused by the uncapped nanoparticles could be attributed to the fact that the capping not only increased the stability of the particles, preventing them from aggregating and losing their properties, but also retarded the release of Ag+ ions, which are more toxic than nanoparticles composed of Ag0 [66]. At non-cytotoxic concentrations, some silver nanoparticles can cause DNA damage, chromosomal aberrations, and possible mutagenic effects [15]. Daphedar and Taranath observed chromosomal aberrations in meristematic root tissues of Drimia polyantha exposed to biogenic silver nanoparticles, which were dependent on the nanoparticle concentration and the duration of exposure. It was suggested that internalization of the nanoparticles in the roots could lead to a variety of chromosomal alterations including bridges, multipolar anaphase, delayed division, fusion failures, and C-metaphase, among others [45].
Toxicity studies of biogenic silver nanoparticles have shown varied results, due to the differences in types of biological reducing agents and stabilizers, capping compositions, and synthesis conditions, resulting in the formation of nanoparticles with different characteristics and levels of toxicity [39]. Furthermore, comparisons are hindered by the use of different nanoparticle concentrations and organisms in the exposures. Nonetheless, it is important to evaluate the possibility of toxic effects, in order to ensure responsible and environmentally safe synthesis and application of these nanomaterials. The cytotoxic and genotoxic effects caused by silver nanoparticles can occur following their internalization in cells, causing oxidative stress, membrane damage, alterations of the cell cycle, inflammatory responses, DNA damage, and chromosomal aberrations [58], as well as changes in cell morphology, decreased viability, and cell death by apoptosis and necrosis [67].
Toxicity of the nanoparticles towards nontarget microorganisms
Minimum inhibitory concentration (MIC) for microorganisms of agricultural importance
The MIC values varied according to the type of nanoparticle and the microorganism. Considering the capped nanoparticles, the AgNP-TSC sample presented MIC values of 3.0 × 10⁹, 2.5 × 10⁹, 3.5 × 10⁹, and 1.5 × 10⁹ NPs mL− 1 for the microorganisms Bradyrhizobium japonicum, Pseudomonas aeruginosa, Bacillus thuringiensis, and Beauveria bassiana, respectively, while the AgNP-TC nanoparticles presented MIC of 3.5 × 10⁹ NPs mL− 1 for Bradyrhizobium japonicum and Pseudomonas aeruginosa, no concentration for Bacillus thuringiensis, and 3.0 × 10⁹ NPs mL− 1 for Beauveria bassiana. In the case of the uncapped nanoparticles, no mortality of the organisms was observed at the exposure concentrations evaluated. A possible reason for the lower toxicity of the uncapped nanoparticles towards the microorganisms was their larger hydrodynamic diameter and consequently lower toxic effects, given that a smaller diameter of silver nanoparticles increases their toxicity to microorganisms [68, 69]. In addition, it is important to consider that these nanoparticles were synthesized by biogenic pathways and present different characteristics in relation to the nanoparticles obtained by conventional synthesis. Removing the capping of biogenic nanoparticles can alter its properties since the capping is responsible for colloidal stability [70].
Molecular qPCR analyses of the effects of the nanoparticles on soil microbiota
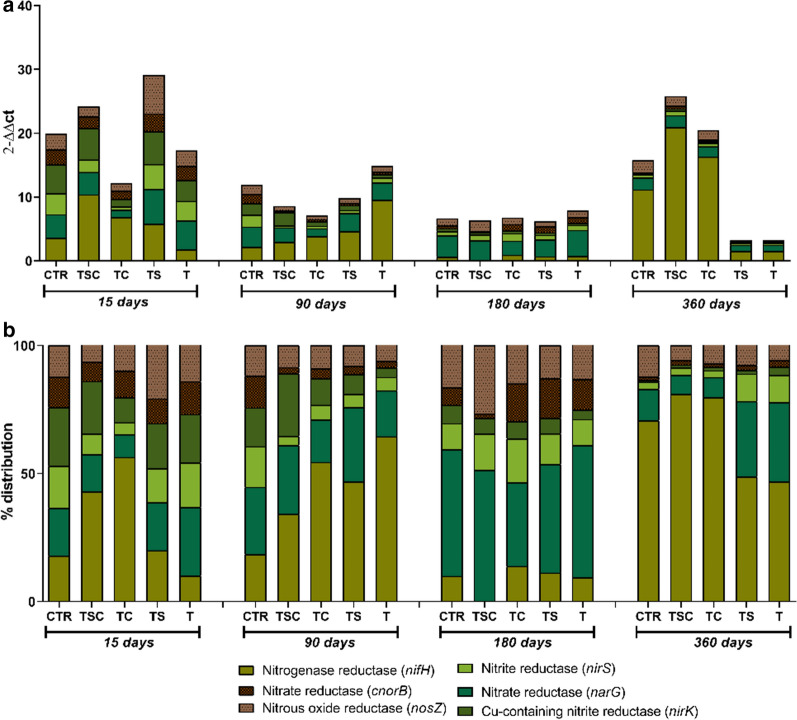
The soil samples exposed to the capped nanoparticles AgNP-TSC and AgNP-TC showed results closer to the control, in terms of both the quantity and proportions of genes. This could be seen most clearly in the data obtained after 360 days, when lower gene quantification values were obtained for the soils exposed to the uncapped AgNP-TS and AgNP-T nanoparticles (Fig. 10).
Fig. 10.
Quantitative molecular analysis of soils exposed to the AgNP-TSC, AgNP-TC, AgNP-TS, and AgNP-T nanoparticles after 15, 90, 180, and 360 days. a Quantification calculated using 2− ΔΔct. b Results for the proportion of each gene analyzed
After 15 days of exposure, the most evident alteration, relative to the control, was an increase in the proportion of nifH in the soil samples exposed to the AgNP-TSC and AgNP-TC nanoparticles, which was indicative of increased nitrogen fixation. After 90 days, increased nitrogen fixation was also observed for AgNP-TS and AgNP-T, while all four samples showed a reduction of the first phase of denitrification, indicated by the nirS gene. At the same time, AgNP-TSC showed an increase of cnorB, which is associated with the second phase of denitrification, while AgNP-T showed a decrease of this gene. After 180 days, changes were observed for AgNP-TSC, with the disappearance of nifH and decrease of cnorB, while no changes were observed for the other nanoparticles, relative to the control. After 360 days, the soil samples exposed to the AgNP-TSC and AgNP-TC nanoparticles showed greater similarity to the control, compared to AgNP-TS and AgNP-T, indicating that over time, the bacteria population exposed to the capped nanoparticles tended to recover. It should be noted that the control soil without nanoparticles underwent progressive alterations during the course of the trial period.
Grün et al. investigated the effects of silver nanoparticles on soil bacteria, either unfunctionalized or functionalized with amine or carboxyl groups, using quantification of the 16s rRNA, nifH, and amoA genes. Smaller alterations in the distribution of genes were observed for the soil sample exposed to the nanoparticles functionalized with negatively charged carboxyl groups. This was attributed to the effect of the capping, which decreased both the release of ions and direct contact between the silver and the microorganisms, in addition to allowing the formation of bonds with soil cations, which further increased the barrier effect [71]. In other study, VandeVoort and Arai found that nanoparticles capped with polyvinylpyrrolidone (PVP) presented greater affinity with the soil and lower toxicity to denitrification bacteria, compared to uncapped nanoparticles [72].
In the present study, the smaller changes observed for the soils exposed to the capped nanoparticles, especially in terms of the quantities of bacteria, could also be attributed to the presence of the capping. These results agreed with the lower cytotoxic and genotoxic effects of the capped nanoparticles in the assays using in vitro exposure of cell cultures and Allium cepa, which could have been associated with possible inhibition of ions release.
Conclusions
The present study showed that capped biogenic nanoparticles synthesized from different filtrates of the fungus Trichoderma harzianum have biological activity in the control of the phytopathogen Sclerotinia sclerotiorum in vitro with the effects being attributed to the presence of the capping. Uncapped nanoparticles presented larger hydrodynamic diameters and were ineffective in inhibiting the development of S. sclerotiorum. Analysis of the cappings showed that the nanoparticles were capped with biomolecules derived from the filtrate and that they presented specific activities related to the hydrolytic enzymes of T. harzianum. The capped nanoparticles were generally less toxic, compared to the uncapped nanoparticles. These findings open perspectives for future studies investigating the composition and importance of the cappings of biogenic nanoparticles employed for the control of phytopathogens in agriculture.
Acknowledgements
We are grateful for the financial support for this work provided by the São Paulo State Research Foundation (FAPESP, grant numbers #2016/13692-6, #2017/13328-5, #2017/20932-6, #2017/21004-5, #2018/23608-8 and #2020/05816-2), the Coordination for the Improvement of Higher Education Personnel (CAPES) and the National Council for Scientific and Technological Development (CNPq). We also thank the Environmental Nanotechnology Laboratory (UNESP, Sorocaba) and the University of Sorocaba (UNISO).
Abbreviations
- AgNPs
Silver nanoparticles
- AgNP-TSC
Capped silver nanoparticles, with stimulation
- AgNP-TC
Capped silver nanoparticles, without stimulation
- AgNP-TS
Uncapped silver nanoparticles, with stimulation
- AgNP-T
Uncapped silver nanoparticles, without stimulation
- MTT
Thiazolyl Blue Tetrazolium Bromide
- SDS
Sodium Dodecyl Sulfate
- DLS
Dynamic Light Scattering
- NTA
Nanoparticle Tracking Analysis
- AFM
Atomic Force Microscopy
- SDS-PAGE
Sodium Dodecyl Sulfate Polyacrylamide Gel Electrophoresis
- NAGase
N-acetylglucosaminidase
- MI
Mitotic Index
- AI
Alteration Index
- MIC
Minimum Inhibitory Concentration
- qPCR
Real-Time Polymerase Chain Reaction
- ANOVA
One-Way Analysis of Variance
- FTIR
Fourier Transform Infrared Spectroscopy
- PVP
Polyvinylpyrrolidone
Authors’ contributions
MG-C and RL designed the research, analyzed data and wrote the manuscript; MG-C performed capping removal and characterization, enzymatic and SDS-PAGE assays, genotoxicity and biological activity assays. TG-C and TP-S performed cell culture and cytotoxicity assays. NB-J performed MIC assay and molecular analysis of soil microbiota. LC perfomed AFM and FTIR. LFF contributed with physico-chemical characterization and revised the manuscript. All authors read and approved the manuscript.
Funding
This work received financial support provided by the São Paulo State Research Foundation (FAPESP, grants #2016/13692-6, #2017/13328-5, #2017/20932-6, #2017/21004-5, #2018/23608-8 and #2020/05816-2), the Coordination for the Improvement of Higher Education Personnel (CAPES) and the National Council for Scientific and Technological Development (CNPq).
Availability of data and materials
All data generated or analysed during this study are included in this published article.
Ethics approval and consent to participate
Not applicable.
Consent for publication
All the authors agree with the publication.
Competing interests
The authors declare no competing interests.
Footnotes
Publisher’s note
Springer Nature remains neutral with regard to jurisdictional claims in published maps and institutional affiliations.
References
- 1.Alghuthaymi MA, Almoammar H, Rai M, Said-Galiev E, Abd-Elsalam KA. Myconanoparticles: synthesis and their role in phytopathogens management. Biotechnol Biotechnol Equip. 2015;29:221–36. doi: 10.1080/13102818.2015.1008194. [DOI] [PMC free article] [PubMed] [Google Scholar]
- 2.Pantidos N, Horsfall LE. Biological synthesis of metallic nanoparticles by bacteria, fungi and plants. J Nanomed Nanotechnol. 2014;5:1–10. doi: 10.4172/2157-7439.1000233. [DOI] [Google Scholar]
- 3.Kumar SA, Abyaneh MK, Gosavi SW, Kulkarni SK, Pasricha N, Ahmad A, Khan MI. Nitrate reductase-mediated synthesis of silver nanoparticles from AgNO3. Biotechnol Lett. 2007;29:439–45. doi: 10.1007/s10529-006-9256-7. [DOI] [PubMed] [Google Scholar]
- 4.Li G, He D, Qian Y, Guan B, Gao S, Cui Y, Yokoyama K, Wang L. Fungus-mediated green synthesis of silver nanoparticles using Aspergillus terreus. Int J Mol Sci. 2012;13:466–76. doi: 10.3390/ijms13010466. [DOI] [PMC free article] [PubMed] [Google Scholar]
- 5.Singh P, Kim Y, Zhang D, Yang D. Biological synthesis of nanoparticles from plants and microorganisms. Trends Biotechnol. 2016;34:588–99. doi: 10.1016/j.tibtech.2016.02.006. [DOI] [PubMed] [Google Scholar]
- 6.Tripathi RM, Gupta RK, Shrivastav A, Singh MP, Shrivastav BR, Singh P. Trichoderma koningiiassisted biogenic synthesis of silver nanoparticles and evaluation of their antimicrobial activity. Adv Nat Sci Nanosci Nanotechnol. 2013;4:1–5. doi: 10.1088/2043-6262/4/3/035005. [DOI] [Google Scholar]
- 7.Khan SA, Ahmad A. Enzyme mediated synthesis of water-dispersible nanoparticles, naturally protein capped, monodispersed gold nanoparticles; their characterization and mechanistic aspect. RSC Adv. 2014;4:7729–34. doi: 10.1039/c3ra43888k. [DOI] [Google Scholar]
- 8.Sanghi R, Verma P. Biomimetic synthesis and characterization of protein capped silver nanoparticles. Bioresour Technol. 2009;100:500–4. doi: 10.1016/j.biortech.2008.05.048. [DOI] [PubMed] [Google Scholar]
- 9.Singh P, Garg A, Pandit S, Mokkapati SSS, Mijakovic I. Antimicrobial effects of biogenic nanoparticles. Nanomaterials. 2018;8:1–19. doi: 10.3390/nano8121009. [DOI] [PMC free article] [PubMed] [Google Scholar]
- 10.Lima R, Seabra AB, Durán N. Silver nanoparticles: a brief review of cytotoxicity and genotoxicity of chemically and biogenically synthesized nanoparticles. J Appl Toxicol. 2012;32:867–79. doi: 10.1002/jat.2780. [DOI] [PubMed] [Google Scholar]
- 11.Sharma D, Kanchi S, Bisetty K. Biogenic synthesis of nanoparticles: a review. Arabian J Chem. 2019;12:3576–600. doi: 10.1016/j.arabjc.2015.11.002. [DOI] [Google Scholar]
- 12.Zewde B, Ambaye A, Stubbs J, Raghavan DA. Review of stabilized silver nanoparticles—synthesis, biological properties, characterization, and potential areas of applications. JSM Nanotechnol Nanomed. 2016;4:1–14. [Google Scholar]
- 13.Bhunia AK, Samanta PK, Aich D, Saha S, Kamilya T. Biocompatibility study of protein capped and uncapped silver nanoparticles on human hemoglobin. J Phys D Appl Phys. 2015;48:1–10. doi: 10.1088/0022-3727/48/23/235305. [DOI] [Google Scholar]
- 14.Gurunathan S, Kalishwaralal K, Vaidyanathan R, Deepak V, Pandian SRK, Muniyand J, Hariharan N, Eom SH. Biosynthesis, purification and characterization of silver nanoparticles using Escherichia coli. Colloids Surf B. 2009;74:328–35. doi: 10.1016/j.colsurfb.2009.07.048. [DOI] [PubMed] [Google Scholar]
- 15.Zhang T, Wang L, Chen Q, Chen C. Cytotoxic potential of silver nanoparticles. Yonsei Med J. 2014;55:283–91. doi: 10.3349/ymj.2014.55.2.283. [DOI] [PMC free article] [PubMed] [Google Scholar]
- 16.Banik S, Sharma P. Plant pathology in the era of nanotechnology. Indian Phytopath. 2011;64:120–7. [Google Scholar]
- 17.Bolton MD, Thomma BPHJ, Nelson BD. Sclerotinia sclerotiorum (Lib.) De Bary: biology and molecular traits of a cosmopolitan pathogen. Mol Plant Pathol. 2006;7:1–16. doi: 10.1111/j.1364-3703.2005.00316.x. [DOI] [PubMed] [Google Scholar]
- 18.Krishnaraj C, Ramachandran R, Mohan K, Kalaichelvan PT. Optimization for rapid synthesis of silver nanoparticles and its effect on phytopathogenic fungi. Spectrochim Acta Part A. 2012;93:95–9. doi: 10.1016/j.saa.2012.03.002. [DOI] [PubMed] [Google Scholar]
- 19.Guilger M, Pasquoto-Stigliani T, Bilesky-Jose N, Grillo R, Abhilash PC, Fraceto LF, Lima R. Biogenic silver nanoparticles based on Trichoderma harzianum: synthesis, characterization, toxicity evaluation and biological activity. Sci Rep. 2017;7:1–13. doi: 10.1038/srep44421. [DOI] [PMC free article] [PubMed] [Google Scholar]
- 20.Min JS, Kim KS, Kim SW, Jung JH, Lamsal K, Kim SB, Jung M, Lee YS. Effects of colloidal silver nanoparticles on sclerotium-forming phytopathogenic fungi. Plant Pathol J. 2009;25:376–80. doi: 10.5423/PPJ.2009.25.4.376. [DOI] [Google Scholar]
- 21.Elgorban AM, Aref SM, Seham SM, Elhindi KM, Bahkali AH, Sayed SR, Manal MA. Extracellular synthesis of silver nanoparticles using Aspergillus versicolor and evaluation of their activity on plant pathogenic fungi. Mycosphere. 2016;7:844–52. doi: 10.5943/mycosphere/7/6/15. [DOI] [Google Scholar]
- 22.Mahdizadeh V, Safaie N, Khelghatibana F. Evaluation of antifungal activity of silver nanoparticles against some phytopathogenic fungi and Trichoderma harzianum. J Crop Prot. 2015;4:291. [Google Scholar]
- 23.Guilger-Casagrande M, Germano-Costa T, Pasquoto-Stigliani T, Fraceto LF, Lima R. Biosynthesis of silver nanoparticles employing Trichoderma harzianum with enzymatic stimulation for the control of Sclerotinia sclerotiorum. Sci Rep. 2019;9:1–9. doi: 10.1038/s41598-019-50871-0. [DOI] [PMC free article] [PubMed] [Google Scholar]
- 24.Jain N, Bhargava A, Rathi M, Dilip V, Panwar J. Removal of protein capping enhanced the antibacterial efficiency of biosynthesized silver nanoparticles. PloS One. 2015;10:1–19. doi: 10.1371/journal.pone.0134337. [DOI] [PMC free article] [PubMed] [Google Scholar]
- 25.Chowdhury S, Basu A, Kundu S. Green synthesis of protein capped silver nanoparticles from phytopathogenic fungus Macrophomina phaseolina (Tassi) Goid with antimicrobial properties against multidrug-resistant bacteria. Nanoscale Res Lett. 2014;9:1–11. doi: 10.1186/1556-276X-9-365. [DOI] [PMC free article] [PubMed] [Google Scholar]
- 26.Bradford MM. A rapid and sensitive method for the quantification of microgram quantities of protein utilizing the principle of protein-dye binding. Anal Biochem. 1976;7:248–54. doi: 10.1016/0003-2697(76)90527-3. [DOI] [PubMed] [Google Scholar]
- 27.Qualhato TF, Lopes FAC, Steindorf AS, Brandão RS, Jesuino RSA, Ulhoa CJ. Mycoparasitism studies of trichoderma species against three phytopathogenic fungi: evaluation of antagonism and hydrolytic enzyme production. Biotechnol Lett. 2013;35:1461–8. doi: 10.1007/s10529-013-1225-3. [DOI] [PubMed] [Google Scholar]
- 28.Lima R, Feitosa LO, Pereira AE, Moura MG, Aouada FA, Mattoso LHC, Fraceto LF. Evaluation of the genotoxicity of chitosan nanoparticles for use in food packaging films. J Food Sci. 2010;75:89–96. doi: 10.1111/j.1750-3841.2010.01682.x. [DOI] [PubMed] [Google Scholar]
- 29.Singh NP, Mccoy MT, Tice RR, Schneider EL. A simple technique for quantification of low levels of DNA damage in individual cells. Exp Cell Res. 1988;175:175–84. doi: 10.1016/0014-4827(88)90265-0. [DOI] [PubMed] [Google Scholar]
- 30.Collins AR, Fleming IM, Gedik CM. Vitro repair of oxidative and ultraviolet-induced DNA damage in supercoiled nucleoid DNA by human cell extract. Biochim Biophys Acta. 1994;1219:724–7. doi: 10.1016/0167-4781(94)90236-4. [DOI] [PubMed] [Google Scholar]
- 31.Hjelmso MH, Hansen LH, Baelum J, Feld L, Holben WE, Jacobsen CS. High-resolution melt analysis for rapid comparison of bacterial community compositions. Appl Environ Microbiol. 2014;80,:3568–75. doi: 10.1128/AEM.03923-13. [DOI] [PMC free article] [PubMed] [Google Scholar]
- 32.Maruyama CR, Guilger M, Pascoli M, Bilesky-Jose N, Abhilash PC, Fraceto LF, Lima R. Nanoparticles based on chitosan as carriers for the combined herbicides imazapic and imazapyr. Sci Rep. 2016;6:1–13. doi: 10.1038/s41598-016-0001-8. [DOI] [PMC free article] [PubMed] [Google Scholar]
- 33.Singh D, Rathod V, Ninganagouda S, Hiremath J, Singh AK, Mathew J. Optimization and characterization of silver nanoparticle by endophytic fungi Penicillium sp. isolated from Curcuma longa (Turmeric) and application studies against MDR E. coli and S. aureus. Bioinorg Chem Appl. 2014;2014:1–8. doi: 10.1155/2014/408021. [DOI] [PMC free article] [PubMed] [Google Scholar]
- 34.Mohanta TK, Panda SK, Jayabalan R, Sharma N, Bastia AK, Mohanta TK. Antimicrobial, antioxidante and cytotoxic activity of silver nanoparticles synthesized by leaf extract of Erythrina suberosa (Roxb.) Front Mol Biosci. 2017;4:1–9. doi: 10.3389/fmolb.2017.00014. [DOI] [PMC free article] [PubMed] [Google Scholar]
- 35.Abdelrahim K, Mahmoud SY, Ali AM, Almaary KS, Mustafa AEMA, Husseiny SM. Extracellular biosynthesis of silver nanoparticles using Rhizopus Stolonifer. Saudi J Biol Sci. 2017;24:208–16. doi: 10.1016/j.sjbs.2016.02.025. [DOI] [PMC free article] [PubMed] [Google Scholar]
- 36.Gurunathan S, Park JH, Han JW, Kim JH. Comparative assessment of the apoptotic potential of silver nanoparticles synthesized by Bacillus tequilensis and Calocybe indica in MDA-MB-231 human breast cancer cells: targeting P53 for anticancer therapy. Int J Nanomed. 2015;10:4203–23. doi: 10.2147/IJN.S83953. [DOI] [PMC free article] [PubMed] [Google Scholar]
- 37.Suresh AK, Pelletier DA, Wang W, Morrell-Falvey JL, Gu B, Dokttcz MJ. Cytotoxicity induced by engineered silver nanocrystallites is dependent on surface cappings and cell types. Langmuir. 2012;28:2727–35. doi: 10.1021/la2042058. [DOI] [PubMed] [Google Scholar]
- 38.Ballotin D, Fulaz S, Souza ML, Corio P, Rodrigues AG, Souza AO, Gaspari PM, Gomes AF, Gozzo F, Tasic L. Elucidating protein involvement in the stabilization of the biogenic silver nanoparticles. Nanoscale Res Lett. 2016;11:1–9. doi: 10.1186/s11671-016-1538-y. [DOI] [PMC free article] [PubMed] [Google Scholar]
- 39.Elamawi RM, Al-Harbi RE, Hendi AA. Biosynthesis and characterization of silver nanoparticles using Trichoderma longibrachiatum and their effect on phytopathogenic fungi. Egyptian J Biol Pest Control. 2018;28:1–11. doi: 10.1186/s41938-018-0028-1. [DOI] [Google Scholar]
- 40.Behra R, Sigg L, Clift MJD, Herzog F, Minghetti M, Johnston B, Petri-Fink A, Rothen-Rutishauser B. Bioavailability of silver nanoparticles and Ions: from a chemical and biochemical perspective. J R Soc Interface. 2013;10:1–15. doi: 10.1098/rsif.2013.0396. [DOI] [PMC free article] [PubMed] [Google Scholar]
- 41.Zhang H, Chen B, Banfield JF. Particle size and pH effects on nanoparticle dissolution. J Phys Chem C. 2010;114:14876–84. doi: 10.1021/jp1060842. [DOI] [Google Scholar]
- 42.Sumithra M, Aparna Y, Rao PR, Reddy KS, Reddy PR. Morphological change of silver nanoparticles by the effect of synthesis parameters. Mater Today Proc. 2016;3:2278–83. doi: 10.1016/j.matpr.2016.04.137. [DOI] [Google Scholar]
- 43.Rodrigues AG, Ping LY, Marcato PD, Alves OL, Silva MCP, Ruiz RC, Melo IS, Tasic L, De Souza AO. Biogenic antimicrobial silver nanoparticles produced by fungi. Appl Microbiol Biotechnol. 2013;97:1–8. doi: 10.1007/s00253-012-4209-7. [DOI] [PubMed] [Google Scholar]
- 44.Jain N, Bhargava A, Majumdar S, Tarafdar JC, Panwar J. Extracellular biosynthesis and characterization of silver nanoparticles using Aspergillus flavus NJP08: a mechanism perspective. Nanoscale. 2011;3:635–41. doi: 10.1039/C0NR00656D. [DOI] [PubMed] [Google Scholar]
- 45.Daphedar A, Taranath TC. Characterization and cytotoxic effect of biogenic silver nanoparticles on mitotic chromosomes of Drimia polyantha (Blatt. & Mccann) stearn. Toxicol Rep. 2018;5:910–8. doi: 10.1016/j.toxrep.2018.08.018. [DOI] [PMC free article] [PubMed] [Google Scholar]
- 46.Priya K, Vijayakumar M, Janani B. Chitosan-mediated synthesis of biogenic silver nanoparticles (AgNPs), nanoparticle characterisation and in vitro assessment of anticancer activity in human hepatocellular carcinoma HePG2 cells. Int J Biol Macromol. 2020;149:844–52. doi: 10.1016/j.ijbiomac.2020.02.007. [DOI] [PubMed] [Google Scholar]
- 47.Parmar A, Kaur G, Kapil S, Sharma V, Choudhary MK, Sharma S. Novel biogenic silver nanoparticles as invigorated catalytic and antibacterial tool: a cleaner approach towards environmental remediation and combating bacterial invasion. Mater Chem Phys. 2019;238:1–10. doi: 10.1016/j.matchemphys.2019.121861. [DOI] [Google Scholar]
- 48.Jyoti K, Baunthiyal M, Singh A. Characterization of silver nanoparticles synthesized using Urtica dioica linn. Leaves and their synergistic effects with antibiotics. J Radiat Res Appl Sci. 2016;9:217–27. doi: 10.1016/j.jrras.2015.10.002. [DOI] [Google Scholar]
- 49.Li X, Odoom-Wubah T, Huang J. Biosynthesis of Ag–Pd bimetallic alloy nanoparticles through hydrolysis of cellulose triggered by silver sulfate. RSC Adv. 2018;8:30340–5. doi: 10.1039/C8RA04301A. [DOI] [PMC free article] [PubMed] [Google Scholar]
- 50.Ahluwalia V, Kumar J, Sisodia R, Shakil NA, Walia S. Green synthesis of silver nanoparticles by Trichoderma harzianum and their bio-efficacy evaluation against Staphylococcus aureus and Klebsiella pneumonia. Ind Crops Prod. 2014;55:202–6. doi: 10.1016/j.indcrop.2014.01.026. [DOI] [Google Scholar]
- 51.Emmons ED, Fallas JC, Kamisetty VK, Chien WM, Covington AM, Chellappa RS, Gramsch SA, Hemley RJ, Chandra D. High-pressure Raman Spectroscopy of tris (hydroxymethyl) aminomethane. J Phys Chem B. 2010;114:5649–56. doi: 10.1021/jp9092892. [DOI] [PubMed] [Google Scholar]
- 52.Wu R, Yao Y. Tris (Hydroxymethyl) Aminomethane, a pure organic thermal stabilizer for poly (vinyl chloride). International Conference on Materials for Renewable Energy and Environment 2013;2:613–616.
- 53.Marco JL, Felix CR. Purification and characterization of a β-glucanase produced by Trichoderma harzianum showing biocontrol potential. Braz Arch Biol Technol. 2007;50:21–9. doi: 10.1590/S1516-89132007000100003. [DOI] [Google Scholar]
- 54.Ulhoa CJ, Peberdy JF. Purification and some properties of the extracellular Chitinase produced by Trichoderma harzianum. Enzyme Microb Technol. 1992;14:236–40. doi: 10.1016/0141-0229(92)90072-V. [DOI] [Google Scholar]
- 55.Carlson C, Hussain SM, Schrand AM, Braydich-Stolle LK, Hess KL, Jones RL, Schlager JJ. Unique cellular interaction of silver nanoparticles: size-dependent generation of reactive oxygen species. J Phys Chem B. 2008;112:13608–19. doi: 10.1021/jp712087m. [DOI] [PubMed] [Google Scholar]
- 56.Zhao W, Lu X, Yuan Y, Liu C, Yang B, Hong H, Wang G, Zeng F. Effect of size and processing method on the cytotoxicity of realgar nanoparticles in cancer cell lines. Int J Nanomed. 2011;6:1569–77. doi: 10.2147/IJN.S21373. [DOI] [PMC free article] [PubMed] [Google Scholar]
- 57.Seabra AB, Durán N. Nitric oxide-releasing vehicles for biomedical applications. J Mater Chem. 2010;20:1624–37. doi: 10.1039/B912493B. [DOI] [Google Scholar]
- 58.Asharani PV, Hande MP, Valiyaveettil S. Anti-proliferative activity of silver nanoparticles. BMC Cell Biol. 2009;10:1–14. doi: 10.1186/1471-2121-10-65. [DOI] [PMC free article] [PubMed] [Google Scholar]
- 59.Abboud MAA. Fungal biosynthesis of silver nanoparticles and their role in control of Fusarium Wilt of sweet pepper and soil-borne fungi in vitro. Int J Pharmacol. 2018;14:773–80. doi: 10.3923/ijp.2018.773.780. [DOI] [Google Scholar]
- 60.Mishra S, Singh BR, Naqvi AH, Singh HB. Potential of biosynthesized silver nanoparticles using Stenotrophomonas sp. BHU-S7 (MTCC 5978) for management of soil-borne and foliar phytopathogens. Sci Rep. 2017;7:1–15. doi: 10.1038/s41598-016-0028-x. [DOI] [PMC free article] [PubMed] [Google Scholar]
- 61.Troian RF, Steindorff AS, Ramada MHS, Arruda W, Ulhoa CJ. Mycoparasitism studies of Trichoderma harzianum against Sclerotinia sclerotiorum: evaluation of antagonism and expression of cell wall-degrading enzymes genes. Biotechnol Lett. 2014;36:2095–101. doi: 10.1007/s10529-014-1583-5. [DOI] [PubMed] [Google Scholar]
- 62.Sood M, Kapoor D, Kumar V, Sheteiwy MS, Ramakrishnan M, Landi M, Araniti F, Sharma A. richoderma: the “Secrets” of a multitalented biocontrol agent. Plants. 2020;9:1–25. doi: 10.3390/plants9060762. [DOI] [PMC free article] [PubMed] [Google Scholar]
- 63.Yun J, Lee DG. Silver nanoparticles a novel antimicrobial agent. In: Grumezescu AM, editor Antimicrobial nanoarchitectonics: from synthesis to applications, 2017; pp. 139–166.
- 64.Roy A, Bulut O, Some S, Mandal AK, Yilmaz MD. Green synthesis of silver nanoparticles:biomolecule-nanoparticle organizations targeting antimicrobial activity. RSC Adv. 2019;9:2673–702. doi: 10.1039/C8RA08982E. [DOI] [PMC free article] [PubMed] [Google Scholar]
- 65.Skladanowski M, Golinska P, Rudnicka K, Dahm H, Rai M. Evaluation of cytotoxicity, immune compatibility and antibacterial activity of biogenic silver nanoparticles. Med Microbiol Immunol. 2016;205:603–13. doi: 10.1007/s00430-016-0477-7. [DOI] [PMC free article] [PubMed] [Google Scholar]
- 66.Misra SK, Dybowska A, Berhanu D, Luoma SN, Valsami-Jhones E. The complexity of nanoparticles dissolution and Its importance in nanotoxicological studies. Sci Total Environ. 2012;438:225–32. doi: 10.1016/j.scitotenv.2012.08.066. [DOI] [PubMed] [Google Scholar]
- 67.Jiang X, Foldbjerg R, Miclaus T, Wang L, Singh R, Hayashi Y, Sutherland D, Chen C, Autrup H, Beer C. Multi-platform genotoxicity analysis of silver nanoparticles in the model cell line CHO-K1. Toxicol Lett. 2013;222:55–63. doi: 10.1016/j.toxlet.2013.07.011. [DOI] [PubMed] [Google Scholar]
- 68.Kim DH, Park JC, Jeon GE, Kim CS, Seo JH. Effect of the size and shape of silver nanoparticles on bacterial growth and metabolism by monitoring optical density and fluorescence intensity. Biotechnol Bioprocess. 2017;22:210–7. doi: 10.1007/s12257-016-0641-3. [DOI] [Google Scholar]
- 69.Ivask A, Kurvet I, Kasemets K, Blinova I, Aruoja V, Suppi S, Vija H, Käkinen A, Titma T, Heinlaan M, et al. Size-dependent toxicity of silver nanoparticles to bacteria, yeast, algae, crustaceans and mammalian cells in vitro. PLoS One. 2014;9:1–14. doi: 10.1371/journal.pone.0102108. [DOI] [PMC free article] [PubMed] [Google Scholar]
- 70.Rajput S, Werezuk R, Lange RM, McDermott MT. Fungal isolate optimized for biogenesis of silver nanoparticles with enhanced colloidal stability. Langmuir. 2016;32:8688–97. doi: 10.1021/acs.langmuir.6b01813. [DOI] [PubMed] [Google Scholar]
- 71.Grün AL, Manz V, Kohl YL, Meier F, Straskraba S, Jost C, Drexel R, Emmerling C. Impact of silver nanoparticles (AgNP) on soil microbial community depending on functionalization, concentration, exposure time, and soil texture. Environ Sci Eur. 2019;31:1–22. doi: 10.1186/s12302-019-0196-y. [DOI] [Google Scholar]
- 72.VandeVoort AR, Arai Y. Effect of silver nanoparticles on soil denitrification kinetics. Ind Biotechnol. 2012;8:358–64. doi: 10.1089/ind.2012.0026. [DOI] [Google Scholar]
Associated Data
This section collects any data citations, data availability statements, or supplementary materials included in this article.
Data Availability Statement
All data generated or analysed during this study are included in this published article.


