

Abstract
Anthrax lethal factor (LF) is a zinc-dependent endoprotease and a critical virulence factor for Bacillus anthracis, the causative agent of anthrax. The mass spectrometry (MS) method for total-LF quantification includes three steps; 1) LF specific antibody capture/concentration, 2) LF-specific hydrolysis of a peptide substrate, and 3) detection and quantification of LF-cleaved peptides by isotope-dilution MALDI-TOF/MS. Recombinant LF spiked plasma was used for calibration and quality control (QC) materials. Specificity was 100% from analysis of serum and plasma from 383 non-infected humans, 31 rabbits, and 24 rhesus macaques. Sensitivity was 100% from 32 human clinical anthrax cases including infections by inhalation, ingestion, cutaneous and injection exposures and experimental infections for 29 rabbits and 24 rhesus macaques with inhalation anthrax. Robustness evaluation included sample storage, serum and plasma, antimicrobial and antitoxin effects and long-term performance. Data from 100 independent runs gave detection limits 0.01 ng/mL (111 amol/mL) for the 4-h method and 0.0027 ng/mL (30 amol/mL) for an alternate 20-h method. QC precision ranged from 7.7 to 14.8% coefficient of variation and accuracy from 0.2 to 9.8% error. The validated LF MS method provides sensitive quantification of anthrax total-LF using a robust high throughput platform for early diagnosis and evaluation of therapeutics during an anthrax emergency.
Keywords: Bacillus anthracis, Anthrax, Bacterial protein toxin, Lethal factor, Enzyme activity, Isotope-dilution mass spectrometry
Introduction
Anthrax is a bacterial infection caused by the Gram-positive, spore-forming organism Bacillus anthracis. Cutaneous, ingestion or inhalation anthrax occur when spores enter the body via pre-existing lesions in the dermal or intestinal integument, or by inhalation, respectively [1]. B. anthracis may also cause a serious soft-tissue infection from injection of spore-contaminated heroin [2]. Though B. anthracis is a Category A select agent with high potential for terrorist use, naturally-occurring anthrax is reported frequently around the world (http://www.promedmail.org). As a zoonotic disease, most human anthrax outbreaks are associated with close contact with infected domestic animals and their products. The majority of naturally-occurring cases consist of cutaneous anthrax. Inhalation anthrax has the highest case:fatality ratio; as high as 94% in the absence of early antimicrobial intervention and 45% with early treatment and aggressive supportive care [3,4].
B. anthracis virulence is dependent on the production of the two binary protein exotoxins and a gamma-linked poly-D-glutamic acid (PGA) capsule [5]. The binary toxins are composed of three distinct proteins; protective antigen (PA), lethal factor (LF), and edema factor (EF). PA, which is responsible for toxin internalization, combines with EF, an adenylyl cyclase, or LF, a zinc-dependent endoproteinase, forming edema toxin (ETx) and lethal toxin (LTx), respectively [6]. LF is a 90,000 Da protein that hydrolyzes and inactivates members of the mitogen-activated protein kinase kinase (MAPKK) family of response regulators that are central to inflammatory signaling pathways [7–9]. EF is an 89,000 Da protein adenylyl cyclase that converts ATP to cyclic-adenosine monophosphate (cAMP). It causes the classical edema of anthrax and also has immune-suppressive properties [10]. Together, the anthrax toxins synergize to disrupt immune responses and promote the pathogenesis and proliferation of B. anthracis in vivo during infection [1].
Early diagnosis and prompt antimicrobial interventions are key to reducing mortality rates. Specialized anti-toxin therapeutic medical countermeasures (MCM) may also help to reduce mortality rates, especially with advanced disease. Validated, rapid, high throughput technologies for detection and quantification of B. anthracis virulence factors, especially the toxin components, are of high public health impact for early disease detection. They are also useful for evaluating the effectiveness of anthrax MCM by measuring toxin clearance during treatment [11]. A quantitative, high analytical sensitivity assay that detects specific proteins secreted by the organism, rather than the organism itself meets these objectives.
As the universal protein responsible for intoxication by both lethal and edema toxins and the target of most therapeutics, many methods for PA have been developed [12–15]. For the more sensitive of these assays, precision and/or accuracy were limited in practice, and they were determined to be better for qualitative detection, rather than quantitation of PA [14,15]. While PA is an attractive target, the enzymatic activity of LF provides a unique opportunity for detection and quantification. Instead of detection of the LF molecule itself, its cleavage of a peptide substrate at specific residues and detection of its products amplifies its presence many-fold. Methods utilizing LF activity have been developed using Förster resonance energy transfer (FRET) and electrochemiluminescence (ECL) modified LF-substrates [16–18]. Both strategies rely on changes in their respective signal with cleavage of the target substrate by LF. These methods have been developed primarily to screen inhibitors of LF, using relatively high LF levels, 2–10 nM, equivalent to 180–899 ng/mL [16,17], and 5000 ng/mL LF [18]. None have been used to quantify LF or evaluate the limits of LF detection which is needed for early diagnosis.
We previously described development of a matrix-assisted laser desorption ionization-time-of-flight (MALDI-TOF) MS method for quantification of total-LF activity [19,20]. Here we report the optimized, validated method including performance characteristics and long-term stability. The method uses the LF zinc-endoproteinase activity to amplify detection via its cleavage of a peptide substrate. In contrast to diagnostic methods that detect the organism, MS detection of LF was not subject to interference from antimicrobials which clear bacilli or immunotherapeutic intervention [11,20]. Application of the method to track toxin levels in inhalation anthrax during the first clinical use of the anti-toxin anthrax immune globulin intravenous (Human) (AIGIV, Anthrasil™) demonstrated its utility for tracking toxin clearance [11]. LF measurements were required as part of the investigational new drug (IND) protocol for the use of AIGIV. The LF MS method has been validated to characterize its quantitative and diagnostic performance.
Material and methods
Chemicals, reagents, equipment and safety
Chemicals and reagents were purchased from Sigma-Aldrich (Saint Louis, MO) except where indicated. Dynabeads® MyOne™ Tosyl-activated magnetic beads were purchased from Invitrogen Co. (Carlsbad, CA). Recombinant LF (rLF) was purchased from List Biological Laboratories (Campbell, CA). Two non-neutralizing monoclonal anti-LF antibodies (LF-mAb) were prepared in the Division of Scientific Resources of CDC as previously described [19]. AIGIV was obtained from the Division of Strategic National Stockpile, CDC (Atlanta, GA). Pooled human donor plasma (n = 10 individuals per pool) (PH-plasma) and individual normal North American (NNA) donor serum and plasma samples were obtained from Interstate Blood Bank (Memphis, TN). Equipment included a Kingfisher 96 magnetic particle processor (Thermo Fisher Scientific., Waltham, MA), 4800 Plus Proteomics Analyzer (MALDI-TOF MS) (AB Sciex, Foster City, CA) and Gene Amp@ PCR thermocycler (ThermoFisher, Waltham, MA). All procedures and sample handling were conducted at Biosafety Level 2 containment as recommended and described [21]. Additional safety measures are described in each section as needed.
Peptides
The peptide substrate (LF-S), SKARRKKVYPYPXENFPPSTARPT (2804.2 m/z) (Midwest Biotechnology, Indianapolis, Indiana), is hydrolyzed by LF between the proline and tyrosine (bold font) yieldings two smaller peptides, an amino-terminal product (NTP), SKARRKKVYP (1232.8 m/z) and carboxy-terminal product (CTP), YPXENFPPSTARPT (where X = norleucine) (1589.8 m/z). The norleucine included in the optimized substrate was substituted for a methionine in the original published LF method [19]. The change prevented oxidation of methionine and two potential mass forms and peaks in the substrate and more importantly the cleaved CTP, as described previously [22]. Internal standard (IS) peptides identical to the NTP and CTP products included a single heavy alanine (13C3H4D 153NO2) in each peptide. The NTP and CTP IS were each +7 mass units relative to the native peptides, NTIS, SK(A+7)RRKKVYP (1239.8 m/z) and CTIS, YPXENFPPST (A+7)RPT (1596.8 m/z) (Los Alamos National Laboratory, Los Alamos, NM).
Calibration standards and quality control material
The original standards, quality control (QC) and test samples, were prepared in 2007 by spiking rLF (1 μg/μL) in 0.45 μm filtered PH-plasma, constructing a 13 level standard series from 100 to 0.0125 ng/mL and three QCs at 6.3, 1.25 and 0.14 ng/mL. New LF standards from 11.8 to 0.003 ng/mL and three QC’s at 0.722, 0.203, and 0.044 ng/mL were prepared in PH-plasma. Both standard sets were prepared using a non-serial strategy with multiple diluted stock pools. The new standards were adjusted to match the original 2007 standards for consistency. Equivalence was demonstrated by cross quantitation of standards, QCs and 66 clinical and animal infection samples.
LF MS method
Step 1) Magnetic immunopurification (1-h)
LF specific magnetic antibody coated beads (LF-MAB’s) were prepared by cross linking two anti-LF monoclonal antibodies, AVR1674 (LF-MAB-1) and AVR1675 (LF-MAB-2), to tosyl-activated magnetic beads at 2 mg each per mL of beads as directed by the manufacturer. Automated sample preparation (Kingfisher 96) moved the beads through multiple steps using 100 μL samples/standards in 900 μL phosphate buffered saline (PBS) with 0.05% Tween 20 and processed as described previously [23].
Step 2) LF peptide cleavage reaction (2-h and 18-h)
LF immobilized on LF-MABs were transferred to 30 μL of LF reaction buffer containing 50 μM LF-S and protease inhibitor described previously [19]. The beads and substrate were incubated in a thermocycler at 37 °C for 2-h, then 5 μL was removed and analyzed by MS (Step 3 below). The remaining 25 μL continued to react at 37 °C in a PCR thermocycler for at least 18-h or overnight (ON).
Step 3) MALDI-TOF MS analysis and quantification
At 2-h and 18-h reaction times, 5 μL of the LF reaction mix was added to 45 μL of MALDI matrix, α-cyano-4-hydroxycinnamic acid (CHCA) at 3.125 mg/mL, containing 9.45 pmol NTIS and 6.25 pmol CTIS (CHCA-IS), then spotted at 1 μL per spot in quadruplicate onto an Opti-TOF 384-spot stainless steel MALDI plate (AB Sciex, Foster City, CA). Mass spectra were acquired and processed as described previously [23]. The CTP/CTIS peak area ratio (CT-response) were plotted versus LF concentration with dual log10 transformation and 5-parameter logistic (5 PL) regression with robust weighting as described previously for lethal toxin complex [24]. The total time for the primary LF method is 4-h (1-h sample preparation, 2-h reaction, 1-h MS analysis) and for the ON method is 20-h (1-h sample prep, ≥ 18-h reaction, 1-h MS).
Diagnostic specificity and sensitivity
For evaluation of diagnostic specificity (DSP) and diagnostic sensitivity (DSN) a true negative (TN) was assigned to all samples with no evidence of anthrax and a true positive (TP) was assigned to acute stage samples from human cases or animals with confirmed anthrax. Test results were categorized as positive (P) for LF values ≥ LOD or negative (N) results < less than the LOD. DSP was calculated from TN/(TN + FP), where FP = false positive. The DSN was calculated from TP/(TP + FN), where FN = false negative.
Non-anthrax samples analyzed for specificity included those for 383 humans, 24 rhesus macaques and 31 New Zealand white rabbits (NZWR) and infection samples for sensitivity were from 32 confirmed human clinical cases comprising all four forms of anthrax [11,25–29], 24 RM and 29 NZWR (Table 1). All infections were confirmed as anthrax by culture methods except for cutaneous anthrax cases which were confirmed as described [29]. The CDC IRB Protocol #5343.0, ‘Use of Residual Human Specimens for Laboratory Diagnostic Research’ covered the use of all human samples coded with no identifiers. IACUC approvals are detailed below.
Table 1. Samples from individuals without and with Bacillus anthracis infection analyzed for lethal factor by MS.
Archived non-anthrax samples from the Meningitis and Special Pathogens Branch at CDC for cross validation which included: *Legionnaires’ Disease (n = 13), Chlamydophila pneumoniae (n = 9), Staphylococcus aureus (n = 3), influenza (n = 1), children from San Diego without vaccinations (n = 5), elderly individuals from Argentina (n = 5).
| Source (species) | Specimen Type | Background/Exposure | Number | LF Result |
|---|---|---|---|---|
| A. Specificity | ||||
| Human | Serum | Normal/North American | 183 | 183 neg |
| Human | Plasma | Normal/North American | 160 | 160 neg |
| Human | Serum | Other Infections* | 40 | 40 neg |
| NZW Rabbits | Plasma | Pre-exposure (day 0) | 31 | 31 neg |
| Rhesus macaques | Serum/plasma | Pre-exposure day −30, −40 | 24 | 24 neg |
| Total Individuals | 438 | 438 | ||
| B. Sensitivity | ||||
| Human | Serum/Plasma | Inhalation | 3 | 3 pos |
| Human | Serum | Cutaneous | 18 | 18 pos |
| Human | Serum/Plasma | Gastrointestinal | 1 | 1 pos |
| Human | Serum/Plasma | Injection | 12 | 12 pos |
| NZW Rabbits | Plasma | Inhalation post-exposure | 29 | 29 pos |
| Rhesus macaques | Serum/plasma | Inhalation post-exposure | 24 | 24 pos |
| Total Individuals | 87 | 87 | ||
Neg = negative for LF or < LOD, pos = positive result for LF.
Animal studies
Archived rhesus macaque (RM) plasma samples from confirmed inhalation anthrax were used from a Battelle Biomedical Research Center (BBRC) IACUC (570-CG920201) and CDC IACUC (1459BOYMONX) approved animal study reported previously [20]. 24 RM received a target 200 LD50 aerosolized B. anthracis Ames spores. Plasma samples were collected in EDTA tubes in 19 animals at −30 days and post-exposure at 12, 18, 24, 30, 36, 48, 72, 96, 120, 144, 168-h and at 14, 21, 28 and 35 days in survivors. Serum was collected for 5 animals as described previously [20]. Six were treated with ciprofloxacin at 16 mg/kg twice daily by oral gavage for 14 days in survivors. Of these 6, treatment in 4 commenced at 48-h and in 2 at 72-h post-challenge. Study samples from Battelle Biomedical Research Center and NIH/NIAID collected from NZWR (Battelle IACUC study #589-G607604) were described previously [30]. Plasma was collected at time 0 (just before exposure) and at 6,12,18,24,30,36,42, 48 and 72-h following exposure. Infections in NZWR were confirmed by culture and in RM by both culture and pagA PCR. As described previously, all samples were filter-sterilized and sterility confirmed by culture methods before receipt in our laboratory [20,30].
LF method performance validation
Accuracy (% error), precision as the percent coefficient of variation (%CV) and the empirical limit of detection (LOD) were determined from 100 independent standards/QC analyses for the 4-h and ON methods. Accuracy can also be shown from linearity, which is obtained from the linear regression of actual vs calculated values for which a slope between 0.8 and 1.2 with a positive correlation coefficient (r2) ≥ 0.85 is recommended. Standards materials used for LOD determination included the plasma blank and three standards, one above, one near, and one below the LOD. The y-intercept and slope of the linear equation of the standard deviation (SD) versus concentration along with the SD and mean of the blank (SDb and meanb) were used to calculate the LOD concentration: ConcLOD = [meanb + 1.645(SDb + intercept)]/[1–1.645(slope)] [31].
Accuracy and inter-day precision were also characterized for 206 blinded proficiency testing samples spiked in plasma at 0.721, 0.383, 0.204, 0.108, and 0.058 ng/mL and plasma blanks analyzed on 17 days for four analysts. Intra-day accuracy and precision were determined from these decoded PT sample sets for runs that had three or more results per level per day.
Sample matrices, interferences and stability
Sample matrices were tested using LF spiked from 0.003 to 1.56 ng/mL in 200 μL of serum and plasma, then analyzed in duplicate with an ON reaction time. Serum LF levels were calculated against plasma and linearity determined. Interference by anti-PA anti-toxin was tested by spiking AIGIV at 200 μg/mL anti-PA IgG into 20 μL LF plasma standards (0.025–100 ng/mL and plasma blank). Standards and AIGIV were mixed for 1-h then analyzed for LF alongside non-AIGIV standards. A high clinical anthrax sample without and with AIGIV spiked at 200 μg/mL anti-PA IgG, was mixed for 1-h to bind AIGIV, then diluted 1:1000 in PBS, then analyzed in triplicate for LF. Interferences from antimicrobial treatment were assessed by analyzing LF before and after treatment for animal and clinical inhalation anthrax described above.
Aliquots of plasma samples with 0.45 ng/mL and 1.2 ng/mL LF were stored at 4 °C, then retrieved weekly for 8 weeks, then stored at −80 °C until analysis. Two aliquots each of plasma samples with 0.0293, 0.117 and 0.47 ng/mL LF were freeze-thawed 1 to 5 times, then analyzed for LF. Pre-diluted, aliquotted LF plasma standards and QC sets were analyzed from 2007 to 2015 allowing the assessment of long term stability of small volumes of samples stored at −80 °C. 158 standards/QC sets over a 9-year span were included and QC precision assessed.
Data reporting and statistical analyses
Custom Visual Basic.Net (VB.NET) program were used to calculate values for LF with dual log10 transformation and 5-parameter logistic (5 PL) regressions with robust weighting [24]. LF levels were considered positive when both above the LOD and CT-response ≥ 3 times the blank response. LF levels were reported in nanograms per milliliter (ng/mL) unless otherwise indicated. Culture results are described in the figure legend and previously [20].
Results and discussion
The MS LF detection method has been used by the CDC for diagnosis of clinical anthrax cases since 2006, in compliance with the Clinical Laboratory Improvement Amendments (CLIA) Act, 1988 [32]. It has been applied to studies of antimicrobial treatment of anthrax in animal models, to confirm and rule-out anthrax in human cases, and for measuring the clearance of LF during compassionate use of the investigational anti-toxin drug, AIGIV, for treatment of potentially fatal cases of inhalation and injection anthrax. Therefore, it was important to report the validation and performance data of the anthrax LF method and demonstrate its reliability for clinical measurements.
Sample preparation
The MS method for anthrax LF relies on three simple steps that each add a layer of sensitivity and specificity (Fig. 1). LF-MABs selectively purify and concentrate total-LF (LF + LTx) (Step 1). Immobilized LF is reacted with an optimized peptide substrate which it hydrolyzes producing two unique LF-specific product peptides (Step 2). Because each LF molecule can continuously hydrolyze peptide substrate, this step allows amplification of the resulting signal and improves detection. Analysis of the cleaved peptides by high-sensitivity/high-resolution isotope-dilution (ID) MALDI-TOF MS (Step 3). This strategy has been successfully applied to several enzymatic protein toxins [22].
Fig. 1.
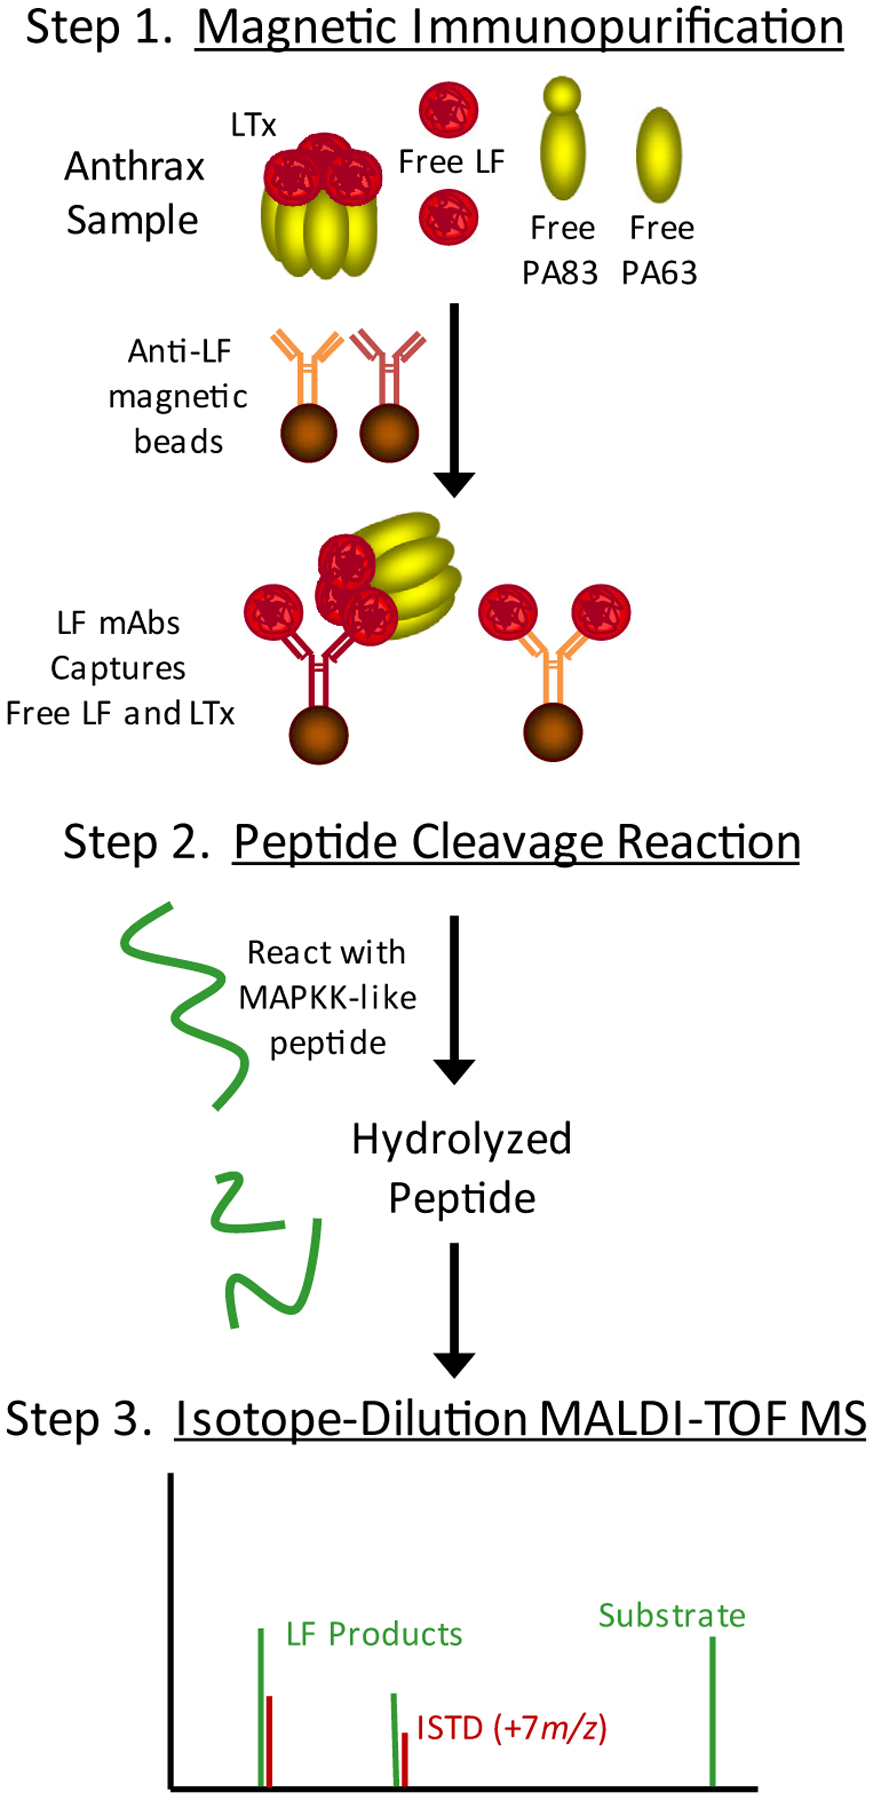
The LF MS method incorporates 3 steps to detect and measure total-LF (LF + LTx). (Step 1) Anti-LF monoclonal antibodies on magnetic beads were used to immunoprecipitate total LF. (Step 2) Immobilized LF was mixed with and hydrolyzed an optimized peptide substrate. (Step 3) Cleaved peptide products were detected and quantified by isotope-dilution (ID) MALDI-TOF MS. Area ratios of LF cleaved/internal standard peptide peaks (IDMS) correlate with the amount of LF.
LF detection and quantification
LF cleaves a peptide substrate and its products are detected by MALDI-TOF MS. In the spectrum without LF, only peaks for the respective singly and doubly charged substrate LF-S at 2804.2 and 1402.1 m/z and internal standard peptides, NTIS at 1238.8 and CTIS at 1596.8 m/z, are present (Fig. 2A). With LF, the substrate peaks are reduced and LF-specific cleaved products, NTP at 1232.8 and CTP at 1589.8 m/z with NTIS and CTIS are present (Fig. 2B). The CTP is the primary analyte for LF quantification and when visualized at a narrowed m/z range, spectra show that the CTP peak provides a very clear signal for LF positive samples. Isotope-dilution quantification with CTP/CTIS area ratios normalizes variations in MALDI-TOF MS signal intensities, as shown previously [22], and provides accurate quantification that is comparable to traditional quantitative HPLC-MS/MS platforms [23].
Fig. 2.

Full MALDI-TOF mass spectra without and with LF. MALDI TOF spectra of the substrate cleavage reaction showing LF activity for the ON method (A) a 20 μL plasma sample with no LF (blank) and (B) a 20 μL 10 ng/mL plasma standard. Peaks at m/z 2804.2 and m/z 1402.1 are the MH+ and (M+2H)2 + ions respectively. The peak at m/z 1232.8 is the N-terminal product ion and the peak at m/z 1589.8 in the C-terminal cleavage product ion. Peaks at m/z 1239.8 and m/z1596.8 correspond to the N-terminal and C-terminal isotopically labeled internal standards respectively. The boxes show that there is no C-terminal product in the plasma blank and the isotopic cluster of the C-terminal product and internal standard.
LF levels are quantified relative to calibration standards of rLF spiked in human plasma. The method was optimized using 100 μL volumes and two reaction times, 2-h (h) and overnight (ON) (18-h). Though samples are prepared once, the resulting LF reaction is analyzed twice. The 2-h reaction allows the method completion within 4-h. Analyzing again ON increases the amount of product peptides produced, enhancing their detection. This confirms a positive result for samples that were close but did not quite pass the 4-h method LOD criteria (described below). It also provides additional measurements for LF in infection samples for quantitation at two reaction times and assessment of accuracy relative to the rLF in standards. The exact time of the ON reaction was found to be irrelevant and variability did not alter the quantification because the standards and unknown samples had the same reaction time and reactivity (data not shown). We did observed that LF-cleaved peptides continued to accumulate and responses increased during 48 h of incubation (data not shown). We also observed similar reaction rates for rLF and LF from infection samples with similar quantitation at both reaction times.
The LF calibration standards and QC sets in plasma span a large range, from 0.003 to 11.8 ng/mL. Samples with LF levels above the optimal quantitative range were diluted to fit within the optimal ranges of the methods and reanalyzed. Dilution effects were not observed [23]. LF concentration vs CT-responses demonstrated an asymmetric sigmoidal relationship to which a 5 PL regression with robust weighting gave the best fit (Fig. 3A and B) [24]. The custom VB.NET 5PL output demonstrates the fits and optimal ranges for the 4-h and ON methods. The two reaction times allow quantification covering over 4-orders of magnitude. The VB.NET 5 PL robust curve fitting was validated by comparison to 5 PL fitting with the dose response curve (drc) add-on package from the R programming environment [33]. Four sets of data for the 4-h and four for the ON runs were compared for a total of eight sets. All resulted in Pearson correlation coefficients greater than 0.999 for the curve fits. One example is shown for the 4-h and ON runs (Fig. 3C and D).
Fig. 3.

Output for the 5 PL regression generated by custom VB.NET software for the 4-h (A) and overnight (ON) (B) methods for analysis of LF from 100 μL standards and QCs. The orange line indicates the estimated LOD (3 times the plasma blank area ratio). Overlay and comparison of regressions generated using 5 PL robust from the custom VB.NET software and 5 PL for the dose response curve (drc) software from R for the 4-h (C) and ON (D) analytical runs shown in A and B, respectively. Spectra zoomed on the LF cleaved CTP peak at 1589.8 m/z for standards at LF concentrations above and at the LOD compared to the blank for 2 h and ON reactions (E). Peak heights were normalized to the peak intensity of the highest standard S10 for 2 h and S12 for ON. Linearity of LF quantification for 100 independent analyses of calibration standards in the defined zone of quantitation (F). Linearity of means for 100 results and SD (error bars) for 2 h and ON. R2 and equations are from linear regression fits. (For interpretation of the references to colour in this figure legend, the reader is referred to the Web version of this article.)
Performance characteristics
Standards and QC sets analyzed one per day for 100 days gave precision, accuracy, linearity and LODs for the 4-h and ON methods (Table 2). The quantitative range for the 4-h method covered S1–S12 (0.011–11 ng/mL) and ON S5–S14 (0.003–0.938 ng/mL). Percent error as a measure of accuracy over both quantitative ranges was from 0.2 to 7.4% error. Precision was from 4.2 to 20% CV except at the 4-h LOD, which met FDA guidelines of at 25% CV [34]. The LOD for the 4-h method was calculated at 0.010 ng/mL for 100 μL plasma, which was improved 10-fold over that described previously at 0.05 ng/mL for 200 μL serum [19]. With the ON reaction time, the LOD was reduced to 0.0027 ng/mL. The lower LODs were due to several improvements including the use of two versus one LF-mAb and other modifications to streamline and improve precision described below. The LOD’s were visualized by focusing mass spectra on the CTP peptide, for the levels used to characterize LOD’s (Fig. 3E). The isotopic CTP peaks decline with lower LF but are still easily visible near both LOD’s compared to plasma blanks. Linearity for 100 runs was high with a slope of 1.0475 for 4-h and 1.0919 for ON and correlation coefficient R2 > 0.999 (Fig. 3F).
Table 2. LF analytical performance and range.
Mean, SD, accuracy (% error), precision (% CV), and analytical ranges (bold font) for LF plasma calibration standards, plasma blank (PBL), and quality control samples (QCs), for 4-h and ON methods compiled from analysis of 100 sets on 100 days. Results for % error and % CV that are within acceptable ranges ≤ 20% are indicated in italics. The optimum quantitative ranges are shown in bold font for Observed Values and represent standards levels of 0.11–11.8 ng/mL for the 4-h and 0.003–0.938 for the ON methods. The lowest standard level for the calculated LOD is 0.011 for the 4-h method and 0.003 for the ON method (underlined).
| LF Standard | Expected (ng/mL) | 4-Hour Method (4-h) | Overnight Method (ON) | ||||
|---|---|---|---|---|---|---|---|
| Observed (ng/mL) | % Error | CV (%) | Observed (ng/mL) | % Error | CV (%) | ||
| S1 | 11.8 | 10.9 | 7.4 | 7.3 | 6.0 | 49 | 48 |
| S2 | 6.25 | 6.5 | 4.6 | 7.4 | 4.3 | 31 | 44 |
| S3 | 3.32 | 3.47 | 4.6 | 5.7 | 3.3 | 0.45 | 36 |
| S4 | 1.76 | 1.80 | 2.5 | 5.9 | 1.93 | 9.5 | 17.4 |
| S5 | 0.938 | 0.91 | 3.2 | 5.3 | 1.01 | 7.2 | 12.3 |
| S6 | 0.498 | 0.488 | 2.1 | 7.0 | 0.506 | 1.5 | 9.0 |
| S7 | 0.265 | 0.262 | 1.2 | 4.2 | 0.253 | 4.5 | 6.0 |
| S8 | 0.141 | 0.143 | 1.1 | 7.9 | 0.138 | 2.5 | 9.4 |
| S9 | 0.075 | 0.076 | 1.6 | 13 | 0.077 | 2.3 | 8.4 |
| S10 | 0.040 | 0.040 | 1.0 | 10 | 0.040 | 1.3 | 8.0 |
| S11 | 0.0211 | 0.021 | 1.3 | 20 | 0.022 | 2.2 | 6.4 |
| S12 | 0.011 | 0.012 | 5.3 | 25 | 0.011 | 0.2 | 7.4 |
| S13 | 0.006 | 0.007 | 24 | 39 | 0.006 | 1.5 | 10.6 |
| S14 | 0.003 | 0.004 | 23 | 27 | 0.0033 | 4.7 | 15.7 |
| PBL | 0 | 0.002 | NA | NA | 0.0004 | NA | NA |
| QCH | 0.722 | 0.700 | 3.0 | 14.8 | 0.725 | 0.41 | 14.2 |
| QCM | 0.203 | 0.20 | 2.6 | 11.0 | 0.192 | 5.4 | 7.7 |
| QCL | 0.044 | 0.045 | 3.3 | 16.2 | 0.046 | 3.8 | 8.6 |
Blind-coded samples at 5 levels and blank were analyzed by four different analysts over 17 days (Table 3). Blinded plasma blanks were correctly determined as < LOD. Inter-day accuracy was 0.2–3.5% for the 4-h and 3.8–9.8% error for the ON method (Table 3A). Inter-day precision was 10.2–23.6% CV (4-h) and 3.8–9.8% CV (ON). The high 4-h CV of 23.6% was only observed at the lowest LF concentration (0.0575 ng/mL). Intra-day accuracy for both 4-h and ON methods ranged from 3.0 to 10.8% error and precision from 4.2 to 10.7% CV (Table 3B).
Table 3. Inter- and intra-day performance.
Inter-day mean ± standard deviation (Std Dev), accuracy (% error), and precision (% CV) were determined for 208 blinded PT samples for 5 LF levels analyzed over 17 days for both the 4-h and ON methods (A). For blinded samples analyzed 3 or more times a day, the intra-day means, % error and % CV were determined daily, then mean ± Std Dev, for the daily results were determined (B).
| A. Inter-Day Precision and Accuracy (17 Days Total) | |||||
|---|---|---|---|---|---|
| LF PT (ng/mL) | 0.721 | 0.383 | 0.204 | 0.108 | 0.058 |
| N | 40 | 43 | 41 | 42 | 42 |
| Fast (4-h) Inter-Day | |||||
| Mean ± Std Dev | 0.708 ± 0.072 | 0.380 ± 0.039 | 0.197 ± 0.021 | 0.107 ± 0.014 | 0.058 ± 0.014 |
| % CV | 10.2 | 10.3 | 10.6 | 13.1 | 23.6 |
| % error | 1.9 | 0.72 | 3.5 | 1.3 | 0.2 |
| Overnight Inter-Day | |||||
| Mean ± Std Dev | 0.661 ± 0.072 | 0.345 ± 0.037 | 0.184 ± 0.017 | 0.102 ± 0.010 | 0.056 ± 0.0047 |
| % CV | 11.0 | 10.7 | 9.0 | 9.9 | 8.5 |
| % error | 8.5 | 9.8 | 9.6 | 5.1 | 3.8 |
| B. Intra-Day Precision and Accuracy | |||||
| LF PT (ng/mL) | 0.721 | 0.383 | 0.204 | 0.108 | 0.058 |
| N Days | 5 | 8 | 8 | 9 | 9 |
| N Samples | 17 | 25 | 24 | 27 | 27 |
| Fast (4-h) Intra-Day | |||||
| Mean ± Std Dev | 0.693 ± 0.047 | 0.383 ± 0.024 | 0.190 ± 0.033 | 0.104 ± 0.21 | 0.058 ± 0.015 |
| % CV | 4.2 ± 3.1 | 6.0 ± 3.8 | 7.5 ± 3.8 | 7.1 ± 4.2 | 10.7 ± 9.0 |
| % error | 3.9 ± 6.5 | 5.5 ± 2.3 | 7.5 ± 5.1 | 6.9 ± 8.4 | 10.8 ± 18.2 |
| Overnight Intra-Day | |||||
| Mean ± Std Dev | 0.649 ± 0.032 | 0.342 ± 0.031 | 0.187 ± 0.012 | 0.104 ± 0.007 | 0.056 ± 0.003 |
| % CV | 5.1 ± 3.0 | 6.4 ± 2.5 | 8.0 ± 4.4 | 6.3 ± 7.0 | 5.3 ± 5.7 |
| % error | 10.0 ± 4.5 | 10.6 ± 8.0 | 8.7 ± 5.3 | 3.6 ± 7.2 | 3.0 ± 6.0 |
Specificity and recovery
Late stage infection samples had higher levels of LTx complex using anti-PA capture alone than total LF using one LF mAb. Late stage anthrax likely contains high levels of other toxins, the organism and capsule components. It has been shown that LTx may also be complexed with PGA capsule [35]. These may affect recovery of total LF when the sample is more complex. Two anti-LF mAbs improved LF recovery in a day 4 terminal stage serum. The sample was diluted 1:500 and analyzed in duplicate. CT-response after capture with LF-MAB-1 alone was lowest (0.726 ± 0.056), LF-MAB-2 was higher (0.918 ± 0.037) and with both MAB’s combined was highest (1.43 ± 0.080). There was no difference in CT-responses for rLF or LTx with individual or combined LF-MAB’s (data not shown). The specificity of the two LF mAbs for LF and LTx and the absence of cross reactivity with PA was shown previously [24]. The previous study also showed that LTx recovery by two anti-LF mAbs was similar to that for anti-PA mAbs.
The LF mAbs enhance LF activity so that signal is higher with extraction than without. This was demonstrated by analysis of LF from 0.003 to 300 ng/mL without and with capture by LF-MABs (Fig. 4). The CT-responses for the ON reaction with captured samples was ~4-fold higher than the non-captured samples over most of the range. This difference was visualized in the spectra focused on the CTP/CTIS pair for at 0.3 ng LF showing higher peak intensity with capture than without. Mapping of the epitopes identified a flap overhanging the active site which when mAbs bind, may open the pocket and allow faster turnover of substrate (Goldstein et al., in press, Toxins).
Fig. 4. Enhanced activity with LF-MABs capture and recovery.

(A) Graph of CT-response vs concentration for an overnight (ON) reaction from a serial titration of LF without and with capture by dual LF-MAB’s. (B) Spectra from the ON reaction showing the LF-cleaved CTP at 1589.8 m/z and CTIS at 1596.8 for two levels 0.3 ng LF without (left) and with capture (right) showing increased intensity of the CTP with capture. Spectra were normalized for the CTIS peak height.
Method changes for flexibility and high throughput capacity
Changes to the method from previous publications [19,20,22,23] were adopted to simplify the format and improve precision, detection, robustness and sample throughput. These included one sample volume (100 μL) versus two (20 μL/200 μL), two anti-LF mAbs versus one, optimized bead volume (10-μL) vs 20-μL, higher reaction volume for MS (5-μL vs 3-μL), automated sample transfer and MALDI-plate spotting, and improved peak baseline processing. Adaptation of steps to robotics for automated sample preparation allowed high-throughput analysis for evaluation of surge capacity. Six analysts were able to analyze 1045 blinded samples in 24 h [36].
Sample matrices, interferences and stability
Plasma was the preferred matrix for the LF method for its high accuracy and precision. Serum was also evaluated for potential use when it is the only sample available. LF levels measured in serum were lower than plasma at mid-higher LF levels (0.024–1.56 ng/mL) (Fig. 5A). At lower LF levels, 0.003–0.012 ng/mL, serum levels were similar to those measured in plasma. Mean accuracy over the range was better for plasma (4.5 ± 3.5% error) than for serum (14.7 ± 4.7% error), which demonstrates why plasma was favored. Both matrices were well within acceptable limits for accuracy and linearity.
Fig. 5. Sample matrices, interferences and stability.

(A) 200 μL plasma and serum spiked with LF were analyzed and quantified against plasma standards. (B) Standards without and with AIGIV spiked at 200 μg/mL were analyzed for LF. The mean of quantified results were plotted vs expected concentration on dual log10 transformed scales. Standard deviations are included as error bars. (C) Nine aliquots of plasma samples at 1.2 and 0.45 ng/mL, stored at 4 °C, were pulled weekly and stored at −80 °C, then analyzed for LF. (D) Ten aliquots of plasma samples at each LF level, 0.721 (high), 0.204 (medium), and 0.058 (low) ng/mL, were frozen at −80 °C then thawed, then refrozen and thawed 4 additional times. A pair of samples per level at each thaw was pulled and stored at 4 °C and analyzed for LF.
In two clinical inhalation anthrax cases described previously, LF levels measured by MS declined gradually with antimicrobial treatment and rapidly with the anti-toxin treatment AIGIV [11,28]. This demonstrated that LF levels respond to both treatments and may provide a good measure of the efficacy of medical countermeasures. As a result, LF measurements were required in the protocol for the use of AIGIV as an IND. The influence of AIGIV on accuracy of LF measurements was tested in plasma samples with and without AIGIV spiked and incubated before capture and analysis. Accuracy over the range was 0.4 ± 6.0% error without AIGIV and 2.4 ± 10.7% error with AIGIV and both had excellent linearity with slopes of 1.0065 and 1.0262, respectively (Fig. 5B). This preliminary analysis suggests that AIGIV has little to no effect on the accuracy of LF measurements.
Samples may arrive for analysis after various storage conditions. Long-term storage at +4 °C from 0 to 8 weeks had no detrimental effect on the amount of LF measured (Fig. 5C). Freeze-thaw cycles had little effect at lower concentrations up to 4 times cycles and response was only 8–10% lower after the 5th thaw (Fig. 5D). For the highest concentration, LF was measured at 16% lower after the third thaw, but then no further significant decreases were observed for subsequent freeze-thaw cycles.
Long term stability was demonstrated for 20 μL standards and QCs that were stored at −80 °C and analyzed routinely for over 9 years from 2007 through 2015. QC precision evaluated for 158 runs over 9 years gave an 8.90% CV for QC2 and 10.7% CV for QC3, similar precision to that observed for the new standards over shorter periods. This shows that LF plasma standards may be stored up to 9 years at −80 °C with no change in performance.
Diagnostic sensitivity and specificity
Of all the non-anthrax samples including some from humans with infections and immune-challenged backgrounds, as well as from RM and NZWR, none were positive for LF (Table 1). With all true negatives and no false positives, specificity was 100%. For evaluating diagnostic sensitivity, LF was detected and measured in samples from 32 confirmed cases of clinical anthrax in all four known forms of anthrax, inhalation [11,25,28], cutaneous [29], gastrointestinal [26], and injection [27] and in animals with inhalation anthrax. LF was detected in all confirmed cases and animals. With all true positives and no false negatives, sensitivity is 100%.
The sensitivity of this method allows detection of LF circulating in blood, in advance of the septic stage and positive blood cultures. For example, LF was detected in acute-stage serum from 18 individuals with cutaneous anthrax. None were septicemic. Only 6 (33%) could be confirmed by culture, immunohistochemistry or M’Fadyean stain of the cutaneous lesion swabs, smears or tissue biopsy, but all 18 were confirmed by the subsequent detection of anti-PA IgG by ELISA and/or anthrax toxin neutralization assay in convalescent samples [29]. This demonstrated that toxins were produced and released into circulation from the localized cutaneous lesion. Additionally, LF has been detected during experimental inhalation anthrax prior to the onset of septicemia and culture detection [20].
Application during infection and antimicrobial treatment
The utility of the LF method was demonstrated by comparing LF measurements to the standard bacterial culture test over the course of infection and ciprofloxacin treatment in 6 rhesus macaques (RM) challenged with 257 ± 43 LD50’s of Ames spores. Ciprofloxacin treatment commenced at 48-h post-challenge in 4 RM and 72-h in 2 RM. There were 4 survivors, 2 with 48-h and 2 with 72-h treatment. Positive LF levels were highlighted in yellow and positive cultures in green to visualize the diagnostic coverage of each method throughout infection and treatment. LF levels were first detected at 18-h post-challenge (PC) in 5/6 animals (83%) compared to 0% culture positive (Fig. 6). At 30-h post-challenge, LF was positive in all 6 animals (100%) whereas, culture was only positive in 3 of 6 (50%). In 3 RM, culture reverted to negative after a prior positive, before antimicrobial treatment. After treatment, culture was negative at the next time point and remained negative for subsequent samples, with the exception of a reversion back to positive at the terminal time point for one non-survivor 04208. Terminal LF could not be tested in this animal since plasma sample collection was unsuccessful. In contrast, LF was positive at all times post-treatment through day 7 (168 h). The next available sample was convalescent, collected a week later (11–12 days after Cipro) and was negative for both LF and culture. The percent positive for LF in all 6 treated RM and for culture in 4 RM at 48 h and 2 RM at 72 h treated groups was graphed over the course of infection and treatment (Fig. 6B). It showed that LF was detected well in advance and stayed positive in 100% through day 7 compared to bacteremia that falls to 0% after treatment. LF was detected before symptom onset, which typically occurs with the onset of bacteremia in non-human primates. It also remained detectable days after antimicrobial treatment. Culture detection was 12–18-h later than LF and was positive at only two time points per animal over the course of infection and treatment. In addition to early and extended detection after antimicrobials, LF has a short time to first result. Cultures usually require an overnight incubation or longer. Though the LF method includes an overnight option for confirmation of very low-levels, the fast 4-h method is still very sensitive at 0.01 ng/mL and all of the first samples detected for the RM were above this 4-h method detection limit. Overall, coverage of LF detection far exceeded that by culture.
Fig. 6. Application during infection and treatment.

(A) Impact of antimicrobials on LF and culture methods (bacteremia) during inhalation anthrax in rhesus macaques treated with Ciprofloxacin (Cipro) commencing at 48 or 72-h post-challenge. LF levels are given in ng/mL. Bacteremia was positive (+), negative (−) or low positive (±) if there were one to five colonies in primary phase, NR = not reported, < LOD = less than the limit of detection, NS = no sample available. Positive LF results are highlighted in yellow, bacteremia in green and reversal of bacteremia from positive to negative prior to antimicrobials in orange. (B)The percent positive for LF and bacteremia for 6 Cipro-treated animals from exposure to day 7 (168-h). (C) Impact of antimicrobials and the anti-toxin AIGIV over the course of hospitalization and treatment in three inhalation human anthrax cases. (For interpretation of the references to colour in this figure legend, the reader is referred to the Web version of this article.)
The first clinical application of the LF method was in samples from a 2006 case of inhalation anthrax [11]. This was also the first successful use of AIGIV in human inhalation anthrax. Two other cases of inhalation anthrax, in 2008 and 2011, received AIGIV as an IND [25,28]. LF levels were compared during the course of hospitalization and treatment for these three cases (Fig. 6C). Pre-antimicrobial samples were available for both the 2006 and 2011 cases, but for the 2008 case, the first sample available was after 6 days of antimicrobial treatment, immediately prior to AIGIV treatment. The results show that for the 2006 and 2011 cases, LF levels declined gradually with antimicrobial treatment. In all three cases, LF levels declined rapidly immediately after AIGIV treatment, followed by a brief increase (2006, 2008) or slower decline (2011). In both cases surviving anthrax, LF eventually declined to < LOD whereas LF in the non-survivor did not. LF was detected as long as 11–12 days post-hospitalization and treatment and ≥ 5 days after anti-toxin treatment (2006, 2008). These results demonstrate the utility of total-LF measurements for evaluation of therapeutics.
Conclusions
The Council of State and Territorial Epidemiologists (CSTE) clinical case classification for anthrax in humans was updated in 2017 to include LF detection by mass spectrometry as a confirmatory diagnostic method. Other confirmatory methods include B. anthracis by culture, B. anthracis antigens (cell wall and capsule) by immunohistochemistry, a four-fold rise in anti-PA IgG between acute and convalescent sera by CDC quantitative ELISA, and detection of B. anthracis DNA by pagA PCR. The extensive application and evaluation of the MS method for quantitation of total-LF detailed here, has confirmed its diagnostic and clinical value. It was shown to have diagnostic specificity and sensitivity of 100% for four forms of anthrax. During infection and treatment of rhesus macaques, LF was detectable earlier than the organism and well after antimicrobial treatment, in contrast to culture. There was no interference by AIGIV supporting its use during treatment with anti-toxins. During clinical inhalation anthrax, LF MS measured toxin declines after antimicrobial and antitoxin treatments. Even with the declines in LF, the method sensitivity allowed LF detection up to 12 days post-antimicrobial and over 5 days post-antitoxin treatment. Confidence in its utility was evident in the requirement of LF measurements under the IND protocol for the use of AIGIV for systemic anthrax. Furthermore, the total-LF method was shown to be very robust, with good accuracy, precision, and stability under a variety of conditions. It can be performed in 4 h with 0.01 ng/mL (111 amol/mL) detection. The method was streamlined and robotics incorporated, further enhancing throughput. It is also being developed for use on lower complexity MALDI-TOF MS platforms for potential use by select state labs, improving response during an anthrax public health emergency. Finally, application of the LF MS method has provided an advanced understanding of B. anthracis infection and toxemia [20] and effectiveness of therapeutic interventions [11,28].
Acknowledgement
Funding for this work was supported by the CDC Office of Public Health Preparedness and Response.
Footnotes
Declaration of interest
The authors do not have any conflicts of interest to declare.
Publisher's Disclaimer: Disclaimer
Publisher's Disclaimer: The findings and conclusions in this report are those of the authors and do not necessarily represent the official position of the Centers for Disease Control and Prevention.
References
- [1].Mock M, Mignot T, Anthrax toxins and the host: a story of intimacy, Cell Microbiol. 5 (2003) 15–23. [DOI] [PubMed] [Google Scholar]
- [2].Booth MG, Hood J, Brooks TJ, Hart A, Anthrax infection in drug users, Lancet 375 (2010) 1345–1346. [DOI] [PubMed] [Google Scholar]
- [3].Brachman PS, Inhalation anthrax, Ann. N. Y. Acad. Sci 353 (1980) 83–93. [DOI] [PubMed] [Google Scholar]
- [4].Jernigan DB, Raghunathan PL, Bell BP, Brechner R, Bresnitz EA, Butler JC, Cetron M, Cohen M, Doyle T, Fischer M, Greene C, Griffith KS, Guarner J, Hadler JL, Hayslett JA, Meyer R, Petersen LR, Phillips M, Pinner R, Popovic T, Quinn CP, Reefhuis J, Reissman D, Rosenstein N, Schuchat A, Shieh WJ, Siegal L, Swerdlow DL, Tenover FC, Traeger M, Ward JW, Weisfuse I, Wiersma S, Yeskey K, Zaki S, Ashford DA, Perkins BA, Ostroff S, Hughes J, Fleming D, Koplan JP, Gerberding JL, Investigation of bioterrorism-related anthrax, United States, 2001: epidemiologic findings, Emerg. Infect. Dis 8 (2002) 1019–1028. [DOI] [PMC free article] [PubMed] [Google Scholar]
- [5].Mock M, Fouet A, Anthrax, Annu. Rev. Microbiol 55 (2001) 647–671. [DOI] [PubMed] [Google Scholar]
- [6].Young JA, Collier RJ, Anthrax toxin: receptor binding, internalization, pore formation, and translocation, Annu. Rev. Biochem 76 (2007) 243–265. [DOI] [PubMed] [Google Scholar]
- [7].Duesbery NS, Webb CP, Leppla SH, Gordon VM, Klimpel KR, Copeland TD, Ahn NG, Oskarsson MK, Fukasawa K, Paull KD, Vande Woude GF, Proteolytic inactivation of MAP-kinase-kinase by anthrax lethal factor, Science 280 (1998) 734–737. [DOI] [PubMed] [Google Scholar]
- [8].Vitale G, Bernardi L, Napolitani G, Mock M, Montecucco C, Susceptibility of mitogen-activated protein kinase kinase family members to proteolysis by anthrax lethal factor, Biochem J 352 (Pt 3) (2000) 739–745. [PMC free article] [PubMed] [Google Scholar]
- [9].Pellizzari R, Guidi-Rontani C, Vitale G, Mock M, Montecucco C, Anthrax lethal factor cleaves MKK3 in macrophages and inhibits the LPS/IFNgamma-induced release of NO and TNFalpha, FEBS Lett 462 (1999) 199–204. [DOI] [PubMed] [Google Scholar]
- [10].Leppla SH, Anthrax toxin edema factor: a bacterial adenylate cyclase that increases cyclic AMP concentrations of eukaryotic cells, Proc. Natl. Acad. Sci. U. S. A 79 (1982) 3162–3166. [DOI] [PMC free article] [PubMed] [Google Scholar]
- [11].Walsh JJ, Pesik N, Quinn CP, Urdaneta V, Dykewicz CA, Boyer AE, Guarner J, Wilkins P, Norville KJ, Barr JR, Zaki SR, Patel JB, Reagan SP, Pirkle JL, Treadwell TA, Messonnier NR, Rotz LD, Meyer RF, Stephens DS, A case of naturally acquired inhalation anthrax: clinical care and analyses of anti-protective antigen immunoglobulin G and lethal factor, Clin. Infect. Dis 44 (2007) 968–971. [DOI] [PubMed] [Google Scholar]
- [12].Henning LN, Comer JE, Stark GV, Ray BD, Tordoff KP, Knostman KA, Meister GT, Development of an inhalational Bacillus anthracis exposure therapeutic model in cynomolgus macaques, Clin. Vaccine Immunol 19 (2012) 1765–1775. [DOI] [PMC free article] [PubMed] [Google Scholar]
- [13].Mabry R, Brasky K, Geiger R, Carrion R Jr., Hubbard GB, Leppla S, Patterson JL, Georgiou G, Iverson BL, Detection of anthrax toxin in the serum of animals infected with Bacillus anthracis by using engineered immunoassays, Clin. Vaccine Immunol 13 (2006) 671–677. [DOI] [PMC free article] [PubMed] [Google Scholar]
- [14].Stoddard RA, Quinn CP, Schiffer JM, Boyer AE, Goldstein J, Bagarozzi DA, Soroka SD, Dauphin LA, Hoffmaster AR, Detection of anthrax protective antigen (PA) using europium labeled anti-PA monoclonal antibody and time-resolved fluorescence, J. Immunol. Methods 408 (2014) 78–88. [DOI] [PMC free article] [PubMed] [Google Scholar]
- [15].Tang S, Moayeri M, Chen Z, Harma H, Zhao J, Hu H, Purcell RH, Leppla SH, Hewlett IK, Detection of anthrax toxin by an ultrasensitive immunoassay using europium nanoparticles, Clin. Vaccine Immunol 16 (2009) 408–413. [DOI] [PMC free article] [PubMed] [Google Scholar]
- [16].Kimura RH, Steenblock ER, Camarero JA, Development of a cell-based fluorescence resonance energy transfer reporter for Bacillus anthracis lethal factor protease, Anal. Biochem 369 (2007) 60–70. [DOI] [PubMed] [Google Scholar]
- [17].Rivera VR, Merrill GA, White JA, Poli MA, An enzymatic electrochemiluminescence assay for the lethal factor of anthrax, Anal. Biochem 321 (2003) 125–130. [DOI] [PubMed] [Google Scholar]
- [18].Turk BE, Wong TY, Schwarzenbacher R, Jarrell ET, Leppla SH, Collier RJ, Liddington RC, Cantley LC, The structural basis for substrate and inhibitor selectivity of the anthrax lethal factor, Nat. Struct. Mol. Biol 11 (2004) 60–66. [DOI] [PubMed] [Google Scholar]
- [19].Boyer AE, Quinn CP, Woolfitt AR, Pirkle JL, McWilliams LG, Stamey KL, Bagarozzi DA, Hart JC Jr., Barr JR, Detection and quantification of anthrax lethal factor in serum by mass spectrometry, Anal. Chem 79 (2007) 8463–8470. [DOI] [PubMed] [Google Scholar]
- [20].Boyer AE, Quinn CP, Hoffmaster AR, Kozel TR, Saile E, Marston CK, Percival A, Plikaytis BD, Woolfitt AR, Gallegos M, Sabourin P, McWilliams LG, Pirkle JL, Barr JR, Kinetics of lethal factor and poly-D-glutamic acid antigenemia during inhalation anthrax in rhesus macaques, Infect. Immun 77 (2009) 3432–3441. [DOI] [PMC free article] [PubMed] [Google Scholar]
- [21].HHS CN (Ed.), Biosafety in Microbiological and Biomedical Laboratories, 2009. [Google Scholar]
- [22].Boyer AE, Gallegos-Candela M, Lins RC, Kuklenyik Z, Woolfitt A, Moura H, Kalb S, Quinn CP, Barr JR, Quantitative mass spectrometry for bacterial protein toxins-a sensitive, specific, high-throughput tool for detection and diagnosis, Molecules 16 (2011) 2391–2413. [DOI] [PMC free article] [PubMed] [Google Scholar]
- [23].Kuklenyik Z, Boyer AE, Lins R, Quinn CP, Gallegos-Candela M, Woolfitt A, Pirkle JL, Barr JR, Comparison of MALDI-TOF-MS and HPLC-ESI-MS/MS for Endopeptidase Activity-Based Quantification of Anthrax Lethal Factor in Serum, Anal. Chem 83 (2011) 1760–1765. [DOI] [PubMed] [Google Scholar]
- [24].Boyer AE, Gallegos-Candela M, Quinn CP, Woolfitt AR, Brumlow JO, Isbell K, Hoffmaster AR, Lins RC, Barr JR, High-sensitivity MALDI-TOF MS quantification of anthrax lethal toxin for diagnostics and evaluation of medical countermeasures, Anal. Bioanal. Chem 407 (2015) 2847–2858. [DOI] [PMC free article] [PubMed] [Google Scholar]
- [25].Anaraki S, Addiman S, Nixon G, Krahe D, Ghosh R, Brooks T, Lloyd G, Spencer R, Walsh A, McCloskey B, Lightfoot N, Investigations and control measures following a case of inhalation anthrax in East London in a drum maker and drummer, October 2008, Euro Surveill. 13 (2008). [PubMed] [Google Scholar]
- [26].C. Centers for disease, prevention, gastrointestinal anthrax after an animal-hide drumming event - New Hampshire and Massachusetts, 2009, MMWR Morb. Mortal. Wkly. Rep 59 (2010) 872–877. [PubMed] [Google Scholar]
- [27].Cui X, Nolen LD, Sun J, Booth M, Donaldson L, Quinn CP, Boyer AE, Hendricks K, Shadomy S, Bothma P, Judd O, McConnell P, Bower WA, Eichacker PQ, Analysis of Anthrax Immune Globulin Intravenous with Antimicrobial Treatment in Injection Drug Users, Scotland, 2009–2010, Emerg. Infect. Dis 23 (2017) 56–65. [DOI] [PMC free article] [PubMed] [Google Scholar]
- [28].Sprenkle MD, Griffith J, Marinelli W, Boyer AE, Quinn CP, Pesik NT, Hoffmaster A, Keenan J, Juni BA, Blaney DD, Lethal factor and anti-protective antigen IgG levels associated with inhalation anthrax, Minnesota, USA, Emerg. Infect. Dis 20 (2014) 310–314. [DOI] [PMC free article] [PubMed] [Google Scholar]
- [29].Boyer AE, Quinn CP, Beesley CA, Gallegos-Candela M, Marston CK, Cronin LX, Lins RC, Stoddard RA, Li H, Schiffer J, Hossain MJ, Chakraborty A, Rahman M, Luby SP, Shieh WJ, Zaki S, Barr JR, Hoffmaster AR, Lethal factor toxemia and anti-protective antigen antibody activity in naturally acquired cutaneous anthrax, J. Infect. Dis 204 (2011) 1321–1327. [DOI] [PMC free article] [PubMed] [Google Scholar]
- [30].Migone TS, Subramanian GM, Zhong J, Healey LM, Corey A, Devalaraja M, Lo L, Ullrich S, Zimmerman J, Chen A, Lewis M, Meister G, Gillum K, Sanford D, Mott J, Bolmer SD, Raxibacumab for the treatment of inhalational anthrax, N. Engl. J. Med 361 (2009) 135–144. [DOI] [PubMed] [Google Scholar]
- [31].Armbruster DA, Pry T, Limit of blank, limit of detection and limit of quantitation, The Clinical biochemist, Rev./Aust. Assoc. Clin. Biochem 29 (Suppl 1) (2008) S49–S52. [PMC free article] [PubMed] [Google Scholar]
- [32].Public Health Service Act, 42 U.S.C, Sect 263 (a) (1999). [Google Scholar]
- [33].Ritz C, Baty F, Streibig JC, Gerhard D, Dose-response analysis using R, PLoS One 10 (2015) e0146021. [DOI] [PMC free article] [PubMed] [Google Scholar]
- [34].C. HHS-FDA, CVM, Guidance for Industry, Bioanalytical Method Validation, Rockville, MD, 2013. [Google Scholar]
- [35].Jang J, Cho M, Chun JH, Cho MH, Park J, Oh HB, Yoo CK, Rhie GE, The poly-gamma-D-glutamic acid capsule of Bacillus anthracis enhances lethal toxin activity, Infect. Immun 79 (2011) 3846–3854. [DOI] [PMC free article] [PubMed] [Google Scholar]
- [36].Heitz J, Gallegos-Candela M, Lins R, Woolfitt AR, Krilich J, Baudys J, Sapp C, Duerr G, Rollins M, Barr JR, Boyer AE, 1000-a-Day: Rapid anthrax diagnostics with high-throughput analysis of anthrax lethal factor by mass spectrometry, Interscience Conference on Antimicrobial Agents and Chemotherapy, 2014. Washington, D.C. [Google Scholar]