

Abstract
Background:
In vivo imaging of oxidative stress can facilitate the understanding and treatment of cardiovascular diseases. We evaluated nitroxide-enhanced MRI with 3-carbamoyl-proxyl (3CP) for the detection of myocardial oxidative stress.
Methods:
Three mouse models of cardiac oxidative stress were imaged, namely angiotensin II (Ang II) infusion, myocardial infarction (MI), and high-fat high-sucrose (HFHS) diet-induced obesity (DIO). For the Ang II model, mice underwent MRI at baseline and after 7 days of Ang II (n = 8) or saline infusion (n = 8). For the MI model, mice underwent MRI at baseline (n = 10) and at 1 (n = 8), 4 (n = 9), and 21 (n = 8) days after MI. For the HFHS-DIO model, mice underwent MRI at baseline (n = 20) and 18 weeks (n = 13) after diet initiation. The 3CP reduction rate, Kred, computed using a tracer kinetic model, was used as a metric of oxidative stress. Dihydroethidium (DHE) staining of tissue sections was performed on Day 1 after MI.
Results:
For the Ang II model, Kred was higher after 7 days of Ang II versus other groups (p < 0.05). For the MI model, Kred, in the infarct region was significantly elevated on Days 1 and 4 after MI (p < 0.05), whereas Kred in the noninfarcted region did not change after MI. DHE confirmed elevated oxidative stress in the infarct zone on Day 1 after MI. After 18 weeks of HFHS diet, Kred was higher in mice after diet versus baseline (p < 0.05).
Conclusions:
Nitroxide-enhanced MRI noninvasively quantifies tissue oxidative stress as one component of a multiparametric preclinical MRI examination. These methods may facilitate investigations of oxidative stress in cardiovascular disease and related therapies.
Keywords: cardiovascular, heart, MRI, nitroxides, oxidative stress, preclinical
1 |. INTRODUCTION
Oxidative stress, an imbalance between the generation and detoxification of reactive oxygen species (ROS), plays a central role in many types of cardiovascular disease. For example, in heart failure (HF) the renin-angiotensin-aldosterone system (RAAS) is activated, leading to the formation of ROS and oxidative stress in cardiovascular tissue.1 Under these conditions, a primary pathway involves angiotensin II (Ang II) stimulation of nicotinamide adenine dinucleotide phosphate (NADPH) oxidases, which catalyze the production of superoxide and other ROS in vascular smooth muscle cells, endothelial cells, and cardiomyocytes. In another example, that of reperfused myocardial infarction (MI), infiltrating leukocytes such as neutrophils and macrophages are primary sources of ROS and oxidative stress.2 As a third example, obesity, a condition with epidemic prevalence in Western societies, leads to systemic oxidative stress and contributes to cardiovascular disease.3 In general, cardiovascular oxidative stress leads to tissue damage by inducing vascular and myocardial inflammation, apoptosis, necrosis, hypertrophy, calcium dysregulation, and fibrosis. Various therapies may reduce oxidative stress and improve cardiovascular health and function.4
While oxidative stress is an important mechanism underlying many types of cardiovascular disease and is a therapeutic target, there are limited means of measuring this parameter in vivo. Fluorescence methods are commonly used for ex vivo studies, but due to limited penetration depth these methods are unsuitable for the in vivo assessment of cardiovascular structures. Electron paramagnetic resonance (EPR) imaging that measures the oxidative-stress-dependent decay rate of intravenously injected exogenous nitroxide stable free radicals is an effective technique, as reviewed recently.5 In this method, paramagnetic nitroxides with oxygen free radicals undergo reduction reactions within cells where the EPR-visible paramagnetic nitroxide is reduced to an EPR-invisible nonparamagnetic hydroxylamine, and the rate of reduction is dependent on oxidative stress. However, EPR imaging is not widely available, and EPR imaging has not been developed for human imaging. Alternatively, there is an opportunity to leverage the body of work that has developed oxidative-stress-sensitive nitroxide probes for EPR, and to use these nitroxides as oxidative-stress-sensitive T1-shortening agents for MRI, where reduction of the nitroxide due to oxidative stress decreases the nitroxide’s T1-shortening effect.6 This approach has the advantages that (a) MRI is widely available and regularly used preclinically for both small and large animals, (b) MRI can provide better spatial and temporal resolution than EPR imaging, and (c) MRI also provides high-quality anatomical and functional imaging that can be registered with oxidative stress images. These methods have already been developed and demonstrated for preclinical cancer7,8 and neurological9,10 MRI, but have not been evaluated for MRI of the cardiovascular system. Further, in principle, there are no fundamental obstacles preventing the application of nitroxide-enhanced MRI in humans.
In the present study we sought to demonstrate the utility of dynamic nitroxide-enhanced MRI to detect cardiovascular oxidative stress, and to quantify the nitroxide reduction rate. We investigated the application of dynamic nitroxide-enhanced MRI in three mouse models of cardiovascular oxidative stress: Ang II infusion, reperfused MI, and diet-induced obesity (DIO). Ang II infusion mimics many aspects of HF and leads in the short term to an excess of coronary vascular superoxide,11 and in the long term to vascular dysfunction, myocardial fibrosis, hypertrophy, and cardiac contractile dysfunction.12 The MI model exhibits oxidative stress due to a well established time course of infiltrating neutrophils and macrophages in the infarct region providing intra-heart regional differences in oxidative stress as well as time-dependent increases and decreases in oxidative stress. The high-fat high-sucrose (HFHS)-DIO model was selected as a third test system, as this diet causes elevated levels of cardiac NADPH oxidase expression and superoxide anion production, and leads to metabolic heart disease and coronary microvascular dysfunction.13 For a quantitative analysis, while simple exponential models have been used previously to describe the decay rate of nitroxide-enhanced MRI,6,7 we modified a two-compartment tracer kinetic model to incorporate intracellular nitroxide reduction and used the modified model to analyze our images.
2 |. METHODS
2.1 |. Two-compartment exchange and reduction tracer kinetic model
Two-compartment exchange models (2CXMs) are widely used to describe the kinetics of MRI contrast agents such as gadolinium that exchange between the vascular and extravascular spaces. As shown in Figure 1 and similarly to an approach taken for EPR of nitroxides,14 we propose to modify a conventional 2CXM by accounting for chemical reduction of the nitroxide when the nitroxide is in the extravascular space. The rationale for this approach is that the extravascular space includes the intracellular space wherein nitroxides undergo reduction reactions with ROS such as superoxides. Mathematically, we define CV(t) as the vascular nitroxide concentration and CEV(t) as the extravascular nitroxide concentration, and we express the two-compartment exchange and reduction model (2CXRM) as
| (1) |
| (2) |
where K1 is the vascular to extravascular exchange rate, K2 is the extravascular to vascular exchange rate, and Kred is the nitroxide reduction rate within the extravascular compartment. Justification for the concentration-independent nature of Kred is provided in Appendix A. Using a Laplace transform method to solve Equation 1, CEV can be expressed as
| (3) |
where B is a constant. The nitroxide concentration (CT) in the myocardial tissue, which includes both the vascular and extravascular compartments, is expressed as
| (4) |
where v is the vascular volume fraction of the tissue. In the present study, the signal from the left ventricular (LV) blood pool was used to estimate CV(t) and the signal from the myocardium was used to estimate CT(t). We assumed that v is 0.05, consistent with previous studies.15 The nitroxide reduction rate, Kred, was used throughout all experiments as the MRI metric of myocardial oxidative stress.
FIGURE 1.
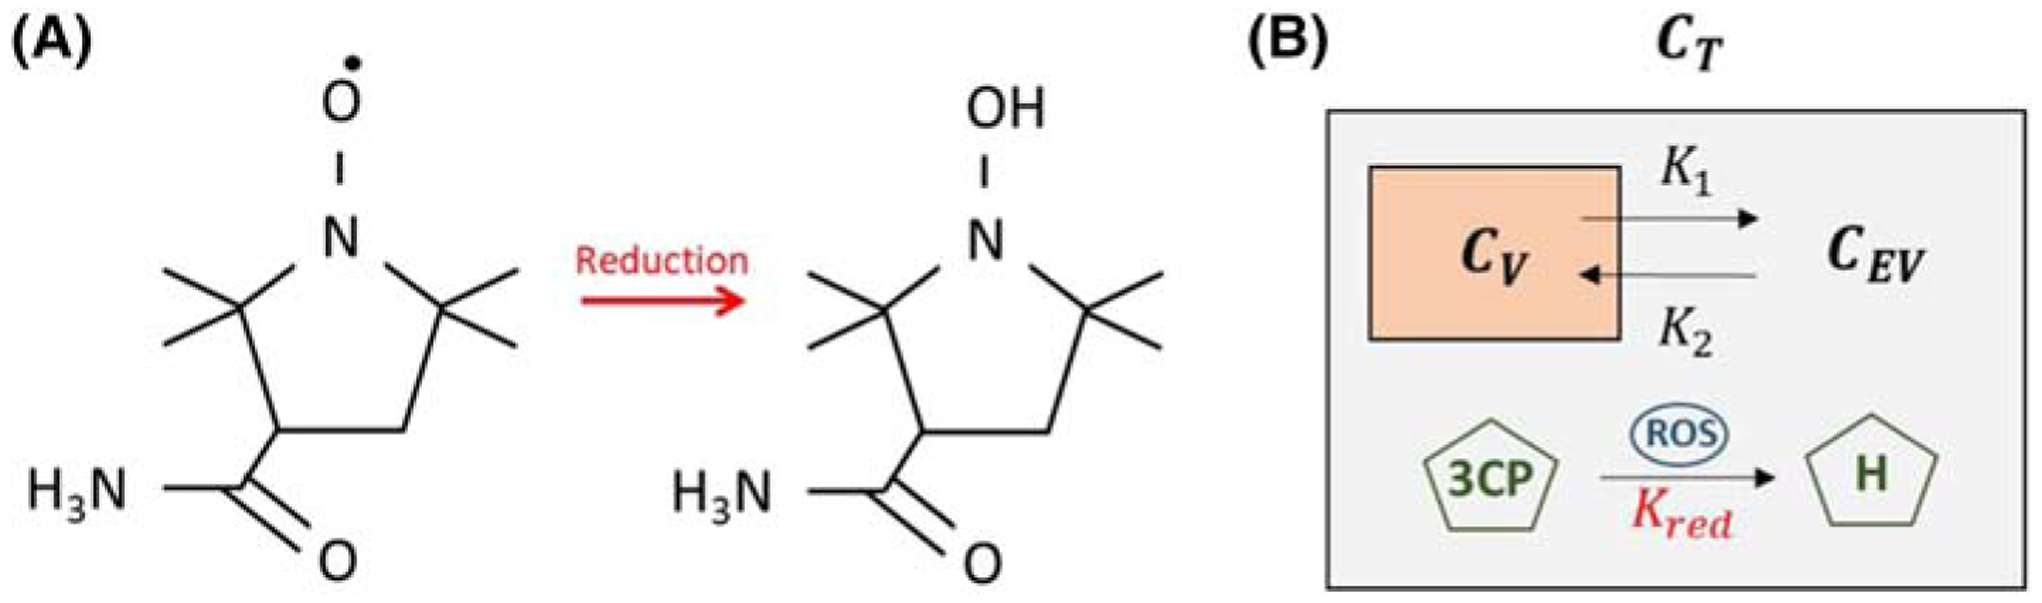
A, The molecular structure of the paramagnetic nitroxide 3CP, showing a single unpaired electron, and the molecular structure of 3CP after undergoing a reduction reaction into a diamagnetic hydroxylamine, without an unpaired electron. B, The 2CXRM, which accounts for (1) nitroxide exchange between the vascular and extravascular compartments within the tissue compartment with rate constants K1 and K2, and (2) nitroxide reduction, with rate constant Kred, in the extravascular compartment due to intracellular reactions driving 3CP reduction to hydroxylamine via ROS. Cv, CEV, and CT are the 3CP concentrations in the vascular, extravascular, and tissue compartments, respectively
2.2 |. Mouse models of oxidative stress
All animal studies were performed in accordance with protocols that conformed to the Declaration of Helsinki as well as the Guide for Care and Use of Laboratory Animals (NIH Publication 85–23, revised 1996) and were approved by the Animal Care and Use Committee at the University of Virginia. Wild type male C57Bl/6 mice were obtained from Jackson Laboratories (8–10 weeks of age). For the Ang II infusion model, osmotic minipumps (ALZET Model 1002; DURECT Corp, Cupertino, CA) loaded with Ang II at the concentration necessary to provide an infusion rate of 0.7 mg/kg body weight per day were implanted in mice (n = 8) as previously described.11 Ang II was infused for seven days, as this duration and dose have been shown previously to induce vascular oxidative stress.11 Control mice (n = 8) with osmotic minipumps were infused with saline for seven days. Mice underwent MRI before and 7 days after implantation of infusion pumps.
For the model of reperfused MI, a surgical procedure employing a 40 minute occlusion of the left anterior descending (LAD) coronary artery followed by reperfusion was performed as previously described.16 The 40 minute occlusion with reperfusion was chosen as this model has been shown to produce a strong inflammatory response 1–4 days after MI, which largely resolves by 21 days after MI.17,18 This well characterized time course of inflammatory cell infiltration was used to select the imaging time points for the present nitroxide-enhanced MRI study. To demonstrate the detection of oxidative stress localized to the region of infarction and the effect of the time-varying process of post-MI leukocyte infiltration, mice underwent nitroxide-enhanced MRI prior to MI (n = 10) and on Days 1 (n = 8), 4 (n = 9), and 21 (n = 8) after reperfused MI.
Finally, for the HFHS-DIO model, mice were fed an HFHS diet (40% kcal fat, 40% kcal sucrose, Diet 12327, Research Diets, New Brunswick, NJ), which was initiated at 10 weeks of age and continued for 18 weeks. Mice underwent MRI at baseline (n = 20, 8 weeks old) and 18 weeks after diet (n = 13).
2.3 |. Cardiac MRI
We chose the nitroxide 3-carbamoyl-proxyl (3CP) (Sigma-Aldrich, St. Louis, MO) for these experiments because it is water soluble, commercially available, and generally well tolerated by mice, and has previously been shown to provide signal enhancement in skeletal muscle and the heart.19,20 3CP (C9H17N2O2) has a molecular weight of 185.24 g/mol, solubility in water of 50 mg/ml, formal charge 0, and blood half-life of 7–10 min. 3CP has relaxation rates R1 (or 1/T1) that increase linearly with concentration in the range of 0.5 to 35 mM, and the relaxivity of 3CP in saline solution at 7 T was previously measured to be 0.139/mM/s. To determine the dose of 3CP to use in the experiments aimed at the detection of oxidative stress in the heart, we performed 3CP-enhanced MRI of three healthy mice with doses of 0.4, 0.8, 1.2, 1.6, and 2.0 mmol/kg body weight. We used a 3CP concentration of 50 mg/mL, as this was the highest concentration of 3CP that would dissolve in saline. At this concentration, and considering that the highest well tolerated injection volume for mice weighing approximately 25 g is approximately 200 μL, 2.0 mmol/kg body weight is approximately the highest dose of 3CP that can be delivered. For each dose, we measured myocardial and blood signal-to-noise ratio. A saturation-recovery gradient echo MRI protocol, as described below, was used for 3CP-enhanced imaging.
All MRI studies were performed using a 7 T system (ClinScan, Bruker, Ettlingen, Germany) and a 30 mm diameter birdcage RF coil. An indwelling tail vein catheter was inserted for the injection of contrast agent during MRI. The electrocardiogram, body temperature, and respiration were monitored during imaging (SA Instruments, Stony Brook, NY). During MRI, mice were anesthetized with 1.25% isoflurane and maintained at 36 ± 0.5°C using circulating warm water, as previously described.21 Localizer imaging was performed to establish cardiac short- and long-axis views. Subsequently, dynamic T1-weighted MRI was performed in a mid-ventricular short-axis slice before and consecutively after 3CP injection for 10 minute. For the Ang II and reperfused-MI experiments, 3CP at a dose of 2.0 mmol/kg body weight was injected over 3–4 s. Over the course of these studies, approximately 10% of the mice died after 3CP-enhanced imaging. Accordingly, we reduced the 3CP dose in the HFHS DIO experiments to 1.2 mmol/kg body weight. For T1-weighted imaging, an ECG-gated saturation-recovery segmented gradient echo sequence was used with field of view = 34 × 24 mm2, matrix size = 128 × 104, TE = 1 ms, TR = 1.8 ms, flip angle = 15, slice thickness = 1 mm, saturation recovery time = 40 ms, number of segments = 8 and number of averages = 16, resulting in a total scan time of approximately 20 s per image, depending on heart rate. Consecutive T1-weighted images were acquired for 12 minute, beginning before injection of 3CP and continuing for 10 minute after the injection. In addition, proton-density-weighted images, similar to the T1-weighted images but without the saturation pulse and using flip angle = 5°, were acquired prior to 3CP injection for myocardial segmentation and, with correction for flip angle differences, were used for normalization of signal intensities. In the MI mice, cine DENSE (displacement encoding with stimulated echoes) myocardial strain imaging22 was performed in a matched short-axis slice prior to 3CP injection, as previously described.23,24
2.4 |. Image analysis
For the MI mice, to distinguish the locations of infarcted and noninfarcted (remote) myocardium, strain maps were computed from the DENSE images acquired in a plane matched to that of the nitroxide-enhanced images, and thresholds were applied to circumferential shortening to define the infarcted (circumferential shortening > −0.05) and noninfarcted (circumferential shortening < −0.08) regions,25 as previously described.17 Strain analysis of cine DENSE images was performed as previously described.26,27 The regions identified by strain thresholds were subsequently applied to the nitroxide-enhanced images to measure oxidative stress localized to the infarcted and noninfarcted regions.
The 2CXRM was used to quantify myocardial oxidative stress from the 3CP-enhanced images. The blood pool and the myocardium were manually segmented using a reference proton-density-weighted image acquired at a matched location. For each mouse, for the whole slice or for infarcted and noninfarcted regions, the myocardial signal intensities from the dynamic 3CP-enhanced saturation recovery T1-weighted images were normalized to the signal intensities of the proton-density-weighted image. Region-of-interest (ROI) signal intensity was converted to 3CP concentration as previously described.28 CV was estimated by least squares fitting of [3CP] in the LV blood pool to a gamma-variate function combined with an exponential decay function. In mice that received a dose of 2.0 mmol/kg, CV was scaled to account for the nonlinearity of signal versus [3CP] for blood as shown in Figure 2. CT was estimated by nonlinear regression fitting of the model parameters K1, K2, Kred, and B in Equations 3 and 4 to the myocardial ROI [3CP], and v was set to 0.05.
FIGURE 2.

A, Example T1-weighted saturation-recovery gradient-echo short-axis images of the mouse heart acquired before and after the injection of 3CP at doses of 0.4, 0.8, 1.2, 1.6, and 2.0 mmol/kg body weight. B, Signal-to-noise ratios (mean ± standard error, n = 3) are shown for each 3CP dose from ROIs in the LV blood pool and myocardial tissue
2.5 |. Confocal microscopy of dihydroethidium-stained tissue sections
In addition to MRI, dihydroethidium (DHE) staining of tissue sections was used to verify oxidative stress in the infarct region 1 day after MI. Specifically, following MRI on Day 1 after MI, hearts from four mice were explanted, washed with PBS, and sliced into 1 mm sections using a tissue slicer matrix (Zivic Instruments, Pittsburgh, PA). Hearts from four noninfarcted control mice also underwent this procedure. Sections were incubated for 20 minutes in DHE diluted to 3.2 μM in PBS. Next, sections were imaged for the oxidation products of DHE using an excitation wavelength of 488 nm and an emission wavelength of 525 ± 25 nm on an UltraVIEW VoX confocal microscope (PerkinElmer, Waltham, MA).29 Image analysis was performed using the Fiji distribution of ImageJ.30 Due to the localization of the oxidation products of DHE to the nucleus, nuclei were segmented using localized contrast normalization and global thresholding. For each region (infarct region or noninfarct region) we measured the mean fluorescence intensity within the nuclei weighted by nuclear count in the analyzed region (nuclear density). Oxidative stress in the infarcted versus noninfarcted region was quantified as the ratio of the weighted fluorescence intensity of the infarcted versus noninfarcted region. Use of this ratio controlled for factors that may differ from heart to heart such as photobleaching, dye penetration, and imaging plane depth. For control mice, the ratio between the lateral wall and septum was computed, as in the LAD coronary artery occlusion model the lateral wall is generally infarcted and the septum is not.
2.6 |. Effect of increasing perfusion on 3CP kinetics
Myocardial perfusion is another factor, in addition to oxidative stress, that would affect 3CP kinetics. To investigate the effect of perfusion on 2CXRM parameters, including Kred, we performed dynamic 3CP-enhanced MRI in five mice after the intraperitoneal (IP) infusion of adenosine at a dose sufficient to maximally increase myocardial blood flow.31 Specifically, we administered adenosine as a 300 μg/kg/min IP infusion at a rate of 5 μl/min for 10 minutes (Reference 31) prior to dynamic 3CP-enhanced MRI, and it was continuously infused during imaging. We waited for 10 minutes after the start of the infusion for the heart rate to stabilize before performing 3CP-enhanced MRI. Five additional mice that did not receive adenosine were used as controls.
2.7 |. Statistics
For the Ang II infusion mice, two-way ANOVA was used to test for significant differences in Kred between the Ang II mice and control mice imaged prior to and 7 days after infusion. For the MI mice, two-way ANOVA was used to test for significant differences in Kred between the infarct and noninfarct regions and between measurements prior to and on Days 1, 4, and 21 after MI. For the HFHS DIO mice, a t-test was used to compare Kred between measurement at baseline and 18 weeks after diet. Also, a t-test was used to compare Kred values between control and adenosine-infusion mice. A log-ratio t-test was used to compare ratio-based DHE measurements of oxidative stress in Day 1 post-MI hearts versus controls.
3 |. RESULTS
3.1 |. MRI dose response
Example T1-weighted saturation-recovery gradient-echo short-axis images of the heart acquired before and after the injection of various doses of 3CP are shown in Figure 2A. Substantial enhancement of the blood and myocardial signals is readily observed. As shown in Figure 2B, the signal-to-noise ratio (SNR) of the myocardium linearly increased with dose for the full range of doses that were injected, whereas for the LV blood pool the SNR increased linearly with dose for the lower doses, but started to plateau at doses above 1.2 mmol/kg. All of the injections were well tolerated by the mice. Based on these results, for subsequent experiments we initially chose to use the highest dose to achieve the highest myocardial SNR while maintaining myocardial signal linearity with dose.
3.2 |. Angiotensin II infusion
Example dynamic 3CP-enhanced saturation-recovery gradient-echo images of the heart are shown in Figure 3A, demonstrating initial signal enhancement followed by decay over time. Figure 3B shows example manually drawn ROIs for the blood pool and myocardial tissue, and Figure 3C shows example [3CP] data for the blood pool and myocardium and the associated 2CXRM fits of CV(t) and CT(t). The results of the Ang II infusion experiments are shown in Figure 3D, where it is seen that after 1 week of Ang II infusion Kred = 0.0405 ± 0.0156 [3CP]/min, which was approximately eight times higher than the values of 0.0051 ± 0.026 [3CP]/min, 0.0039 ± 0.0021 [3CP]/min, and 0.0055 ± 0.0024 [3CP]/min for control mice at baseline, Ang II mice at baseline, and control mice at 1 week, respectively (p < 0.05). The 2CXRM had excellent goodness of fit, with R2 values of 0.98 ± 0.2 (average ± stdev).
FIGURE 3.

A, Example dynamic nitroxide-enhanced MR images before and after injection of 3CP demonstrate signal enhancement kinetics. A proton-density-weighted image (PD) is used to visualize myocardial borders. B, Example ROIs of the LV blood pool and myocardium used to estimate vascular and tissue 3CP concentrations, CV and CT respectively. C, Example CV(t) fit and 2CXRM fitting of CT(t) of a control mouse. Kred was 0.0019 [3CP]/min and R2 was 0.99. D, Kred was significantly elevated in Ang II mice at Week 1 versus Ang II mice at baseline and control mice at Week 1. *p < 0.05 using a two-way ANOVA
3.3 |. Myocardial infarction
Figure 4 shows the results of the experiments in mice that underwent MRI after reperfused MI. Figure 4A demonstrates the use of a co-registered myocardial strain map to define infarcted and noninfarcted remote regions, and shows the application of these regions to a 3CP-enhanced image. Figure 4B shows examples 2CXRM fits for infarcted and remote regions for a mouse scanned on Day 4 after MI. Kred data summarizing all of the post-MI data are shown in Figure 4C, and show that Kred in the infarct zone is elevated on Day 1 and Day 4 after MI (p < 0.05), and approximately returns to the baseline value on Day 21 after MI. In contrast, Kred in the remote region does not change significantly as a function of time after MI. R2 values for the 2CXRM were 0.97 ± 0.02 (average ± stdev), demonstrating excellent goodness of fit. Representative confocal microscopy images from a Day 1 post-MI DHE-stained mouse heart taken from remote and infarct regions of the same histological section are shown in Figure 4D, demonstrating increased oxidative stress in the infarct regions compared with the remote region. Figure 4E shows that the mean infarct/noninfarct DHE ratio from four Day 1 post-MI mice was 1.49 ± 0.25 as compared with the mean lateral wall/septum DHE ratio of 0.99 ± 0.24 from four control mice (p < 0.01). Thus, both nitroxide-enhanced MRI and DHE detect oxidative stress in the infarct zone compared with the remote zone 1 day after MI.
FIGURE 4.

A, An example DENSE circumferential strain map was used to identify infarcted and noninfarcted remote regions of the myocardium in post-MI mice, and these regions were applied to nitroxide-enhanced images acquired at matched locations. B, Example vascular (CV) and 2CXRM remote zone and infarct zone CT fits in a mouse 1 day after infarction. C, Time courses of mean Kred for infarct and remote regions from mice before and for 21 days after MI demonstrate the rise and decline of oxidative stress in the infarct region. D, Example confocal images of DHE-stained myocardium obtained on Day 1 after MI. Specifically, overlays of 488 nm (for oxidation products of DHE) and 405 nm (for DHE) are shown for remote and infarct regions. E, DHE fluorescence in the infarct zone is elevated compared with the remote zone in 1 day post-MI mice, indicative of oxidative stress in infarcted myocardium. In contrast, in control mice DHE fluorescence was equivalent in the septal and lateral walls. *p < 0.05 compared with baseline and Day 21 infarct, and Day 1 remote using a two-way ANOVA. **p < 0.05 compared with baseline and Day 21 infarct, and Day 4 remote using a two-way ANOVA. $p < 0.05 compared with control using a log ratio t test
3.4 |. High-fat high-sucrose diet-induced obesity model
The results of the experiments investigating the detection of oxidative stress after 18 weeks of HFHS diet are shown in Figure 5. Kred at 18 weeks after diet was elevated compared with baseline (0.0327 ± 0.0102 versus 0.0014 ± 0.0009, p < 0.05). R2 values for the 2CXRM fits were 0.97 ± 0.01 (average ± stdev).
FIGURE 5.

The myocardial 3CP reduction rate, Kred, was increased in mice fed an HFHS diet for 18 weeks compared with baseline (0.0327 ± 0.0102 versus 0.0014 ± 0.0009). *p < 0.05 compared with baseline using a t test
3.5 |. Adenosine-mediated perfusion
We observed no difference in Kred between mice with maximal perfusion due to adenosine injection and control mice without adenosine (0.0046 ± 0.0032 versus 0.0051 ± 0.0020). R2 values for the 2CXRM fits were 0.98 ± 0.01 (average ± stdev). This experiment showed that Kred is insensitive to changes in myocardial perfusion. Instead, adenosine infusion led to a significant increase in K2, and the complete 2CXRM results for adenosine infusion are provided in Appendix A.
3.6 |. Toleration of 3CP
Overall, the injection of 3CP at a dose of 2.0 mmol/kg body weight was moderately tolerated by the mice. We performed a total of 67 injections of 3CP at this dose, and within 1–2 days of 3CP injections six mice died, resulting in a 91% toleration rate. All of the mice that died were in the post-Ang II or post-MI groups, suggesting that 3CP at this dose and injection volume is not very well tolerated in mice in a weakened state. However, 61 mice had no observable adverse effects of 3CP at a dose of 2.0 mmol/kg with an injection volume of 200 μL. For mice in the HFHS-DIO study, the injection of 3CP at a dose of 1.2 mmol/kg body weight and an injection volume of 120 μL was well tolerated. Of the 33 injections at this dose, only one mouse died, resulting in a toleration rate of 97%. Thirty-two mice had no observable adverse response.
4 |. DISCUSSION
The major finding of this study is that the nitroxide reduction rate computed from 2CXRM analysis of 3CP-enhanced MRI provides a metric of cardiac oxidative stress in preclinical models of heart disease, such as Ang II infusion, reperfused MI, and HFHS DIO. To our knowledge, no other MRI methods have been shown to assess oxidative stress in the heart. The nitroxide used in these studies, 3CP, is inexpensive, commercially available, and fairly well tolerated by mice, and a straightforward MRI method such as saturation-recovery gradient-echo imaging is sufficient for image acquisition, making MRI of cardiac oxidative stress easy to perform. As oxidative stress plays an important role in HF,32 MI, obesity,3 coronary microvascular disease,33 hypertrophy,34 cardiac arrhythmias,35 cardiotoxicity due to chemotherapy,36 and other types of heart disease, nitroxide-enhanced cardiac MRI may be a broadly applicable method for preclinical studies in many or all of these areas.
We chose to use 3CP because it has been shown to enhance skeletal muscle and myocardium,19,20 adverse reactions have not been reported in the literature, it is commercially available, and it has been shown to detect oxidative stress in tissue using EPR imaging.37 However, there are other nitroxides that might also be well suited for MRI of oxidative stress in the heart.38 For example, the nitroxide 4-(N-methyl piperidine)-2,2,5,5-tetramethylpyrroline-1-oxyl (23c) has been shown to provide strong myocardial signal enhancement and may have a signal decay rate faster than that of 3CP.9 Future work may compare various nitroxides for detecting oxidative stress in the heart using MRI.
In our experiments, we gained experience with two doses of 3CP. For a dose of 2.0 mmol/kg body weight, no adverse events were observed in 91% of the 67 injections that were performed; however, 9% of the mice receiving this dose died. All of the mice that died had been treated with Ang II or undergone MI surgery. We used a lower 3CP dose in the HFHS-DIO experiments, where 33 3CP injections were performed using a dose of 1.2 mmol/kg body weight, and under these conditions only one mouse died, providing a tolerance rate of 97%. No adverse reactions whatsoever were observed in the remaining 32 mice. The adverse events that occurred at either dose may have been related to potentially toxic effects of 3CP, especially at higher doses, or to volume overload related to the relatively large volume of fluid injected. Based on the image quality and SNR results shown in Figure 1 as a function of 3CP dose, the high R2 values demonstrating excellent goodness of fit for the 2CXRM at both doses, and the adverse event data, we advise that future studies should use a 3CP dose of 1.2 mmol/kg body weight.
For the analysis of tissue nitroxide kinetics, we developed a 2CXRM that accounts for exchange of 3CP between the vascular and extravascular spaces as well as 3CP reduction within the extravascular space. With a 3CP dose of 2.0 mmol/kg body weight and the pulse sequence used in this study, the signal intensity in the LV blood pool was nonlinear with the 3CP concentration, as shown in our dosing studies, and a manual adjustment to the arterial 3CP concentration was necessary. With the lower 3CP dose of 1.2 mmol/kg body weight, the blood-pool signal intensity remained in the linear range and no adjustment was used. Using adenosine, we showed that a large increase in tissue perfusion did not affect the 3CP reduction rate, demonstrating, in conjunction with the oxidative stress models, that the Kred parameter is sensitive to changes in oxidative stress and insensitive to changes in perfusion. The overall R2 values for the 2CXRM fits of 3CP tissue concentration were 0.97 ± 0.02 (average ± stdev), and we did not observe significantly lower R2 values when using a 3CP dose of 1.2 mmol/kg.
Confocal microscopy of DHE-stained myocardium was used to confirm oxidative stress in infarcted myocardium 1 day after MI. Quantitative analysis of these images indicated a 49% increase in oxidative stress in infarcted relative to noninfarcted tissue. This value is consistent with previous reports that used DHE histochemistry to assess oxidative stress in rat39 and mouse40 models of MI. Non-invasive MRI of Kred on Day 1 after MI showed a 355% increase in the nitroxide reduction rate in infarcted versus noninfarcted myocardium. While the percent increase in the assessment of oxidative stress is different between 3CP-enhanced MRI and confocal microscopy after DHE staining, it should be noted that the two methods are performed under different conditions and do not reflect identical underlying tissue distributions of the tracers or their biochemistry, and the two metrics are computed differently.
While the MI studies detected oxidative stress on Days 1 and 4 after infarction, by Day 21 after infarction we detected a reduction of oxidative stress to baseline levels. This result is entirely consistent with prior pathology data showing resolution of the immune cell response by Day 21.18 The clinical significance of this finding is that any potential future therapy that may target these immune cells and/or the associated oxidative stress may be effective on Days 1 and 4 after MI, but not on Day 21.
Nitroxide-enhanced imaging can be one component of a multiparametric preclinical cardiac MRI protocol that assesses a number of parameters including cardiac structure, function, strain, perfusion, contractile reserve, perfusion reserve, and other tissue properties.41 For example, in our MI studies we used cine DENSE myocardial strain imaging to identify distinct infarct and noninfarct zones, and we demonstrated that oxidative stress is localized to the infarct zone. Similarly, future studies may use nitroxide-enhanced MRI in combination with arterial spin labeling to study the relationship between oxidative stress and coronary vascular function, or may use nitroxide-enhanced MRI in combination with T1 mapping to study inflammation or T2 mapping to study iron deposition. Using oxidative stress imaging as part of a comprehensive MRI protocol is a major advantage of nitroxide-enhanced MRI compared with EPR methods.
5 |. CONCLUSION
In summary, nitroxide-enhanced MRI of the heart is a simple and easy-to-use method to quantify tissue oxidative stress as one component of a multiparametric preclinical cardiac MRI examination.
ACKNOWLEDGMENTS
We appreciate the work of R. Jack Roy, who expertly performed many of the MRI studies in this project, and Lanlin Chen, who performed all the surgical procedures for multiple mouse models in this project.
Funding information
NIH NIBIB:, Grant/Award Number: R01 EB001763; US-Israel Binational Science Foundation, Grant/Award Number: BSF2017200
ABBREVIATIONS
- 2CXM
two-compartment exchange model
- 2CXRM
two-compartment exchange and reduction model
- 3CP
3-carbamoyl-proxyl
- Ang II
angiotensin II
- CEV(t)
extravascular nitroxide concentration
- CT(t)
tissue nitroxide concentration
- CV(t)
vascular nitroxide concentration
- DENSE
displacement encoding with stimulated echoes
- DHE
dihydroethidium
- DIO
diet-induced obesity
- EPR
electron paramagnetic resonance
- HF
heart failure
- HFHS
high fat high sucrose
- IP
intraperitoneal
- K1
vascular to extravascular exchange rate
- K2
extravascular to vascular exchange rate
- Kred
extravascular nitroxide reduction rate
- LAD
left anterior descending
- LV
left ventricular
- MI
myocardial infarction
- NADPH
nicotinamide adenine dinucleotide phosphate
- RAAS
renin-angiotensin-aldosterone system
- ROI
region of interest
- ROS
reactive oxygen species
- v
tissue vascular volume fraction
APPENDIX A: JUSTIFICATION THAT Kred IS A CONCENTRATION-INDEPENDENT RATE CONSTANT
We determined that the nitroxide reduction parameter, Kred, in the 2CXRM of Equations 1–4 is concentration independent based on experiments relating the signal reduction rate to the nitroxide dose. Prior methods to quantify nitroxide reduction used a simple exponential model to determine the nitroxide signal intensity decay rate as described.6,7 Figure A1A shows that the nitroxide decay rate, using a simple exponential model, stays constant as we increase the dosage of 3CP. Figure A1B shows that Kred remains fairly constant as the 3CP dose is increased. These results provide justification that Kred is a concentration-independent rate constant for the doses studied.
FIGURE A1.
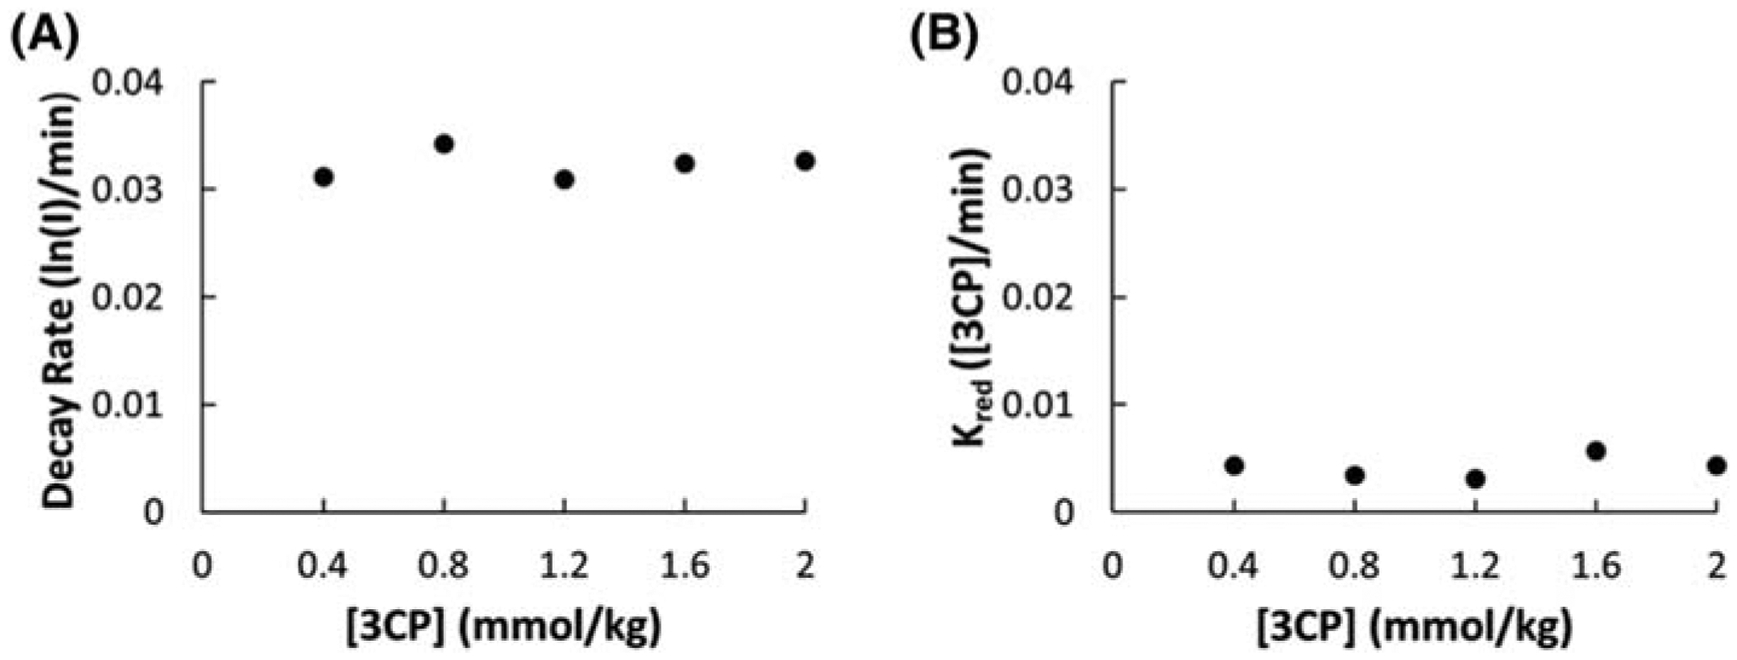
A, The myocardial 3CP decay rate quantified by linear fitting of the natural log of signal intensity (I) decay as a function of the 3CP dose. B, The 2CXRM myocardial 3CP reduction rate, Kred, as a function of the 3CP dose
APPENDIX B: K1, K2, AND Kred RESULTS OF 2CXRM ANALYSES OF ALL STUDIES
While the main text has focused on Kred results, the 2CXRM also generated K1 and K2 results for each of the mouse models. <TAB A1>Table A1 summarizes K1, K2, and Kred values computed using the 2CXRM for all mice in all studies. In the infarct region of post-MI mice, there was a significant reduction in K1 and K2 on Day 1 and Day 4 after MI and a recovery to baseline on Day 21 consistent with the time course of microvascular damage and revascularization following reperfused MI.18,42 In Ang II mice, there was a reduction in K2 after Ang II infusion, and in the HFHS DIO mice there were significant reductions in both K1 and K2 after diet. These results suggest that the 2CXRM analysis of 3CP detects compartmental exchange rate changes reflecting alterations of the microvasculature that occur in these disease models.1,3 In mice with maximal vasodilation via adenosine, no changes in K1 were detected; however, the increase in tissue perfusion that occurs with this adenosine dose resulted in a large increase in K2, the parameter describing the exchange rate of 3CP from the extravascular to the vascular space.
TABLE A1.
Summary of 2CXRM parameter values obtained from all dynamic nitroxide-enhanced MRI experiments performed in this study
| K 1 | K 2 | K red | |
|---|---|---|---|
| Saline Pre | 2.36 ± G.3G | 4.2G ± G.53 | G.GG51 ± G.GG26 |
| Saline Post | 2.24 ± G.32 | 4.14 ± G.55 | G.GG55 ± G.GG24 |
| ANGII Pre | 2.33 ± G.17 | 4.73 ± G.94 | G.GG39 ± G.GG23 |
| ANGII Post | 2.16 ± G.25 | 3.24 ± G.27 | G.G4G5 ± G.G156 * |
| Remote Baseline | 2.G8 ± G.22 | 3.49 ± G.31 | G.G126 ± G.GG64 |
| Remote Day 1 | 1.89 ±G.15 | 3.15 ± G.47 | G.G35G ± G.G261 |
| Remote Day 4 | 1.88 ± G.1G | 2.5G ± G.12 | G.G387 ± G.GG84 |
| Remote Day 21 | 1.78 ± G.1G | 3.G4 ± G.42 | G.G37G ± G.G163 |
| Infarct Baseline | 2.G5 ± G.23 | 3.6G ± G.38 | G.G134 ± G.GG83 |
| Infarct Day 1 | 1.14 ± G.G8 ** | 1.84 ± G.17# | G.1592 ± G.G464# |
| Infarct Day 4 | 1.52 ± G.14 ** | 1.97 ± G.19# | G.16G6 ± G.G497# |
| Infarct Day 21 | 1.91 ± G.1G | 3.G7 ± G.36 | G.G369 ± G.G155 |
| HFHS baseline | 2.18 ± G.G8 | 4.56 ± G.39 | G.GG14 ± G.GGG9 |
| HFHS post-diet | 1.79 ± G.14$ | 2.86 ± G.2G$ | G.G327 ± G.G1G2$ |
| Adenosine Pre-Infusion | 2.24 ± G.32 | 3.86 ± G.38 | G.GG51 ± G.GG2G |
| Adenosine Post-Infusion | 2.34 ± G.13 | 5.97 ± 1.24& | G.GG46 ± G.GG32 |
p < 0.05 versus Ang II pre and saline pre using a two-way ANOVA.
p < 0.05 versus all infarct time points and same day remote using a two-way ANOVA.
p < 0.05 versus infarct baseline, infarct Day 21, and same day remote using a two-way ANOVA.
p < 0.05 versus HFHS baseline using a t test.
p < 0.05 versus adenosine control using a t test.
Footnotes
AVAILABILITY OF DATA AND MATERIALS
The datasets used and analyzed during this study are available from the corresponding author on reasonable request.
CONFLICTS OF INTEREST
The authors declare that they have no competing interests.
REFERENCES
- 1.Münzel T, Camici GG, Maack C, Bonetti NR, Fuster V, Kovacic JC. Impact of oxidative stress on the heart and vasculature: part 2 of a 3-part series. J Am Coll Cardiol. 2017;70(2):212–229. [DOI] [PMC free article] [PubMed] [Google Scholar]
- 2.Duilio C, Ambrosio G, Kuppusamy P, DiPaula A, Becker LC, Zweier JL. Neutrophils are primary source of O2 radicals during reperfusion after prolonged myocardial ischemia. Am J Physiol Heart Circ Physiol. 2001;280(6):H2649–H2657. [DOI] [PubMed] [Google Scholar]
- 3.Furukawa S, Fujita T, Shimabukuro M, et al. Increased oxidative stress in obesity and its impact on metabolic syndrome. J Clin Invest. 2017;114(12): 1752–1761. [DOI] [PMC free article] [PubMed] [Google Scholar]
- 4.Münzel T, Gori T, Keaney JF, Maack C, Daiber A. Pathophysiological role of oxidative stress in systolic and diastolic heart failure and its therapeutic implications. Eur Heart J. 2015;36:2555–2564. [DOI] [PMC free article] [PubMed] [Google Scholar]
- 5.Elas M, Ichikawa K, Halpern HJ. Oxidative stress imaging in live animals with techniques based on electron paramagnetic resonance. Radiat Res. 2012; 177(4):514–523. [DOI] [PMC free article] [PubMed] [Google Scholar]
- 6.Hyodo F, Soule BP, Matsumoto K-I, et al. Assessment of tissue redox status using metabolic responsive contrast agents and magnetic resonance imaging. J Pharm Pharmacol. 2008;60(8):1049–1060. [DOI] [PMC free article] [PubMed] [Google Scholar]
- 7.Matsumoto K-I, Hyodo F, Matsumoto A, et al. High-resolution mapping of tumor redox status by magnetic resonance imaging using nitroxides as redox-sensitive contrast agents. Clin Cancer Res. 2006;12(8):2455–2462. [DOI] [PubMed] [Google Scholar]
- 8.Zhelev Z, Gadjeva V, Aoki I, Bakalova R, Saga T. Cell-penetrating nitroxides as molecular sensors for imaging of cancer in vivo, based on tissue redox activity. Mol Biosyst. 2012;8(10):2733–2740. [DOI] [PubMed] [Google Scholar]
- 9.Davis RM, Sowers AL, DeGraff W, et al. A novel nitroxide is an effective brain redox imaging contrast agent and in vivo radioprotector. Free Radic Biol Med. 2011;51(3):780–790. [DOI] [PMC free article] [PubMed] [Google Scholar]
- 10.Matsumoto K-I, Yamasaki T, Nakamura M, et al. Brain contrasting ability of blood-brain-barrier-permeable nitroxyl contrast agents for magnetic resonance redox imaging. Magn Reson Med. 201676(3):935–945. [DOI] [PubMed] [Google Scholar]
- 11.Landmesser U, Cai H, Dikalov S, et al. Role of p47phox in vascular oxidative stress and hypertension caused by angiotensin II. Hypertension. 2002;40 (4):511–515. [DOI] [PMC free article] [PubMed] [Google Scholar]
- 12.Higashi M, Shimokawa H, Hattori T, et al. Long-term inhibition of Rho-kinase suppresses angiotensin II-induced cardiovascular hypertrophy in rats in vivo: effect on endothelial NAD(P)H oxidase system. Circ Res. 2003;93(8):767–775. [DOI] [PubMed] [Google Scholar]
- 13.Feillet-Coudray C, Sutra T, Fouret G, et al. Oxidative stress in rats fed a high-fat high-sucrose diet and preventive effect of polyphenols: involvement of mitochondrial and NAD(P)H oxidase systems. Free Radic Biol Med. 2009;46(5):624–632. [DOI] [PubMed] [Google Scholar]
- 14.Yokoyama H, Tada M, Itoh O, Fukui K. Reaction kinetics analysis to estimate in vivo decay rate of EPR signals of a nitroxide radical in the brain and the inferior vena cava of rats. Appl Magn Reson. 2003;25(2):217–225. [Google Scholar]
- 15.Barnes SL, Whisenant JG, Loveless ME, Yankeelov TE. Practical dynamic contrast enhanced MRI in small animal models of cancer: data acquisition, data analysis, and interpretation. Pharmaceutics. 2012;4(3):442–478. [DOI] [PMC free article] [PubMed] [Google Scholar]
- 16.Ross AJ, Yang Z, Berr SS, et al. Serial MRI evaluation of cardiac structure and function in mice after reperfused myocardial infarction. Magn Reson Med. 2002;47(6):1158–1168. [DOI] [PubMed] [Google Scholar]
- 17.Naresh NK, Xu Y, Klibanov AL, et al. Monocyte and/or macrophage infiltration of heart after myocardial infarction: MR imaging by using T1-shortening liposomes. Radiology. 2012;264(2):428–435. [DOI] [PMC free article] [PubMed] [Google Scholar]
- 18.Vandervelde S, van Amerongen MJ, Tio RA, Petersen AH, van Luyn MJ, Harmsen MC. Increased inflammatory response and neovascularization in reperfused vs. nonreperfused murine myocardial infarction. Cardiovasc Pathol. 2006;15(2):83–90. [DOI] [PubMed] [Google Scholar]
- 19.Kuppusamy P, Li H, Ilangovan G, et al. Noninvasive imaging of tumor redox status and its modification by tissue glutathione levels. Cancer Res. 2002; 62(1):307–312. [PubMed] [Google Scholar]
- 20.Li H, He G, Deng Y, Kuppusamy P, Zweier JL. In vivo proton electron double resonance imaging of the distribution and clearance of nitroxide radicals in mice. Magn Reson Med. 2006;55(3):669–675. [DOI] [PubMed] [Google Scholar]
- 21.Voros S, Yang Z, Bove CM, et al. Interaction between AT1 and AT2 receptors during postinfarction left ventricular remodeling. Am J Physiol Heart Circ Physiol. 2006;290(3):H1004–H1010. [DOI] [PubMed] [Google Scholar]
- 22.Kim D, Gilson WD, Kramer CM, Epstein FH. Myocardial tissue tracking with two-dimensional cine displacement-encoded MR imaging: development and initial evaluation. Radiology. 2004;230(3):862–871. [DOI] [PubMed] [Google Scholar]
- 23.Vandsburger MH, French BA, Kramer CM, Zhong X, Epstein FH. Displacement-encoded and manganese-enhanced cardiac MRI reveal that nNOS, not eNOS, plays a dominant role in modulating contraction and calcium influx in the mammalian heart. Am J Physiol Heart Circ Physiol. 2011;302(2):H412–H419. [DOI] [PMC free article] [PubMed] [Google Scholar]
- 24.Zhong X, Spottiswoode BS, Meyer CH, Kramer CM, Epstein FH. Imaging three-dimensional myocardial mechanics using navigator-gated volumetric spiral cine DENSE MRI. Magn Reson Med. 2010;64(4):1089–1097. [DOI] [PMC free article] [PubMed] [Google Scholar]
- 25.Epstein FH, Yang Z, Gilson WD, Berr SS, Kramer CM, French BA. MR tagging early after myocardial infarction in mice demonstrates contractile dysfunction in adjacent and remote regions. Magn Reson Med. 2002;48(2):399–403. [DOI] [PubMed] [Google Scholar]
- 26.Spottiswoode BS, Zhong X, Lorenz CH, Mayosi BM, Meintjes EM, Epstein FH. Motion-guided segmentation for cine DENSE MRI. Med Image Anal. 2009;13(1):105–115. [DOI] [PMC free article] [PubMed] [Google Scholar]
- 27.Spottiswoode BS, Zhong X, Hess AT, et al. Tracking myocardial motion from cine DENSE images using spatiotemporal phase unwrapping and temporal fitting. IEEE Trans Med Imaging. 2007;26(1):15–30. [DOI] [PubMed] [Google Scholar]
- 28.Cernicanu A, Axel L. Theory-based signal calibration with single-point T1 measurements for first-pass quantitative perfusion MRI studies. Acad Radiol. 2006;13(6):686–693. [DOI] [PubMed] [Google Scholar]
- 29.Zielonka J, Kalyanaraman B. Hydroethidine-and MitoSOX-derived red fluorescence is not a reliable indicator of intracellular superoxide formation: another inconvenient truth. Free Radic Biol Med. 2010;48(8):983–1001. [DOI] [PMC free article] [PubMed] [Google Scholar]
- 30.Schindelin J, Arganda-Carreras I, Frise E, et al. Fiji: an open-source platform for biological-image analysis. Nat Methods. 2012;9(7):676–682. [DOI] [PMC free article] [PubMed] [Google Scholar]
- 31.Troalen T, Capron T, Bernard M, Kober F. In vivo characterization of rodent cyclic myocardial perfusion variation at rest and during adenosine-induced stress using cine-ASL cardiovascular magnetic resonance. J Cardiovasc Magn Reson. 2014;16(1):18–30. [DOI] [PMC free article] [PubMed] [Google Scholar]
- 32.Giordano FJ. Oxygen, oxidative stress, hypoxia, and heart failure. J Clin Invest. 2005;115(3):500–508. [DOI] [PMC free article] [PubMed] [Google Scholar]
- 33.Paulus WJ, Tschöpe C. A novel paradigm for heart failure with preserved ejection fraction. J Am Coll Cardiol. 2013;62(4):263–271. [DOI] [PubMed] [Google Scholar]
- 34.Takimoto E, Kass DA. Role of oxidative stress in cardiac hypertrophy and remodeling. Hypertension. 2007;49(2):241–248. [DOI] [PubMed] [Google Scholar]
- 35.Jeong E-M, Liu M, Sturdy M, et al. Metabolic stress, reactive oxygen species, and arrhythmia. J Mol Cell Cardiol. 2012;52(2):454–463. [DOI] [PMC free article] [PubMed] [Google Scholar]
- 36.Octavia Y, Tocchetti CG, Gabrielson KL, Janssens S, Crijns HJ, Moens AL. Doxorubicin-induced cardiomyopathy: from molecular mechanisms to therapeutic strategies. J Mol Cell Cardiol. 2012;52(6):1213–1225. [DOI] [PubMed] [Google Scholar]
- 37.Sonta T, Inoguchi T, Matsumoto S, et al. In vivo imaging of oxidative stress in the kidney of diabetic mice and its normalization by angiotensin II type 1 receptor blocker. Biochem Biophys Res Commun. 2005;330(2):415–422. [DOI] [PubMed] [Google Scholar]
- 38.Bačić G, Pavićević A, Peyrot F. In vivo evaluation of different alterations of redox status by studying pharmacokinetics of nitroxides using magnetic resonance techniques. Redox Biol. 2016;8:226–242. [DOI] [PMC free article] [PubMed] [Google Scholar]
- 39.Manintveld OC, te Lintel HM, van den Bos EJ, et al. Cardiac effects of postconditioning depend critically on the duration of index ischemia. Am J Physiol Heart Circ Physiol. 2007;292(3):H1551–H1560. [DOI] [PubMed] [Google Scholar]
- 40.Obana M, Miyamoto K, Murasawa S, et al. Therapeutic administration of IL-11 exhibits the post-conditioning effects against ischemia reperfusion injury via STAT3 in the heart. Am J Physiol Heart Circ Physiol. 2012;303(5):H569–H577. [DOI] [PubMed] [Google Scholar]
- 41.Epstein FH. MR in mouse models of cardiac disease. NMR Biomed. 2007;20(3):238–255. [DOI] [PubMed] [Google Scholar]
- 42.Vandsburger MH, Janiczek RL, Xu Y, et al. Improved arterial spin labeling after myocardial infarction in mice using cardiac and respiratory gated look-locker imaging with fuzzy C-means clustering. Magn Reson Med. 2010;63(3):648–657. [DOI] [PMC free article] [PubMed] [Google Scholar]