Abstract
G protein-coupled receptors (GPCRs) relay information across cell membranes through conformational coupling between the ligand-binding domain and cytoplasmic signaling domain. In dimeric class C GPCRs, the mechanism of this process, which involves propagation of local ligand-induced conformational changes over 12 nm through three distinct structural domains, is unknown. Here, we used single-molecule FRET (smFRET) and live-cell imaging and found that metabotropic glutamate receptor 2 (mGluR2) interconverts between four conformational states, two of which were previously unknown, and activation proceeds through the conformational selection mechanism. Furthermore, the conformation of the ligand-binding domains and downstream domains are weakly coupled. We show that the intermediate states act as conformational checkpoints for activation and control allosteric modulation of signaling. Our results demonstrate a mechanism for activation of mGluRs where ligand binding controls the proximity of signaling domains, analogous to some receptor kinases. This design principle may be generalizable to other biological allosteric sensors.
Main
Cells use membrane receptors to dynamically sense and interpret chemical and physical signals from their environment1. A key design principle of many membrane receptors is that sensing is energetically passive, and no external energy is required. That is, the energetics of ligand binding is converted to a local conformational change and into the output signal. This process is often allosteric in nature and involves coupling of conformational dynamics between the ligand binding “sensory domain” and the cytoplasmic “signaling interface”2.
In humans, G protein-coupled receptors (GPCRs) are the largest family of membrane receptors and have become key targets for drug development due to their involvement in nearly all physiological processes3,4. A deeper understanding of the activation and modulatory mechanisms used by GPCRs would be critical for developing new therapeutics as well as designing synthetic receptors and sensors. Significant advances in structural methods have identified ligand and ion binding sites in many GPCRs3,5 as well as atomic-level details of different steps of signal transduction by GPCR complexes6,7. Moreover, improved understanding of the conformational dynamics of GPCRs by computational, nuclear magnetic resonance (NMR) spectroscopy, double electron-electron resonance (DEER) spectroscopy and fluorescent based assays demonstrated that the two-state on–off model of GPCRs cannot account for their signaling versatility and complex pharmacology and GPCRs are highly dynamic proteins that sample multiple conformational states8–11. Collectively, these approaches have started to provide a structural framework to understand multiple facets of GPCR pharmacology such as basal activity, partial agonism, biased signaling and allosteric modulation7,12–14. However, how large-scale conformational changes propagate during the activation process of GPCRs and how ligands modify the structure and dynamics of GPCRs to tune their functional outcomes, especially for many large multidomain GPCRs is poorly understood.
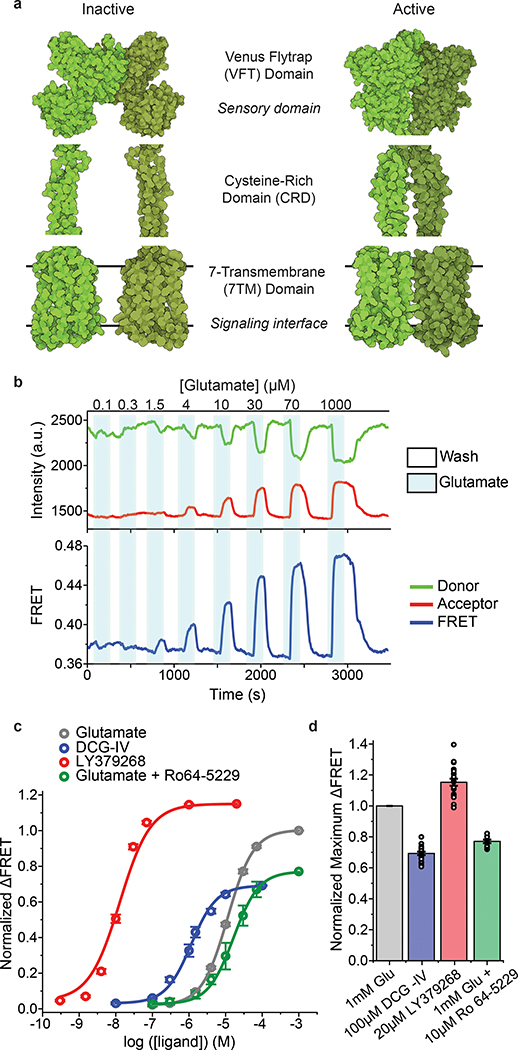
Among all GPCRs, class C GPCRs are structurally unique in that they have multiple structural domains and function as obligate dimers. Importantly, they have a large extracellular domain (ECD) that contains the ligand-binding pocket. Metabotropic glutamate receptors (mGluRs) are class C GPCRs that are responsible for the slow neuromodulatory effects of glutamate and are essential for tuning synaptic transmission and excitability15,16. Structural17–19 and spectroscopic studies20,21 have shown that unlike the activation process of most class A GPCRs which is associated with subtle motions in the ECD of the receptor, the activation of mGluRs involves local and global conformational changes that propagate through the three structural domains of the receptor, over 12 nm, to reach the intracellular G protein-binding interface (signaling interface)10,17,21 (Fig. 1a). The molecular details, timescales, intermediate transition states and sequence of conformational changes during this process are unclear.
Fig. 1: Design and characterization of the FRET-based CRD conformational sensor.
a, Cartoon illustrating the arrangement of the three structural domains of mGluR5 in the inactive (RCSB Protein Data Bank (PDB) accession 6N52) and active (PDB accession 6N51) states. b, Representative donor and acceptor intensities and corresponding FRET signal from a cell in response to glutamate application. c, Dose-response curves from live-cell FRET titration experiments for glutamate (grey), LY379268 (red), DCG-IV (blue) or glutamate +10 μM Ro64–5229 (green) in HEK293T cells. Each titration curve is normalized to the 1 mM glutamate response. Data represent mean ± s.e.m. of N=26, 20, 10 and 13 cells for glutamate, LY379268, DCG-IV and glutamate +10 μM Ro64–5229, respectively, examined over 3 independent experiments. d, Maximum FRET change in the presence of saturating LY379268 (red), DCG-IV (blue) and glutamate +10 μM Ro64–5229 (green) normalized to the 1 mM glutamate response (grey) in HEK293T cells. Data represent mean ± s.e.m. of N=21, 19 and 9 cells for LY379268, DCG-IV and glutamate +10 μM Ro64–5229, respectively, examined over 3 independent experiments.
Here, we used single-molecule FRET (smFRET)22 and in vivo FRET imaging to visualize the propagation of conformational changes during the activation of mGluR2. To circumvent limitations of common site-specific fluorescent labeling approaches that requires generation of cysteine-less mutants or insertion of large protein tag, we adopted and optimized an unnatural amino acid incorporation strategy23. This enabled us to follow the conformation of the key allosteric linker between the ligand-binding and signaling domains of mGluR2. Using this assay, we found that the dimeric arrangement of mGluR2 adopts four distinct conformational states that are visited sequentially, in contrast to the two-state model deduced from the atomic structures17,18. Using mutations and crosslinking approaches, we characterized the functional property and significance of the conformational states for the receptor signaling and modulation. This sequential four-state activation model provides a structural framework for understanding ligand efficacy and allosteric modulation of mGluRs and possibly other class C GPCRs.
Results
According to the current activation model for mGluRs, glutamate binding at the Venus flytrap (VFT) domain (sensory domain) closes the VFT lobes and results in the rearrangement of the VFT domains’ dimer interface from “relaxed” to “active”10,18 (Fig. 1a). Next, this conformational change is thought to bring the adjacent cysteine-rich domains (CRDs) closer together to activate the G protein-binding interface17,21 (Fig. 1a). The CRD is the allosteric structural link that relays the incoming signal (that is the conformation of the VFT domains) to the signaling site (7TM domains) (Fig. 1a). We therefore hypothesized that the arrangement of the CRDs in the dimer reports how the VFT domains allosterically regulate the conformation of the 7TM domains, independent of intradomain movement of transmembrane helices. To test this, we applied smFRET and live-cell ensemble FRET imaging to visualize the conformational changes of the CRD of mGluR2 during activation, in real-time10,20,22.
Design and validation of CRD conformational FRET sensor
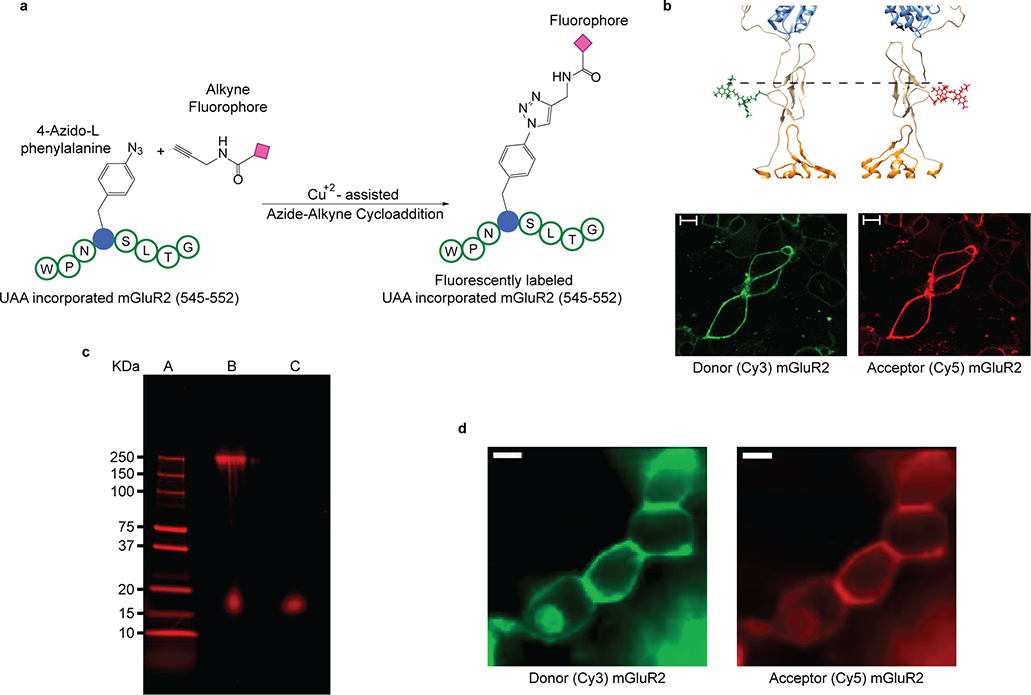
To site-specifically attach donor and acceptor fluorophores, with minimal perturbation to the receptor structure, we adopted and optimized an unnatural amino acid incorporation strategy24,25 and introduced a 4-azido-l-phenylalanine at amino acid 548 of mouse mGluR2 (hereafter, 548UAA) (Extended Data Fig. 1a–b). We expressed 548UAA in HEK293T cells and site-specifically labeled the cell-surface population of receptors with FRET donor (Cy3) and acceptor (Cy5) fluorophores, through a copper-catalyzed azide-alkyne click reacion26 (Extended Data Fig. 1a–b) (supplementary materials and methods). Because mGluRs are strict dimers any FRET signal is exclusively from the receptors that are labeled with a single donor and a single acceptor fluorophore. Total cell lysate from labeled cells on a non-reducing polyacrylamide gel showed a single band corresponding to the size of the full-length dimeric mGluR2 (Extended Data Fig. 1c), verifying that the receptor population on the plasma membrane are full-length.
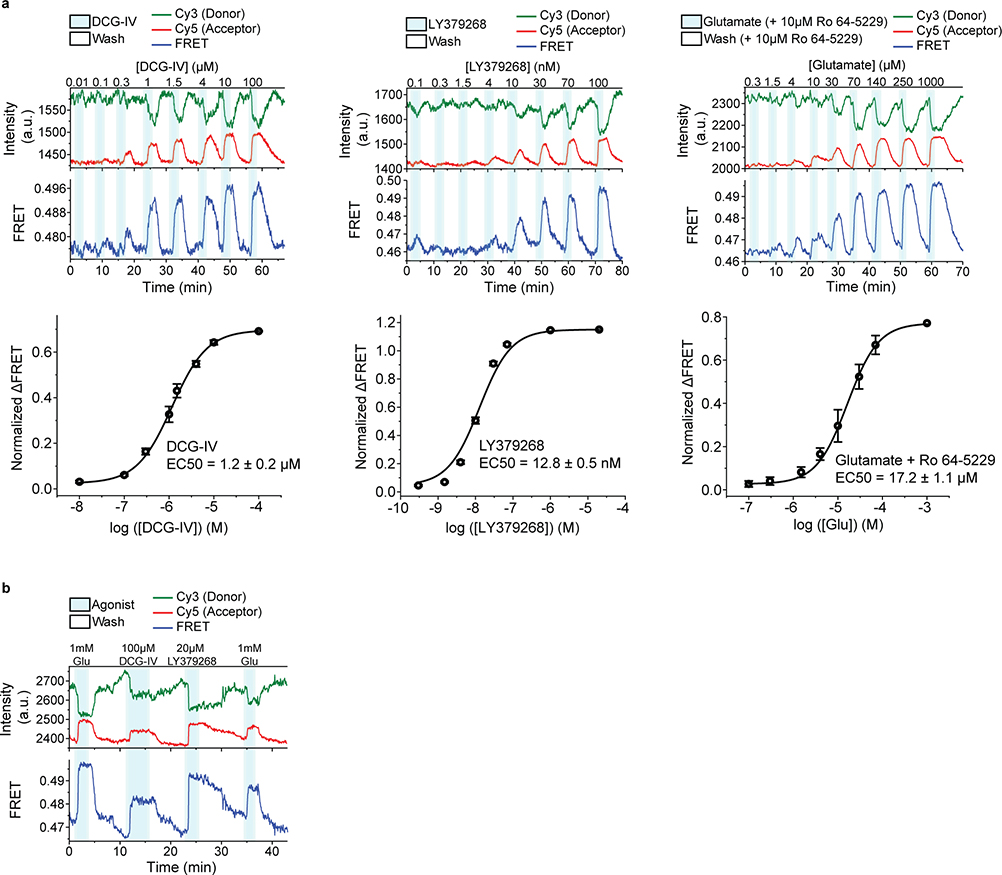
We observed that glutamate induced a concentration-dependent increase in the FRET signal in labeled cells expressing 548UAA (Fig. 1b and Extended Data Fig. 1d), confirming a general decrease in the distance between the CRD domains upon activation and consistent with previous structural and crosslinking experiments17,27,28. This glutamate-dependent increase in ensemble FRET had an EC50 of 11.8 ± 0.5 μM (Fig. 1c), consistent with the concentration-dependence of GIRK current activation in HEK293T cells10. Similar dose-dependent increase in the FRET efficiency was obtained with other orthosteric agonists LY379268 (hereafter, LY37) and DCG-IV with respective EC50 of 12.8 ± 0.5 nM and 1.2 ± 0.2 μM (Fig. 1c and Extended Data Fig. 2a), matching the published range for mGluR220. On the other hand, the mGluR2-specific negative allosteric modulator (NAM) Ro64–5229 reduced the glutamate efficacy (max response 77% ± 1% of glutamate) (Fig. 1d) and potency (EC50 = 17.2 ± 1.1 μM) (Fig. 1c and Extended Data Fig. 2a), consistent with the notion that the CRD is the allosteric linker between ligand binding and signaling. Therefore, the 548UAA FRET sensor allows unperturbed quantitative analysis of ligand-induced conformational changes of the CRD in live cells. Importantly, the efficacy of ligands as characterized by signaling assays or VFT domain FRET sensors10,20 correlate with the ligand-induced FRET change at the CRD with DCG-IV being a partial agonist and LY37 > glutamate > DCG-IV (Fig. 1d and Extended Data Fig. 2b).
CRD is in dynamic equilibrium between 4 states
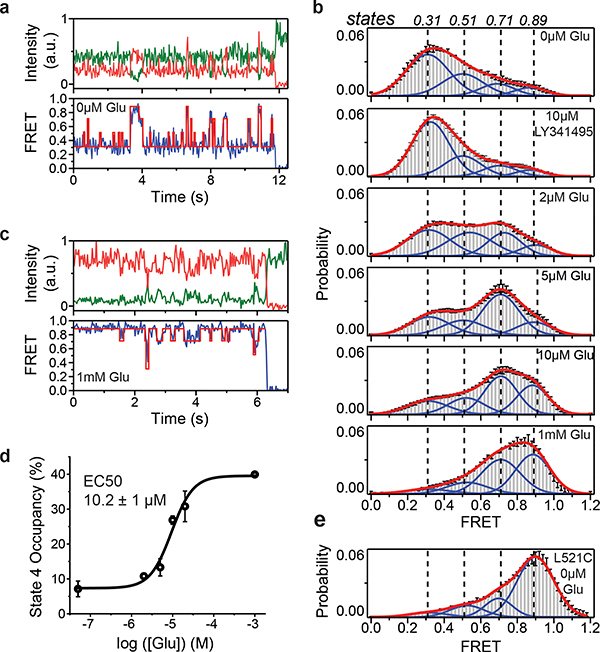
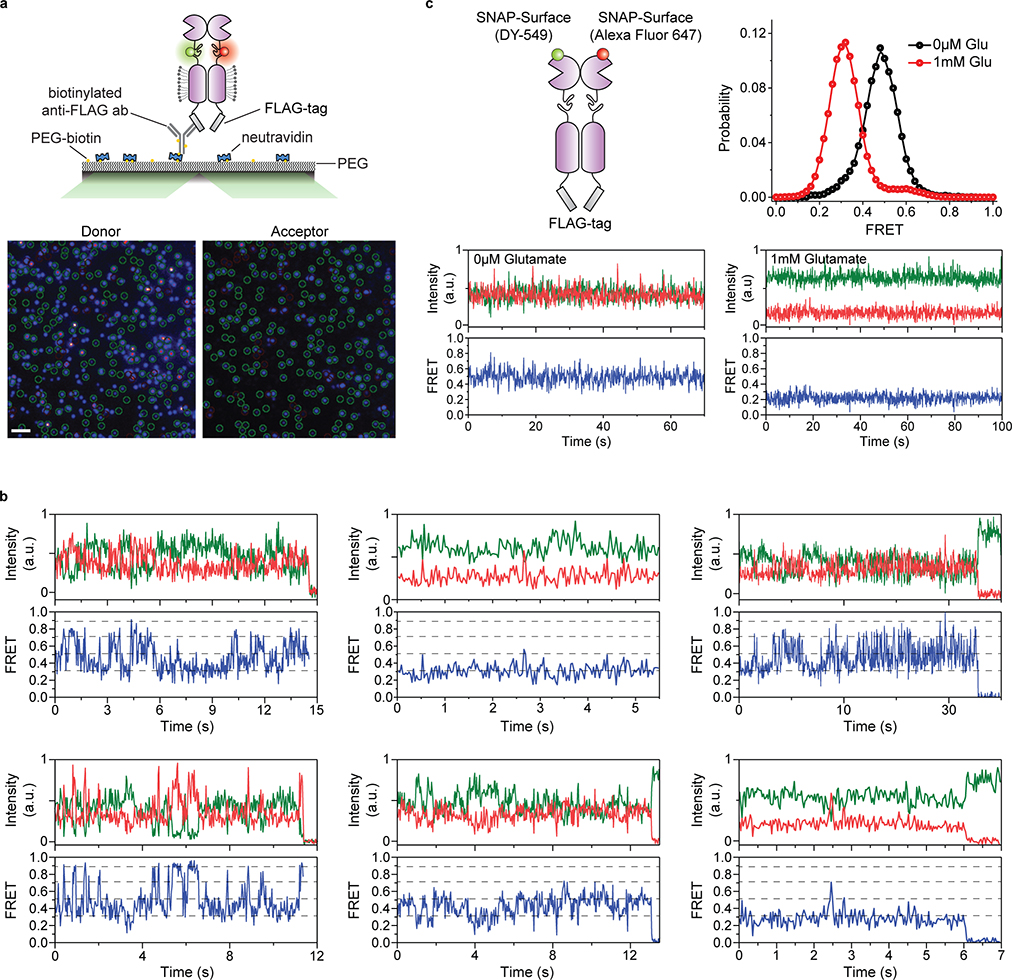
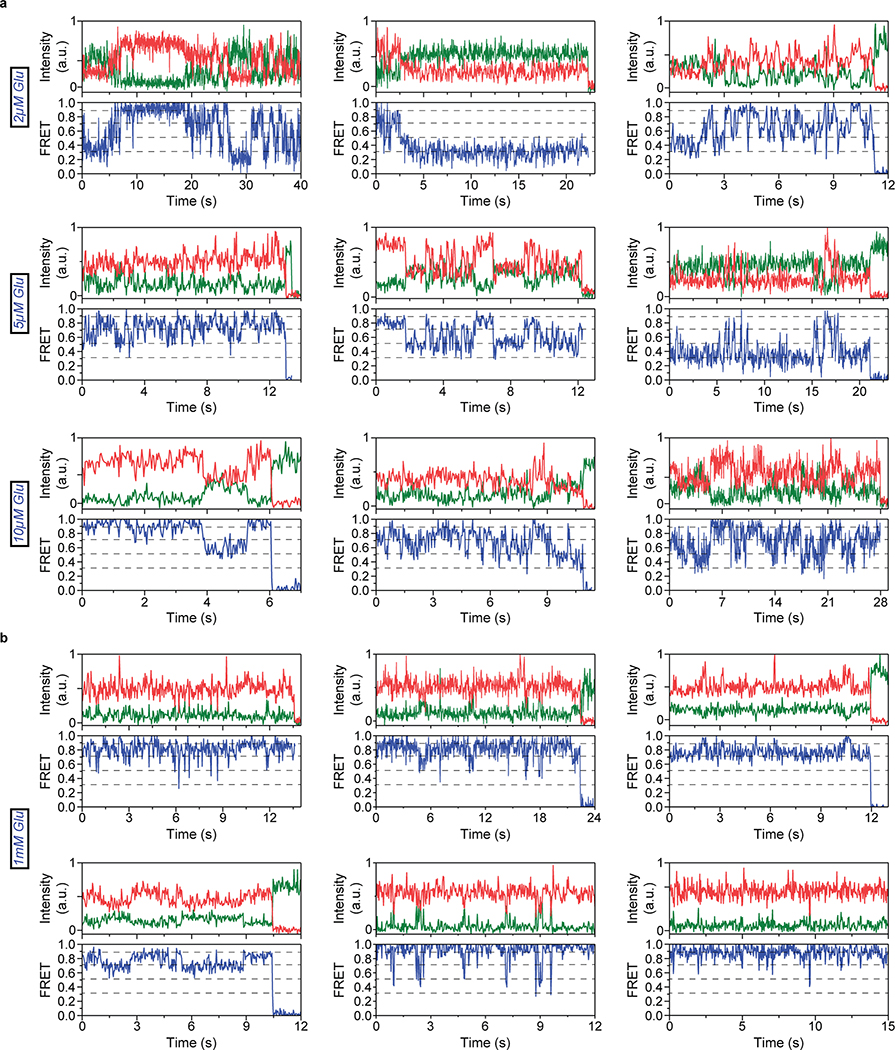
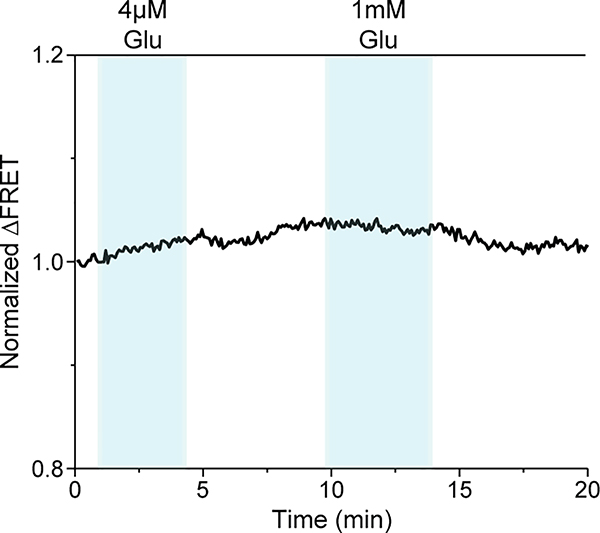
To perform smFRET imaging, cells expressing 548UAA with a C-terminal FLAG tag were labeled with donor and acceptor fluorophores and then lysed. The cell lysate was applied onto a polyethylene glycol (PEG) passivated coverslip functionalized with anti-FLAG tag antibody to immunopurify the receptors (SiMPull)10,29 for total internal reflection fluorescence imaging (Extended Data Fig. 3a) (supplementary materials and methods). In the absence of glutamate (inactive receptor), the CRD of individual mGluR2 receptors displayed rapid transitions between multiple FRET states (Fig. 2a and Extended Data Fig. 3b), in stark contrast to the previously reported behavior of the VFT domains that were stable in a single conformation10 (Extended Data Fig. 3c). Histogram of smFRET data from many single receptors revealed four conformations with smFRET efficiency peaks at: 0.31, 0.51, 0.71 and 0.89 (labeled as states 1–4) (Fig. 2b, top histogram). The smFRET histogram was unchanged in the presence of saturating competitive antagonist LY341495 (Fig. 2b), confirming that the observed dynamics is independent of the orthosteric agonist binding. In the presence of glutamate, receptors remained dynamic and showed transitions between the same four FRET states but with shifted occupancy to the higher states, in a glutamate-dependent manner (Fig. 2b and Extended Data Fig. 4a), and in qualitative agreement with the live-cell FRET experiment (Fig. 1b). Notably, even at saturating glutamate (1 mM) receptors showed significant dynamics between states 3 and 4 (Fig. 2c and Extended Data Fig. 4b). A similar overall behavior was observed when examining mouse mGluR3 at the analogous position (A557) (Extended Data Fig. 5). The atomic structures of the inactive conformations of mGluR5 and mGluR3 have resolved the CRDs at a large distance apart (68.3 Å at position D560 in human mGluR5) 17,27. Therefore, the lowest FRET peak at 0.31 (state 1), which is the predominant population in the absence of an agonist, corresponds to the crystallographic inactive conformation of the mGluR2. In this conformation the VFT domain lobes are “open” (oo) and the dimer interface is in the “relaxed” (R) state (R/oo)18,20. On the other hand, the highest FRET peak at 0.89 (state 4) corresponds to an approximate distance of 38 Å which agrees with the distance at our labeling position based on the recent structure of the ligand bound mGluR5 17 (35.9 Å at position D560 in human mGluR5). The occupancy of this FRET peak showed a glutamate concentration-dependence with the EC50 of 10.2 ± 1 μM (Fig. 2d), matching the EC50 measured from signaling assays in live cells. Therefore, we hypothesized that the FRET state 4 is the crystallographic active CRD conformation of mGluR2. To test this, we performed a smFRET experiment on the intersubunit CRD cross-linked mGluR2(L521C) construct which was previously shown to result in a constitutively signaling active receptor28. Consistent with this, live-cell measurements with this construct showed no FRET change upon application of glutamate (Extended Data Fig. 6). smFRET experiments with this construct in the absence of glutamate showed a dominant peak at FRET 0.89 (Fig. 2e). Together, these results confirm the assignment of state 4 as the active CRD conformation of mGluR2.
Fig. 2: Single-molecule FRET reveals four conformational states of mGluR2 CRD.
a, Example single-molecule time trace of 548UAA in the absence of glutamate showing donor (green) and acceptor (red) intensities. Corresponding FRET (blue) is overlaid with predicted state sequence (red, bottom). b, smFRET population histograms in the presence of competitive antagonist (LY341495) and a range of glutamate concentrations. Data represent mean ± s.e.m. of N=3 independent experiments. Total molecules examined for LY341495 and 0 μM, 2 μM, 5 μM, 10 μM and 1 mM glutamate conditions were 440, 250, 378, 879, 726 and 152, respectively. Histograms were fitted (red) to 4 Gaussian distributions (blue) centered around 0.31 (state 1), 0.51 (state 2), 0.71 (state 3) and 0.89 (state 4), denoted with dashed lines. c, Example single-molecule time trace of 548UAA in the presence of 1 mM glutamate showing donor (green) and acceptor (red) intensities. Corresponding FRET (blue) is overlaid with predicted state sequence (red, bottom). d, Glutamate dose-response curve of state 4 occupancy. State 4 occupancy is defined as area of Gaussian distribution centered at 0.89 as a fraction of total area. Data represent mean ± s.e.m. of N=3 independent experiments. Total molecules examined as in b (216 total molecules for 20 μM glutamate). e, smFRET population histogram of the cross-linked constitutively active 548UAA (L521C; 176 total molecules) construct in the absence of glutamate. Data represent mean ± s.e.m. of N=3 independent experiments. Four FRET states are denoted with dashed lines.
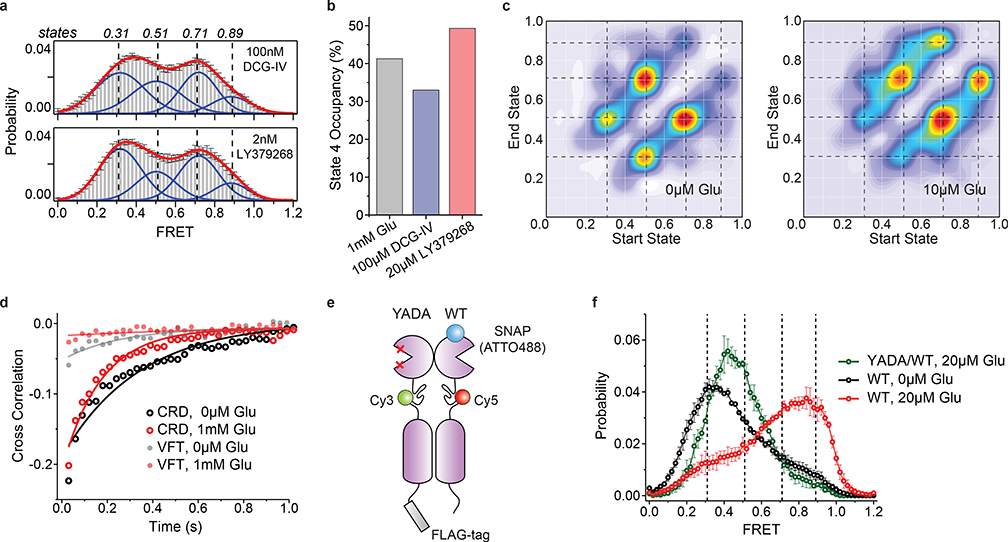
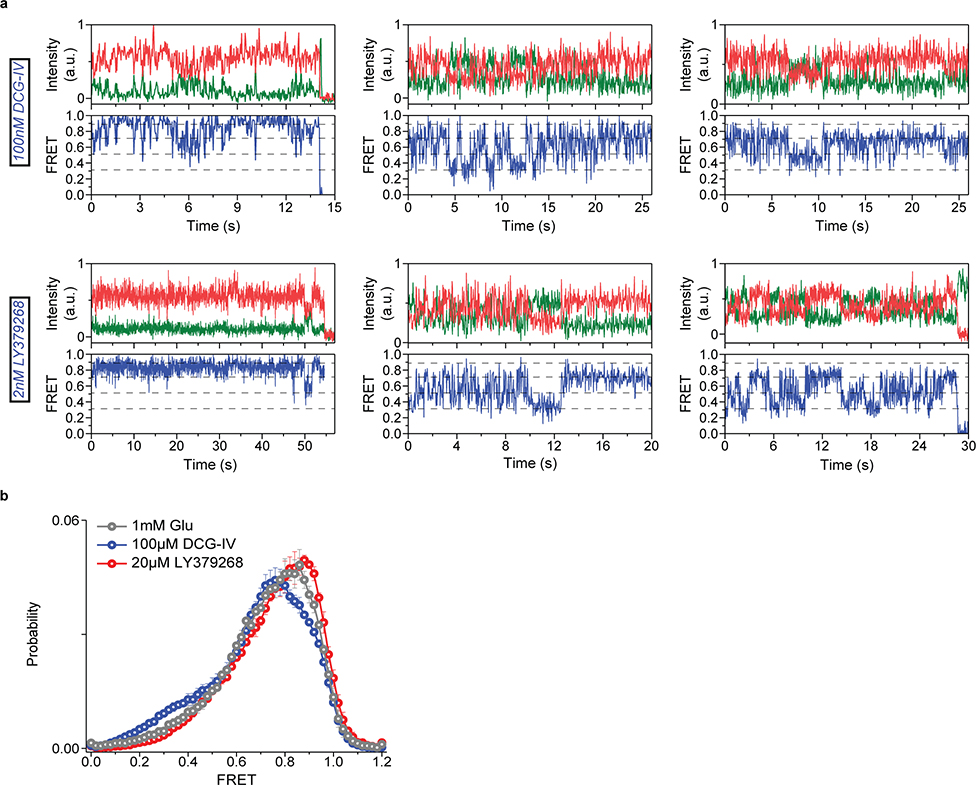
In the presence of other mGluR2 orthosteric agonists LY37 and DCG-IV, the CRD populated the same four FRET states (Fig. 3a and Extended Data Fig. 7a). Importantly, at saturating concentrations, LY37 showed 21% higher occupancy of the active state conformation than glutamate while DCG-IV showed 23% lower occupancy, consistent with their respective efficacy (Fig. 3b and Extended Data Fig. 7b). We further examined the nature and time-ordering of transitions using a four-state hidden Markov Model (HMM)30,31. The results of HMM analysis as a transition density plot (TDP) at different glutamate concentrations demonstrate three distinct sets of bidirectional transitions between the four FRET states (Fig. 3c). Importantly, this analysis showed that transitions are sequential, happening between adjacent FRET peaks (0.31 ↔ 0.51 ↔ 0.71 ↔ 0.89). Together, these findings confirm the existence of four CRD conformations in the presence or absence of orthosteric agonists and support a stepwise compaction of mGluR2 during activation, consistent with a conformational selection mechanism32.
Fig. 3: Activation of mGluR2 is a stepwise process.
a, smFRET population histogram of 548UAA sensor in the presence of intermediate concentrations of orthosteric agonists DCG-IV (top; 166 total molecules) and LY379268 (bottom; 220 total molecules). Data represent mean ± s.e.m. of N=3 independent experiments. Histograms are fitted (red) to 4 Gaussian distributions (blue) centered on 0.31 (state 1), 0.51 (state 2), 0.71 (state 3) and 0.89 (state 4), as denoted by dashed lines. b, State 4 (active state) occupancy at saturating concentrations of mGluR2 orthosteric agonists. State 4 occupancy is defined as area of Gaussian distribution centered at 0.89 as the fraction of total area. FRET peak fitting and area calculations were performed on average histograms. c, Transition density plots (TDPs) of 548UAA. Dashed lines represent 4 distinct FRET states. Transitions are from two independent measurements. d, Cross-correlation plots comparing the dynamics of the CRDs and VFT domains of mGluR2 at 0 and 1 mM glutamate. Data are from three independent measurements. Data was fitted to a single exponential decay function. e, Schematic of mGluR2 receptor constructs for the 548UAA YADA/WT heterodimer experiment. f, smFRET population histogram of 548UAA YADA/WT heterodimer in the presence of 20 μM glutamate (55 total molecules), compared to 548UAA WT (250 and 216 total molecules for 0 μM and 20uM glutamate). Data represent mean ± s.e.m. of N=3 independent experiments. Dashed lines represent 4 distinct FRET states. Heterodimer data was acquired at 100 ms time resolution.
Conformations of CRDs and VFT domains are loosely coupled
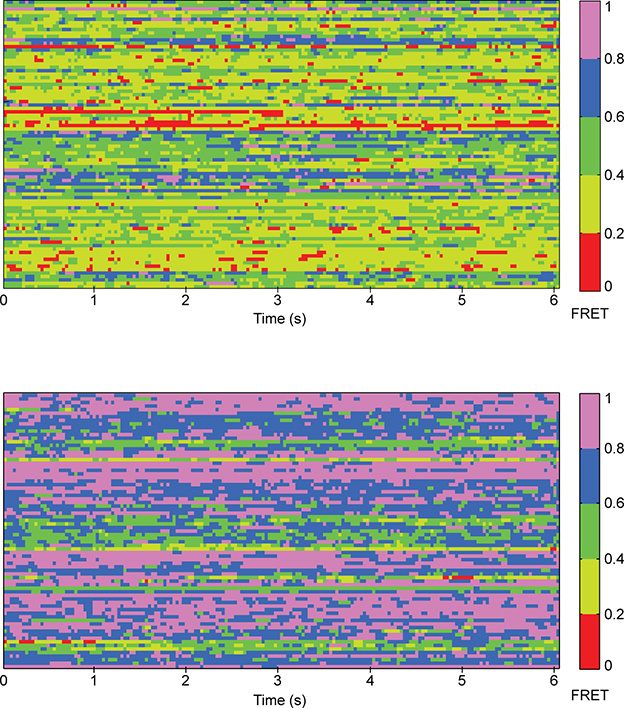
Our observation that in the presence of saturating full agonist (1 mM glutamate) or absence of ligand the CRD is dynamic (Fig. 2a, 2c and Extended Data Fig. 8), is in stark contrast with the behavior of the VFT domains of mGluR2 which adopt a distinct stable conformation in these conditions10 (Extended Data Fig. 3c). Quantification of receptor dynamics using the cross-correlation of donor and acceptor signals also showed similar contrast between the dynamic behavior of the two adjacent domains (Fig. 3d). Consistent with the reduction of VFT domains’ dynamics in zero or saturating glutamate (1 mM), the amplitude of anti-correlation between donor and acceptor fluorophores for the VFT domain sensor (Extended Data Fig. 3c) vanished (Fig. 3d). However, the CRD sensor showed strong amplitude in both these conditions (Fig. 3d). Together, these results indicate that the conformation of the VFT domains and CRD are allosterically loosely coupled. Such loose coupling was previously observed in molecular dynamics (MD) simulations and nuclear magnetic resonance (NMR) experiments of beta2-adrenergic receptor (β2AR)33,34. Our findings extend this notion to the multi-domain class C GPCRs suggesting that loose allosteric coupling might be a more general feature of GPCRs and allosteric receptors as a whole, and is consistent with observations of distinct inter and intradomain rearrangement timescales in mGluR135. Finally, the loose allosteric coupling that we uncovered here suggests that the CRD conformation, and not VFT domain conformation, is the more accurate metric to report the activation of mGluRs and perhaps class C GPCRs.
State 2 results from the closure of a single VFT domain
We further examined the correlation between the VFT domain lobe closure and the CRD conformation by performing smFRET experiments on receptors with a single glutamate-binding defective monomer36 (548UAA-YADA with Y216A and D295A mutations). This was achieved by co-expressing the C-terminal FLAG tagged 548UAA-YADA construct and a N-terminal SNAP tagged 548UAA construct (Fig. 3e). Following the expression, the cell surface population was labeled with BG-ATTO488 (SNAP-tag substrate) as well as Cy3 and Cy5 as before (supplementary materials and methods). Particles that were pulled down with the anti-FLAG antibody and showed the ATTO488 signal plus FRET donor and acceptor signals were analyzed. smFRET analysis showed that at 20 μM glutamate the CRD of the YADA/WT heterodimer predominantly occupies state 2 (Fig. 3f and Extended Data Fig. 9) with brief visits to higher FRET states, supporting the assignment of state 2 to a configuration in which one VFT domain is “closed” and the other is “open”(co) with the VFT domain interface in the “relaxed” (R) form and the receptor in the inactive state (R/co).
State 3 represents a pre-active receptor conformation
To investigate the identity of state 3 in mGluR2 activation we quantified the occupancy of all 4 states as a function of increasing glutamate (Fig. 4a). While the occupancy of the active state 4 continuously increased with increasing glutamate concentration, state 3 occupancy initially increased and then plateaued around the EC50 concentration of glutamate. This observation and the fact that in saturating agonist the VFT domains are locked in a single active (Acc) conformation (Extended Data Fig. 3c), while the CRDs dynamically transition mostly between states 3 and 4 (Fig. 2b–c and Extended Data Fig. 8), suggest that state 3 represents a pre-active conformation of the receptor. In this conformation the VFT domains are in the active arrangement (A/cc)10, yet the receptor is inactive. Existence of such pre-active state could be the consequence of a rate limiting step during the activation process such as intrasubunit conformational changes that contribute to formation of the active receptor. This interpretation is consistent with recent experiments which showed that activation of mGluR1 involves a fast and a slow time constant 35. Finally, cross linking and structural studies have shown that in the active state of mGluRs, the 7TM domains interact along the TM6 helix37. Thus, it is likely that the pre-active state 3 is a conformation in which the 7TM domains are brought into close proximity through the VFT domain closure (Acc conformation of the VFT domains) yet have not adopted the signaling competent configuration of the 7TM domain. Consistent with this interpretation, the active state 4 is transient (Fig. 2c and Extended Data Fig. 4).
Fig. 4: Conformational state 3 is a pre-active conformation of mGluR2.
a, Occupancy of the 4 conformational states of the CRD in the presence of increasing glutamate concentrations. Values represent area under each FRET peak from smFRET population histograms, centered at 0.31 (state 1), 0.51 (state 2), 0.71 (state 3) and 0.89 (state 4) and as the fraction of total area. b, The PAM mutation (C770A, red spheres) on the structure of mGluR5 (PDB accession 6N61). TM6 is colored in pink. c, Dose-response curves from live-cell FRET glutamate titration experiments for the 548UAA WT and C770A PAM receptor. Each curve is normalized to the 1 mM glutamate response. Data represent mean ± s.e.m. of N=26 and 13 cells expressing 548UAA WT or C770A PAM receptors, respectively, examined over 3 independent experiments. d, smFRET population histograms of 548UAA WT receptors (grey) at 5 μM (879 total molecules) and 10 μM glutamate (726 total molecules) and C770A PAM receptors (red) at 5 μM (689 total molecules) and 10 μM glutamate (370 total molecules). Data represent mean ± s.e.m. of N=3 independent experiments. Dashed lines represent the 4 FRET states. Bar graphs represent area of FRET states 3 (FRET=0.71) and state 4 (FRET=0.89) as the fraction of total area for WT and PAM mutant receptor. e, Dwell-times of states 3 and 4 for the WT receptor at 5 μM (147 total molecules) and 10 μM glutamate (140 total molecules) and PAM mutant receptor at 5 μM (128 total molecules) and 10 μM glutamate (142 total molecules). Average dwell-time was calculated by fitting a single exponential decay function to dwell-time histograms for each condition. Dwell-times represent mean ± s.e.m. of N=3 independent experiments at 100 ms. FRET peak fitting and area calculations were performed on averaged histograms.
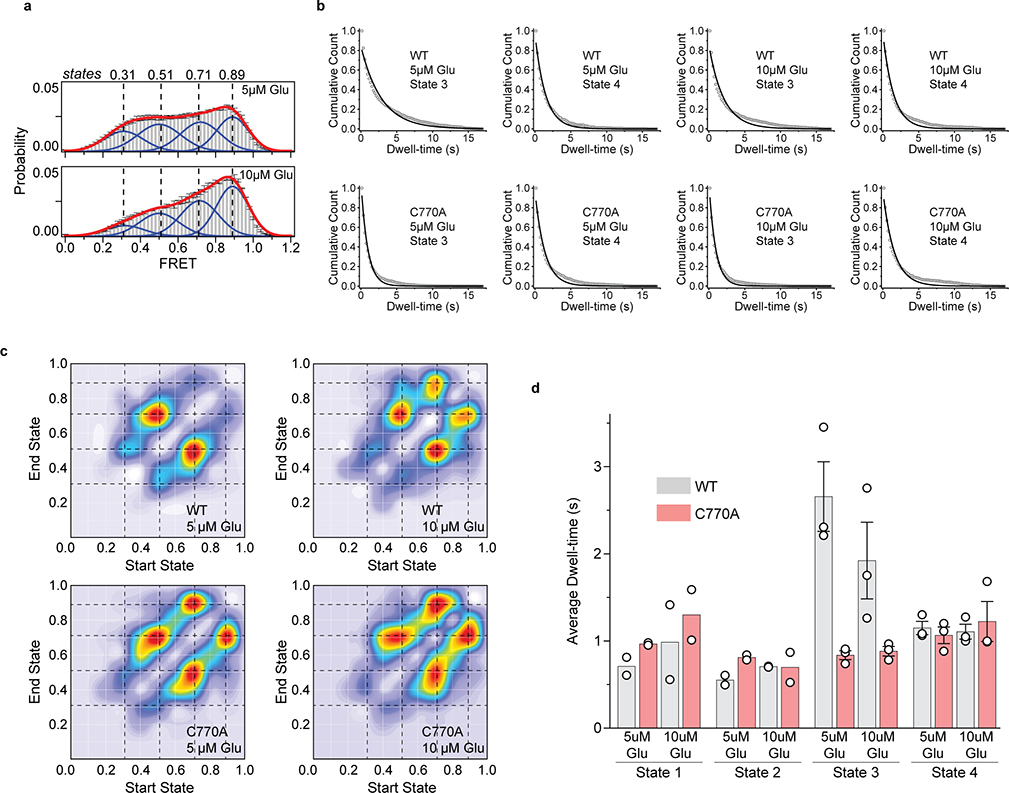
To investigate the significance of the pre-active state 3 for receptor signaling, we studied the conformational dynamics of mGluR2 containing mutation C770A (Fig. 4b). This mutation is shown to enhance mGluR signaling in a manner similar to a positive allosteric modulator (PAM)20,38. Live-cell ensemble experiments for 548UAA with this PAM mutation showed increased mGluR2 sensitivity to glutamate (EC50 = 4.9 ± 0.8 μM compared to 11.8 ± 0.5 μM for the WT receptor) suggesting that the PAM effect of this mutation in the TMD is allosterically detectable at the CRD (Fig. 4c). We next performed smFRET analysis of this construct and observed the same 4 states as the wildtype receptor (Extended Data Fig. 10a). However, at each glutamate concentration tested, the occupancy of the active state (state 4) was increased for the mutant compared to the wildtype receptor (Fig. 4d), consistent with the expected response from a PAM and further confirming that the immobilized receptors retain functional properties of the TMD. To test whether this effect is due to increased lifetime of the active state or increased visits to the active state, we performed dwell-time analysis of states 3 and 4 with the PAM construct. Remarkably, while the lifetime of active state 4 was similar between WT and the PAM mutant, the lifetime of state 3 was reduced about 3-fold for the PAM mutant (Fig. 4e and Extended Data Fig. 10b). TDP analysis revealed that there were more transitions from state 3 to state 4 for the PAM mutant compared to the WT (Extended Data Fig. 10c). Considering that only state 3 exhibits a substantially altered lifetime for the PAM mutant while the lifetimes of other states remain mostly unchanged (Extended Data Fig. 10d) and the fact that the major FRET histogram population change is the shift from state 3 to state 4 occupancy, our results show that the C770A PAM mutation confers its modulatory effect allosterically by increasing transitions from the pre-active state 3 to the active state 4. Therefore, the stability of the pre-active state 3 is a critical tuner for setting the receptor activation threshold.
Discussion
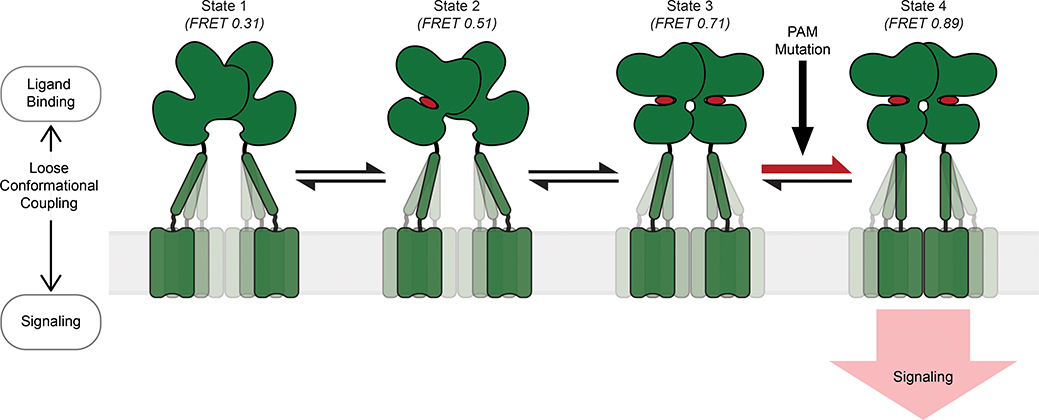
GPCRs are evolved to transduce signals across the membrane through energetically passive allosteric mechanisms that involve communication between spatially separated and conformationally linked domains of the receptor3. For many multi-domain GPCRs the mechanism of such conformational coupling and the dynamic interaction of the receptor domains during the allosteric process of activation are generally unknown. In this study, we successfully applied a novel smFRET and live-cell ensemble FRET approach to visualize the temporal sequence of conformational changes of the cysteine-rich domain in mGluR2. The CRD is a unique semi-rigid structural domain, conserved among class C GPCRs (except GABAB receptors) that relay the conformational information of the ligand binding domain to the 7TM domains. The CRD of mGluRs has a compact structural fold with nine conserved cysteines. Therefore, conventional site-specific labeling approaches such as cycteine labeling13 or insertion of genetic tags10 are not applicable. We adopted an unanatural amino acid labeling approach24 combined with the single-molecule pulldown29 to overcome this key limitation. Using this approach we found that the CRD in mGluR2 is in equilibrium between four conformations. An agonist “loosely” controls the conformation of the ectodomains of the receptor that in turn results in redistribution of the conformational ensemble and the compaction of the receptor in a stepwise manner (Fig. 5). We observed the same 4-state model for mGluR3, suggesting that this model could be general for all mGluRs (Extended Data Fig. 5). A recent cryo-electron microscopy study identified four conformations of the GABAB receptor39, further suggesting that this four-state model could be the general activation model for all class C GPCRs. More broadly, other bi-lobed, clamshell LBD-containing proteins, such as the ionotropic neurotransmitter receptors (NMDA, AMPA), may have evolved to utilize a similar activation mechanism.
Fig. 5: Schematic of the stepwise activation model for mGluR2.
Four-state stepwise model for the mechanism of allosteric activation of mGluRs with receptors shown in green and ligand in red. Darker shading of CRDs and TMDs represent greater occupancy of a given conformation. State 1 (FRET=0.31) represents the most common CRD conformation of an unliganded receptor, where the CRDs are farthest apart. State 2 (FRET=0.51) represents the CRD conformation resulting from ligand binding to a single VFT domain. State 3 (FRET=0.71) represents the CRD conformation resulting from ligand binding to both VFT domains and prior to the formation of a stabilizing TMD interaction. State 4 (FRET=0.89) represents the CRD conformation resulting from ligand binding to both VFT domains and a stabilizing TMD interaction. State 4 is the active conformation of the receptor. PAM mutations can function by increasing transitions from state 3 to 4.
Our model (Fig. 5) has several implications for the activation and modulation of mGluRs. First, we demonstrated that the activation proceeds through a conformational state where the LBD of only one subunit is active (state 2). Stalling the receptor in this state, which we achieved by mutations in the LBD of one subunit within the dimer, significantly hinders the progression of conformational changes of the receptor towards activation. Second, signaling of GPCRs in general and mGluRs specifically can be modulated by endogenous or exogenous allosteric modulators (such as lipids or PAMs and NAMs)3,40. While synthetic allosteric modulators are attractive therapeutic approaches, due to their superior specificity and tunability40, their mechanism of action in class C GPCRs is unknown. Our analysis revealed that the PAM mutation, C770A, confers positive allosteric modulation by decreasing the lifetime of the novel state 3 and by increasing transitions from state 3 to the active state 4, resulting in a greater overall occupancy of the active state (Fig. 4d–e and Extended Data Fig. 10bd). Due to the stepwise compaction required for mGluR activation, several energetic barriers must be overcome to achieve receptor signaling. While each of these transitions may be modulable, we show that the C770A mutation specifically functions to reduce the barrier between states 3 and 4. Furthermore, the location of this mutation in TM6, the active TMD interface17,37, supports the possibility that a stabilizing TMD interaction is necessary for the active receptor conformation (state 4). Together, the novel intermediate states act as critical conformational checkpoints for regulating mGluR activation and signaling. These insights have the potential to accelerate development of drugs and modulators for mGluRs.
Third, we found that the active conformation of the receptor at the CRD is transient and dynamic, even in the presence of saturating full agonist (Fig. 2c, 3d and Extended Data Fig. 4b). This is in contrast to the behavior of the ligand-binding domain of the receptor which is very stable in saturating agonist10 (Fig. 3d and Extended Data Fig. 3c). This could explain why while there are several active structures of the extracellular domain of class C GPCRs available17,18,27, obtaining the active structure of the TMD in intact mGluRs has been challenging17. Finally, our results collectively suggest that mGluRs adopt a single active conformation, the stability of which is determined not only by ligand binding and closure of the VFT domains, but also by the propensity of the TMDs to interact within the dimer.
GPCR dimerization and oligomerization in vivo and in a ligand-dependent manner has been a subject of extensive research41,42 and formation of GPCR dimers is shown to be transient and depends on agonist binding43–45. Our model raises the interesting possibility that class C GPCRs are evolved to use this intrinsic property to control their activation. In this framework, agonist binding effectively brings the 7TMs into close proximity to facilitate their interaction and promote formation of the signaling active configuration of the G protein binding interface. This mechanism is in essence similar to many receptor tyrosine kinases (RTKs)46, where ligand binding effectively controls the proximity of signaling or enzymatic domains and may be the design principle underlying many biological allosteric switches.
Online Methods
Molecular cloning
The C-terminal FLAG-tagged mouse mGluR2 and mGluR3 constructs in pcDNA3.1(+) expression vector were purchased from GenScript (ORF clone: OMu19627D and OMu17682D) and verified by sequencing (ACGT Inc). The mutation of amino acid A548 in mGluR2 and A557 in mGluR3 to an amber codon (TAG) was performed using the QuikChange site-directed mutagenesis kit (Qiagen). The same approach was used to introduce point mutations in mGluR2 (Y216A, D295A, C770A, and L521C) for other experiments. For the YADA/WT mGluR2 (548UAA) heterodimer experiment, a SNAP-tag (pSNAPf, NEB) was inserted at position 19, flanked by GGS linkers, using HiFi DNA Assembly Master Mix (NEB). Finally, site directed mutagenesis was done to remove the C-terminal FLAG-tag on this construct. All plasmids were sequence verified (ACGT Inc). DNA restriction enzymes, DNA polymerase and DNA ligase were from New England Biolabs. Plasmid preparation kits were purchased from Macherey-Nagel.
Cell culture conditions
HEK293T cells were purchased from Sigma and were maintained in DMEM (Corning) supplemented with 10% (v/v) fetal bovine serum (GE Healthcare), 100 unit/mL penicillin-streptomycin (Gibco) and 15 mM HEPES (pH=7.4, Gibco) at 37 °C under 5% CO2. The cells were passaged with 0.05% trypsin-EDTA (Gibco). For unnatural amino acid-containing protein expression, the growth media was supplemented with 0.6 mM 4-azido-l-phenylalanine (Chem-Impex International). All media was filtered by 0.2 μM PES filters (Fisher Scientific).
Transfection and protein expression
24 hours before transfection, HEK293T cells were cultured in 10 cm cell culture dishes (Corning) or polylysine-coated 18 mm glass coverslips (VWR). One hour before transfection, media was changed to growth media supplemented with 0.6 mM 4-azido-l-phenylalanine. mGluR plasmids as described above and pIRE4-Azi plasmid (pIRE4-Azi was a gift from Irene Coin, Addgene plasmid # 105829) were co-transfected (1:1 w/w) into cells using Transporter 5 (Polysciences) or Lipofectamine 3000 (Invitrogen) (total plasmid: 1.5 μg/18 mm coverslip). For YADA/WT heterodimer experiments, SNAP-548UAA(WT), pIRE4-Azi and 548UAA-YADA were co-transfected (1:1:1 w/w/w) using Transporter 5 (Polysciences) (total plasmid: 2 μg/18 mm coverslip). The growth media containing 0.6 mM 4-azido- l-phenylalanine was refreshed after 24 hours and the cells were grown for another 24 hours (total 48 hours expression). On the day of the experiment, 10 minutes before labeling, supplemented growth media was removed and cells were washed twice by extracellular buffer solution containing (in mM): 128 NaCl, 2 KCl, 2.5 CaCl2, 1.2 MgCl2, 10 sucrose, 10 HEPES, pH=7.4 and were kept in growth medium without 4-azido-l-phenylalanine. Before the addition of labeling solution (below), cells were washed once with extracellular buffer solution.
SNAP-tag labeling in live cells
SNAP labeling of the N-terminus VFT domain (Extended Data Fig. 3c) was done by incubating the cells with 4 μM of benzylguanine Alexa-647 (NEB) and 4 μM of benzylguanine DY-549P1 (NEB) in extracellular buffer for 30 minutes at 37 °C. SNAP labeling for the WT/YADA heterodimer experiments (Fig. 3e–f and Extended Data Fig. 9) was done at 37 °C with 4 μM of SNAP-Surface ATTO488 (NEB) in extracellular buffer for 30 minutes. After labeling, coverslip was gently washed twice in extracellular buffer to remove excess dye.
Unnatural amino acid labeling in live cells by azide-alkyne click chemistry
A modified version of previously reported protocols24,47 was used to fluorescently label the incorporated 4-azido-l-phenylalanine in live cells. Stock solutions were made as follows: Cy3 and Cy5 alkyne dyes (Click Chemistry Tools) 10 mM in DMSO, BTTES (Click Chemistry Tools) 50 mM, copper sulfate (Millipore Sigma) 20 mM, aminoguanidine (Cayman Chemical) 100 mM, and (+)-sodium l-ascorbate (Millipore Sigma) 100 mM in ultrapure distilled water (Invitrogen). In 656 μL of extracellular buffer solution, Cy3 and Cy5 alkyne dyes were mixed to a final concentration of 18 μM of each dye. To this mixture, a fresh pre-mixed solution of copper sulfate and BTTES (1:5 molar ratio) was added at the final concentration of 150 μM and 750 μM, respectively. Next, aminoguanidine was added to the final concentration of 1.25 mM and (+)-sodium l-ascorbate was added to the mixture to a final concentration of 2.5 mM. Total labeling volume was 0.7 mL. The labeling mixture was kept at 4 °C for 8 minutes followed by 2 minutes at room temperature before addition to cells. Cells were washed prior to addition of labeling mixture. During labeling, cells were kept in the dark at 37 °C and 5% CO2. After 10 minutes, l-glutamate (Sigma) was added to the cells to a final concentration of 0.5 mM and cells were incubated for an additional 5 minutes. After labelling, cells were washed twice by extracellular buffer. For the gel electrophoresis experiment, only Cy5 alkyne dye was used with the final concentration of 35 μM.
Gel electrophoresis
After labelling, cells from three 10 cm dishes were washed by extracellular buffer and detached from the plates by incubating with Ca2+-free DPBS (Thermo Scientific) buffer followed by a gentle pipetting. Cells were then pelleted by a 4,000 g centrifugation at 4 °C for 10 minutes. The pellet was lysed in 1.5 mL lysis buffer (pH=7.2) consisting of 200 mM NaCl, 50 mM HEPES, 1 mM EDTA, protease inhibitor tablet (Thermo Fisher Scientific) and 1% DDM-CHS (10:1, Anatrace). After 1 hour of gentle mixing at 4 °C, cells were centrifuged at 20,000 g at 4°C for 20 minutes and the supernatant was collected and concentrated to 150 μL by 100kDa centrifugal filters (Millipore) at 4 °C. 10 μL of this solution was mixed with 10 μL of 50% glycerol and loaded into a precast 4–20 % gradient non-reducing polyacrylamide gel (Biorad) and ran at 100 V for 45 minutes. 2 μL of precision plus protein standard (Biorad) was used as a ladder. The gel was washed two times in ultrapure water and the image was captured using a Typhoon 9400 fluorimager (GE Healthcare) with 633 nm excitation wavelength and 670-BP30 emission filter.
Confocal microscopy
Live-cell images were acquired using an inverted confocal microscope (Zeiss, LSM-800) with a 40X oil-immersion objective, equipped with 561 and 640 nm lasers, with 2 GaAsP-PMT detectors with detection wavelengths of 540–617 nm and 645–700 nm for Cy3 and Cy5 channels respectively.
Live-cell FRET measurements
After labeling, coverslip was assembled in a flow chamber (Innova Plex) and attached to a gravity flow control system (ALA Scientific Instruments) to control buffer application during experiments. Buffers were applied at the rate of 5 mL/min. Labeled cells were imaged on a home-built total internal reflection fluorescence (TIRF) microscope equipped with a 20X objective (Olympus, oil-immersion) in the oblique illumination mode and using an excitation filter set with a quad-edge dichroic mirror (Di03-R405/488/532/635, Semrock) and a long-pass filter (ET542lp, Chroma).
Cy3 (donor) was excited with a 532 nm laser (RPMC Lasers) and emissions from Cy3 and Cy5 fluorophores were simultaneously recorded with an electron multiplying charge-coupled device (EMCCD, iXon Ultra, Andor). All data was recorded at 4500 ms time resolution. In the emission path a quad-notch filter (NF01–405/488/532/635, Semrock) was used to block lasers and a dichroic beamsplitter (FF640-FDi01, Semrock) was used to split the emission into donor and acceptor signals.
Movies were analyzed in Fiji48 by manually drawing an ROI around the membrane of each analyzed cell. Built-in Fiji functions were used to calculate the mean grey intensity within the ROIs in both donor and acceptor channels and over all the frames. Donor and acceptor intensities were corrected for background which was measured from a region in the same field of view and without cells. The acceptor intensity was corrected for bleed-through of the Cy3 donor signal into the Cy5 acceptor channel which we measured to be 8.8% of Cy3 intensity in our setup. Apparent FRET efficiency was calculated as FRET= (IA − 0.088× ID) / (ID + IA), where ID and IA are the background-corrected donor and acceptor intensities. Cells and ROIs were inspected for lack of substantial drift, lateral movement, and the presence of anti-correlated behavior of donor and acceptor signals.
During the titration experiments the wash buffer or buffers containing the specified ligand were continuously applied long enough for the FRET curve to stabilize and plateau. To calculate the FRET change (ΔFRET) for each ligand application, the average of FRET efficiency for 6 datapoints before the application of ligand was calculated and assigned as FRET_before. The average FRET efficiency for 6 datapoints after the application of ligand and after the FRET curve has plateaued was calculated and assigned as FRET_after. FRET change (ΔFRET) was calculated as ΔFRET= FRET_after -FRET_before. Dose response equation was used for fitting ΔFRET data to calculate EC50.
DCG-IV and Ro64–5229 were purchased from Tocris. LY379268 was purchased from Cayman Chemical. All curve fittings were done in Origin Pro (OriginLab).
Structural analysis
Distances were measured in Chimera49. Based on the spectral overlap of Cy3 alkyne and Cy5 alkyne, a Förster radius (R0) of 55 Å was used to convert raw FRET efficiency (F) to an approximate distance using FRET=1/(1+(R/ R0)6). Figure 1a was created using Illustrate50.
Single-molecule FRET measurements
Single-molecule FRET experiments were done in flow cells that were prepared using glass coverslips (VWR) and slides (Thermo Fisher Scientific) passivated with mPEG (Laysan Bio) and 1% (w/w) biotin-PEG to prevent unspecific protein adsorption, as previously described10,51. Prior to experiments, flow cells were first incubated with 500 nM NeutrAvidin (Thermo Fisher Scientific) for 2 minutes followed by 20 μM biotinylated FLAG antibody (A01429, GenScript) for 30 minutes. Unbound NeutrAvidin and biotinylated FLAG antibody were removed by washing. Washes and protein dilutions were done with T50 buffer (50 mM NaCl, 10 mM Tris, pH 7.4).
After labeling, cells were recovered from a single 10 cm plate by incubating with Ca2+-free DPBS followed by a gentle pipetting. Cells were then pelleted by a 4000 g centrifugation at 4 °C for 10 minutes. The cell pellet was lysed in 350 μL lysis buffer consisting of 200 mM NaCl, 50 mM HEPES, 1 mM EDTA, protease inhibitor tablet (Thermo Fisher Scientific) and 1% DDM-CHS (10:1, Anatrace), pH 7.2. After 1 hour of gentle mixing at 4 °C, lysate was centrifuged at 20,000 g for 20 min at 4 °C. The supernatant was collected and diluted (5 to 10-fold dilution depending on the concentration) and was then added to the flow chamber to achieve sparse surface immobilization of labeled receptors by their C-terminal FLAG-tag. Sample dilution and washes were done using a dilution buffer consisting of 200 mM NaCl, 50 mM HEPES and 0.1% DDM-CHS (10:1, Anatrace), pH 7.2. After optimal receptor coverage was achieved, flow chamber was washed extensively with dilution buffer to remove unbound proteins (> 20× chamber volume). Finally, labeled receptors were imaged in imaging buffer consisting of (in mM) 4 Trolox, 128 NaCl, 2 KCl, 2.5 CaCl2, 1.2 MgCl2, 40 HEPES, 0.05% DDM-CHS (10:1) and an oxygen scavenging system consisting of 4 protocatechuic acid (Sigma) and 1.6 U/mL bacterial protocatechuate 3,4-dioxygenase (rPCO) (Oriental Yeast Co.), pH 7.35. All reagents were prepared from ultrapure-grade chemicals (purity > 99.99%) and were purchased from Sigma. All buffers were made using ultrapure distilled water (Invitrogen).
Samples were imaged with a 100X objective (Olympus, 1.49 NA, Oil-immersion) on a total internal reflection fluorescence (TIRF) microscope, as described above, with 30 ms time resolution unless stated otherwise (Extended Data Fig. 3a). 532 nm and 638 nm lasers (RPMC Lasers) were used for donor and acceptor excitation, respectively. For the YADA/WT mGluR2 heterodimer experiments, a 488 nm laser was used to excite receptors labeled by SNAP (BG-ATTO488), prior to excitation with lasers 532 nm and 638 nm (Extended Data Fig. 9).
smFRET data analysis
Analysis of single molecule fluorescence data was performed using smCamera (http://ha.med.jhmi.edu/resources/), custom MATLAB (MathWorks) scripts and OriginPro (OriginLab). Particle selection and generation of raw FRET traces were done automatically within the smCamera software (Extended Data Fig. 3a). For the selection, particles that showed acceptor signal upon donor excitation, with acceptor brightness greater than 10% above background and had a Gaussian intensity profile, were automatically selected and donor and acceptor intensities were measured over all the frames. Out of this pool, particles that showed a single donor and a single acceptor bleaching step during the acquisition time, stable total intensity (ID + IA), anti-correlated donor and acceptor intensity behavior without blinking events and lasted for more than 4 seconds were manually selected for further analysis (~20–30% of total molecules per movie). All data was analyzed by three individuals independently and the results were compared and showed to be identical. In addition, a subset of data was blindly analyzed to ensure no bias in analysis. Apparent FRET efficiency was calculated as (IA − 0.088×ID) / (ID + IA), where ID and IA are raw donor and acceptor intensities, respectively. For the YADA/WT mGluR2 heterodimer experiments, identity of heterodimers was confirmed by observing a single photobleaching event upon 488 nm laser excitation. All experiments were repeated at least three times independently to ensure reproducibility of the results. Population smFRET histograms were generated by compiling at least 200 FRET traces from individual molecules unless otherwise stated. Before compiling traces, FRET histograms of individual molecules were normalized to 1 to ensure that each trace contributes equally, regardless of trace length. Error bars on histograms represent the standard error of at least six independent movies.
Peak fitting on population smFRET histograms was performed using OriginPro and using four Gaussian distributions as , where A is the peak area, xc is the FRET peak center and w is the peak width for each peak. Peak centers (xc) were constrained as mean FRET efficiency of a conformational state ± 0.02. The mean FRET efficiencies of the four conformations were determined based on the most frequent FRET states observed in transition density plots. This analysis is further described below. Peak widths were constrained as 0.1 ≤ w ≤ 0.24. Peak areas were constrained as A > 0. Probability of state occupancy was calculated as area of specified peaks relative to the total area which is defined as the sum of all four individual peak areas.
Raw donor, acceptor and FRET traces were idealized by fitting with a Hidden Markov Model using vbFRET software30,31. Transition density plots were then generated by extracting all the transitions where ΔFRET > 0.1, from the idealized traces. Occasional traces for which the HMM fit did not converge (for example due to long blinking events or large non anti-correlated intensity fluctuations) were omitted from downstream analysis.
The idealized FRET traces were also used to calculate the dwell times for each of the four states. 147, 140, 128 and 142 molecules from three independent measurements were used for dwell-time analysis of states 3 and 4 for UAA548 (5uM and 10uM glutamate) and mGluR2 C770A (5uM and 10uM glutamate), respectively. 86, 83, 91 and 72 molecules from two independent measurements were used for dwell-time analysis of states 1 and 2 for the same respective constructs and conditions. Reported values represent mean and error bars represent s.e.m. At least 350 transitions were analyzed for each condition. The dwell times were plotted as cumulative count histograms and were fit with a single-exponential decay function by OriginPro (OriginLab).
The cross-correlation (CC) of donor and acceptor intensity traces at time τ is defined as CC(τ) = δID(t)δIA(t + τ)/(<ID(t)> + <IA(t)>), where δID(t) = ID(t) − <ID(t)>, and δIA(t) = IA(t) -<IA(t)>. <ID(t)> and <ID(t)> are time average donor and acceptor intensities, respectively. Cross-correlation calculations were performed on the same traces used to generate the histograms. Cross-correlation data were fit to a single exponential function.
Code availability
The custom codes for data analysis are available from the corresponding author upon reasonable request.
Extended Data
Extended Data Fig. 1. Site-specific labeling of mGluR2 by click chemistry.
a, Schematic showing site-specific fluorescent labeling of mGluR2, with the unnatural amino acid 4-azido-l-phenylalanine at residue 548, by copper catalyzed azide-alkyne click reaction. b, Donor (green: Cy3) and acceptor (red: Cy5) fluorophores conjugated to the CRD of inactive mGluR5 at the position corresponding to residue 548 in mGluR2 (top). Representative confocal microscope image of HEK293T cells expressing 548UAA with the cell surface population labeled with donor (green: Cy3) and acceptor (red: Cy5) fluorophores through click chemistry (bottom). Scale bars, 10 μm. c, Unprocessed image of non-reducing 4–20% polyacrylamide gel electrophoresis of cell lysate from HEK293T cells expressing 548UAA and labeled by Cy5alkyne. The gel is imaged with 633 nm excitation wavelength and 670-BP30 emission filter. Lane A: protein ladder; lane B: cell lysate; lane C: Cy5-alkyne dye. Results are representative of an individual experiment. d, Image of HEK293T cells expressing 548UAA and labeled with donor (green: Cy3) and acceptor (red: Cy5) fluorophores through click chemistry during live-cell FRET experiments. Scale bars, 10 μm. Results are representative of all titration and max response experiments for the 548UAA construct (N=21 independent experiments).
Extended Data Fig. 2. Live-cell ensemble FRET response to orthosteric ligands and a negative allosteric modulator.
a, Representative donor and acceptor intensities and corresponding FRET signal from live-cell FRET titration experiments for DCG-IV, LY379268 and Glutamate +10 μM Ro64–5229 measured using HEK293T cells expressing 548UAA (top) and corresponding dose-response curves (bottom). Each titration curve is normalized to the 1 mM glutamate response. Data represent mean ± s.e.m. of N=20, 10 and 13 cells for LY379268, DCG-IV and glutamate +10 μM Ro64–5229, respectively, examined over 3 independent experiments. b, Donor and acceptor intensities and corresponding FRET signal in response to saturating concentrations of glutamate (1 mM), DCG-IV (100 μM) and LY37 (20 μM) in HEK293T cells expressing 548UAA.
Extended Data Fig. 3. Example single-molecule time traces of CRD and VFT domain sensors.
a, Schematic of the single-molecule experiments (top).Representative frame from a single-molecule movie with the donor channel (Cy3) on the left and acceptor channel Cy5) on the right (bottom). Molecules selected by analysis software for downstream processing are indicated by green circles. Scale bar, 3 μm. b, Example single-molecule time traces of the 548UAA in the absence of glutamate (0 μM) showing donor (green) and acceptor (red) intensities and corresponding FRET (blue). Dashed lines represent 4 distinct FRET states. c, Schematic of the VFT domain conformational sensor (left). Example single-molecule time traces of VFT domain sensor in the absence of glutamate and presence of saturating glutamate showing donor (green) and acceptor (red) intensities and corresponding FRET (blue) (bottom). smFRET population histogram of VFT domain mGluR2 sensor in the inactive (0 μM glutamate; 36 total molecules) and active (1 mM glutamate; 24 total molecules) conditions (top right). Data represent mean of N=2 independent experiments.
Extended Data Fig. 4. Example single-molecule time traces of CRD at different glutamate concentrations.
a, Example single-molecule time traces of the 548UAA at intermediate glutamate concentrations. b, Example single-molecule time traces of the 548UAA in saturating (1 mM) glutamate. Donor (green) and acceptor (red) intensities and corresponding FRET (blue) are shown. Dashed lines represent 4 distinct FRET states.
Extended Data Fig. 5. mGluR3 undergoes a 4-state activation process.
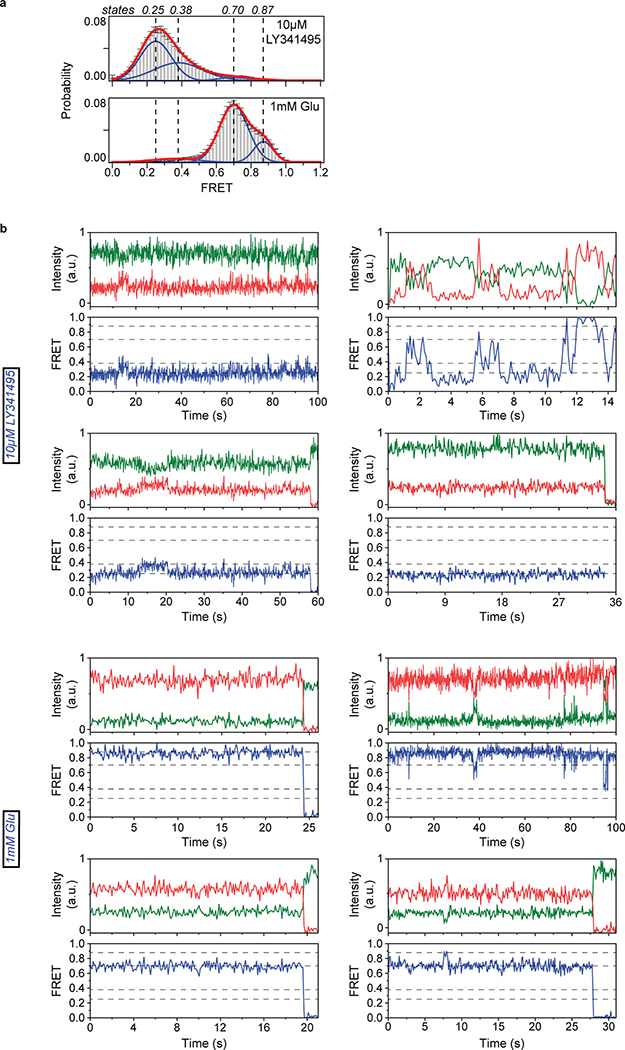
a, smFRET population histograms of mGluR3 CRD sensor (labeled at residue 557) in the presence of competitive antagonist (LY341495; 221 total molecules) or saturating glutamate (290 total molecules). Data represent mean ± s.e.m. of N=3 independent experiments. Histograms are fitted (red) to 4 Gaussian distributions (blue) centered around 0.25 (state 1), 0.38 (state 2), 0.7 (state 3) and 0.87 (state 4), denoted with dashed lines. b, Example single-molecule time traces of mGluR3 CRD sensor in the presence of antagonist (LY341495) or saturating glutamate showing donor (green) and acceptor (red) intensities and corresponding FRET (blue). Dashed lines represent 4 distinct FRET states. Data was acquired at 100 ms time resolution.
Extended Data Fig. 6. Effect of intersubunit crosslinking on the CRD conformation.
Representative live-cell FRET measurement using HEK293T cells expressing 548UAA with the crosslinking mutation L521C upon application of intermediate and saturating glutamate. FRET signal is normalized using initial FRET at time = 0.
Extended Data Fig. 7. smFRET analysis of CRD in the presence of orthosteric agonists.
a, Example single-molecule time traces of 548UAA at intermediate concentrations of DCG-IV (100 nM, top) and LY379268 (2 nM, bottom) showing donor (green) and acceptor (red) intensities and corresponding FRET (blue). Dashed lines represent 4 distinct FRET states. b, smFRET population histograms for 548UAA in the presence of saturating glutamate (1 mM; 152 total molecules), DCG-IV (100 μM; 470 total molecules) and LY379268 (20 μM; 356 total molecules). Data represent mean ± s.e.m. of N=3 independent experiments.
Extended Data Fig. 8. CRDs of mGluR2 are dynamic.
Heatmap illustrating the FRET values sampled by individual 548UAA receptors in the inactive (0 μM glutamate, top) and fully active (1 mM glutamate, bottom) conditions. Each row is the smFRET time trace of a single molecule over 6 seconds. The smFRET traces were smoothed using a 3-point moving average filter. 100 independent molecules are shown for each condition.
Extended Data Fig. 9. Analysis of conformational state 2 and state 4.
Example single-molecule time traces of 548UAA YADA/WT heterodimers at 20 μM glutamate. ATTO488 (light blue), donor (green) and acceptor (red) intensities and the corresponding FRET (blue) are shown. Dashed lines represent 4 distinct FRET states. Data was acquired at 100 ms time resolution.
Extended Data Fig. 10. Characterization of the mGluR2 PAM mutant conformational dynamics.
a, smFRET population histograms of 548UAA PAM mutant (C770A) in the presence of 5 μM (689 total molecules) or 10 μM (370 total molecules) glutamate. Histograms are fitted (red) to 4 Gaussian distributions (blue) centered around 0.31 (state 1), 0.51 (state 2), 0.71 (state 3) and 0.89 (state 4), denoted with dashed lines. Data represent mean ± s.e.m. of N=3 independent experiments. b, Normalized histograms of state 3 (preactive) and state 4 (active) dwell-times (cumulative count) in the presence of 5 or 10 μM glutamate for 548UAA and 548UAA PAM mutant (C770A). Data is fit to a single exponential decay function. Dwell-times are from > 80 total molecules per condition from two independent experiments. c, Transition density plots (TDPs) of 548UAA and 548UAA PAM mutant (C770A) at 5 or 10 μM glutamate. Dashed lines represent 4 distinct FRET states. Transitions are compiled from two independent experiments. d, Dwell-tximes of states 1–4 for 548UAA and 548UAA PAM mutant (C770A) in the presence of 5 or 10 μM glutamate. Average dwell-time was calculated by fitting a single exponential decay function to dwell-time histograms for each condition. Dwell-times of states 1 and 2 represent the mean of N=2 independent experiments with 86, 83, 91 and 72 total molecules examined for WT (5 μM), WT (10 μM), C770A (5 μM) and C770A (10 μM), respectively. Dwell-times of states 3 and 4 represent the mean ± s.e.m. of N=3 independent experiments with 147, 140, 128 and 142 total molecules examined for WT (5 μM), WT (10 μM), C770A (5 μM) and C770A (10 μM), respectively. Transition and dwell-time analysis were performed on 100 ms data.
Supplementary Material
Acknowledgements
We thank M.R. Schamber, D. Badong, D. May and A. Y. Pen for technical assistance, M. Gallio, J. Marko, A. Mondragon and K. Ragunathan for critical reading of the manuscript, and J. Fei (University of Chicago) for providing MATLAB scripts. Funding: This work was supported by the National Institutes of Health grant R01GM140272 (to R.V.) and by The Searle Leadership Fund for the Life Sciences at Northwestern University and by the Chicago Biomedical Consortium with support from the Searle Funds at The Chicago Community Trust (to R.V.). B.W.L. was supported by National Institute of General Medical Sciences (NIGMS) Training Grant T32GM-008061. This work used resources of the Keck Biophysics Facility supported in part by the NCI CCSG P30 CA060553 grant awarded to the Robert H. Lurie Comprehensive Cancer Center of Northwestern University.
Footnotes
Competing interests: The authors declare no competing interests.
Data availability
The materials and data reported in this study are available from the corresponding author upon reasonable request. The PDB accession code for the inactive and active structures of human mGluR5 are 6N52 and 6N51. Source data are provided with this paper.
References
- 1.Smock RG & Gierasch LM Sending signals dynamically. Science 324, 198–203 (2009). [DOI] [PMC free article] [PubMed] [Google Scholar]
- 2.Changeux JP & Christopoulos A Allosteric Modulation as a Unifying Mechanism for Receptor Function and Regulation. Cell 166, 1084–1102 (2016). [DOI] [PubMed] [Google Scholar]
- 3.Thal DM, Glukhova A, Sexton PM & Christopoulos A Structural insights into G-protein-coupled receptor allostery. Nature 559, 45–53 (2018). [DOI] [PubMed] [Google Scholar]
- 4.Dorsam RT & Gutkind JS G-protein-coupled receptors and cancer. Nat. Rev. Cancer 7, 79–94, (2007). [DOI] [PubMed] [Google Scholar]
- 5.Zarzycka B, Zaidi SA, Roth BL & Katritch V Harnessing Ion-Binding Sites for GPCR Pharmacology. Pharmacol. Rev 71, 571–595, (2019). [DOI] [PMC free article] [PubMed] [Google Scholar]
- 6.Hilger D, Masureel M & Kobilka BK Structure and dynamics of GPCR signaling complexes. Nat. Struct. Mol. Biol 25, 4–12, (2018). [DOI] [PMC free article] [PubMed] [Google Scholar]
- 7.Latorraca NR, Venkatakrishnan AJ & Dror RO GPCR Dynamics: Structures in Motion. Chem. Rev 117, 139–155 (2017). [DOI] [PubMed] [Google Scholar]
- 8.Ye L, Van Eps N, Zimmer M, Ernst OP & Prosser RS Activation of the A2A adenosine G-protein-coupled receptor by conformational selection. Nature 533, 265–268 (2016). [DOI] [PubMed] [Google Scholar]
- 9.Nygaard R et al. The dynamic process of beta(2)-adrenergic receptor activation. Cell 152, 532–542 (2013). [DOI] [PMC free article] [PubMed] [Google Scholar]
- 10.Vafabakhsh R, Levitz J & Isacoff EY Conformational dynamics of a class C G-protein-coupled receptor. Nature 524, 497–501 (2015). [DOI] [PMC free article] [PubMed] [Google Scholar]
- 11.Wingler LM et al. Angiotensin Analogs with Divergent Bias Stabilize Distinct Receptor Conformations. Cell 176, 468–478 (2019). [DOI] [PMC free article] [PubMed] [Google Scholar]
- 12.Gusach A et al. Beyond structure: emerging approaches to study GPCR dynamics. Curr. Opin. Struct. Biol 63, 18–25 (2020). [DOI] [PubMed] [Google Scholar]
- 13.Gregorio GG et al. Single-molecule analysis of ligand efficacy in beta2AR-G-protein activation. Nature 547, 68–73 (2017). [DOI] [PMC free article] [PubMed] [Google Scholar]
- 14.Suomivuori CM et al. Molecular mechanism of biased signaling in a prototypical G protein-coupled receptor. Science 367, 881–887 (2020). [DOI] [PMC free article] [PubMed] [Google Scholar]
- 15.Niswender CM & Conn PJ Metabotropic glutamate receptors: physiology, pharmacology, and disease. Annu. Rev. Pharmacol. Toxicol. 50, 295–322 (2010). [DOI] [PMC free article] [PubMed] [Google Scholar]
- 16.Pin JP & Bettler B Organization and functions of mGlu and GABA(B) receptor complexes. Nature 540, 60–68 (2016). [DOI] [PubMed] [Google Scholar]
- 17.Koehl A et al. Structural insights into the activation of metabotropic glutamate receptors. Nature 567, 79–84 (2019). [DOI] [PMC free article] [PubMed] [Google Scholar]
- 18.Kunishima N et al. Structural basis of glutamate recognition by a dimeric metabotropic glutamate receptor. Nature 407, 971–977 (2000). [DOI] [PubMed] [Google Scholar]
- 19.Wu H et al. Structure of a class C GPCR metabotropic glutamate receptor 1 bound to an allosteric modulator. Science 344, 58–64 (2014). [DOI] [PMC free article] [PubMed] [Google Scholar]
- 20.Doumazane E et al. Illuminating the activation mechanisms and allosteric properties of metabotropic glutamate receptors. Proc. Natl Acad. Sci. USA 110, E1416–1425 (2013). [DOI] [PMC free article] [PubMed] [Google Scholar]
- 21.Hlavackova V et al. Sequential inter- and intrasubunit rearrangements during activation of dimeric metabotropic glutamate receptor 1. Sci. Signal 5, ra59 (2012). [DOI] [PubMed] [Google Scholar]
- 22.Roy R, Hohng S & Ha T A practical guide to single-molecule FRET. Nat. Methods 5, 507–516, (2008). [DOI] [PMC free article] [PubMed] [Google Scholar]
- 23.Noren CJ, Anthonycahill SJ, Griffith MC & Schultz PG A General-Method for Site-Specific Incorporation of Unnatural Amino-Acids into Proteins. Science 244, 182–188, (1989). [DOI] [PubMed] [Google Scholar]
- 24.Serfling R & Coin I Incorporation of Unnatural Amino Acids into Proteins Expressed in Mammalian Cells. Methods Enzymol 580, 89–107 (2016). [DOI] [PubMed] [Google Scholar]
- 25.Huber T, Naganathan S, Tian H, Ye SX & Sakmar TP Unnatural Amino Acid Mutagenesis of GPCRs Using Amber Codon Suppression and Bioorthogonal Labeling. Method Enzymol 520, 281–305 (2013). [DOI] [PubMed] [Google Scholar]
- 26.Presolski SI, Hong VP & Finn MG Copper-Catalyzed Azide-Alkyne Click Chemistry for Bioconjugation. Curr. Protoc. Chem. Biol 3, 153–162 (2011). [DOI] [PMC free article] [PubMed] [Google Scholar]
- 27.Muto T, Tsuchiya D, Morikawa K & Jingami H Structures of the extracellular regions of the group II/III metabotropic glutamate receptors. Proc. Natl. Acad Sci. USA 104, 3759–3764 (2007). [DOI] [PMC free article] [PubMed] [Google Scholar]
- 28.Huang SL et al. Interdomain movements in metabotropic glutamate receptor activation. Proc. Natl Acad. Sci. USA 108, 15480–15485 (2011). [DOI] [PMC free article] [PubMed] [Google Scholar]
- 29.Jain A et al. Probing cellular protein complexes using single-molecule pull-down. Nature 473, 484–488 (2011). [DOI] [PMC free article] [PubMed] [Google Scholar]
- 30.Bronson JE, Fei J, Hofman JM, Gonzalez RL Jr. & Wiggins CH Learning rates and states from biophysical time series: a Bayesian approach to model selection and single-molecule FRET data. Biophys. J 97, 3196–3205 (2009). [DOI] [PMC free article] [PubMed] [Google Scholar]
- 31.Zhang J et al. Specific structural elements of the T-box riboswitch drive the two-step binding of the tRNA ligand. Elife 7, e39518 (2018). [DOI] [PMC free article] [PubMed] [Google Scholar]
- 32.Nussinov R, Ma B & Tsai CJ Multiple conformational selection and induced fit events take place in allosteric propagation. Biophys. Chem 186, 22–30 (2014). [DOI] [PMC free article] [PubMed] [Google Scholar]
- 33.Manglik A et al. Structural Insights into the Dynamic Process of beta2-Adrenergic Receptor Signaling. Cell 161, 1101–1111 (2015). [DOI] [PMC free article] [PubMed] [Google Scholar]
- 34.Dror RO et al. Activation mechanism of the beta2-adrenergic receptor. Proc. Natl. Acad. Sci. USA 108, 18684–18689 (2011). [DOI] [PMC free article] [PubMed] [Google Scholar]
- 35.Grushevskyi EO et al. Stepwise activation of a class C GPCR begins with millisecond dimer rearrangement. Proc Natl Acad Sci U S A 116, 10150–10155 (2019). [DOI] [PMC free article] [PubMed] [Google Scholar]
- 36.Kniazeff J et al. Closed state of both binding domains of homodimeric mGlu receptors is required for full activity. Nat. Struct. Mol. Biol. 11, 706–713 (2004). [DOI] [PubMed] [Google Scholar]
- 37.Xue L et al. Major ligand-induced rearrangement of the heptahelical domain interface in a GPCR dimer. Nat. Chem. Biol 11, 134–140 (2015). [DOI] [PubMed] [Google Scholar]
- 38.Yanagawa M, Yamashita T & Shichida Y Activation switch in the transmembrane domain of metabotropic glutamate receptor. Mol. Pharmacol 76, 201–207 (2009). [DOI] [PubMed] [Google Scholar]
- 39.Shaye H et al. Structural basis of the activation of a metabotropic GABA receptor. Nature 584, 298–303 (2020). [DOI] [PMC free article] [PubMed] [Google Scholar]
- 40.Foster DJ & Conn PJ Allosteric Modulation of GPCRs: New Insights and Potential Utility for Treatment of Schizophrenia and Other CNS Disorders. Neuron 94, 431–446 (2017). [DOI] [PMC free article] [PubMed] [Google Scholar]
- 41.Mijares A, Lebesgue D, Wallukat G & Hoebeke J From agonist to antagonist: Fab fragments of an agonist-like monoclonal anti-beta2-adrenoceptor antibody behave as antagonists. Mol. Pharmacol. 58, 373–379 (2000). [DOI] [PubMed] [Google Scholar]
- 42.Stoneman MR et al. A general method to quantify ligand-driven oligomerization from fluorescence-based images. Nat. Methods 16, 493–496 (2019). [DOI] [PubMed] [Google Scholar]
- 43.Hern JA et al. Formation and dissociation of M1 muscarinic receptor dimers seen by total internal reflection fluorescence imaging of single molecules. Proc. Natl Acad. Sci. USA 107, 2693–2698 (2010). [DOI] [PMC free article] [PubMed] [Google Scholar]
- 44.Calebiro D et al. Single-molecule analysis of fluorescently labeled G-protein-coupled receptors reveals complexes with distinct dynamics and organization. Proc. Natl Acad. Sci. USA 110, 743–748 (2013). [DOI] [PMC free article] [PubMed] [Google Scholar]
- 45.Moller J et al. Single-molecule analysis reveals agonist-specific dimer formation of micro-opioid receptors. Nat. Chem. Biol. 16, 946–954, (2020). [DOI] [PubMed] [Google Scholar]
- 46.Endres NF et al. Conformational coupling across the plasma membrane in activation of the EGF receptor. Cell 152, 543–556 (2013). [DOI] [PMC free article] [PubMed] [Google Scholar]
Methods-only References:
- 47.Hong V, Steinmetz NF, Manchester M & Finn MG Labeling live cells by copper-catalyzed alkyne--azide click chemistry. Bioconjug. Chem 21, 1912–1916 (2010). [DOI] [PMC free article] [PubMed] [Google Scholar]
- 48.Schindelin J et al. Fiji: an open-source platform for biological-image analysis. Nat. Methods 9, 676–682 (2012). [DOI] [PMC free article] [PubMed] [Google Scholar]
- 49.Pettersen EF et al. UCSF Chimera--a visualization system for exploratory research and analysis. J Comput Chem 25, 1605–12 (2004). [DOI] [PubMed] [Google Scholar]
- 50.Goodsell DS, Autin L & Olson AJ Illustrate: Software for Biomolecular Illustration. Structure 27, 1716–1720 (2019). [DOI] [PMC free article] [PubMed] [Google Scholar]
- 51.Jain A, Liu R, Xiang YK & Ha T Single-molecule pull-down for studying protein interactions. Nat. Protoc 7, 445–452 (2012). [DOI] [PMC free article] [PubMed] [Google Scholar]
Associated Data
This section collects any data citations, data availability statements, or supplementary materials included in this article.
Supplementary Materials
Data Availability Statement
The materials and data reported in this study are available from the corresponding author upon reasonable request. The PDB accession code for the inactive and active structures of human mGluR5 are 6N52 and 6N51. Source data are provided with this paper.


