

Abstract
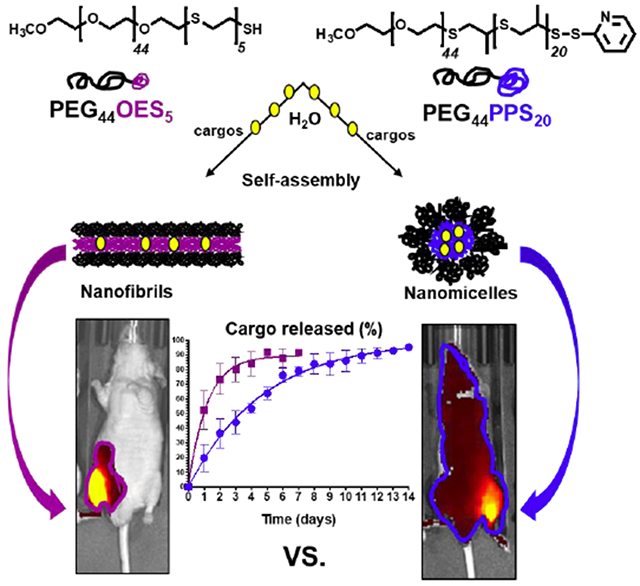
Immunomodulatory therapies are limited by unavoidable side effects as well as poor solubility, stability, and pharmacokinetic properties. Nanomaterial-based drug delivery may overcome these limitations by increasing drug solubility, site-targeting, and duration of action. Here, we prepared innovative drug-integrating amphiphilic nanomaterial assemblies (DIANA) with tunable hydrophobicity, size, and morphology, and we evaluated their ability to deliver cyclosporine A (CsA) for immunomodulatory applications. We synthesized amphiphilic block copolymers made of poly(ethylene glycol)-poly(propylene sulfide) (PEG-PPS) and poly(ethylene glycol)-oligo(ethylene sulfide) (PEG-OES) that can self-assemble into solid core nanomicelles (nMIC, with ≈20nm diameter) and nanofibrils (nFIB, with ≈5nm diameter and >500nm length), respectively. nMIC and nFIB displayed good CsA encapsulation efficiency (up to 4.5 and 2 mg/mL, respectively in aqueous solution), superior to many other solubilization methods, and provided sustained release (>14 and >7 days for the nMIC and nFIB) without compromising CsA’s pharmacological activity. Treatment of insulin-secreting cells with unloaded DIANAs did not impair cell viability and functionality. Both CsA-loaded DIANAs inhibited proliferation and activation of insulin-reactive cytotoxic T cells in vitro. Subcutaneous injections of CsA-loaded DIANAs in mice provided CsA sustained release, decreasing alloantigen-induced immune responses in the draining lymph node at lower doses and reduced administration frequency than unformulated CsA. While nMICs solubilized higher amounts and provided more sustained release of CsA in vitro, nFIBs enhanced cellular uptake and promoted local retention due to slower trafficking in vivo. DIANAs provide a versatile platform for a local immune suppression regimen that can be applied to allogeneic cell transplantation.
Keywords: block-copolymers, self-assembling, nanomaterials, drug delivery, immunosuppression, local immunomodulation, pancreatic islets
Graphical Abstract
INTRODUCTION
The use of nanomaterials in medicine began in the 1970s when “polymer-drug conjugates” (later “nanotherapeutics”) were introduced for drug delivery. Since the very first works by Folkman1 and by Zaffaroni2 about controlled drug delivery, various systems have been formulated using macro-, micro-, and nano-materials3, with most of the applications in the pharmaceutical field having been reported for nanomaterials4. Nanomaterials for drug delivery can enable stable aqueous dispersions of poorly water-soluble therapeutic agents and protect them from the degradation caused by various endogenous mechanisms. Importantly, nanocarriers can provide sustained drug delivery, targeted or localized to specific cells or tissues, and trigger their action via site-specific stimuli (pH, temperature, light, or reduction/oxidation). Further, the composition, size, shape, and surface properties of nanomaterials can be tuned to enable loading of a wide variety of drugs, modifying their pharmacokinetics to reduce toxicity and dosage, thus increasing therapeutic efficacy5. Here, we report drug-integrating amphiphilic nanomaterial assemblies (DIANAs) with tunable hydrophobicity, size, and morphology intended for the localized delivery of immunomodulating drugs to reduce their dosage and, thus, potential side effects. In particular, we are focusing on the effect of morphology of the nanoparticles on their cellular uptake, biodistribution, and cargo delivery. We are comparing two types of nanoparticles: very small spheres (nanomicelles) and long filaments (nanofibrils) to develop a system for local immunomodulation and applications in cell allotransplantation for the treatment of type 1 diabetes (T1D).
People affected by T1D lose their ability to produce insulin in response to a glucose challenge as their pancreatic β-cells are destroyed by autoimmunity. They require lifelong administration of exogenous insulin6–12, but proper metabolic control is often not achieved leading to long-term complications. Pancreatic islet transplantation improves metabolic control and quality of life for patients with brittle T1D12. However, this procedure requires systemic and chronic immunosuppression13, which has serious side effects and hampers the engraftment, function, and survival of transplanted islets13–15, thus limiting the applicability of the procedure. A successful localized immunosuppression and anti-inflammatory (LISAI) regimen could increase the safety of allogeneic islet transplantation and extend the applicability of the procedure to a larger number of T1D patients. Toward this aim, we prepared our DIANAs, which offer ultra-small sizes and tunable chemical compositions, to provide drug delivery that is either localized to the graft or targeted to the draining lymph nodes (LNs)16. Ultra-small nanoparticles (< 25 nm) are known to be efficiently transported by the interstitial flow through lymphatic capillaries to the draining LNs, where they can target LN-resident immune cells17–20, including B and T cells21. Therefore, ~25 nm (or smaller) diameter nanoparticles have been used for vaccine development22, 23, but by encapsulation of immunomodulatory drugs, the technology can be adapted for the blockade rather than the induction of T cell activation. Besides the small size, our DIANA technology they have the advantage to overcome critical limitations of immunomodulatory drugs, such as their poor water solubility, metabolic stability, and duration of action24.
Here, we investigate the ability of two block copolymer DIANAs to develop a LISAI regimen using cyclosporine A (CsA) as model drug. CsA is a well-known immunosuppressive agent composed by a cyclic undecapeptide with a molecular weight of 1203 Da and an octanol/water partition coefficient (Log Po/w) of 2.9225, 26. It was introduced originally in the 1970s by Sandoz as a highly potent and hydrophobic calcineurin inhibitor that blocks T cell activation27 and CsA is currently used in clinical allotransplantation, but because of its very low solubility and cell permeability, current formulations contain Cremophor EL or ethanol as solubilizing agents, which are not inert and can exert various biological effects. Therefore, methods to improve CsA solubilization and duration of action are being explored, especially for topical use in eye inflammatory diseases, such as uveitis, corneal healing, and dry eye disease28. Encapsulation of the drug into DIANAs, such as nanomicelles and nanofibrils, can enhance the water solubility, stability, and efficacy of CsA without the side effects of the solubilizing agents.
We synthesized two families of amphiphilic block copolymers to serve as DIANA made of polyethylene glycol)-poly(propylene sulfide) (PEG-PPS) and poly(ethylene glycol)-oligo(ethylene sulfide) (PEG-OES), respectively. In general, these block copolymers can self-assemble in water forming different nanostructures and, depending on their morphologies, incorporate either hydrophobic or hydrophilic cargos16, 29–31. We prepared and characterized PEG-PPS nanomicelles (nMIC) and PEG-OES nanofibrils (nFIB) because they have highly hydrophobic inner cores that are adjustable by tuning the PPS or OES mass fraction, respectively. In addition, the nanomicelles were already shown to be able to load therapeutically relevant amounts of hydrophobic drugs29 and to reach LN-resident cells in vivo16. The nanofibrils were not investigated yet, but their elongated shape mimics the basic architectural element of many biological materials that have structural functions (e.g., cellulose nanofibrils in plants and bacteria, chitin nanofibrils in animals, and silk fibroin nanofibrils from spiders)32. Long fibrils with a cross sectional diameter of few nanometers may provide more efficient cellular uptake in vitro33 than spherical nano-scaled assemblies34 due to multiple contact sites with cells, and prolonged circulation in vivo due to increased sensitivity to flow forces.
Therefore, two different copolymers were investigated and compared here because of their different self-assembled nano-shape: PEG44-PPS20 forming nMIC29, 35 and PEG44-OES5 recently designed and reported to form nFIB30. Our nanofibrils are quite unique because their formation, although strictly dependent on the hydrophobic block content (ethylene sulfide, ES) similar to the PEG-PPS family36, occurs at ES mass fraction equal to fES ~ 0.08, which is extremely low compared to other block copolymer systems. In the first reported PEG-b-poly-(1,2-butadiene) block copolymers, no assembly structures were observed below poly(1,2-butadiene) mass fraction fBD ~ 0.2837. This behavior is presumably due to the crystallinity of the OES block30. Both PEG44-PPS20 nMIC and PEG44-OES5 nFIB were evaluated and compared for their ability to improve the solubility, site-targeting, and duration of action of CsA. Using fluorescently labeled nMIC and nFIB, we also compared their T cell uptake in vitro and in vivo, and their in vivo trafficking from the site of administration to LNs to assesses the suitability of these nano-system for providing LISAI regimens. We expect nMICs to solubilize higher amounts of hydrophobic drugs in their cores that are more dense and larger than those made of only a few crystalline OES block units in nFIBs. On the other hand, the elongated shape of the nFIBs may enhance cellular uptake while promoting local retention due to slower trafficking compared to nMIC.
EXPERIMENTAL SECTION
Materials.
Commercial grade reagents and HPLC grade solvents were purchased from VWR (Radnor, PA, USA) and Sigma-Aldrich (St. Louis, MO, USA) and directly used without further purification. Cyclosporine A was obtained from Alfa Aesar by Thermo Fisher Scientific (Ward Hill, MA, USA).
Synthesis of amphiphilic diblock-copolymers.
Poly(ethylene glycol)-poly(propylene sulfide).
PEG44-PPS20 copolymers were synthetized using a modified version of the method reported earlier16, 29. Briefly, linear monomethoxy-poly(ethylene glycol) (mPEG-OH, MW 2 kDa) was modified to obtain a thiol-protected group on the OH end of the chain (m-PEG-thioacetate); then, the thiol was activated in presence of propylene sulfide to initiate the anionic ring-opening polymerization of 20 equivalents of monomer. The chain terminus was reversibly capped by disulfide exchange with 2,2’-dithiodipyridine (Supporting Information, Scheme S1A) to provide a PEG-PPS block copolymer that can be further functionalized, if necessary, by disulfide exchange reaction38. The obtained product was purified by precipitation in diethyl ether followed by vacuum filtration. The final product was confirmed by 1H NMR spectroscopy performed in CDCl3 on a Bruker AVANCE (400 MHz) platform with Topspin software: δ = 1.35-1.45 (d, CH3 in PPS chain), 2.6-2.7 (m, -CH in PPS chain), 2.85-3.0 (m, -CH2 in PPS chain), 3.38 (s, -OCH3), 3.52-3.58 (t, -OCH2CH2S), 3.5-3.7 ppm (s, broad, -OCH2CH2 in PEG chain protons), 7.8-7.83 (m, 1H, pyridine group) (Figure S1). The degree of polymerization of the PPS block was determined by the ratio of PEG to PPS protons.
Oligo(ethylene glycol)-poly(propylene sulfide).
PEG44-OES5 copolymers were synthetized as previously reported30. Briefly, the linear 2 kDa mPEG-OH was modified and activated as for the PEG-PPS synthesis to initiate the anionic ring-opening polymerization of 5 equivalents of ethylene sulfide that yields to the growth of a penta-(ethylene sulfide) oligomer from the PEG terminus. The reaction was terminated with excess of glacial acetic acid (Scheme S1B) and the product was purified by repeated precipitations in diethyl ether followed by vacuum filtration. The length and composition of the blocks were confirmed by 1H NMR spectroscopy (CDCl3) as before: δ = 3.5-3.7 (s, broad, -OCH2CH2), 3.38 (s, -OCH3), 2.87 (m, -CH2SH) 2.85 (m, -SCH2CH2), 2.74 (td, -CH2CH2SH) (Figure S1). The degree of polymerization of the OES block was determined by the ratio of PEG protons to OES protons.
Preparation and characterization of drug-integrating amphiphilic nanomaterial assemblies (DIANA): nMIC and nFIB.
The self-assembly of PEG44-PPS20 and PEG44-OES5 block copolymers was achieved either by the co-solvent evaporation (co-SE) method or by the hot water suspension (HWS) method29 as described below.
Nano-micelles (nMIC).
PEG44-PPS20 block copolymer (from a minimum of 20 mg to a maximum of 40 mg) was dissolved in dichloromethane (0.5 mL) in the presence or absence of various amounts of CsA (from 4 to 6 mg) and was added dropwise to distilled water (1 mL). The mixture was stirred at room temperature and at open air until dichloromethane was completely removed by evaporation, at which point the aqueous phase contains nMIC or CsA-nMIC. When needed, the complete evaporation of the organic phase was achieved under vacuum. When the drug was present, any precipitate of unloaded drug was removed by fast centrifugation at 10,000 rpm for 5 minutes. The mean diameter and polydispersity of the obtained nMIC and CsA-nMIC were measured using a Malvem-Zetasizer Nano Range (Malvern, UK). The micellar morphology, in the presence or absence of CsA, was confirmed by cryo-transmission electron microscopy (cryo-TEM). For cryoTEM, 4–5 μL of each formulation was applied to a 400-mesh lacy carbon copper grid. Specimens were then plunge-frozen with a Gatan Cryo-plunge freezer. These specimens were imaged using a JEOL 3200FS transmission electron microscope operating at 300 keV on a CCD camera at 20000-50000× nominal magnification.
Nano-fibrils (nFIB).
Two methods that showed different drug integration capacity were used. Co-solvent evaporation method: PEG44-OES5 block copolymer (maximum 40 mg) was dissolved in dichloromethane (0.5 mL) in presence or absence of 2 mg of CsA and was added dropwise to distilled water (1 mL). The obtained emulsion was stirred at room temperature until the organic phase was completely removed, at which point the aqueous phase contains nFIB or CsA-nFIB. Hot water suspension method: PEG44-OES5 block copolymer (80 mg), previously warmed up, was added to 0.5 mL of pre-heated water in the presence or absence of 4 mg of CsA. After vortexing for several seconds, the mixture was left at high temperature (60°C) until the solid polymer was resuspended by self-assembling into nFIB or CsA-nFIB. When the drug was present, any precipitate of unloaded drug was removed by fast centrifugation at 10,000 rpm for 5 minutes. The mean length and polydispersity of the nanofibrils were evaluated using a Malvem-Zetasizer Nano Range (Malvern, UK), although this method is not very accurate for non-spherical nanoparticles. Therefore, the nanofibril morphology, with and without CsA, was investigated and diameter / lengths were estimated by cryo-TEM, using the same method described for nMIC.
CsA-loading efficiency into DIANA.
The CsA-loading efficiency into nMIC and nFIB was assessed by isocratic reverse phase HPLC method (RP-HPLC) using a partisphere C18 column, 250×4.6 mm (HiCHROM, UK), on a HITACHI LaChrom Elite equipped with the UV-VIS photodiode array detector (HITACHI L-2455, Tokyo, Japan). Samples (20 μL) were injected using pure methanol as mobile phase at a flow rate of 1 mL/min. CsA concentrations were estimated by UV absorbance at 210 nm wavelength. For each sample containing CsA and either PEG44-PPS20 or PEG44-OES5 analyzed by RP-HPLC / UV, a sample containing only CsA weighting the same as the initial CsA level added to the block copolymer was dissolved in methanol and assessed by RP-HPLC as reference. Several independent preparations were analyzed, and the average results were expressed as drug encapsulation efficiency (EE) and drug loading efficiency (DL) calculated as shown below:
| (eq. 1) |
| (eq. 2) |
In vitro release kinetics of CsA from nMIC and nFIB.
Two milliliters of CsA-nMIC, freshly prepared by co-SE method, and two milliliters of CsA-nFIB, freshly prepared either by co-SE or HWS method, were placed in a Spectra/Por dialysis membrane with MWCO of 12 kDa (Fisher Scientific, Pittsburgh, PA, USA) and incubated against 200 mL of distilled water while stirring. Samples of 50 μL were taken from the dialysis membrane for analysis every 24 hours. The water bath was also refreshed every 24 hours in order to create a continued exchange throughout the membrane and mimic sink conditions. Each sample was assessed using RP-HPLC as described above for the determination of CsA concentration, from which the percentage of released drug was calculated. CsA release rate constants from nMIC and nFIB were calculated by fitting the experimental CsA release data with a first-order exponential equation. Dialysis against 200 mL of PBS at 37°C was also performed for CsA-nMIC and CsA-nFIB, the latter prepared by HWS (Figure S3).
Effects of nMIC and nFIB on insulin-secreting cells in vitro.
The nFIB used for the experiments described in this paragraph were all prepared by the co-SE method.
Culture of insulin producing MIN6 cells.
Murine insulinoma MIN6 cells (ADDEXBIO Technologies, San Diego, CA) were cultured at 37°C and 5% CO2 using full DMEM with high glucose content and supplemented with 0.275 mM of β-mercaptoethanol (Thermo Fisher Scientific) and additional 5.6 M of glucose (45% w/v glucose; Sigma-Aldrich). The effects of nMIC and nFIB on both two-dimensional (2D) and three-dimensional (3D) MIN6 cultures were evaluated at one representative concentration. In 2D culture, MIN6 were grown as a monolayer on a tissue culture flask until 60% or 70% confluency was reached. For 3D culture, 1×10⁶ cells/mL suspended in 30 mL of culture media, were inserted in a spinner flask stirred at 70 rpm to allow MIN6 cell aggregation into 3D clusters.
Cell viability assay.
Effects on cell viability after treatment with 0.5 mg/mL of nMIC and nFIB were assessed using a standard MTT test (Sigma-Aldrich). The assay was performed on 2D adherent and on 3D clusters of MIN6 cells, 24 and 48 hours after the treatment. Formazan levels were measured by reading the absorbance at 570 nm using a plate reader and viability was expressed as percentage versus untreated cells.
Glucose-stimulated insulin secretion (GSIS).
MIN6 functionality was assessed via glucose-stimulated insulin secretion (GSIS). For 2D culture, 2×10⁵ cells per well were seeded in a 24 well-plate and grown until they were 60-70% confluent. For 3D culture, cluster aliquots equivalent to 100 islets (100 IEQ) were cultured in each well of a non-tissue culture 24 well-plate. 2D cells and 3D clusters were treated with 0.5 mg/mL of either nMIC or nFIB for 24 and 48 hours or left untreated, after which cells and clusters were washed and incubated with a low glucose solution (2.2 mM) followed by a high glucose solution (16.7 mM), each for one hour. The amount of insulin secreted during incubation with high glucose was measured by ELISA (Mercodia, Winston Salem, NC, USA) and normalized to the insulin secreted during low glucose stimulation to determine the glucose stimulation index (GSI). The GSI of treated MIN6 cells was compared with that of untreated cells.
Culture and functionality assessment of human pancreatic islet cells in vitro.
Primary human pancreatic islets were obtained from the cGMP Facility of the Diabetes Research Institute (DRI, University of Miami, Miller School of Medicine, Miami, FL, USA). The islet isolation protocol, as part of the Clinical Pancreatic Islet Transplantation Study, was approved by the Institutional Review Board (IRB) of the University of Miami and the FDA. Human pancreatic islet isolations were performed in the clean room of the DRI cGMP facility. Human pancreases were from deceased multiorgan donors for which consent for transplantation was obtained by accredited Organ Procurement Organizations (OPOs) from the donors’ families or next of kin. Islets were isolated by using a modification of the automated method previously described39, 40. After the purification process, the islets were cultured overnight at 37°C in untreated T-flasks and in 5% FBS media. Aliquots of the islet preparation equivalent to 100 islets (100 IEQ) were suspended in fresh media and incubated in each well of a non-tissue culture 24 well-plate with and without 1 μg/mL of either free CsA dissolved in methanol (CsA-vehicle) or CsA loaded nMIC and CsA loaded nFIB. Islet functionality was determined by in vitro GSIS as described above. GSIs of CsA-vehicle, CsA-nMIC, and CsA-nFIB treated islets were compared to the GSI of untreated islets used as positive control. Empty nMIC and empty nFIB were also added as controls. Viability of nMIC-treated and nFIB-treated islets was determined using a LIVE/DEAD viability assay kit (Molecular Probe, Eugene, OR, USA) and islets were treated with 0.1 mg/mL of either nMIC or nFIB.
Effects of CsA-nMIC and CsA-nFIB in vitro.
Inhibition of the activation of insulin-reactive CD8+ T cells.
Splenocytes were isolated from the spleen of a T-cell receptor (TCR) transgenic non-obese diabetic (NOD) mouse expressing the TCR Vα18/Vβ6 receptor of the G9C8 insulin-reactive CD8 T-cell clone41. These G9Calpha−/− NOD mice were kindly provided by Dr. Susan Wong (University of Cardiff, UK). Insulin-reactive T-cells were specific to the low avidity insulin peptide B15-23 (INS B15-23, New England Peptide, Gardner, MA, USA), and they were used to assess the suppression of diabetogenic cytotoxic T cells after treatment with CsA-nMIC and CsA-nFIB. 1×10⁵ splenocytes were labeled with CellTrace violet (cell proliferation kit, Invitrogen, San Diego, CA, USA), seeded in a 96 round bottom well plate, and stimulated with 40 μg/mL of INS B15-23 in the presence of CsA dissolved in methanol as vehicle (CsA-vehicle), CsA-nMIC, or CsA-nFIB (by co-SE). The concentration for both DIANAs was adjusted to 0.1 mg/mL resulting in ≈9,0 μg/mL and ≈1.1 μg/mL of loaded CsA, respectively. CsA-vehicle was used at 10 μg/mL. Empty DIANAs (at 0.1 mg/mL) and vehicle alone were used as negative controls, and INS B15-23 activated spleen cells without CsA treatment were used as positive control. In a separate experiment, the concentration of CsA was adjusted to 1.0 μg/mL and 0.1 μg/mL for both DIANAs as well as the CsA dissolved in methanol, and the CsA-nFIBs were prepared by the HWS method. All groups were cultured for 3 days before harvesting. Cells were stained for flow cytometry analysis using LIVE/DEAD fixable Dead Cell Stain (Near Infra-RED, Invitrogen, San Diego, CA, USA) and the surface markers CD3 (Biolegend, San Diego, CA, USA), CD4 and CD8 (BD Biosciences, San Jose, CA, USA). Live, CD3+ CD4− and CD8+ T cell subpopulations were identified, and their proliferation in vitro was quantified by CellTrace dilution. Flow cytometry was performed with a CytoFlex S flow cytometer (Beckman Coulter, Brea, CA, USA) and data were analyzed with FlowJo (TreeStar, Ashland, Oregon, USA).
Inhibition of Jurkat-Lucia NFAT cell activation.
To quantify nuclear factor of activated T cells (NFAT) we used Jurkat-Lucia NFAT cells (InvivoGen, San Diego, CA, USA), which are derived from human T lymphocyte-based Jurkat cell line by stable integration of a NFAT-inducible Lucia reporter construct. Cells were cultured according to manufacturer instructions and maintained at a density below 1x10⁶ cells/mL, resuspended in FBS-free IMDM media (Gibco Thermo Fisher Scientific), then seeded in a 96-microwell plate at a density of 100,000 cells per well. NFAT activation, detected as luciferase secretion, was induced by stimulation with the T cell mitogen concanavalin A (ConA, Sigma-Aldrich) at a concentration of 25 μg/mL. Immediately preceding stimulation, cells were treated with CsA-vehicle (free CsA in methanol), CsA-nMIC, or CsA-nFIB. Free CsA was added at 1.0 and 10 ng/mL, selected as being in the range of the IC50 of CsA for calcineurin inhibition in vitro42. CsA in CsA-nMICwas added at 0.8, 4.0, and 20 ng/mL total concentrations, with the amount of nMIC at 7.6, 38 and 190 ng/mL respectively, obtained by dilution of the CsA-nMIC stock solution in PBS. CsA in CsA-nFIB was added at 1.5, 7.5 and 37.5 ng/mL total concentrations, with the amount of nFIB at 80, 400 and 2000 ng/mL respectively, obtained by dilution of the CsA-nFIB stock solution in PBS. For this experiment, CsA-nMIC stock formulation was prepared by the cosolvent evaporation method with an initial drug/polymer ratio 1:7 (6 mg of CsA and 40 mg of PEG44-PPS20); while CsA-nFIB was obtained by the hot water suspension method with an initial drug-polymer ratio 1:20 (4 mg of CsA and 80 mg of PEG44-OES5). Cells treated with the vehicle or the unloaded nMIC /nFIB were used as controls using volumes and concentrations (indicated above) comparable to those of the drug-containing formulations, obtained by diluting the stock solutions in PBS. After 24 hours, 20 μL of cell culture supernatant was mixed with 50 μL of Quanti-Luc reagent (InvivoGen), upon which luminescence was measured using a microplate luminometer at 0.1 s exposure and correlated with NFAT activation. CsA-nMIC and CsA-nFIB pre-dialyzed in PBS medium for 3 and 2 days, respectively, were also tested on these Jurkat NFAT cells to determine if they were still effective, i.e., could provide sustained release. For viability assessment of the same cells, an MTS assay was used. After removal of the supernatant for luciferase detection, 20 μL per well of MTS, 3-(4,5-dimethylthiazol-2-yl)-5-(3-carboxymethoxyphenyl)-2-(4-sulfophenyl)-2H-tetrazolium, (Promega, Madison, WI, USA) was added directly to the wells. Cells were then incubated at 37 °C for 2 h, and formazan levels were measured using a plate reader at 490 nm.
In vitro T cell uptake of fluorescently-labeled nMIC and nFIB via flow cytometry and confocal microscopy.
For the preparation of fluorescent PEG44-PPS20 nMIC and fluorescent PEG44-OES5 nFIB, the DiD far-red lipophilic carbocyanine dye (Molecular Probe) was resuspended in DCM and loaded into nMIC (40 mg/mL) and nFIB (80 mg/mL) by the solvent evaporation technique (as described above) at a final stock concentration of 5 μM. After complete evaporation of the organic phase, the aqueous phase containing either DiD-nMIC or DiD-nFIB was exhaustively dia-filtered against deionized water (MWCO 12 kDa) to remove possible unloaded dye molecules. The samples containing the DiD labeled nMIC and nFIB were dark blue, and they were used at a dilution of 104-folds for the following experiment. 1×10⁵ splenocytes isolated from a prediabetic NOD mouse were plated in a U-bottom 96-well plate and stimulated with anti-CD3. Simultaneously, they were treated with DiD-labeled nMIC and nFIB or 6, 12, and 24 hours. After each time point, cells were washed and processed for flow cytometry analysis using fixable Dead Cell Stain (near Infra-RED, Invitrogen) and antibodies against the following surface markers: anti-mouse CD3 and CD11b (Biolegend), B220 (BD Biosciences), F4/80 and CD11c (eBioscience). Results were analyzed with FlowJo. Specific cell subpopulations were identified from live cells based on surface marker expression: T cells (CD3+), B cells (B220+), DCs (CD11c+ CD11b+), and macrophages (F4/80+ CD11b+).
In addition, 2×10⁵ GFP expressing splenocytes, isolated from GFP-expressing NOD mice43, 44, were also cultured in a U-bottom 96-well plate and stimulated with anti-CD3 to activate the T cells. Simultaneously cells were treated with DiD-nMIC and DiD-nFIB. Confocal images were taken 3 days after, at which point, only T cells proliferated and represented the majority of cells in culture. The GFP and the red fluorescence (DiD-DIANAs) were analyzed for colocalization in order to determine the uptake of DIANAs.
Mice.
All studies involving animal subjects were performed under protocols approved and monitored by the University of Miami (UM) Institutional Animal Care and Use Committee (IACUC protocols 19-004 and 18-055). All procedures were conducted according to the guidelines of the Committee on Care and Use of Laboratory Animals, Institute of Laboratory Animal Resources (National Research Council, Washington, DC). All animals were obtained from Jackson Laboratories (Bar Harbor, ME, USA) and housed at the Division of Veterinary Resources, University of Miami.
Optical whole-body imaging and LN targeting of DiD-labeled nMIC and nFIB in mice.
Nude mice were used for intravital optical imaging because they lack hair, which is highly effective at blocking, absorbing, and scattering light during optical imaging.
Mice were injected subcutaneously in the right hind limb with DiD-nMIC and DiD-nFIB. Two doses of either DiD-nMIC or DiD-nFIB were tested (after a larger screening) to make sure to have enough signal for live imaging without saturating the system and they are reported here: 3 and 1 μL containing 750 ng and 250 ng of dye, respectively. Mice were imaged at 0.5, 2, 6, 24 and 72 hours, and 6 days after injection using an IVIS® spectrum system (PerkinElmer, Waltham, MA, USA). Untreated mice were imaged as negative control. DiD-nMIC and DiD-nFIB fluorescence intensity was quantified using a Living Image software designed for use with this IVIS® optical imaging systems.
In another experiment, C57BL/6 mice received a foot pad injection with 70 μL of DiD-nMIC and DiD-nFIB (containing 4.9 μg of DiD), for flow cytometry analysis of the draining lymph nodes. Two days after injection, the ipsilateral draining LN (right popliteal: IL-pLN), the contralateral LN (left popliteal: CL-pLN), and the distal draining LNs (left axillary: D-axLN) were collected (Schematic in Figure 7A). Single cell suspensions were made after mechanical disruption of the LNs. DiD fluorescence intensity was evaluated by flow cytometry using CytoFlex. Cells were also stained with fixable Dead Cell Stain (near Infra-RED, Invitrogen) and with antibodies against the following surface markers: anti-mouse CD3 and anti-mouse CD11b (Biolegend), anti-mouse B220 (BD biosciences), anti-mouse F4/80 and anti-mouse CD11c (eBioscience). Results were analyzed with FlowJo. Specific cell subpopulations were identified from live cells based on surface marker expression: T cells (CD3+), B cells (B220+), DCs (CD11c+ CD11b+), and macrophages (F4/80+ CD11b+).
Figure 7. Quantification of DiD labeled DIANAs uptake by LN-resident cells.
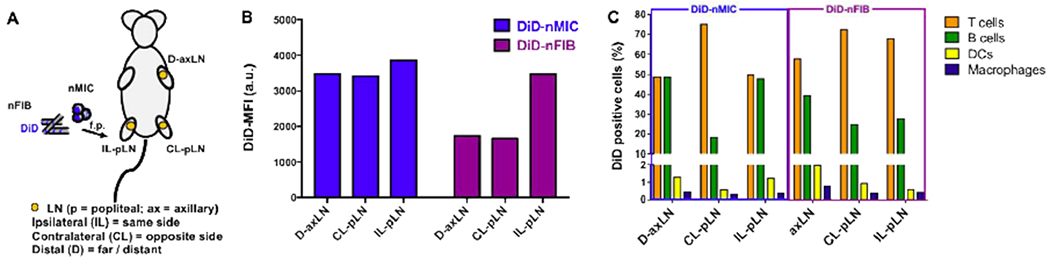
(A) Schematic of the experimental design. The fluorescent DiD compound was loaded into nMIC and nFIB, and C57BL/6 mice received subcutaneous (s.c.) injection of DiD-nMIC or DiD-nFIB (70 μL containing 4.9 μg of DiD) in the right hind limb. Two days after treatment, representative lymph nodes (LNs) were collected for flow cytometry analysis: distal axillary LN (D-axLN), contralateral popliteal LN (CL-pLN), and ipsilateral popliteal LN (IL-pLN). Flow cytometry analysis was performed on isolated LN cells to evaluate DiD fluorescence distribution in the cell subpopulations. (B) DiD-nMIC and DiD-nFIB uptake in different LNs as quantified by flow cytometry (mean fluorescence intensity, MFI). (C) Relative percentage of different LN cell subpopulations positive for the cargo (DiD). DiD uptake by the different CD45+ cell subpopulations were identified from live DiD+ cells based on surface marker expression: T cells (CD3+), B cells (B220+), DCs (CD11c+ CD11b+), and macrophages (F4/80+ CD11b+).
Inhibition of alloantigen-induced immune response in vivo.
Male Balb/c mice (8-10 weeks-old) were given foot pad injections in the right hind limb of 1×10⁷ splenocytes from male DBA-2 mice (8-10 weeks-old). Recipient mice were immediately treated as follows (schematic in Figure 8A)
Figure 8. CsA-nMIC and CsA-nFIB inhibited alloresponses in mice.
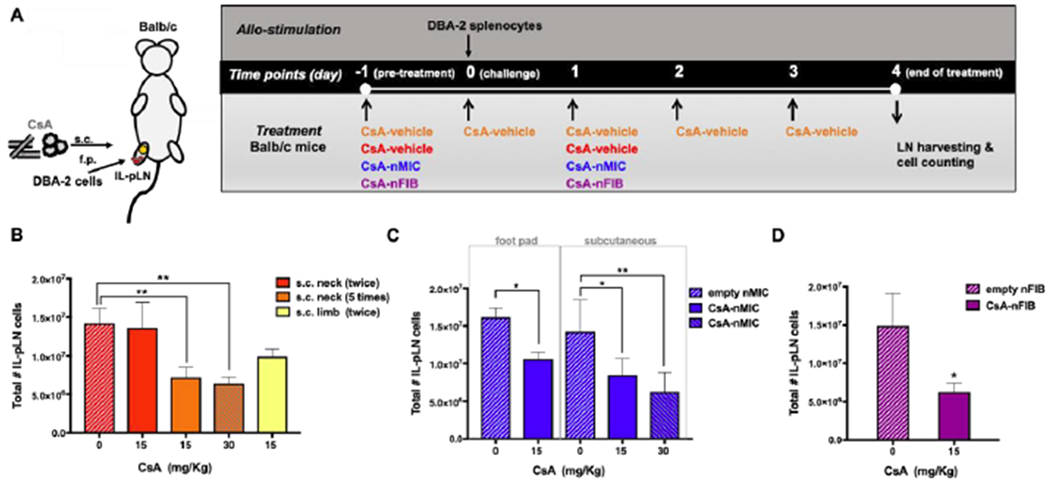
Balb/c mice were injected with 1×10⁷ splenocytes from DBA-2 mice in the right foot pad (f.p.) and subjected to different treatments as shown. (A) Schematic of treatments; see text for details. (B-D) The draining ipsilateral popliteal LNs (IL-pLNs) were collected 4 days after the minor mismatch allogeneic cell injection, and the total number of live IL-pLN cells were quantified by flow cytometry. The total number of live IL-pLN cells for CsA-vehicle is shown in panel B, for CsA-nMIC in panel C, and for CsA-nFIB in panel D. Data are shown as mean ± SD (n = 3–4 independent experiments). Asterisk indicate significant differences versus corresponding controls (*p<0.05, **p<0.01; one-way ANOVA followed by Dunnett’s multiple comparison test).
CsA-vehicle control (CsA dissolved in methanol) administered in the subcutaneous space (s.c.) into the loose skin over the neck (selected as a positive control site, because provides stable and reproducible CsA absorption in rodents45), at two different doses (15 and 30 mg/kg, equal to 70 and 140 μL of stock solution respectively) daily, starting on the day before the splenocyte injection; or s.c. in the right hind limb at 15 mg/kg on the day before (−1) and after (1) the allogeneic cell injection;
CsA-nMIC (co-SE) administered either via foot pad (f.p.) injection at 15 mg/kg (70 μL of stock solution) or s.c. in the right hind limb at two different doses (15 and 30 mg/kg, equal to 70 and 140 μL of stock solution respectively) on day −1 and on day 1;
CsA-nFIB (HWS) administered s.c. in the right hind limb only at 15 mg/kg (equal to 210 μL of stock solution) on day −1 and on day 1.
On day 4 after alloantigen challenge, the mice were sacrificed and the draining ipsilateral popliteal LNs (IL-pLNs) were collected. Following mechanical disruption of the pLNs, isolated cells were counted on a Vi-Cell XR Cell Viability Analyzer (Beckman Coulter, Brea, CA, USA) to determine LN cellular expansion due to alloresponses. From each IL- pLN cell suspension, 1×10⁶ cells were stained for flow cytometry using LIVE/DEAD fixable near infra-RED and antibodies against the following surface markers: anti-mouse CD3, anti-mouse CD8, anti-mouse CD62L (BD Bioscience), anti-mouse CD4 (e-Bioscience), anti-mouse CD44 and anti-mouse CD45 (Biolegend). Samples were evaluated using a Cytoflex flow cytometer and data analyzed with Flow Jo.
Inhibition of alloantigen-induced T cell response in contralateral pLN versus ipsilateral pLN.
Male Balb/c mice (8-10 weeks-old) were injected with 1×10⁷ splenocytes from male DBA-2 mice (8-10 weeks-old) in the foot pad of both hind limbs. Recipient mice were treated s.c. only in the right hind limb with 15 mg/kg of CsA-vehicle, CsA-nMIC (by co-SE), or CsA-nFIB (by HWS) on the day before (−1) and after (1) allogeneic cell injection. The contralateral pLN, (CL-pLNs) the ipsilateral LN (IL-pLNs), and the distal axillary LN (D-axLNs), were harvested 4 days after the alloantigen challenge, mechanically processed for cell isolation, and pLN total live cells were counted as described above.
Statistics.
All cell assays were done in triplicates, and all assays were performed at least in three independent experiments. Data were plotted in GraphPad Prism (GraphPad, La Jolla, CA, USA) and analyzed by one-way repeated-measures analysis of variance (ANOVA) followed by Dunnett’s multiple comparison test as a post hoc test for individual differences using GraphPad Prism and a significance level of p < 0.05 for all comparisons.
RESULTS AND DISCUSSION
PEG44-PPS20 and PEG44-OES5 amphiphilic block copolymers (Figure 1A) were evaluated as DIANAs for developing of a LISAI regimen in allogeneic cell transplantation, including pancreatic islet transplantation for treatment of T1D. PEG44-PPS20 and PEG44-OES5 synthesis by living anionic polymerization of either propylene sulfide or ethylene sulfide (Supporting Information, Scheme S1)29, 30, 46 allows mild conditions and good control over the episulfide degree of polymerization with high product recovery (about 80-90% of the initial weight mass). Products were confirmed by 1HNMR spectroscopy (Supporting Information, Figure S1). PEG was selected as the hydrophilic block because of its proven ability to improve biocompatibility and solubility and to resist protein adsorption, often referred as biomaterial passivation47, 48 or nanoparticle passivation49. As hydrophobic block, either PPS (for PEG44-PPS20 nanomicelles), an oxidation-sensitive, low glass transition temperature, and hydrophobic polymer, or OES (for nanofibrils PEG44-OES5), an oxidation-sensitive, short, highly hydrophobic, and crystalline oligomer, was selected. The advantage in using them is that both can become water-soluble by oxidation30, 50 and, as such, quickly cleared out from the cells and from the body. Because PEG is water-soluble, while PPS and OES are not, self-assembled mesophases will form in water in a predictable manner driven by the mass ratio of the two blocks: you find nanomicelles, nanorods, and nanovesicles for different PEG/PPS ratios36, and nanomicelles and nanofibrils for different PEG/OES ratios30. The differential arrangements of amphiphilic block copolymers in water have been determined previously for several block copolymers36, 51. Arrangement in water is determined by the delicate balance of hydrophilic/hydrophobic segments and is only weakly dependent on the MW of the blocks. That balance allows PEG-block–based copolymers to form membrane structures. Di-block copolymers with small hydrophilic PEG fractions (fPEG) and large MW hydrophobic blocks tend to assemble in fluidlike vesicles52. For intermediate hydrophilic fractions, a variety of morphologies can coexist, mostly worm- and rod-like micelles, but also Y junctions and micelles36. At high fPEG, spherical micelles form. PEG-OES block-copolymers used here are unique because they form colloidal assemblies (such as micelles and fibrils) at much lower values of the hydrophobic OES block mass fraction than those needed for PEG-PPS or the canonical PEG-b-poly(1,2-butadiene)), presumably due to the crystallinity of OES53, as confirmed by differential scanning calorimetry (DSC) analysis previously reported for the oligomer OES3 30,
Figure 1. CsA encapsulation in nMIC and nFIB and release kinetic.
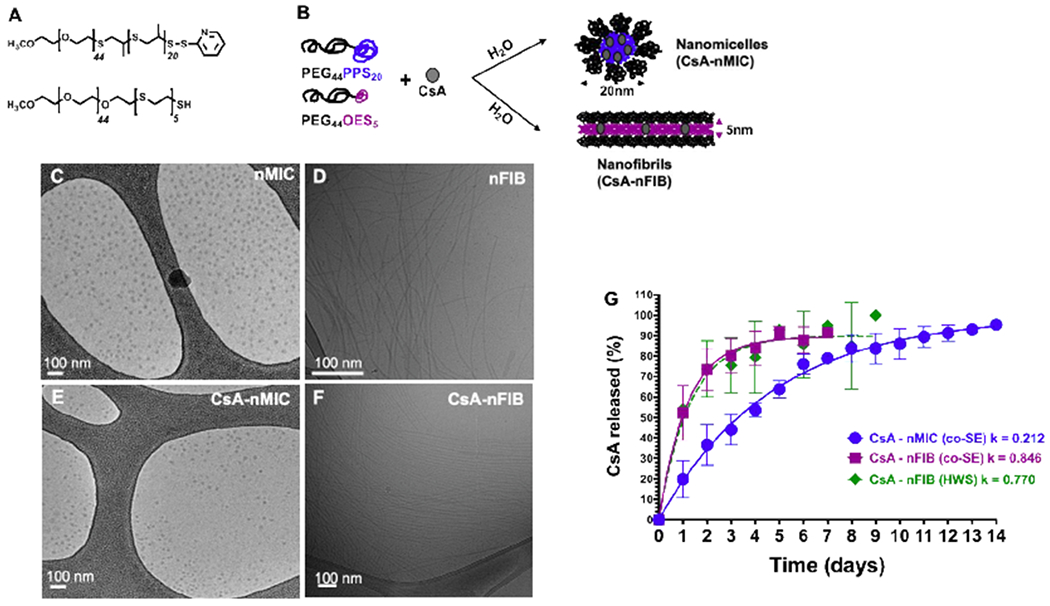
(A,B) Schematic of chemical composition of PEG44-PPS20 and PEG44-OES5 diblock-copolymers (A) and self-assembling into nanomicelles (nMIC) and nanofibrils (nFIB) with drug (CsA) encapsulation (B). (C-F) Morphology of nMIC (C), CsA-nMIC (E), nFIB (D), and CsA-nFIB (F) imaged by cryoTEM. (G) Release kinetic of CsA from nMIC (blue), nFIB prepared by cosolvent evaporation method (co-SE, purple), and from nFIB prepared with hot water suspension (HWS, green) in vitro using the dialysis method against distilled water and quantified by RP-HPLC (n = 5 independent batches for the cosolvent method and 2 for the hot water method). The first order release rate constants reported in the graph were calculated from the interpolating curve. Based on the dialysis model, nFIB release CsA 4 times faster than nMIC. The preparation method has no significant effect on the release rate of CsA from nFIB.
The morphological control of the nanoassemblies in aqueous solution is also allowed by the above-mentioned precise control of the chain lengths during the polymerization, which makes the nanosystems adjustable to suit the type of drug delivery needed36. Here, we focused on PEG44-PPS20 nanomicelles (nMIC) and PEG44-OES5 nanofibrils (nFIB) as drug delivery systems because, while nMICs can load high amounts of drug in their amorphous hydrophobic cores that is well above its Tg (−60°C54) and which DSC analysis did not show any phase change29, nFIBs, which OES core is also above its Tg (−50°C55) but smaller and highly crystalline, could provide more localized drug delivery because their elongated shape and long size reduce their passive transport under fluid flow conditions34. Also, nFIBs have not yet been evaluated as a DIANA for localized immunosuppression in vivo. Because of their hydrophobic cores and their self-assembling capability in water, both nMIC and nFIB can provide good solubilization of the hydrophobic drug CsA.
PEG44-PPS20 block copolymer synthesis, self-assembling, and nMIC drug integration.
PEG44-PPS20 block copolymers (Figure 1A) were prepared from a monomethoxy polyethylene glycol of 2 kDa molecular weight that was reacted with 20 molar equivalents of propylene sulfide. The polymerization reaction was stopped by introduction of excess of 2,2′-dithiodipyridine as end-capping agent for further functionalization (Scheme S1A)38. As predicted by the nominal mass ratio between PEG and PPS (fPEG = 0.57 w/w29, 36; confirmed by NMR), PEG44-PPS20 self-assembled in water into nMICs (Figure 1B, C). Dynamic light scattering (DLS) confirmed a diameter of about 20 nm, and cryo-TEM imaging demonstrated spherical and very homogeneous morphology (Figure 1C), which is typical of PEG44-PPS20 nMICs29, 36 (Table 1). The dark spots in the cryo-TEM image (Figure 1C) indicate the presence of an electron-dense area formed by the PPS hydrophobic chains corresponding to the nMIC cores and excluding the nMIC crown formed by the hydrophilic PEG chains. Despite the relatively small size (~20 nm), the tight hydrophobic PPS core allowed efficient and stable loading of CsA. A drug/polymer mass ratio of 1 to 5 (CsA 4 mg / PEG44-PPS20 20 mg) resulted in 47% of the total CsA mass loaded into the nMIC (Table 2), suggesting that CsA is solubilized into nMIC at 1.88 mg/mL. Since CsA solubility at room temperature is only 0.012 mg/mL in water56, 57 and 0.007 mg/mL in PBS58, nMIC loading increases CsA solubility more than 100-fold. When we used a drug/polymer mass ratio of 1 to 7 (CsA 6 mg / PEG44-PPS20 40 mg), 75% of the total drug mass was loaded into the nMIC, further increasing CsA solubility in water to 4.5 mg/mL. For comparison, CsA solubilization values of 0.93 mg/mL were reported recently in mixed micelles made of Pluronic F12758. Solubility of 1.27 mg/mL was achieved earlier using micelles made with different ratios of PEO and PCL 59, 60. PEG-PLGA block-copolymer nanoparticles, one of the most widely used polymeric biomaterials, have been reported to load 3.3% w/w of CsA61, corresponding to 0.33 mg/mL of CsA per 10 mg of nanoparticles. Solubilities of 5–6 mg/mL have also been achieved, but with larger nanoparticles or larger initial amount of cargo and polymer56, 62 Thus, the nMIC DIANA explored here provides considerably improved CsA solubilization in aqueous media.
Table 1:
Z-average (nm) and polydispersity index (PdI) of nMIC and nFIB with and without CsA obtained by DLS analysis (n = 3 independent preparations). For nMIC, the Z-average results represent the hydrodynamic diameter; for nFIB, they represent the size of agglomerations and entanglements that nFIB form in water.
| Formulation | PEG44-PPS20 nanomicelles | PEG44-OES5 nanofibrils | ||
|---|---|---|---|---|
| mean diameter (nm) | PdI | mean size of agglomerations* (nm) | PdI | |
| Empty | 26.48 ± 0.170 | 0.216 ± 0.002 | 111.0 ± 9.24 | 0.245 ± 0.005 |
| CsA | 24.24 ± 0.185 | 0.154 ± 0.006 | 96.20 ± 8.48 | 0.220 ± 0.005 |
Table 2:
Encapsulation efficiency (EE) and drug loading efficiency (DL) of CsA into nMIC and nFIB (n = 3 independent preparations).
| PEG44-PPS20 nanomicelles | PEG44-OES5 nanofibrils | ||||
|---|---|---|---|---|---|
| CsA/polymer initial ratio (mg/mg) | EE (%), mean ± SD | DL (wt/wt),\ mean ± SD | CsA/polymer initial ratio (mg/mg) | EE (%), mean ± SD | DL (wt/wt), mean ± SD |
| 1:5* | 47.00 ± 6.04 | 0.090 ± 0.01 | 1:20* | 22.60 ± 12.2 | 0.011 ± 0.006 |
| 1:7* | 75.55 ± 0.92 | 0.113 ± 0.00 | 1:20** | 38.00 ± 8.23 | 0.0190 ± 0.004 |
Obtained by cosolvent evaporation method
Obtained by hot water suspension method
PEG44-OES5 block copolymer block copolymer synthesis, self-assembling, and nFIB drug integration.
Similar to PEG-PPS, PEG44-OES5 block copolymers were prepared from activated monomethoxy polyethylene glycol of 2 kDa molecular weight, but the mPEG was conjugated with 5 molar equivalents of ethylene sulfide. The oligomerization reaction of the OES on the PEG chain occurred within minutes after the addition of the monomers, as indicated by the observation of a cloudy suspension in the reaction flask. To avoid over-reaction and irreversible precipitation of OES during chain growth, reactions were promptly stopped by introduction of a large excess of acetic acid providing each OES chain with a free thiol group (-SH). Excess acetic acid was then removed by extensive purification by precipitation in ether. By carefully dosing the ethylene sulfide monomers this way, a highly asymmetric PEG-OES diblock copolymer amphiphile could be prepared; the structure is shown in Figure 1A. Despite the large mass disparity between PEG and OES, the PEG44-OES5 copolymer was found to form fibrillar aggregates in water (Figure 1 B, D, F) that are the result of a crystallization-driven self-assembly, where the hydrophobic mass fraction and the relative core crystallinity determine the geometry, the length, and the width of the formed nanofibrils63. From the analysis of cryo-TEM images, we estimated that the fibrils have a length of around 1 μm and a diameter of a few nanometers (~5 nm) (Figure 1D, F). As discussed above, cryo-TEM only allows the imaging and quantification of the hydrophobic chains and not those of the hydrophilic PEG chains. Because of the nanometer range of their diameter, these fibrils can be classified as nanofibrils (nFIB).
Although fibril assemblies are mostly designed to serve as scaffolds for tissue engineering, here, we investigated PEG44-OES5 nFIB as hydrophobic drug carriers and compared them with the PEG44-PPS20 nMIC. We hypothesized that compared to nMIC, nFIB can provide (i) more localized drug delivery in vivo at the implant site because of their morphology (ii) faster drug release because of their smaller hydrophobic core. The traditional coSE method used for nMIC and CsA-nMIC formulations has been applied here for nFIB and CsA-nFIB. However, with this method, only a relatively limited amount of cargo could be incorporated into nFIB, even at high polymer to drug mass ratio (e.g., CsA 2 mg / PEG44-OES5 40 mg). This is because the short length, the high hydrophobicity and crystallinity of the OES blocks cause the PEG44-OES5 self-assembly to happen too fast in water (before the cosolvent can evaporate), which does not allow sufficient time for drug incorporation resulting in drug precipitation. Hence, for nFIBs, we explored a different strategy to improve the drug loading efficiency. We evaluated the HWS method29, which consists in (i) pre-warming the polymer and the drug together at 60°C, and (ii) resuspending the mixture in hot water without the presence of an organic phase. Heating of the polymer and drug together might force the hydrophobic cargo molecules to associate with the hydrophobic chains of the PEG44-OES5. Therefore, upon addition of water, the drug is incorporated into the nFIB cores more rapidly and with higher efficiency than achievable by the cosolvent evaporation method (Table 2). At the same drug:polymer mass ratio (1 to 20), the encapsulation efficiency into the nFIB increased from 22% obtained with the coSE, to 38% with the HWS (Table 1) and the total average amount of drug encapsulated went from 0.44 mg/ml to 1.5 mg/mL. Hence, with the HWS, CsA could be solubilized in water at 1.3 to 2 mg/mL level in presence of PEG44-OES5 nFIB, again an about 100-fold increased versus CsA in pure water.
Furthermore, HPLC analysis confirmed that the amount of CsA loaded in the nMIC and nFIB at different times after storage was comparable to time zero. Thus, CsA-nMIC and CsA-nFIB do not need to be prepared freshly for each experiment, and, if stored under appropriate conditions, can last for months without releasing their payload (CsA), which is particularly attractive for prospective clinical applications. Also, the cryoTEM analysis of CsA-loaded nMIC and nFIB morphology (Figure 1 E–F and Figure S2) and parallel HPLC analysis of CsA content performed more than one week after sample preparations confirmed no nanomaterial aggregation. These findings are in agreement with the long shelf-stability in inert conditions reported for PEG-PPS nanomicelles (up to 6 months)64 and PEG-OES nanofibrils (more than 100 days)30.
In vitro release kinetic of CsA from nMIC and nFIB.
Next, we compared the release kinetics of CsA-nMIC and CsA-nFIB under sink conditions using a standard dialysis method and RP-HPLC-based quantification. The dialysis method is commonly used to study drug release kinetics in vitro, including for hydrophobic drugs. During the release study, conditions were maintained so as to keep the total amount of drug in the system below its maximum solubility in water at room temperature (total amount of CsA here is in the 2 to 10 μg/mL range). Furthermore, water was periodically changed every 24 hours, and the molecular weight cut-off (MWCO) of the dialysis membrane was much larger than the molecular weight of CsA. Therefore, premature CsA precipitation with this release method is unlikely, and the membrane should not present a diffusion barrier. For comparability, three formulations were tested here: CsA-nMIC and CsA-nFIB prepared by cosolvent evaporation method (co-SE) plus CsA-nFIB prepared by hot water suspension method (HWS). All DIANAs released CsA with a first-order release kinetics following a corresponding exponential pattern (Figure 1G). However, release from nMIC was slower and lasted for up to 2 weeks, while that from nFIB, prepared by either co-SE or HWS, was faster with the first order constants (k) being about 4 times larger. Because of the hydrophobicity of the PPS and OES blocks, the critical aggregation concentrations (CACs) of the block copolymers are low, and the assemblies that were formed were correspondingly stable. In some assemblies, the mobility of the hydrophobic domains can be so low that the core can be considered to be completely frozen. We believe that this accounts to a good degree for the prolonged release of the hydrophobic drug from nMIC under sink conditions29, 36. In contrast, release from nFIB is probably faster because of the small diameter of the fibril hydrophobic core resulting in smaller diffusion distances. Longer ethylene sulfide oligomer chains could slow down the drug release kinetics for PEG-OES polymers. However, extending the degrees of ethylene sulfide polymerization beyond 7 molar equivalents caused irreversible in situ precipitation during chain growth30; hence, they could not be explored.
Overall, the CsA in vitro release from the present nMICs and nFIBs were similar to those from other nanoparticle systems being somewhat slower and more sustained65, 66. In particular, the 14-days CsA sustained release obtained with nMIC in vitro make those DIANA highly promising for clinical applications. No significant differences compared to the release profiles obtained in water (P values 0.33 and 0.92 for nMIC and nFIB respectively) were observed in PBS (Figure S3).
Further increase in the retention of CsA in nMIC and nFIB for even more prolonged release might be achieved in the future by increasing the density of the hydrophobic core of nanomicelles29 and nanofibrils53.
nMIC and nFIB in vitro toxicity.
The lack of toxicity of nMIC and nFIB was confirmed in vitro using primary human islets, which represent a particularly relevant model for clinical translatability to T1D therapies, via standard viability tests (LIVE/DEAD assay) and functional assays (glucose-stimulated insulin secretion, GSIS). The effect on islet functionality was evaluated also in presence of free CsA and CsA-loaded DIANAs. No decrease in the viability of islets treated with either nMIC or nFIB for 24 h was observed by confocal microscopy after live/dead cell staining and confocal imaging (Figure 2A). Furthermore, we found that the islet function (GSIS) was not reduced by treatments with nMIC (Figure 2B, plain blue) and nFIB (Figure 2B, plain purple), demonstrating their safety. Also, CsA-loaded nMIC (Figure 2B, patterned blue) and nFIB (Figure 2B, patterned purple) showed no effect on glucose stimulation index compared to untreated islets (Figure 2B, plain green), while islets treated with free CsA suffered functional impairment (Figure 2B, plain orange). Thus, nMIC and nFIB are promising DIANAs for LISAI in pancreatic β-cell replacement therapies because of their ability to provide sustained drug release and achieve local concentrations of the drug that are in the effective, but not yet in toxic range. The lack of toxicity of nMIC and nFIB on insulin-secreting cells was demonstrated also using MIN6 cells, which have glucose metabolism and GSIS resembling those of primary β-cells67,68, while reducing costs and variability compared to primary human islets (Figure S4).
Figure 2. Human islet viability and function are not affected significantly by nMIC and nFIB in vitro.
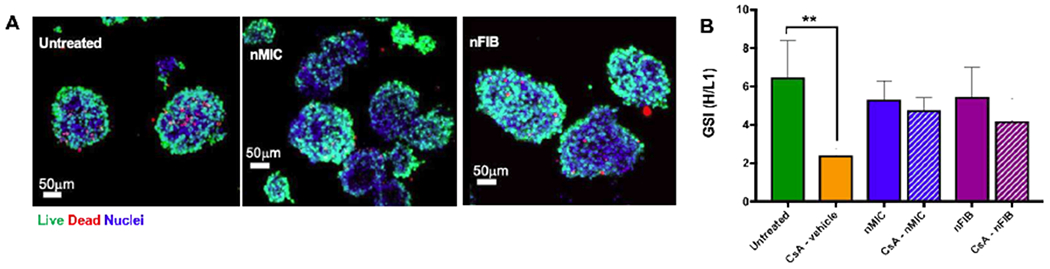
The viability (A) of human pancreatic islets 24 hours after incubation with 0.1 mg/mL of nMIC or nFIB was assessed by live/dead staining and confocal microscopy (green: live cells, red: dead cells). The functionality (B) was assessed by GSIS stimulation indices (GSI) of cells treated with 1.0 μg/mL of free CsA in methanol (plain orange), CsA-nMIC (patterned blue) and CsA-nFIB (patterned purple) compared to untreated control cells. The effect of nanomaterials alone on the islet functionality was also tested by treating them with empty nMIC (plain blue) and empty nFIB (plain purple).
nMIC and nFIB CsA release effects in vitro.
Activation inhibition of diabetogenic CD8+ T cells.
As a first assay to test the efficacy of our formulations, we measured the ability of CsA-nMIC and CsA-nFIB to inhibit the proliferation of insulin-reactive CD8+ T cells isolated from G9Calpha−/− NOD mice41 and stimulated with the INS B15-23 peptide. In this model, when splenocytes were stimulated with the INS B15-23 peptide (Figure 3, green) and treated with vehicle, empty nMIC, or empty nFIB (orange, blue, and purple, respectively), CD8+ T cells proliferated through at least 5 generations (Figure 3A) as compared to controls, whereas splenocytes that were not stimulated did not proliferate (Figure 3, grey). The vehicle for unformulated CsA, methanol, did not show negative effects on cell proliferation because of its high dilution in the aqueous phase. On the other hand, the proliferation of insulin-reactive CD8+ T cells was inhibited by treating the stimulated splenocytes with CsA-nMIC and CsA-nFIB, as shown by the lack of CellTrace dilution (Figure 3A) and by the reduced number of proliferated CD8+T cells (Figure 3B, blue and purple circles, respectively). As mentioned above, unloaded nMIC and nFIB (at 0.1 mg/mL) did not significantly inhibit T cell proliferation induced by INS B15-23 stimulation (Figure 3A and B, blue and purple squares respectively), suggesting that the observed inhibition is due to the sustained release of CsA over three days. Although nFIBs contain lower amount of initial CsA than nMICs, they showed similar efficacy presumably due to their faster release-kinetics in vitro (Figure 1G) and/or more efficient cell internalization. These may result in delivering drug amounts comparable to those delivered by the nMICs. In a separate experiment, we adjusted the total concentration of CsA at 1.0 μg/mL and 0.1 μg/mL for all tested formulations. Inhibition of T cells proliferation occurred very efficiently with no difference between nMIC, nFIB, and free CsA three days after treatments (Figure S5). Efficient DIANA internalization into stimulated T cells in vitro and release of CsA at levels within the therapeutic range despite the low concentration could account for these findings. Although this seems in contrast to the effect observed on pancreatic islets functionality after 24 hours where the toxic effect of CsA was reduced by its inclusion in nMIC and nFIB (Figure 2B), it is due to the fact that (1) stimulated T cells here were incubated for three days with the treatments, so that more CsA was released from nMIC and nFIB than during the one day incubation of islets; and (2) the initial doses of CsA-loaded particles were selected such that the released CsA amounts were effective but non-toxic.
Figure 3. CsA-nMIC and CsA-nFIB inhibition of diabetogenic T cell activation.
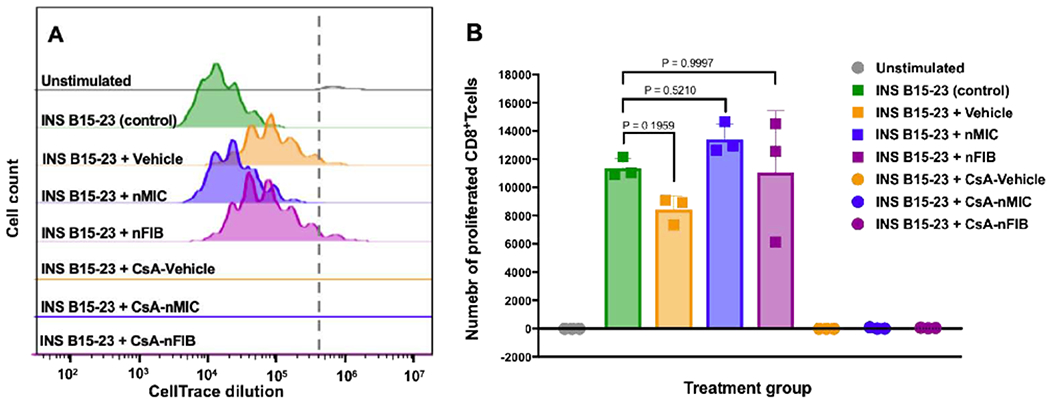
Splenocytes from TCR transgenic G9Calpha−/− NOD mice with insulin-reactive CD8 T cells specific to the low avidity INS B15-23 peptide were labeled with CellTrace and stimulated in vitro with 40 μg/mL INS B15-23. Simultaneously, they were treated with 0.1 mg/mL of unloaded nMIC (blue, histogram in A, and squares in B), unloaded nFIB (purple, histogram in A and squares in B), CsA-nMIC (blue, line in A and circles in B), CsA-nFIB (purple, line in A and circles in B), CsA-vehicle (orange, line in A and circles in B), or vehicle alone (orange, histogram in A and squares in B ) for 3 days. One batch was left untreated to serve as stimulated control (green), and one was unstimulated to serve as negative control (grey). Splenocytes were harvested and stained for LIVE/DEAD and with anti-CD3, anti-CD4 and anti-CD8 to quantify the number of proliferated CD8+T cells. The flow cytometry plots (A) show the CD8+T cell proliferation via CellTrace dilution, and the number of CD8+T cells that proliferated is shown in (B) for each treatment group. Results shown refer to live CD3+ CD4− CD8+ proliferated cells. P values in (B) indicate non-significant difference between indicated groups. n=3.
We concluded that nMIC and nFIB are able (1) to load and deliver CsA without impairing the drug pharmacological effects and (2) to suppress diabetogenic T cell activation even at CsA concentrations lower than those reported so far to our knowledge for CsA-nanocarriers69, 70. We hypothesized that this is mediated by CsA-nMIC and CsA-nFIB inhibition of calcineurin preventing NFAT activation and subsequent cell proliferation71, 72. These results support the potential applicability of our CsA-carrying DIANAs in vivo in allogeneic cell transplantation models for T1D.
Inhibition of NFAT activation in Jurkat cells.
To demonstrate that CsA-nMIC and CsA-nFIB directly inhibit calcineurin-dependent NFAT activation in T cells, we tested them in a Jurkat-Lucia NFAT reporter cell line. For this, we used a CsA concentration range around the half-maximal concentrations (IC50) of CsA for inhibiting calcineurin (≈10 ng/mL in human and mouse leucocyte suspensions)42, and we also selected CsA-nMIC and CsA-nFIB dilutions estimated to deliver daily doses that are likely to be in an effective range and similar to each other. We confirmed inhibition of calcineurin in these cells by free CsA (CsA-vehicle), with results that were in agreement with this IC50 (Figure 4A and B, orange). CsA delivered from either nMIC (Figure 4A, blue) or nFIB (Figure 4B, purple) was able to strongly inhibit NFAT activation in a concentration-dependent manner, confirming again that both of our DIANAs are capable of releasing their payload into the cells to modulate their calcineurin activity. Furthermore, CsA-nMIC and CsA-nFIB were also able to significantly inhibit NFAT activation in a concentration-dependent manner and more efficiently than previously reported for other nanoparticles61, 73 even after being pre-dialyzed in PBS for 3 and 2 days, respectively (Figure 4A, light blue and B, pink), they demonstrated a continued and sustained release of CsA, a key feature for a successful LISAI regimen. Empty nMIC and nFIB (Figures 4A, midnight blue, and B, grape), applied as treatment controls, showed a tendency to decrease activation at higher concentrations, possibly due to interference of nanomaterials with the assay readout. Cell viability was not affected as proven by the MTS assay (Supplementary Information, Figure S6). Overall, these results demonstrate that, in the context of effective CsA available to cells, both CsA-nMIC and CsA-nFIB have efficacy comparable to that of free unformulated CsA. In fact, considering that with DIANAs only ~20% of CsA is released during the first 24 h, whereas the entire amount is immediately with free CsA, CsA-nMIC 4 ng/mL and CsA-nFIB 7.5 ng/mL are expected to be roughly equieffective with free CsA 1 ng/mL, which is indeed the case (Figure 4). Furthermore, nMIC and nFIB provide sustained release of CsA as the cells treated with pre-dialyzed samples showed consistent and statistically significant reduction of NFAT activation compared to positive controls.
Figure 4. CsA-nMIC and CsA-nFIB inhibition of NFAT signaling in Jurkat cells.
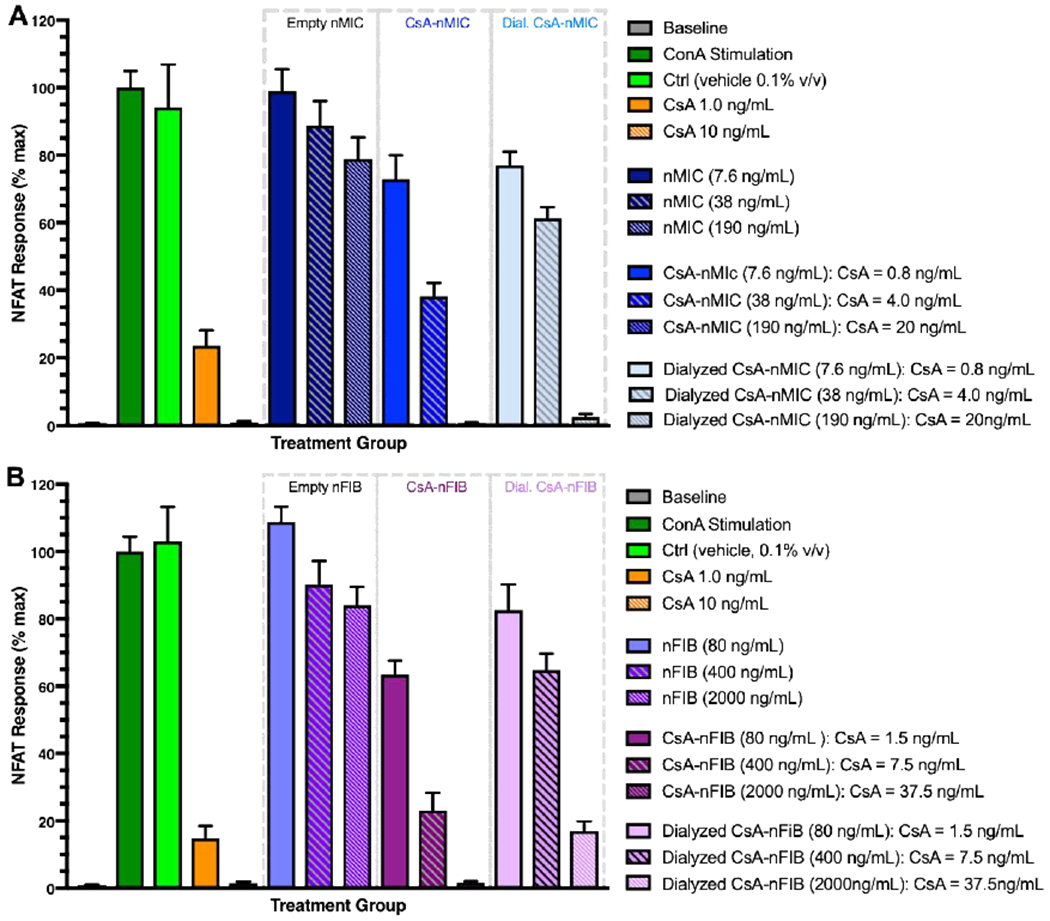
Jurkat cells were stimulated with 25 μg/mL of ConA and treated with different concentrations of CsA-vehicle (orange), (A) CsA-nMIC (blue), dialyzed CsA-nMIC (light blue), (B) CsA-nFIB (purple), or dialyzed CsA-nFIB (pink). Unloaded nMIC (midnight blue), unloaded nFIB (grape), and vehicle alone (methanol, light green) were used as controls. After 24 hours, NFAT activation was quantified by luminescence of cell supernatant and compared with ConA-stimulated untreated cells as reference (100%; dark green). Dilution 1, 2, and 3 indicate increasing concentrations of DIANA and CsA; the total amount of CsA contained in each formulation at the start of the treatment is shown in the legends (they were selected so as to deliver daily doses that are likely to be in an effective range and similar to each other). Data are mean ± SD for n = 3 independent experiments, each in triplicate.
In vitro T cells uptake of fluorescently labeled nMIC and nFIB.
Inhibition of diabetogenic T cell proliferation and NFAT Jurkat cell activation by treatment with CsA-nMIC and CsA-nFIB suggest that both nMIC and nFIB can carry CsA into the T cells in vitro and release their content intracellularly. Due to their small size, it is likely that both DIANAs can also efficiently target T cells in LNs21. However, we hypothesized that the different morphology of the DIANAs influences the efficiency of their cellular uptake, and consequently, their intracellular drug delivery. To elucidate this, we have labeled nMIC and nFIB with the far red lipophilic carbocyanine DiD. Given the nature of these block copolymers , in which the PPS or OES portions are very hydrophobic –more than classical block copolymers (e.g., Pluronic)74, the highly lipophilic DiD has been shown to be retained in the nanoparticle core, to not be released in the media and to not diffuse into the cell membranes unless the nanoparticles are actively taken up by the cells (Figure S7). Thus, DiD can be used to label the hydrophobic core of the nanoparticles75, 76, and here, it served to test nMIC and nFIB cellular uptake. Therefore, we incubated DiD-nMIC and DiD-nFIB with activated GFP-expressing and activated diabetogenic T cells for confocal imaging and for flow cytometry analysis, respectively. Colocalization of GFP and DiD fluorescence as visualized with confocal microscopy indicated higher uptake of DiD-nFIB into activated T cells in vitro, as compared to DiD-nMIC, 3 days after incubation (Figure 5D). Further confirmation was obtained by flow cytometry analysis at different time points. We found that almost 60% of T cells were DiD positive 6 hours after treatment with DiD-nFIB (Figure 5A) and 24 hours after treatment with DiD-nMIC (Figure 5C). Similarly, in other cell subpopulations (B cells, macrophages, and DCs), the percentage of DiD-nFIB positive cells reached almost 100% in 6 hours, while it increased over time for the DiD-nMIC treatment reaching 20% in B cells and 40% in macrophages or dendritic cells (Figure 5 A–C). These results confirm that the fibril shape enhances cell endocytosis of the nanoparticles in vitro, most likely by establishing multisite contact with the cell surfaces as previously reported33.
Figure 5: In vitro T cell uptake of fluorescently labeled nMIC and nFIB.
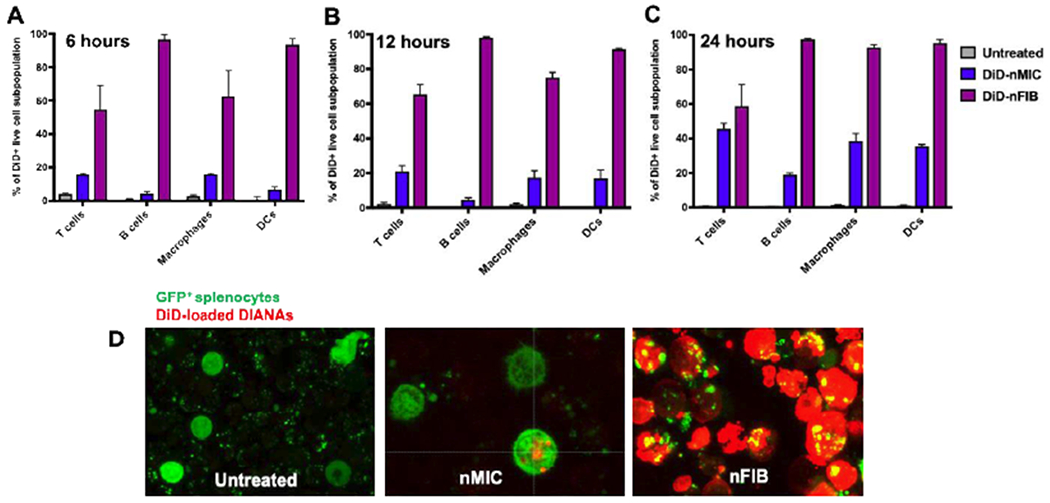
(A-C) Splenocytes from NOD mice were stimulated in vitro with anti-CD3. Simultaneously, they were treated with DiD-labeled nMIC (blue) and DiD-labeled nFIB (purple), for 6 (A), 12 (B), and 24 (C) hours. After each time point, cells were washed and processed for flow cytometry analysis to evaluate fluorescence distribution in the cell subpopulations. Graphs show the relative percentage of different spleen cell subpopulations that were positive for DiD-DIANA. DIANAs uptake and cargo delivery by the different cell subpopulations was identified from live DiD+ cells based on surface marker expression: T cells (CD3+), B cells (B220+), DCs (CD11c+ CD11b+), and macrophages (F4/80+ CD11b+). Data are mean ± SD (n = 3). (D) GFP expressing splenocytes activated with anti-CD3 were treated with DiD-labeled nMIC and DiD-labeled nFIB and confocal images were taken after 3 days.
In vivo optical whole-body imaging and LN targeting of fluorescent nMIC and nFIB.
The spatiotemporal distribution of DiD-labeled DIANAs and, hence, the potential of nMIC and nFIB to locally deliver their cargos, which is critical to reduce the side effects of systemic immunosuppression, was evaluated through IVIS® live imaging after s.c. injection of DiD-nMIC and DiD-nFIB in the right hind limb of nude mice. Longitudinal imaging of the fluorescence signal distribution revealed that nMIC and nFIB are mostly dispersed at the injection site, and they can be detected for at least 6 days (Figure 6A). However, nMIC fluorescence intensity at the site of injection already started to decrease after 2 hours, and by 24 hours nMIC were able to diffuse away from the injection site and reach organs that are farther away (Figure 6A, B contralateral and B distal). In contrast, nFIB remained localized at the site of administration for at least 6 hours after injection (Figure 5A and B ipsilateral) showing increased diffusion later, but without reaching contralateral or distal sites. This effect is probably due to the higher interstitial and lymphatic transport ability of nMIC as compared to nFIB due to their spherical shape and very small size. We hypothesize that the elongated shape of nFIB and the chain entanglements, which increase the sensitivity to flow forces 33, 34, slowed down the circulation of the nFIB. The different morphology of these DIANAs could explain the more localized distribution seen for the DiD-nFIB compared to DiD-nMIC, which were able to reach organs farther from the site of injection by 24 h (Figure 6A, B contralateral and B distal).
Figure 6. In vivo time-dependent optical whole-body imaging of DiD-nMIC and DiD-nFIB.
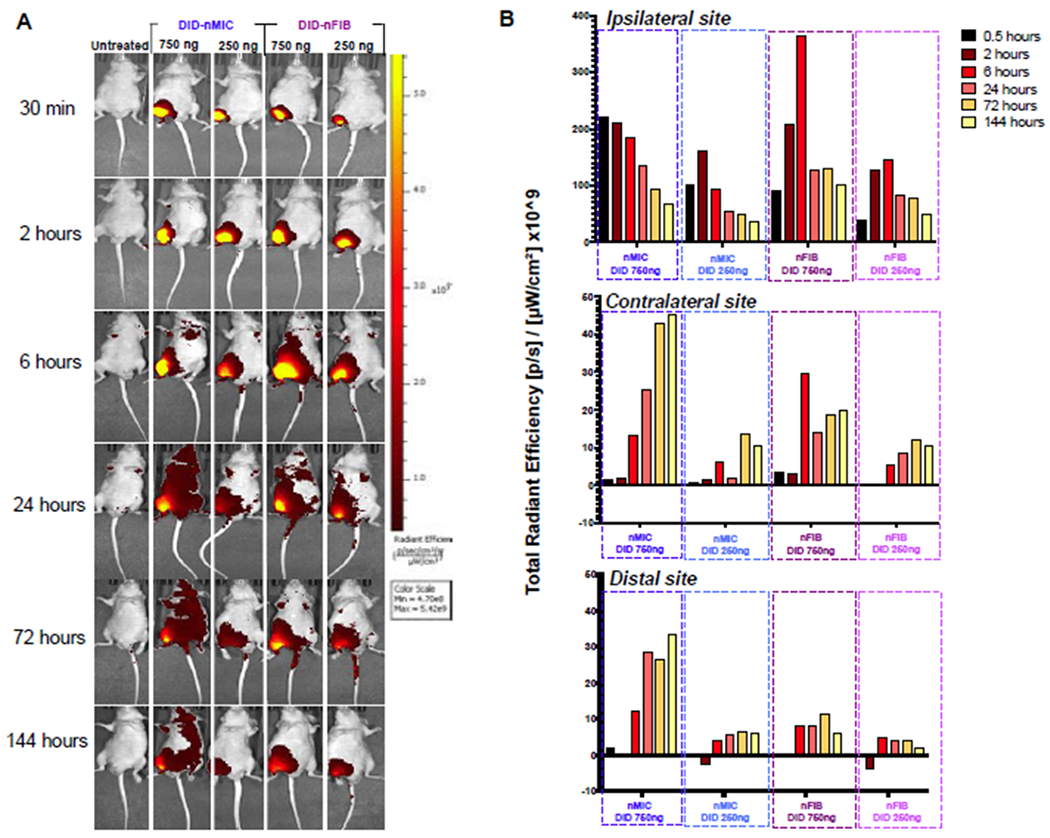
The far-red fluorescent lipophilic carbocyanine (DiD) compound was used to label nMIC and nFIB to quantify nanomaterial biodistribution through live imaging. Nude mice received a subcutaneous (s.c.) injection of either DiD-nMIC or DiD-nFIB in the right hind limb, both at two different doses: 3 μL (containing 750 ng DiD) and 1 μL (containing 250 ng DiD). (A) Biodistribution as observed at 0.5, 2, 6, 24, 72, and 144 hours by IVIS® live fluorescence imaging. (B) DiD fluorescence intensity for the right hind limb (ipsilateral, upper graph), the left hind limb (contralateral, middle graph) and the left forelimb (distal, bottom graph) sites, as quantified using a Living Image software with the region of interest (ROI) tool and baseline-normalized compared to the untreated mouse. Both nMic and nFIB distribute DiD locally around the site of injection and provide sustained release with fluorescence being present for >6 days after injection. However, while nFIB provided more localized delivery, nMIC were able to reach organs farther from the site of injection.
To confirm the differential LN targeting of nMIC and nFIB in vivo, we investigated the distribution of DiD-labeled nMIC and nFIB in the proximal and distal nodes of C57BL/6 mice after injection of a high dose of DiD-nMIC and DiD-nFIB in the right hind limb (f.p.). We quantified mean fluorescence intensity (MFI) in cells collected from the ipsilateral pLNs vs. contralateral pLNs and distal axLNs using flow cytometry (Figure 7A, B). We indeed found that both nMIC and nFIB can reach the ipsilateral pLN (Figure 7B and Figure S8A). Wheras DiD-nMIC could also target the contralateral pLNs and the distal axLN, DiD-nFIB preferentially targeted the ipsilateral pLN, as shown by a 50% decrease in fluorescence intensity in cells from the distal axLN and contralateral pLN respect to the ipsilateral pLN. This confirms that nFIB trafficking in body fluids is slower than the nMIC because of their elongated shape33. Therefore, the nFIB are more localized than nMIC, and are mostly uptaken into LN cells that are proximal to the site of administration. Thus, nFIB represents a promising drug delivery system for a more localized treatment. We also investigated by flow cytometry what proportion of the different cells residing in the LNs captured the DiD-nMIC and nFIB. We found that most of the LN-resident immune cells, including T cells, are able to uptake the DIANAs (Figure 7C and Figure S8B), confirming that our DIANAs can also target the T cells, in addition to antigen presenting cells (APCs)16, 20, thanks to their ultra-small size21. It has been widely reported that larger (500–2,000 nm) materials are preferentially taken up by APCs, particularly dendritic cells, at the injection site, whereas smaller particles (20–200 nm) are trafficked directly to the lymphatics and enter into lymph nodes. In the lymph nodes, larger particles are typically taken up by subcapsular macrophages, whereas smaller particles, such as nMIC and nFIB, are passively transported into the B or T cell zones through the lymphatic sinus and conduits21.
In vivo inhibition of alloantigen-induced immune response.
To demonstrate that these DIANAs can be used for T cell immunomodulation, we used a rodent model where alloantigen stimulation induces cellular expansion of the draining LN77, 78. We tested whether CsA-nMIC and CsA-nFIB local treatment could inhibit the allogeneic responses-mediated LN cell expansion in the pLNs that drained the allograft in mice (Figure 8).
Splenocytes isolated from DBA-2 mice were injected into the footpad of Balb/c recipients, and this minor mismatch allograft led to an approximate 7-fold increase in the numbers of cells in the draining pLN within 4 days in untreated mice (Figure 8B). This popliteal LN cell expansion was significantly inhibited by 15 mg/kg CsA-vehicle when it was administered s.c. (in the neck space) daily for a total of 5 administrations (and a total dose of 75 mg/kg; Figure 8A and 8B, orange), but not when the same dose was administered only twice (on day −1 and 1) (Figure 8A and 8B, red). In contrast, treatment with the same dose (15 mg/kg) of CsA-nMIC (administered either directly in the foot pad or s.c. in the right hind limb; Figure 8A, blue, and 8C) or CsA-nFIB (administered s.c. in the right hind limb; Figure 8A, purple, and 8D) was able to inhibit pLN cell expansion even when administered only twice (day −1 and 1, total dose of treatment: 30 mg/kg). Doubling the CsA dose to 30 mg/kg did not significantly increase the inhibition of pLN expansion, suggesting that a CsA dose of 15 mg/kg per injection was sufficient to achieve a therapeutic effect. The total number of activated CD44+ CD4+ T cells obtained from each pLN after treatment with CsA-vehicle, CsA-nMIC, and CsA-nFIB (Figure S8), and quantified by flow cytometry analysis of pLN cell suspensions, demonstrated a concordant inhibition of alloantigen-induced T cells activation by DIANA-delivered CsA. For CsA-nMIC, we could test administration into both the foot pad (where space and injection volumes are restricted) and s.c. sites, because of the higher solubility of the CsA in nMIC allowed smaller injection volumes so that even a higher dose (30 mg/kg) could be tested s.c.. Administration of CsA-nFIB in the foot pad was not possible because of the injection volume needed to reach even the lowest CsA dose (15 mg/kg).
These results suggest that CsA-nMIC and CsA-nFIB can increase CsA bioavailability 2.5 folds compared to CsA-vehicle by improving CsA solubility and providing more localized and sustained drug release. Freely administered CsA required 5 times dosing to be effective, while the nanomaterial formulations only required 2 doses (Figure 8A and Figure 8B orange columns, solid and patterned). If free CsA is injected only twice, either in the neck or in the limb, it does not significantly reduce the allogeneic immune response compared to controls (Figure 8B, solid red and yellow). Therefore, DIANAs allow reducing CsA dose and number of administrations. Furthermore, the use of nMIC or nFIB as carriers for CsA can eliminate the need for CsA-solubilizing agents (e.g., cremophor EL, ethanol, methanol etc.) that are associated with considerable toxicity and side-effects. Hence, the use of DIANAs can have important implications in decreasing the side effects associated with chronic and systemic CsA treatment.
In vivo local inhibition of alloantigen-induced immune response.
Although nMICs can load higher amounts of CsA than nFIBs (Table 2), representing a better choice for solubilization of hydrophobic drugs like CsA, nFIBs might have other therapeutic advantages due to their unique morphology. The OES chains in the nFIB cores are tightly packed due to their high hydrophobicity and crystallinity that drives also the formation of elongated fibril structures. This elongated nature of nFIBs, compared to the spherical and homogeneous shape of the nMIC, seems to be the key for slower circulation and lymphatic drainage and more localized distribution of the nFIB into the ipsilateral LN cells (Figure 6 and Figure 7). Furthermore, the OES intra- and inter-chain interactions through disulfide bonds may increase nFIB stability and promote even more nFIB tissue retention for a more localized therapeutic action as suggested by our data with DiD-nFIB (Figure 7). To investigate this possibility in a therapeutic model, we modified our alloantigen-induced immune response model in mice. For these experiments, both hind limbs were challenged with DBA-2 splenocytes, but only the right one was treated with s.c. injections of 15 mg/kg CsA-vehicle, CsA-nMIC, CsA-nFIB or left untreated (Figure 9A). In untreated mice, both graft-draining pLNs experienced cell expansion compared to mice that did not receive allogeneic cell injections (Figure 9B, gray). Treatment with either CsA-vehicle or CsA-nMIC in the right limb inhibited LN cell expansion in the graft-draining ipsilateral pLN and contralateral pLN. Treatment with CsA-nFIB inhibited the alloantigen immune response only in the ipsilateral pLN with numbers in the contralateral pLN being comparable to those of the untreated mice. These results provided further evidence that the pharmacological effects of CsA delivered from nFIBs are localized to the injection site. Thus, nFIBs represent a drug delivery system for LISAI regimens that could be beneficial in cell and tissue transplantation, tumor treatments, and other applications.
Figure 9. Inhibition of alloresponses in contralateral pLN versus ipsilateral pLN in mice.
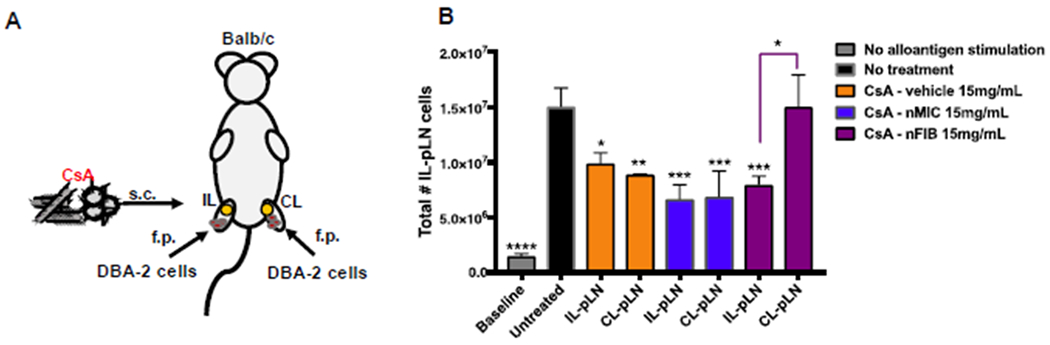
(A) Schematic of the experimental design. Balb/c mice were injected with 1×10⁷ splenocytes from DBA-2 mice in the foot pad of both the right and left hind limbs and treated s.c. only in the right limb with 15 mg/kg CsA-vehicle, CsA-nMIC, or CsA-nFIB on day −1 and 1 after allogeneic cell injection. The contralateral popliteal LN (CL-pLNs) and the ipsilateral popliteal LN (IL-pLNs) were harvested 4 days after the alloantigen challenge. (B) The total number of live cells isolated from each LN as quantified by flow cytometry. Data are mean ± SD (n = 3). Asterisk indicate significant differences versus untreated control or as indicated (*p<0.05, **p<0.01, ***p<0.001; one-way ANOVA followed by Dunnett’s multiple comparison test).
CONCLUSIONS
We found that the DIANAs explored here, PEG44-PPS20 nMIC and PEG44-OES5 nFIB, improved the solubilization and provided a more sustained and localized release of CsA compared to unformulated controls both in vitro and in vivo. Drug solubilization and the spatiotemporal characteristics of release were dependent on the chemical compositions and the chain lengths of the nanomaterial hydrophobic cores. nMIC provided one of the most efficient solubilization in water reported so far for CsA, a hydrophobic and potent immunosuppressant drug used in various therapeutic applications including tissue and cell transplantation. nMIC also provided sustained drug release at clinical levels for up to two weeks in vitro and reduced the dose and the administration frequency needed for therapeutic efficacy in vivo. nFIB demonstrated lower drug encapsulation efficiency and faster release in vitro, but also higher cellular internalization efficiency in vitro thanks to the multisite contact with the cell surface already mentioned in this report. In vivo, nFIB provided more localized drug release than nMIC, also reducing administration frequency needs. Thus, while both DIANAs can be used for drug delivery and are expected to reduce or even avoid systemic side effects due to less frequent administrations and sustained localized drug release, nFIB are more indicated for localized delivery approaches. For possible applications in islet transplantation for treatment of T1D, we showed that both nMIC and nFIB can deliver CsA to suppress activation of diabetogenic cytotoxic T cells, and, unlike free CsA, they do not negatively affect the viability and functionality of insulin-producing cells. Hence, these DIANAs provide chemically customizable and versatile drug delivery platforms for hydrophobic therapeutic agents for a variety of applications, and they warrant further investigation for localized immunosuppression in cell and organ transplantation and for T1D.
Supplementary Material
Figure S1: 1HNMR analysis of synthesized polymers.
Figure S2: CryoTEM analysis of HWS nFIB with and without CsA.
Figure S3: In vitro release kinetic of CsA from nMIC and nFIB in PBS
Figure S4: MIN6 viability and functionality after treatment with nMIC and nFIB.
Figure S5: CsA-nMIC and CsA-nFIB inhibition of T cell activation using equalized concentration of CsA.
Figure S6: Viability test on Jurkat cells treated with unloaded and CsA-containing DIANAs.
Figure S7: DiD retention in nMIC and nFIB.
Figure S8: Flow cytometry analysis of the CsA-containing DIANAs inhibition of T cell activation during allo-responses in Balb/c mice.
Figure S9: Uptake of DiD labeled DIANAs by LN-resident cells.
Scheme S1: Synthetic pathways for PEG44-PPS20-pds and PEG44-OES5-SH.
HIGHLIGHTS.
Drug-Integrating Amphiphilic Nanomaterial Assemblies (DIANA) made from PEG-PPS and PEG-OES block-copolymers solubilize cyclosporine A and provide more sustained and localized delivery.
DIANAs are efficiently up taken by T cells in vitro and in vivo in the lymph-nodes, because of their very small size.
The shape and size of DIANAs influence the spatiotemporal drug delivery: nanomicelles solubilize high amounts of hydrophobic drugs; nanofibrils enhance cellular uptake and promote local retention due to slow trafficking.
Nanofibrils are more indicated for localized delivery approaches.
DIANAs can reduce or avoid systemic side effects due to less frequent administrations and localized drug release.
ACKNOWLEDGMENT
We thank Dr. Susan Wong of Cardiff University (UK) for providing the G9Calpha−/− NOD mouse colony used for the in vitro study of insulin-reactive T cell proliferation inhibition, and for critically reading the manuscript.
We thank Prof. Françisco Raymo of University of Miami (US) for granting access to NMR laboratory of the Department of Chemistry.
We thank Dr. Davide Demurtas at the Interdisciplinary Centre of Electron Microscopy of the EPFL (Lausanne, CH) for performing cryo-TEM imaging.
Funding Sources
Parts of this work were supported by grants from the National Institutes of Health (NIH) National Institute of Diabetes and Digestive and Kidney Diseases (NIDDK) (1R01DK109929; Tomei, A. A.) and JDRF (2-SRA-2019-780-S-B; Buchwald, P. and 5-CDA-2016-171-S-B; Tomei, A.).
ABBREVIATIONS
- Co-SE
cosolvent evaporation
- CsA
cyclosporine A
- DIANA
drug-integrating amphiphilic nanomaterial assemblies
- GSIS
glucose-stimulated insulin secretion
- HWS
hot water suspension
- LISAI
localized immunosuppression and anti-inflammatory
- LN
lymph node
- nFIB
nanofibrils
- nMIC
nanomicelles
- OES
oligo(ethylene sulfide)
- PEG
poly(ethylene glycol)
- PPS
poly(propylene sulfide)
- T1D
type 1 diabetes
Footnotes
Publisher's Disclaimer: This is a PDF file of an unedited manuscript that has been accepted for publication. As a service to our customers we are providing this early version of the manuscript. The manuscript will undergo copyediting, typesetting, and review of the resulting proof before it is published in its final form. Please note that during the production process errors may be discovered which could affect the content, and all legal disclaimers that apply to the journal pertain.
The authors declare the following competing financial interest(s): D.V. is inventor on patents and patent applications related to these nanomaterials. All other authors declare no competing financial interests.
REFERENCES
- 1.Folkman J; Long DM Jr.; Rosenbaum R, Silicone rubber: a new diffusion property useful for general anesthesia. Science 1966, 154 (3745), 148–9. [DOI] [PubMed] [Google Scholar]
- 2.Zaffaroni A, Systems for controlled drug delivery. Med Res Rev 1981, 1 (4), 373–86. [DOI] [PubMed] [Google Scholar]
- 3.Hoffman AS, The origins and evolution of “controlled” drug delivery systems. J. Controlled Release 2008, 132 (3), 153–163. [DOI] [PubMed] [Google Scholar]
- 4.D’Mello SR; Cruz CN; Chen ML; Kapoor M; Lee SL; Tyner KM, The evolving landscape of drug products containing nanomaterials in the United States. Nat Nanotechnol 2017, 12 (6), 523–529. [DOI] [PubMed] [Google Scholar]
- 5.Velluto D; Ricordi C, Nanotechnology Advances in Drug Delivery. NanoWorld J. 2017, 3(S2), S9–S17. [Google Scholar]
- 6.Green EA; Flavell RA, The initiation of autoimmune diabetes. Curr. Opin. Immunol 1999, 11, 663–669. [DOI] [PubMed] [Google Scholar]
- 7.Atkinson MA; Eisenbarth GS; Michels AW, Type 1 diabetes: new prospectives on disease pathogenesis and treatment. Lancet 2014, 383 (9911), 69–82. [DOI] [PMC free article] [PubMed] [Google Scholar]
- 8.Daneman D, Type 1 diabetes. Lancet 2006, 367 (9513), 847–858. [DOI] [PubMed] [Google Scholar]
- 9.Faustman DL; Davis M, The primacy of CD8 T lymphocytes in type 1 diabetes and implications for therapies. J. Mol. Med 2009, 87 (12), 1173–1178. [DOI] [PubMed] [Google Scholar]
- 10.Johnson JD, The quest to make fully functional human pancreatic beta cells from embryonic stem cells: climbing a mountain in the clouds. Diabetologia 2016, 59, 2047–2057. [DOI] [PubMed] [Google Scholar]
- 11.Mahla RS, Stem cells: applications in regenerative medicine and disease therapeutics. . Int. J. Cell Biol 2016, 694028. [DOI] [PMC free article] [PubMed] [Google Scholar]
- 12.Shapiro AM; Pokrywczynska M; Ricordi C, Clinical pancreatic islet transplantation. Nat Rev Endocrinol 2017, 13 (5), 268–277. [DOI] [PubMed] [Google Scholar]
- 13.Ricordi C; Strom TB, Clinical islet transplantation: advances and immunological challenges. Nat. Rev. Immunol 2004, 4 (4), 259–268. [DOI] [PubMed] [Google Scholar]
- 14.Marzorati S; Bocca N; Molano RD; Hogan AR; Doni M; Cobianchi L; Inverardi L; Ricordi C; Pileggi A, Effects of Systemic Immunosuppression on Islet Engraftment and Function Into a Subcutaneous Biocompatible Device. Transplantation Proceedings 2009, 41 (1), 352–353. [DOI] [PubMed] [Google Scholar]
- 15.Weaver JD; Song Y; Yang EY; Ricordi C; Pileggi A; Buchwald P; Stabler CL, Controlled release of dexamethasone from organosilicone constructs for local modulation of inflammation in islet transplantation. Tissue Eng. Part A 2015, 21, 2250–2261. [DOI] [PubMed] [Google Scholar]
- 16.Dane KY; Nembrini C; Tomei AA; Eby JK; O’Neil CP; Velluto D; Swartz MA; Inverardi L; Hubbell JA, Nano-sized drug-loaded micelles deliver payload to lymph node immune cells and prolong allograft survival. J. Control. Release 2011, 156 (2), 154–160. [DOI] [PubMed] [Google Scholar]
- 17.Reddy ST; Swartz MA; Hubbell JA, Targeting dendritic cells with biomaterials: developing the next generation of vaccines. Trends in Immunology 2006, 27 (12), 573–579. [DOI] [PubMed] [Google Scholar]
- 18.Reddy ST; Van der Vlies AJ; Simeoni E; Angeli V; Randolph GJ; O’Neil CP; Lee LK; Swartz MA; Hubbell JA, Exploiting lymphatic transport and complement activation in nanoparticle vaccines. Nat. Biotechnol 2007, 25 (10), 1159–1164. [DOI] [PubMed] [Google Scholar]
- 19.Dowling DJ; Scott EA; Scheid A; Bergelson I; Joshi S; Pietrasanta C; Brightman S; Sanchez-Schmitz G; Van Haren SD; Ninkovic J; Kats D; Guiducci C; de Titta A; Bonner DK; Hirosue S; Swartz MA; Hubbell JA; Levy O, Toll-like receptor 8 agonist nanoparticles mimic immunomodulating effects of the live BCG vaccine and enhance neonatal innate and adaptive immune responses. J. Allergy Clin. Immunol 2017, 140, 1339–1350. [DOI] [PMC free article] [PubMed] [Google Scholar]
- 20.Manolova V; Flace A; Bauer M; Schwarz K; Saudan P; Bachmann MF, Nanoparticles target distinct dendritic cell populations according to their size. Eur J Immunol 2008, 38 (5), 1404–13. [DOI] [PubMed] [Google Scholar]
- 21.Trevaskis NL; Kaminskas LM; Porter CJ, From sewer to saviour - targeting the lymphatic system to promote drug exposure and activity. Nat Rev Drug Discov 2015, 14 (11), 781–803. [DOI] [PubMed] [Google Scholar]
- 22.Stano A; van der Vlies AJ; Martino MM; Swartz MA; Hubbell JA; Simeoni E, PPS nanoparticles as versatile delivery system to induce systemic and broad mucosal immunity after intranasal administration. Vaccine 2011, 29 (4), 804–12. [DOI] [PubMed] [Google Scholar]
- 23.Thomas SN; van der Vlies AJ; O’Neil CP; Reddy ST; Yu SS; Giorgio TD; Swartz MA; Hubbell JA, Engineering complement activation on polypropylene sulfide vaccine nanoparticles. Biomaterials 2011, 32 (8), 2194–203. [DOI] [PubMed] [Google Scholar]
- 24.Williams HD; Trevaskis NL; Charman SA; Shanker RM; Charman WN; Pouton CW; Porter CJH, Strategies to Address Low Drug Solubility in Discovery and Development. Pharmacol. Rev 2013, 65, 315–499. [DOI] [PubMed] [Google Scholar]
- 25.el Tayar N; Mark AE; Vallat P; Brunne RM; Testa B; van Gunsteren WF, Solvent-dependent conformation and hydrogen-bonding capacity of cyclosporin A: evidence from partition coefficients and molecular dynamics simulations. J Med Chem 1993, 36 (24), 3757–64. [DOI] [PubMed] [Google Scholar]
- 26.Buchwald P; Bodor N, Octanol-water partition: searching for predictive models. Curr Med Chem 1998, 5 (5), 353–80. [PubMed] [Google Scholar]
- 27.Thell K; Hellinger R; Schabbauer G; Gruber CW, Immunosuppressive peptides and their therapeutic applications. Drug Discov Today 2014, 19 (5), 645–53. [DOI] [PMC free article] [PubMed] [Google Scholar]
- 28.Lallemand F; Schmitt M; Bourges JL; Gurny R; Benita S; Garrigue JS, Cyclosporine A delivery to the eye: A comprehensive review of academic and industrial efforts. Eur J Pharm Biopharm 2017, 117, 14–28. [DOI] [PubMed] [Google Scholar]
- 29.Velluto D; Demurtas D; Hubbell JA, PEG-b-PPS diblock copolymer aggregates for hydrophobic drug solubilization and release: cyclosporin A as an example. Mol. Pharm 2008, 5 (4), 632–642. [DOI] [PubMed] [Google Scholar]
- 30.Brubaker CE; Velluto D; Demurtas D; Phelps EA; Hubbell JA, Crystalline Oligo(ethylene sulfide) Domains Define Highly Stable Supramolecular Block Copolymer Assemblies. ACS Nano 2015, 9 (7), 6872–6881. [DOI] [PubMed] [Google Scholar]
- 31.Cerritelli S; Velluto D; Hubbell JA, PEG-SS-PPS: Reduction-Sensitive Disulfide Block Copolymer Vesicles for Intracellular Drug Delivery. Biomacromolecules 2007, 8 (6), 1966–1972. [DOI] [PubMed] [Google Scholar]
- 32.Ling SJ; Kaplan DL; Buehler MJ, Nanofibrils in nature and materials engineering. Nat Rev Mater 2018, 3 (4). [DOI] [PMC free article] [PubMed] [Google Scholar]
- 33.Geng Y; Dalhaimer P; Cai S; Tsai R; Tewari M; Minko T; Discher DE, Shape effects of filaments versus spherical particles in flow and drug delivery. Nat Nanotechnol 2007, 2 (4), 249–55. [DOI] [PMC free article] [PubMed] [Google Scholar]
- 34.Christian DA; Cai S; Garbuzenko OB; Harada T; Zajac AL; Minko T; Discher DE, Flexible filaments for in vivo imaging and delivery: persistent circulation of filomicelles opens the dosage window for sustained tumor shrinkage. Mol Pharm 2009, 6 (5), 1343–52. [DOI] [PMC free article] [PubMed] [Google Scholar]
- 35.Velluto D; Thomas SN; Simeoni E; Swartz MA; Hubbell JA, PEG-b-PPS-b-PEI micelles and PEG-b-PPS/PEG-b-PPS-b-PEI mixed micelles as non-viral vectors for plasmid DNA: tumor immunotoxicity in B16F10 melanoma. Biomaterials 2011, 32 (36), 9839–9847. [DOI] [PubMed] [Google Scholar]
- 36.Cerritelli S; O’Neil CP; Velluto D; Fontana A; Adrian M; Dubochet J; Hubbell JA, Aggregation Behavior of Poly(ethylene glycol-bl-propylene sulfide) Di- and Triblock Copolymers in Aqueous Solution. Langmuir 2009, 25 (19), 11328–11335. [DOI] [PubMed] [Google Scholar]
- 37.Jain S; Bates FS, On the origins of morphological complexity in block copolymer surfactants. Science 2003, 300 (5618), 460–4. [DOI] [PubMed] [Google Scholar]
- 38.Segura T; Schmokel H; Hubbell JA, RNA interference targeting hypoxia inducible factor 1alpha reduces post-operative adhesions in rats. J Surg Res 2007, 141 (2), 162–70. [DOI] [PubMed] [Google Scholar]
- 39.Ricordi C; Lacy PE; Finke EH; Olack BJ; Scharp DW, Automated method for isolation of human pancreatic islets. Diabetes 1988, 37 (4), 413–20. [DOI] [PubMed] [Google Scholar]
- 40.Pileggi A; Ricordi C; Kenyon NS; Froud T; Baidal DA; Kahn A; Selvaggi G; Alejandro R, Twenty years of clinical islet transplantation at the Diabetes Research Institute--University of Miami. Clin Transpl 2004, 177–204. [PubMed] [Google Scholar]
- 41.Wong FS; Siew LK; Scott G; Thomas IJ; Chapman S; Viret C; Wen L, Activation of insulin-reactive CD8 T-cells for development of autoimmune diabetes. Diabetes 2009, 58 (5), 1156–64. [DOI] [PMC free article] [PubMed] [Google Scholar]
- 42.Kung L; Batiuk TD; Palomo-Pinon S; Noujaim J; Helms LM; Halloran PF, Tissue distribution of calcineurin and its sensitivity to inhibition by cyclosporine. Am J Transplant 2001, 1 (4), 325–33. [DOI] [PubMed] [Google Scholar]
- 43.Wallet MA; Flores RR; Wang Y; Yi Z; Kroger CJ; Mathews CE; Earp HS; Matsushima G; Wang B; Tisch R, MerTK regulates thymic selection of autoreactive T cells. Proc Natl Acad Sci U S A 2009, 106 (12), 4810–5. [DOI] [PMC free article] [PubMed] [Google Scholar]
- 44.Wan X; Guloglu FB; Vanmorlan AM; Rowland LM; Zaghouani S; Cascio JA; Dhakal M; Hoeman CM; Zaghouani H, Recovery from overt type 1 diabetes ensues when immune tolerance and beta-cell formation are coupled with regeneration of endothelial cells in the pancreatic islets. Diabetes 2013, 62 (8), 2879–89. [DOI] [PMC free article] [PubMed] [Google Scholar]
- 45.Wassef R; Cohen Z; Langer B, Pharmacokinetic profiles of cyclosporine in rats. Influence of route of administration and dosage. Transplantation 1985, 40 (5), 489–93. [DOI] [PubMed] [Google Scholar]
- 46.Napoli A; Tirelli N; Kilcher G; Hubbell A, New Synthetic Methodologies for Amphiphilic Multiblock Copolymers of Ethylene Glycol and Propylene Sulfide. Macromolecules 2001, 34 (26), 8913–8917. [Google Scholar]
- 47.Yasugi K; Nagasaki Y; Kato M; Kataoka K, Preparation and characterization of polymer micelles from poly(ethylene glycol)-poly(D,L-lactide) block copolymers as potential drug carrier. J Control Release 1999, 62 (1-2), 89–100. [DOI] [PubMed] [Google Scholar]
- 48.Tessmar JK; Gopferich AM, Customized PEG-derived copolymers for tissue-engineering applications. Macromol Biosci 2007, 7 (1), 23–39. [DOI] [PubMed] [Google Scholar]
- 49.Bearinger JP; Terrettaz S; Michel R; Tirelli N; Vogel H; Textor M; Hubbell JA, Chemisorbed poly(propylene sulphide)-based copolymers resist biomolecular interactions. Nat Mater 2003, 2 (4), 259–64. [DOI] [PubMed] [Google Scholar]
- 50.Napoli A; Valentini M; Tirelli N; Muller M; Hubbell JA, Oxidation-responsive polymeric vesicles. Nat Mater 2004, 3 (3), 183–9. [DOI] [PubMed] [Google Scholar]
- 51.Ahmed F; Discher DE, Self-porating polymersomes of PEG-PLA and PEG-PCL: hydrolysis-triggered controlled release vesicles. J Control Release 2004, 96 (1), 37–53. [DOI] [PubMed] [Google Scholar]
- 52.Cerritelli S; Velluto D; Hubbell JA, PEG-SS-PPS: reduction-sensitive disulfide block copolymer vesicles for intracellular drug delivery. Biomacromolecules 2007, 8 (6), 1966–72. [DOI] [PubMed] [Google Scholar]
- 53.Schmelz J; Schacher FH; Schmalz H, Cylindrical crystalline-core micelles: pushing the limits of solution self-assembly. Soft Matter 2013, 9 (7), 2101–2107. [Google Scholar]
- 54.Nicol E; Nicolai T; Durand D, Dynamics of poly(propylene sulfide) studied by dynamic mechanical measurements and dielectric spectroscopy. Macromolecules 1999, 32 (22), 7530–7536. [Google Scholar]
- 55.Cooper W; Hale and , P. T; Walker d. S., Elastomeric block polymers from ethylene sulphide. Polymer 1974, 15, 175–186. [Google Scholar]
- 56.Mondon K; Zeisser-Labouebe M; Gurny R; Moller M, Novel cyclosporin A formulations using MPEG-hexyl-substituted polylactide micelles: a suitability study. Eur J Pharm Biopharm 2011, 77 (1), 56–65. [DOI] [PubMed] [Google Scholar]
- 57.Ismailos G; Reppas C; Dressman JB; Macheras P, Unusual solubility behaviour of cyclosporin A in aqueous media. J Pharm Pharmacol 1991, 43 (4), 287–9. [DOI] [PubMed] [Google Scholar]
- 58.Dubey P; Barker SA; Craig DQM, Design and Characterization of Cyclosporine A-Loaded Nanofibers for Enhanced Drug Dissolution. ACS Omega 2020, 5 (2), 1003–1013. [DOI] [PMC free article] [PubMed] [Google Scholar]
- 59.Aliabadi HM; Brocks DR; Lavasanifar A, Polymeric micelles for the solubilization and delivery of cyclosporine A: pharmacokinetics and biodistribution. Biomaterials 2005, 26 (35), 7251–9. [DOI] [PubMed] [Google Scholar]
- 60.Aliabadi HM; Mahmud A; Sharifabadi AD; Lavasanifar A, Micelles of methoxy poly(ethylene oxide)-b-poly(epsilon-caprolactone) as vehicles for the solubilization and controlled delivery of cyclosporine A. J Control Release 2005, 104 (2), 301–11. [DOI] [PubMed] [Google Scholar]
- 61.Tang L; Azzi J; Kwon M; Mounayar M; Tong R; Yin Q; Moore R; Skartsis N; Fan TM; Abdi R; Cheng J, Immunosuppressive Activity of Size-Controlled PEG-PLGA Nanoparticles Containing Encapsulated Cyclosporine A. J Transplant 2012, 2012, 896141. [DOI] [PMC free article] [PubMed] [Google Scholar]
- 62.Di Tommaso C; Bourges JL; Valamanesh F; Trubitsyn G; Torriglia A; Jeanny JC; Behar-Cohen F; Gurny R; Moller M, Novel micelle carriers for cyclosporin A topical ocular delivery: in vivo cornea penetration, ocular distribution and efficacy studies. Eur J Pharm Biopharm 2012, 81 (2), 257–64. [DOI] [PubMed] [Google Scholar]
- 63.Sun L; Petzetakis N; Pitto-Barry A; Schiller TL; Kirby N; Keddie DJ; Boyd BJ; O’Reilly RK; Dove AP, Tuning the Size of Cylindrical Micelles from Poly(l-lactide)-b-poly(acrylic acid) Diblock Copolymers Based on Crystallization-Driven Self-Assembly. Macromolecules 2013, 46 (22), 9074–9082. [Google Scholar]
- 64.Cerritelli S; Fontana A; Velluto D; Adrian M; Dubochet J; De Maria P; Hubbell JA, Thermodynamic and kinetic effects in the aggregation behavior of a poly(ethylene glycol-b-propylene sulfide-b-ethylene glycol) ABA triblock copolymer. Macromolecules 2005, 38 (18), 7845–7851. [Google Scholar]
- 65.Goyal R; Macri L; Kohn J, Formulation Strategy for the Delivery of Cyclosporine A: Comparison of Two Polymeric Nanospheres. Sci Rep 2015, 5, 13065. [DOI] [PMC free article] [PubMed] [Google Scholar]
- 66.Hermans K; Van den Plas D; Everaert A; Weyenberg W; Ludwig A, Full factorial design, physicochemical characterisation and biological assessment of cyclosporine A loaded cationic nanoparticles. Eur J Pharm Biopharm 2012, 82 (1), 27–35. [DOI] [PubMed] [Google Scholar]
- 67.Ishihara H; Asano T; Tsukuda K; Katagiri H; Inukai K; Anai M; Kikuchi M; Yazaki Y; Miyazaki JI; Oka Y, Pancreatic beta cell line MIN6 exhibits characteristics of glucose metabolism and glucose-stimulated insulin secretion similar to those of normal islets. Diabetologia 1993, 36 (11), 1139–45. [DOI] [PubMed] [Google Scholar]
- 68.Miyazaki J; Araki K; Yamato E; Ikegami H; Asano T; Shibasaki Y; Oka Y; Yamamura K, Establishment of a pancreatic beta cell line that retains glucose-inducible insulin secretion: special reference to expression of glucose transporter isoforms. Endocrinology 1990, 127 (1), 126–32. [DOI] [PubMed] [Google Scholar]
- 69.Song TH; Jang J; Choi YJ; Shim JH; Cho DW, 3D-Printed Drug/Cell Carrier Enabling Effective Release of Cyclosporin A for Xenogeneic Cell-Based Therapy. Cell Transplant 2015, 24 (12), 2513–25. [DOI] [PubMed] [Google Scholar]
- 70.Holan V; Chudickova M; Trosan P; Svobodova E; Krulova M; Kubinova S; Sykova E; Sirc J; Michalek J; Juklickova M; Munzarova M; Zajicova A, Cyclosporine A-loaded and stem cell-seeded electrospun nanofibers for cell-based therapy and local immunosuppression. J Control Release 2011, 156 (3), 406–12. [DOI] [PubMed] [Google Scholar]
- 71.Matsuda S; Koyasu S, Mechanisms of action of cyclosporine. Immunopharmacology 2000, 47 (2-3), 119–25. [DOI] [PubMed] [Google Scholar]
- 72.Liddicoat AM; Lavelle EC, Modulation of innate immunity by cyclosporine A. Biochem Pharmacol 2019, 163, 472–480. [DOI] [PubMed] [Google Scholar]
- 73.Guada M; Sebastian V; Irusta S; Feijoo E; Dios-Vieitez Mdel C; Blanco-Prieto MJ, Lipid nanoparticles for cyclosporine A administration: development, characterization, and in vitro evaluation of their immunosuppression activity. Int J Nanomedicine 2015, 10, 6541–53. [DOI] [PMC free article] [PubMed] [Google Scholar]
- 74.Napoli A; Tirelli N; Wehrli E; Hubbell JA, Lyotropic behavior in water of amphiphilic ABA triblock copolymers based on poly(propylene sulfide) and poly(ethylene glycol). Langmuir 2002, 18 (22), 8324–8329. [Google Scholar]
- 75.Zeng Q; Li H; Jiang H; Yu J; Wang Y; Ke H; Gong T; Zhang Z; Sun X, Tailoring polymeric hybrid micelles with lymph node targeting ability to improve the potency of cancer vaccines. Biomaterials 2017, 122, 105–113. [DOI] [PubMed] [Google Scholar]
- 76.Snipstad S; Hak S; Baghirov H; Sulheim E; Morch Y; Lelu S; von Haartman E; Back M; Nilsson KPR; Klymchenko AS; de Lange Davies C; Aslund AKO, Labeling nanoparticles: Dye leakage and altered cellular uptake. Cytometry A 2017, 91 (8), 760–766. [DOI] [PubMed] [Google Scholar]
- 77.Xie JH; Yamniuk AP; Borowski V; Kuhn R; Susulic V; Rex-Rabe S; Yang X; Zhou X; Zhang Y; Gillooly K; Brosius R; Ravishankar R; Waggie K; Mink K; Price L; Rehfuss R; Tamura J; An Y; Cheng L; Abramczyk B; Ignatovich O; Drew P; Grant S; Bryson JW; Suchard S; Salter-Cid L; Nadler S; Suri A, Engineering of a novel anti-CD40L domain antibody for treatment of autoimmune diseases. J Immunol 2014, 192 (9), 4083–92. [DOI] [PubMed] [Google Scholar]
- 78.Bojadzic D; Chen J; Alcazar O; Buchwald P, Design, Synthesis, and Evaluation of Novel Immunomodulatory Small Molecules Targeting the CD40(−)CD154 Costimulatory Protein-Protein Interaction. Molecules 2018, 23 (5). [DOI] [PMC free article] [PubMed] [Google Scholar]
Associated Data
This section collects any data citations, data availability statements, or supplementary materials included in this article.
Supplementary Materials
Figure S1: 1HNMR analysis of synthesized polymers.
Figure S2: CryoTEM analysis of HWS nFIB with and without CsA.
Figure S3: In vitro release kinetic of CsA from nMIC and nFIB in PBS
Figure S4: MIN6 viability and functionality after treatment with nMIC and nFIB.
Figure S5: CsA-nMIC and CsA-nFIB inhibition of T cell activation using equalized concentration of CsA.
Figure S6: Viability test on Jurkat cells treated with unloaded and CsA-containing DIANAs.
Figure S7: DiD retention in nMIC and nFIB.
Figure S8: Flow cytometry analysis of the CsA-containing DIANAs inhibition of T cell activation during allo-responses in Balb/c mice.
Figure S9: Uptake of DiD labeled DIANAs by LN-resident cells.
Scheme S1: Synthetic pathways for PEG44-PPS20-pds and PEG44-OES5-SH.