Abstract
Secondary exposure to e-cigarette aerosol (passive vaping) will soon become a pressing public health issue in the world. Yet, the current knowledge about respiratory depositions of e-cigarette aerosol through passive vaping in human airways is limited due to critical weaknesses of traditional experimental methods. To fill in this important knowledge gap, this study proposed a special approach involving an upgraded Mobile Aerosol Lung Deposition Apparatus (MALDA) that consists of a set of human airway replicas including a head airway, tracheobronchial airways down to the 11th lung generation, and a representative alveolar section. In addition to the comprehensive coverage of human airways, the MALDA is easily transportable for providing efficient estimations of aerosol respiratory deposition. In this study, the MALDA was first evaluated in the laboratory and then applied to estimate the respiratory deposition associated with passive vaping in an indoor real-life setting. The results showed that the respiratory deposition data aligned closely with the conventional respiratory deposition curves not only in the head-to-TB region but also in the alveolar region. The strengths of MALDA demonstrate great promise for a wide variety of applications in real-life settings that could provide crucial information for future public health and indoor air quality studies.
Keywords: aerosol, deposition fraction, e-cigarette, human airways, passive vaping, respiratory deposition
1 |. INTRODUCTION
There is an increasing trend in the prevalence of e-cigarette use over the past decade mainly because e-cigarettes have been advertised as novel products with minimal health hazards to people.1–5 Consequently, a social environment favorable to e-cigarettes has been gradually formed with positive attitudes toward friends or bystanders’ e-cigarette using behaviors.6 Following this trend, it is expected that secondary exposure to e-cigarette aerosol (passive vaping) will soon become a pressing issue that may have even worse impacts on public health than second-hand tobacco smoking due to the lack of regulations.7,8 When e-cigarette users (ie, active vapers) are vaping, the nicotine, glycerol, and flavor additives in thee-liquid are together aerosolized.9 E-cigarette aerosol is a mix of liquid droplets, which would inevitably be inhaled by people nearby (ie, passive vapers). The inhalation and deposition of the e-cigarette aerosol in both the active and the passive vapers’ respiratory systems could lead to negative health effects.10
The characteristics of e-cigarette aerosol generated from vaping (eg, the size distribution and the concentration) depend on factors such as the physical property of the chemical constituent in the e-liquid, the operation parameters of thee-cigarette device, and the vaping patterns of the e-cigarette users.11 The particle size distribution of e-cigarette aerosol ranges from 10 nm to several hundred nanometers.12,13 With such a particle size range, a considerable amount of inhaled e-cigarette aerosol would deposit in the alveolar region due to the enormous surface area, which tends to result in a substantial deposition dose in the human lower airways. While aerosol undergoing diffusion in the environment, the natural process of evaporation makes the physical characteristics and the chemical proportion of the e-cigarette aerosols different between the freshly generated e-cigarette aerosol (active vaping related) and the aged e-cigarette aerosol (passive vaping related).14,15 Thus, the deposition patterns of e-cigarette aerosol inactive vapers are expected to be distinct from those in passive vapers as the result of the particle size change after aerosol traveling a distance in the air. Yet, the majority of e-cigarette related research has focused on active vaping.
The accuracy of estimation of the deposition dose for inhaled aerosol is known to rely heavily on the quality of aerosol respiratory deposition data because it is the aerosol deposited in the airways that actually contributes to the final inhalation dose.16 There are only a handful of existing studies on e-cigarette aerosol respiratory deposition, which involved numerical simulations, analytical calculations, or monitoring-based experiments carried out in the laboratory.17,18 To our knowledge, no e-cigarette related experiments have ever been conducted using realistic human airway replica in real-life settings. This may be due to the limitations of traditional experimental methods for aerosol respiratory deposition including (a) the experiment can only be conducted in a laboratory19,20; (b) the procedure is inherently time-consuming and labor-intensive21,22; and (c) the human airway replicas used in the past do not cover essential lower airways due to the technical challenge of replicating the lower TB airways.23,24 These limitations undoubtedly hinder further development of knowledge on the passive vaping associated respiratory deposition. It is well known that the capability of the experimental method to provide quality deposition data in the human lower airways is crucial because most of the major lung problems caused by small aerosol are in the lower airways.25 It is also accepted that the data acquired in laboratories may not represent the data collected from a real-life situation.
To overcome the limitations of traditional experimental methods described above, this study applied the newly upgraded Mobile Aerosol Lung Deposition Apparatus (MALDA) to study the respiratory deposition of e-cigarette aerosol in human airways resulting from passive vaping. The MALDA consists of a set of representative human airway replicas and anaerosol sizer to estimate the aerosol respiratory deposition.26 The key feature of the MALDA is that the setup of the aerosol respiratory deposition experiment is transportable between laboratories and real-life settings.27 In this study, an essential upgrade was done on the MALDA by installing are presentative alveolar section to take into account the aerosol deposition in the lower airways, which is critical especially for studying passive vaping. This upgrade coupled with the feature of easy transportability has well positioned this study to fill in the current knowledge gap of passive vaping associated respiratory deposition. The function enhanced MALDA could be considered a powerful tool for future applications on indoor aerosol studies.
2 |. MATERIAL AND METHODS
2.1 |. Mobile aerosol lung deposition apparatus (MALDA)
To acquire efficient and realistic aerosol respiratory deposition data, the development of MALDA was based on two systems: the aerosol measurement system and the human airway system. These two systems are placed together on a laboratory cart with anoil-free vacuum pump to make the entire aerosol respiratory deposition setup removable. Figure 1 shows the schematic diagram of the MALDA used in this study. The aerosol measurement system contains a complete set of Scanning Mobility Particle Sizer (SMPS 3938, TSI Inc). With optimal parameters set on the instrument, the SMPS is able to efficiently measure the size distribution (number concentration) of thee-cigarette aerosol from 8 to 279 nm in a 1-minute cycle with 100 size channels. The human airway system contains a realistic oral-to-throat (head) airway replica, a delicate human tracheobronchial (TB) airway replica down to the 11th lung generation (with 3311 airway branches), and a representative alveolar section (the new upgrade in this study). The head airway and the TB airways replicas shown in Figure 1 were existing installations before the upgrade of the MALDA. The development and the structure of the head and the TB airway replicas as well as initial applications of the MALDA prototype were all detailed in our previous publications.26,28 In this study, to improve the overall function and capability of the MALDA, an upgrade was done recently on installing a representative alveolar section onto the existing human airway system. As aforementioned, the human alveolar region is the most important section in the human airways from the viewpoint of aerosol respiratory deposition because a considerable portion of the small aerosol inhaled will deposit within it. Figure 2 demonstrates the representative alveolar section developed in this study. The representative alveolar section possesses a rectangle container body with a cross-sectional area of 16 cm × 16 cm, and 8 cm in height. The wall thickness of the rectangle container was 0.35 cm. The inlet and outlet caps of the rectangle container were designed to be pyramid-shaped (dimension: 16 cm (L) × 16 cm (W) × 13 cm (H)) for the purpose of smoothing the airstream while the air passing through the container. The rectangle container and the caps of the representative alveolar section were all made by a 3D printer using conductive polylactic acid (PLA, Proto-pasta, ProtoPlant). Inside the rectangle container, different types and layers of porous conductive foams(ERG Materials & Aerospace Corp.) with the same inner cross-sectional area as the rectangle container were installed. The conductive foam provides numerous surface areas (similar to the structure in the human alveolar region) for small aerosol to deposit on the foam fiber while passing by. The procedure for determining the optimal combination of foam types and layer thickness to achieve the best performance of the representative alveolar section is described in the next section. With the design and inclusion of the representative alveolar section, the upgraded MALDA can ideally capture the e-cigarette aerosol deposition in the human alveolar region.
FIGURE 1.
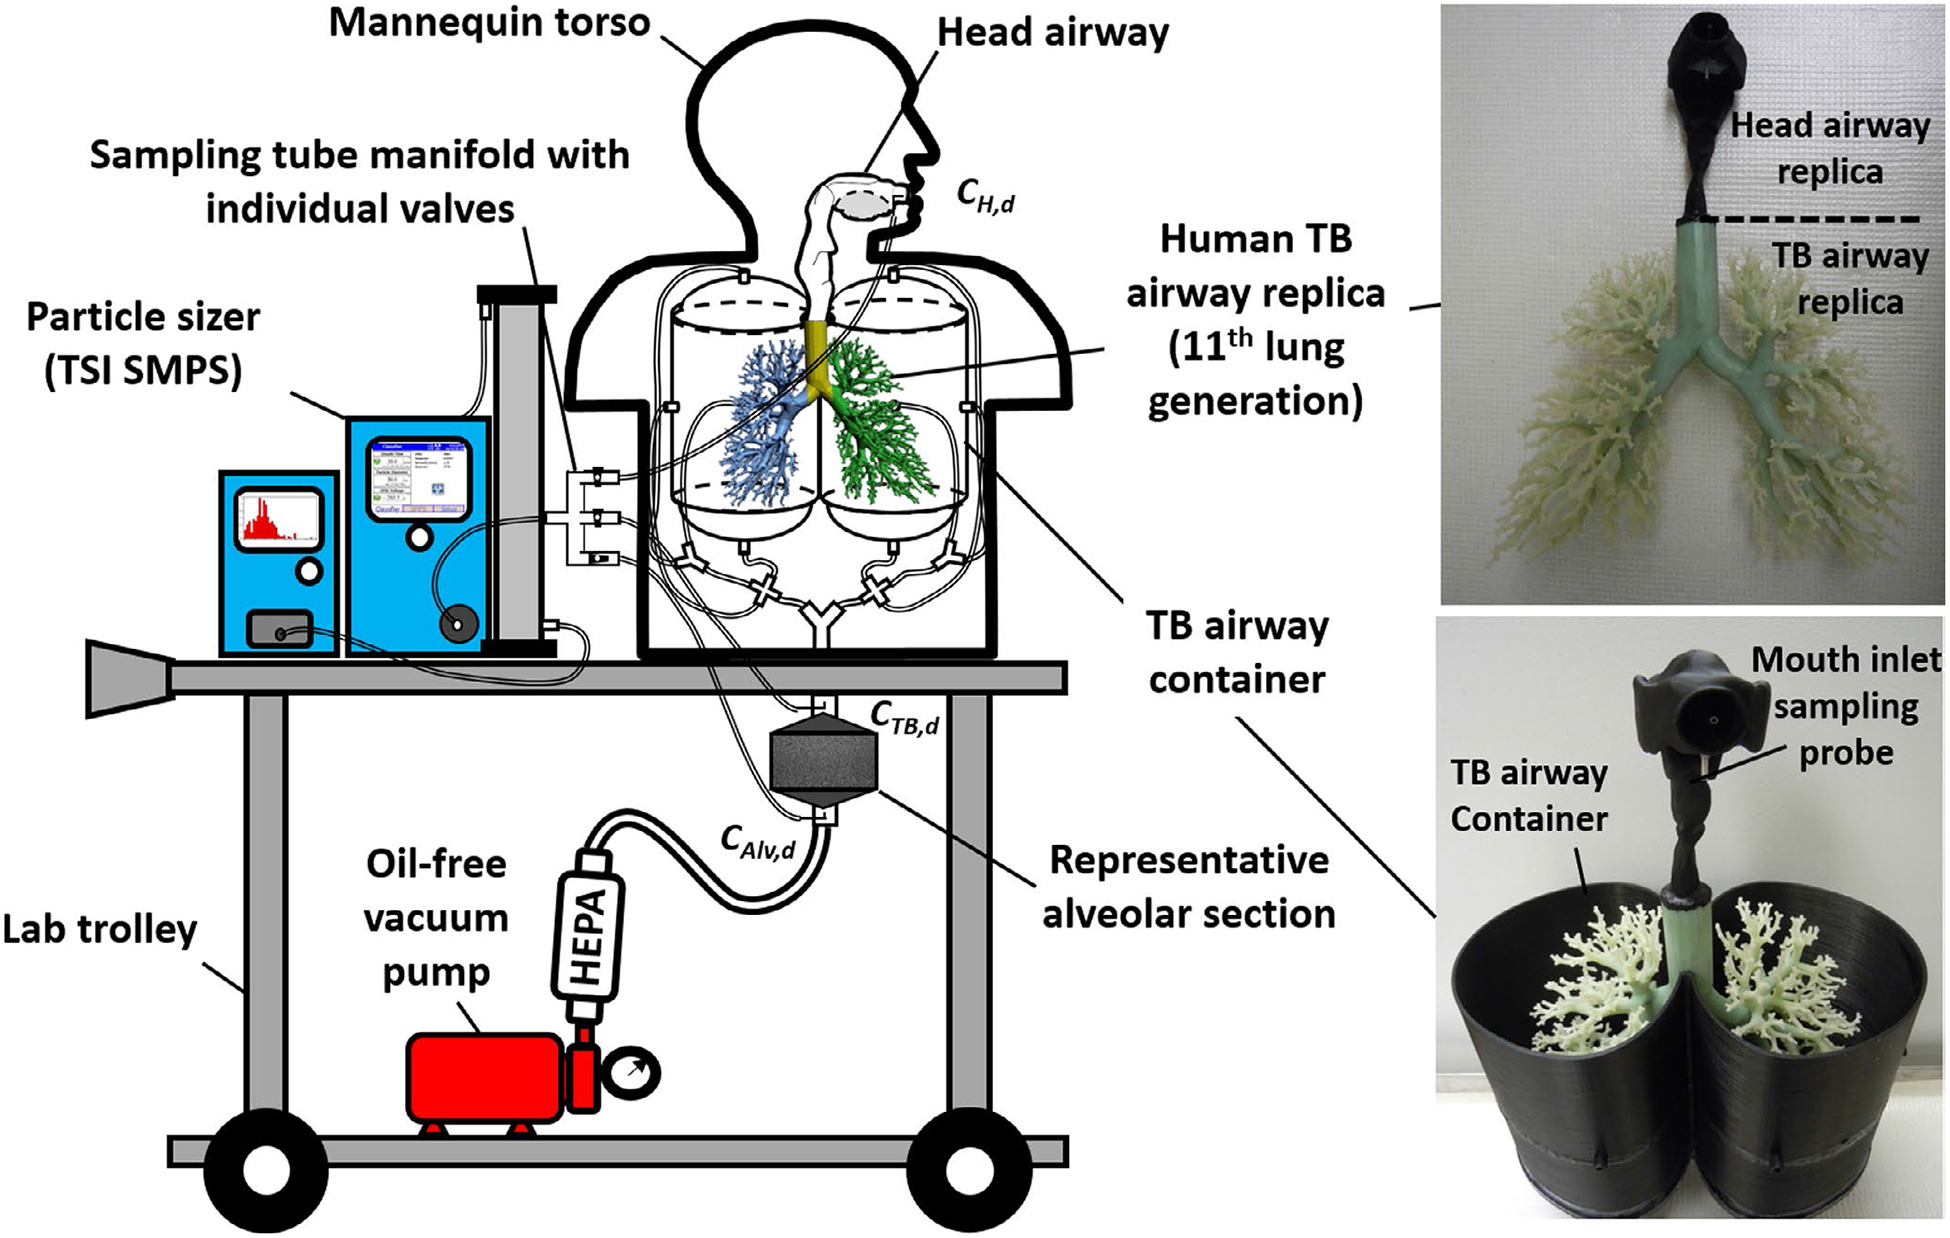
The schematic diagram of the upgraded Mobile Aerosol Lung Deposition Apparatus (MALDA) with representative alveolar section
FIGURE 2.

The representative alveolar section and the porous conductive carbon foams contained
2.2 |. Laboratory performance evaluation tests for MALDA
Figure 3 shows the experimental setup of the performance evaluation tests for the upgraded MALDA. The challenge aerosol for the tests was polydisperse sodium chloride (NaCl) particles generated by a laboratory-grade atomizer (3079A, TSI Inc). This experimental setup has been employed in our previous study during MALDA prototype development.26 An inspiratory flow rate of 30 L min−1 (inhalation only) was used for the evaluation tests. The generated NaCl aerosol first passed through several drying columns and then was delivered into the MALDA head airway through the mouth. The aerosol size distributions were measured by three sampling probes installed on the MALDA: at the head inlet, at the TB outlet, and at the alveoli outlet (as shown in Figure 3). Based on the aerosol size distributions measured, the aerosol outlet-to-inlet concentration ratios (Cout/Cin) for each particle size, d, could be calculated for the head-to-TB airway (CTB,d/CH,d) as well as for the head-to-alveoli airway (CAlv,d/CH,d). The aerosol deposition fractions in the corresponding airway regions can then be estimated according to the following equations:
| (1) |
| (2) |
where DH+TB,d and DAlv,d are the deposition fraction (%) of aerosol with size d nm in the head-to-TB airway and the alveolar region, respectively. CH,d, CTB,d, and CAlv,d are number concentrations of aerosol with size d nm measured at the head inlet, TB outlet, and alveoli outlet, respectively. It is worth noting that Cout/Cin represents the penetration efficiency of aerosol from mouth to a specific airway region in the human airways. 1−Cout/Cin represents the deposition efficiency of aerosol from mouth to that specific airway section. The performance evaluation test of the upgraded MALDA was focused on comparing the MALDA-estimated deposition fractions in the head-to-TB airway and the alveolar region with the conventional human respiratory deposition curves published by the International Commission on Radiological Protection (ICRP).16 The performance evaluation tests were particularly designed and focused on determining the optimal combination (type and thickness) of the porous conductive foams to be installed in the representative alveolar section to match the corresponding ICRP convention curve. Two types of commercially available conductive porous foam are considered in this study:coarse foam (20 pores per inch, PPI) and fine foam (60 PPI). Foam pieces were made in squares with the dimension of 15.2 cm × 15.2 cm (6” × 6”) and three different thicknesses: 2.54, 1.27, and 0.64 cm (1”, 0.5”, and 0.25”). Different combinations of the foam types and thickness were placed inside the rectangle container to evaluate whether the best MALDA performance in the alveolar region has been achieved. At least five experiments were repeated after the optimal combination was identified.
FIGURE 3.
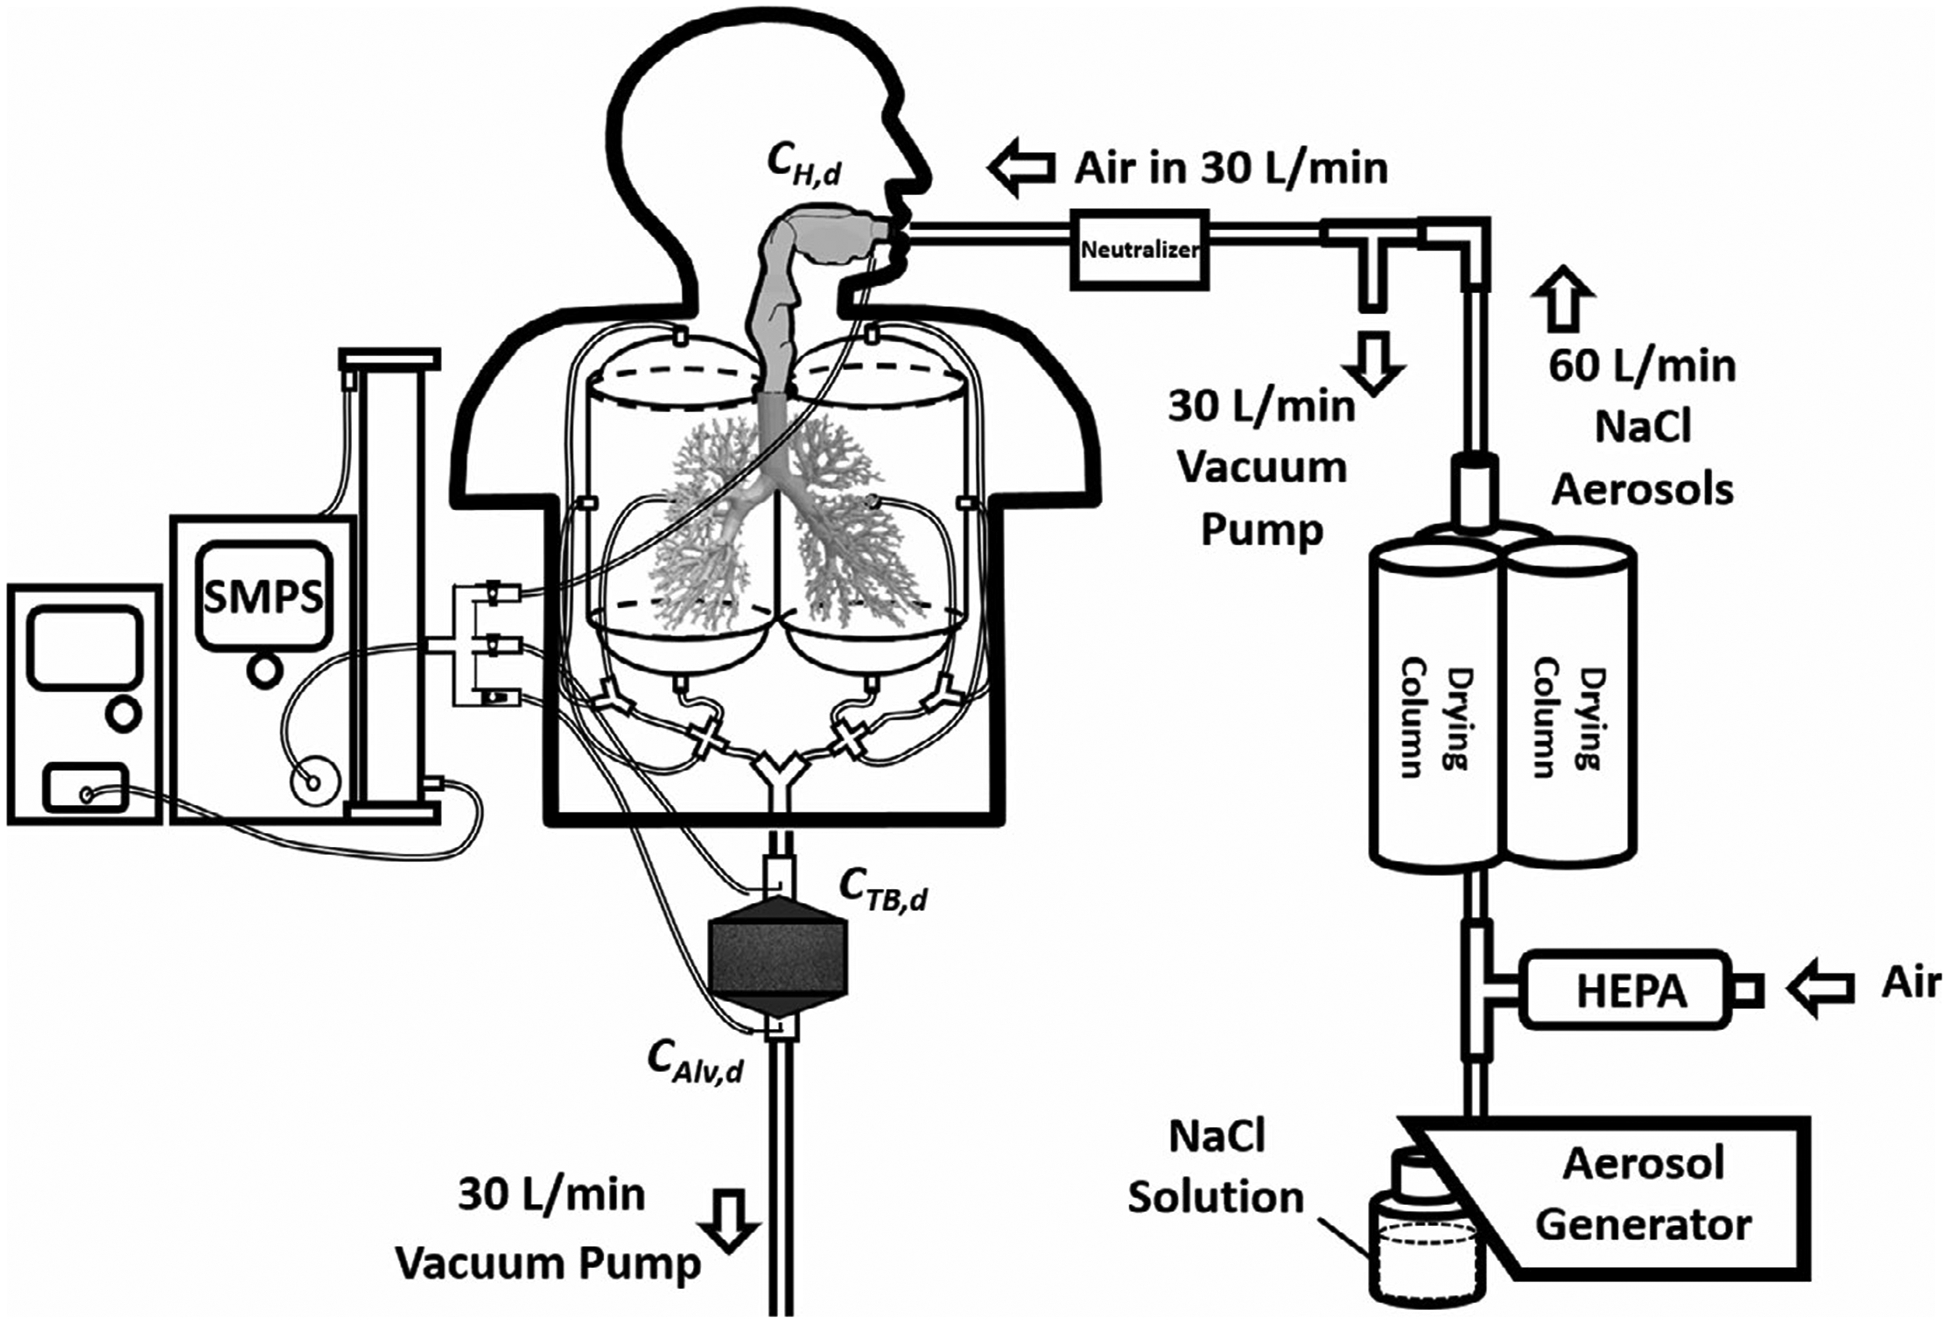
The experimental setup of the MALDA performance evaluation tests in the laboratory
2.3 |. Respiratory deposition experiments in a real-life setting
Once the performance evaluation test was completed in the laboratory, the MALDA was transported to a voluntary e-cigarette user’s apartment to study aerosol respiratory depositions associated with passive vaping in a real-life setting. Figure 4 shows the schematic diagram of the corresponding experiment layout in the real-life setting. As can be seen, the e-cigarette user was vaping in the living room with 4 meters away from the MALDA located in an activity area. The MALDA inhaled the e-cigarette aerosol diffused from the living room to the activity area. The arrangement of the MALDA in the apartment could represent a typical e-cigarette aerosol exposure scenario due to passive vaping. The total space of the living room plus the activity area in the apartment was approximately 75 m3. During the deposition experiments, the air conditioner and the ceiling fan were set to minimal to avoid disturbing the room air drastically. Before the experiments started, the aerosol size distribution in the background was measured. Once the e-cigarette aerosol respiratory deposition experiments started, the e-cigarette user vaped freely with the e-cigarette device installed with a favorite e-liquid for more than 10 minutes. The MALDA started operating under a 30 L min−1 inspiratory flow rate right after the e-cigarette user stopped vaping. Size distributions of e-cigarette aerosol were measured by the MALDA at the head inlet (CH,d), TB outlet (CTB,d), and alveoli outlet (CAlv,d) in turn for five cycles (15 minutes measurement in total). It was found that the concentration of e-cigarette aerosol in the MALDA measurement location decreased insignificantly during any 3 consecutive minutes. Therefore, the e-cigarette aerosol concentrations during arun of 3 minutes (CH,d, CTB,d, and CAlv,d each for 1 minutes) in that measurement location could be assumed to be approximately constant. To eliminate potential confounders, before the real-life setting experiment started, the indoor air in the apartment was carefully kept clean without significant aerosol generation/agitation activities such as cooking, vacuum, and smoking (vaping) for at least 5 hours. Four days of visits were made to the same apartment following the same experimental procedure. Respiratory deposition fractions were estimated for individual experimental run conducted in each day of visit using Equations (1) and (2), and the final data were the average of the deposition fractions obtained in those four days.
FIGURE 4.
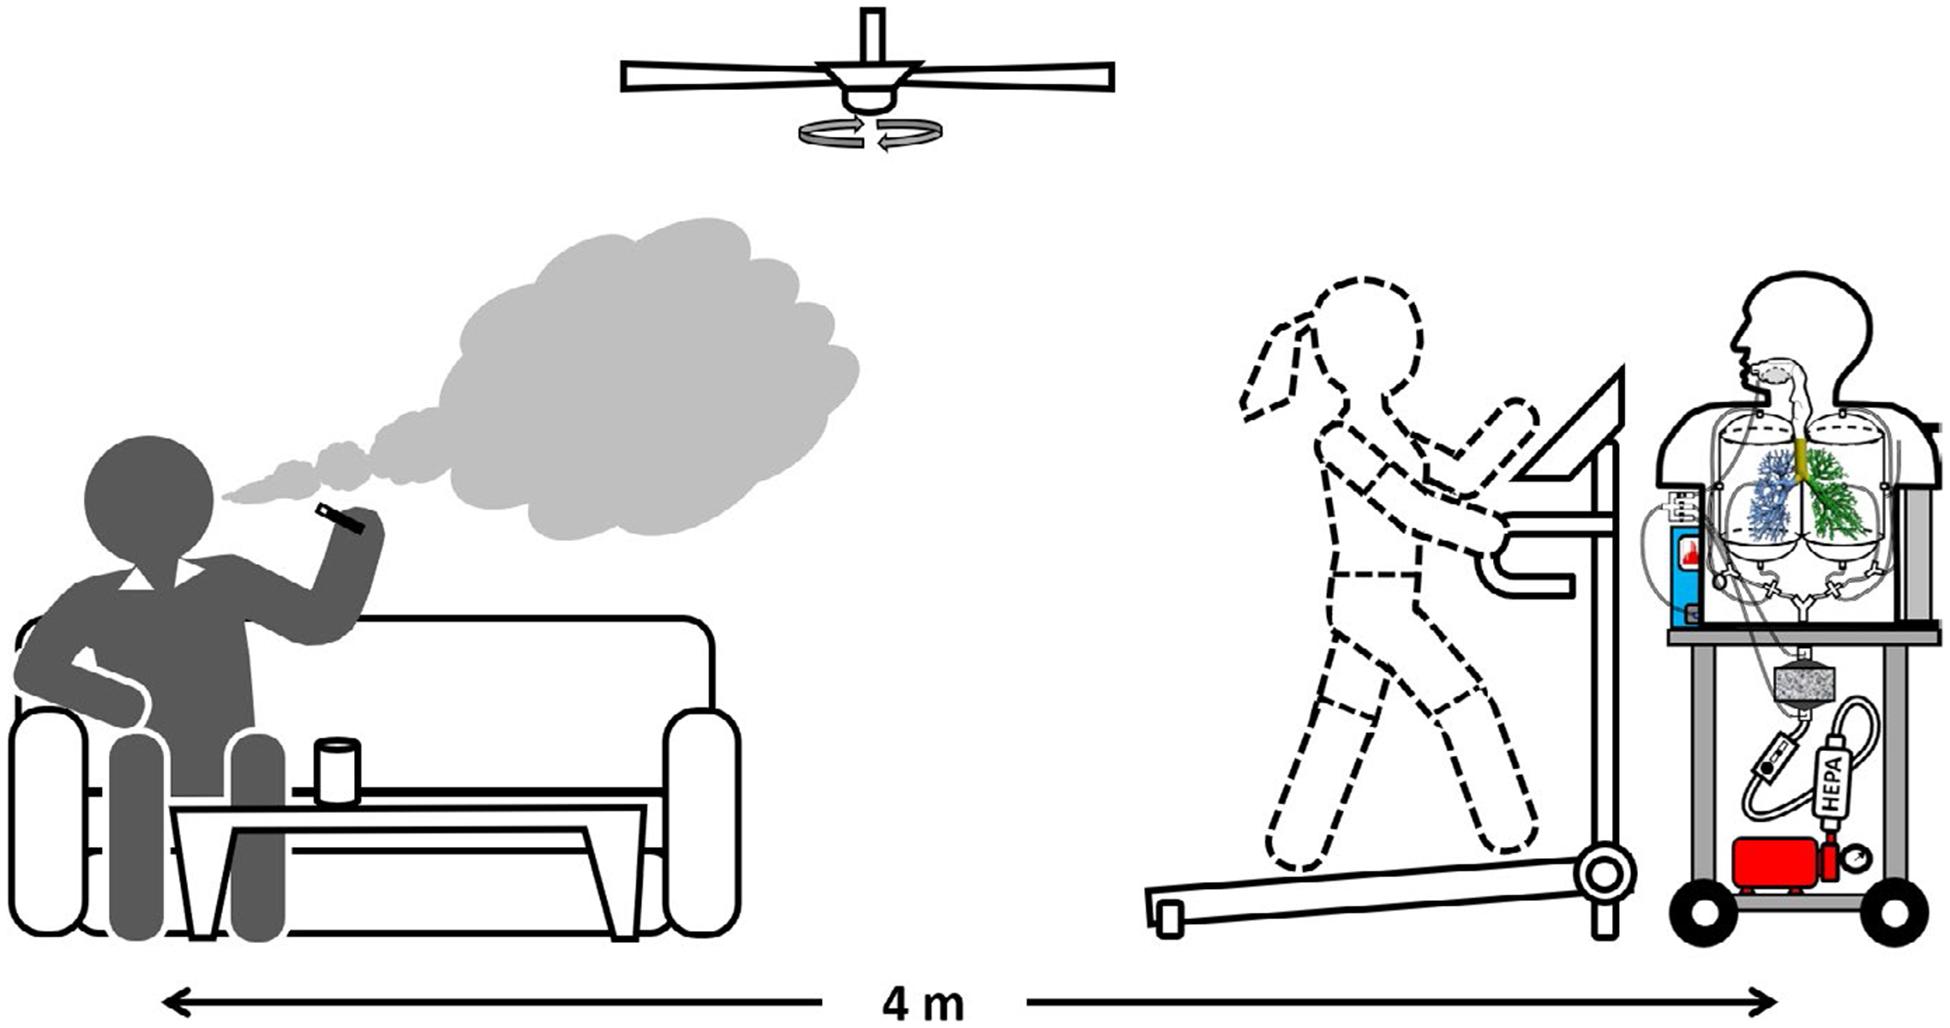
The experimental setup of e-cigarette aerosol respiratory deposition through passive vaping using the MALDA in a real-life setting
3 |. RESULTS AND DISCUSSION
Figure 5A–D delineate the results obtained from the MALDA performance evaluation tests conducted in the laboratory. Figure 5A shows the particle size distribution of the challenge NaCl aerosol, indicating that the NaCl aerosol generated by the atomizer was very consistent and the peak of the particle diameter was at 15 nm. Based on the aerosol size distribution measured at three sampling probes of the MALDA, the outlet-to-inlet concentration ratios (Cin/Cout) were calculated and the deposition fractions in the head-to-TB airway (DH+TB,d) and the alveolar region (DAlv,d) were estimated and presented in Figure 5B and C, respectively. Together shown in Figure 5B and C are the corresponding ICRP convention curves. It is worth noting that the DH+TB,d is the summation of the deposition fractions in the head airway and that in the TB airways when referring to the ICRP curves. As demonstrated by these figures, MALDA-estimated deposition fractions agreed quite well with the corresponding conventional curves with only minor overestimation, indicating the excellent performance of the upgraded MALDA. The observed overestimation probably stemmed from the inevitable systematic particle wall-loss in the MALDA. To confirm the deposition results, respiratory deposition experiments were also conducted using size-classified aerosol in three selective particle diameters (30, 70, and 110 nm). The size-classified aerosols were generated by a differential mobility analyzer (DMA), and the experimental setup was similar to the method used in our previous publication.24 The experimental results are presented in Figure 5B and C together with all the other laboratory data acquired. As can be seen, the deposition results of the monodispersed aerosol are ideally close to the data obtained from the polydisperse aerosol.
FIGURE 5.
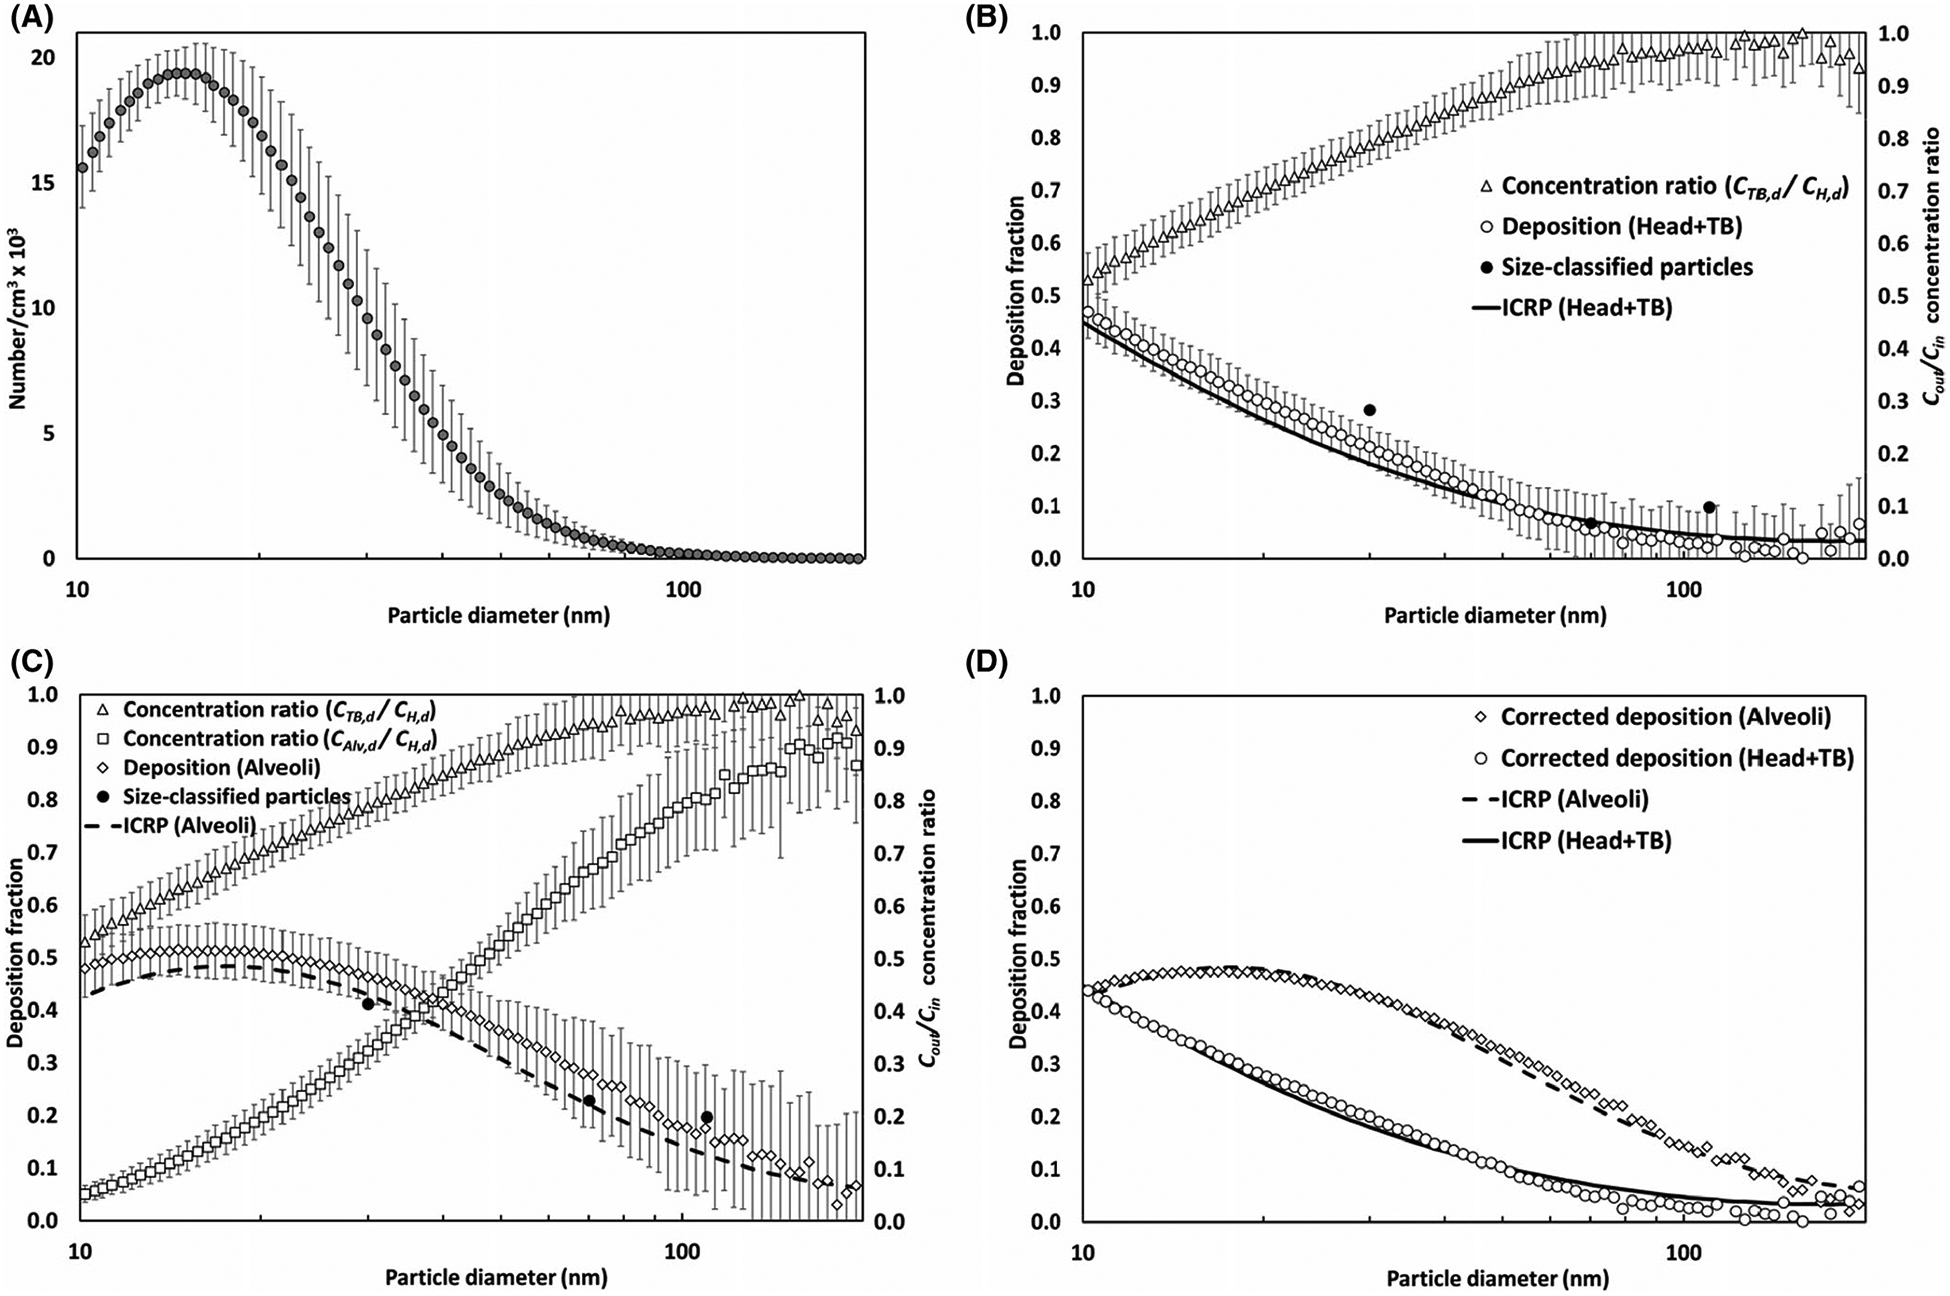
Results of the performance evaluation tests for the upgraded MALDA using laboratory-generated aerosol (A) particle size distribution of NaCl aerosol, (B) measured concentration ratios and associated depositions in the head-to-TB airways, (C) measured concentration ratios and associated depositions in the alveolar region, and (D) respiratory depositions after applying correct factors (error bars represent the error to the mean)
According to these test results, the optimal type and thickness combination of the conductive porous foam used in the representative alveolar section was as follows: 4.45 cm (1.75”) for the coarse foam and 3.17 cm (1.25”) for the fine foam. The foam pieces were placed inside the rectangle container in the order of the coarse foam first and the fine foam second. Under this arrangement, the air with aerosol passed through the human lower airways (bronchioles to alveoli) can be simulated quite well in the representative alveolar section. To better align the MALDA data with the ICRP convention curves, size-dependent correction factors (Corr) for measured Cin/Cout were developed for the purpose to adjust the final deposition fractions estimated by MALDA:
| (3) |
| (4) |
where CorrH+TB,d is the correction factor for the CTB,d/CH,d measured at the TB airway container, CorrAlv,d is the correction factor for the CAlv,d/CH,d measured at the representative alveolar section, and d is the particle diameter. After applying the correction factors to the measured data by Cin/Cout + Corr and re-calculating the deposition fractions, Figure 5D demonstrates that the agreement between the MALDA data and the conventional curve was significantly improved. In summary, the results from the performance evaluation tests validate the upgraded MALDA to be a suitable tool for estimating the respiratory deposition of e-cigarette aerosol through passive vaping.
The MALDA was disassembled and transported to the voluntary active vaper’s apartment to conduct respiratory deposition experiments in a real-life setting. Figure 6 depicts the size distributions for the background aerosol (before vaping) and the e-cigarette aerosol(after vaping) measured in the apartment. It is apparent that, when the e-cigarette user started vaping, the aerosol concentration in the indoor environment rose remarkedly, and as a result, the air quality in the apartment was significantly impacted. The diameters of the e-cigarette aerosol were found to be less than 100 nm with a unimodal peak around 30 to 40 nm, which is consistent with what were found in published studies that the mode of e-cigarette aerosol diameter in the environment was smaller than 50 nm in general.29–31 Based on these data, the e-cigarette aerosol inhaled by passive vapers is classified as ultrafine particles (defined as aerosols with particle diameters smaller than 100 nm), which is different in size from the e-cigarette aerosol inhaled by active vapers. In fact, the particle diameters of e-cigarette aerosol measured immediately after vaping were commonly reported to be larger than 150 nm.32–34 Given that passive vapers are mainly exposed to ultrafine e-cigarette aerosol, the alveolar region therefore should be the focus of respiratory deposition studies on passive vaping.
FIGURE 6.
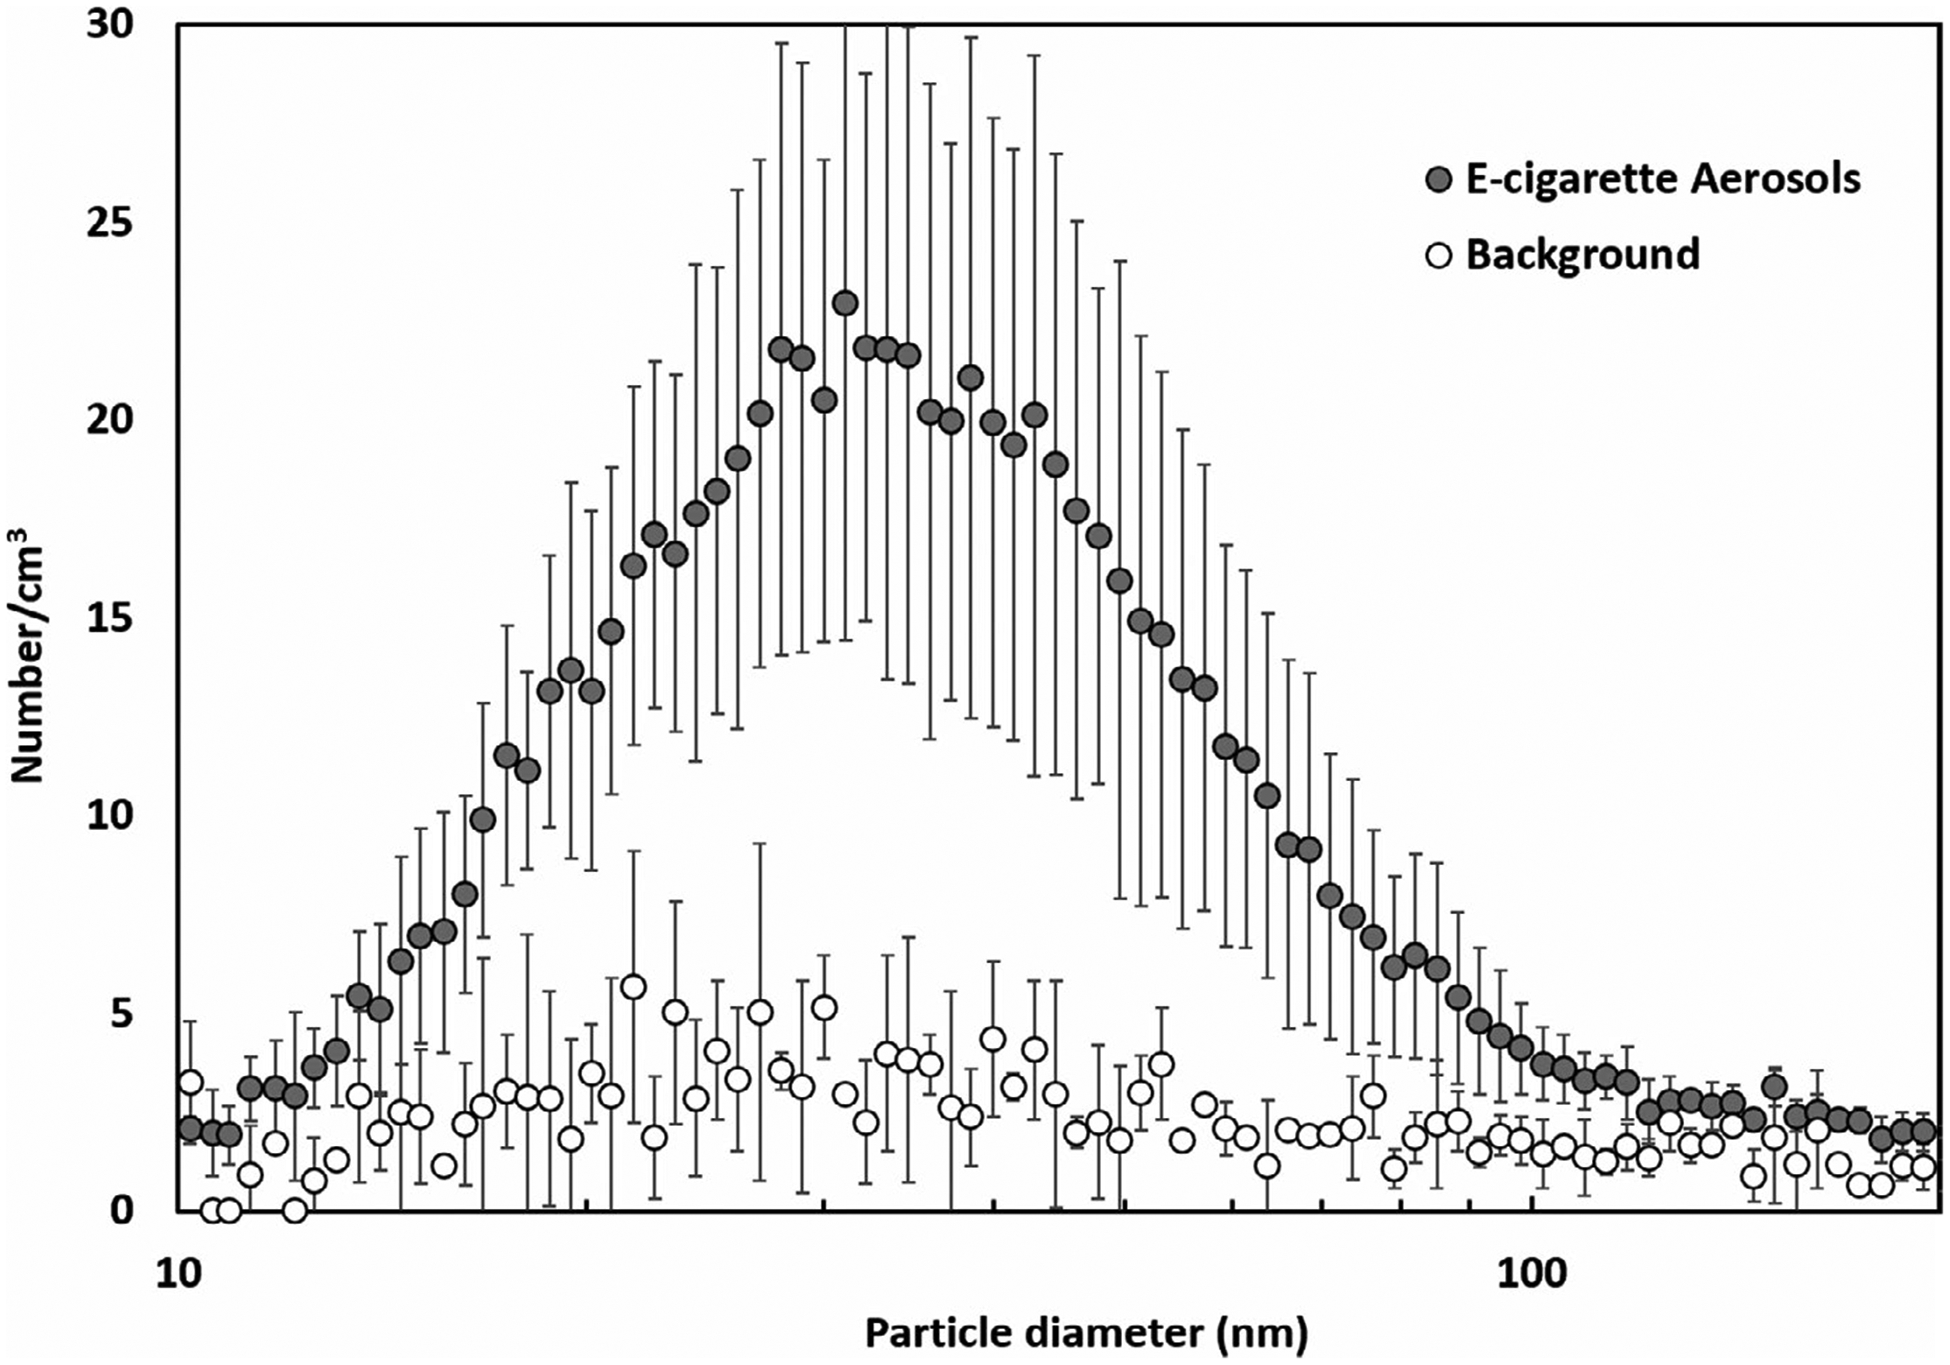
The particle size distribution of e-cigarette aerosol measured in the real-life setting (error bars represent the standard deviation)
Figure 7 shows the e-cigarette aerosol outlet-to-inlet concentration ratio (CTB,d/CH,d) and the deposition fraction in the head-to-TB airway (DH+TB,d) estimated by using the MALDA. The deposition fractions presented were adjusted by the correction factor found. It can be seen in Figure 7, as the e-cigarette particle diameter reduced, the value of CTB,d/CH,d became lower, indicating a higher airway deposition. This result implies that the dominant deposition mechanism for e-cigarette aerosol in the head to TB airways is Brownian diffusion which is also the primary deposition mechanism for general ultrafine particles. Figure 7 also shows that the data uncertainty was high in the small particle size range (less than 20 nm). This is due to the fact that a relatively smaller amount of e-cigarette aerosol with sizes from 10 to 20 nm were detected during the experiments. It was found that the deposition fraction in the head-to-TB airways estimated by MALDA agreed with the corresponding conventional curves quite well indicating that less than 45% of the inhaled e-cigarette aerosol would deposit within the head-to-TB airways through passive vaping.
FIGURE 7.
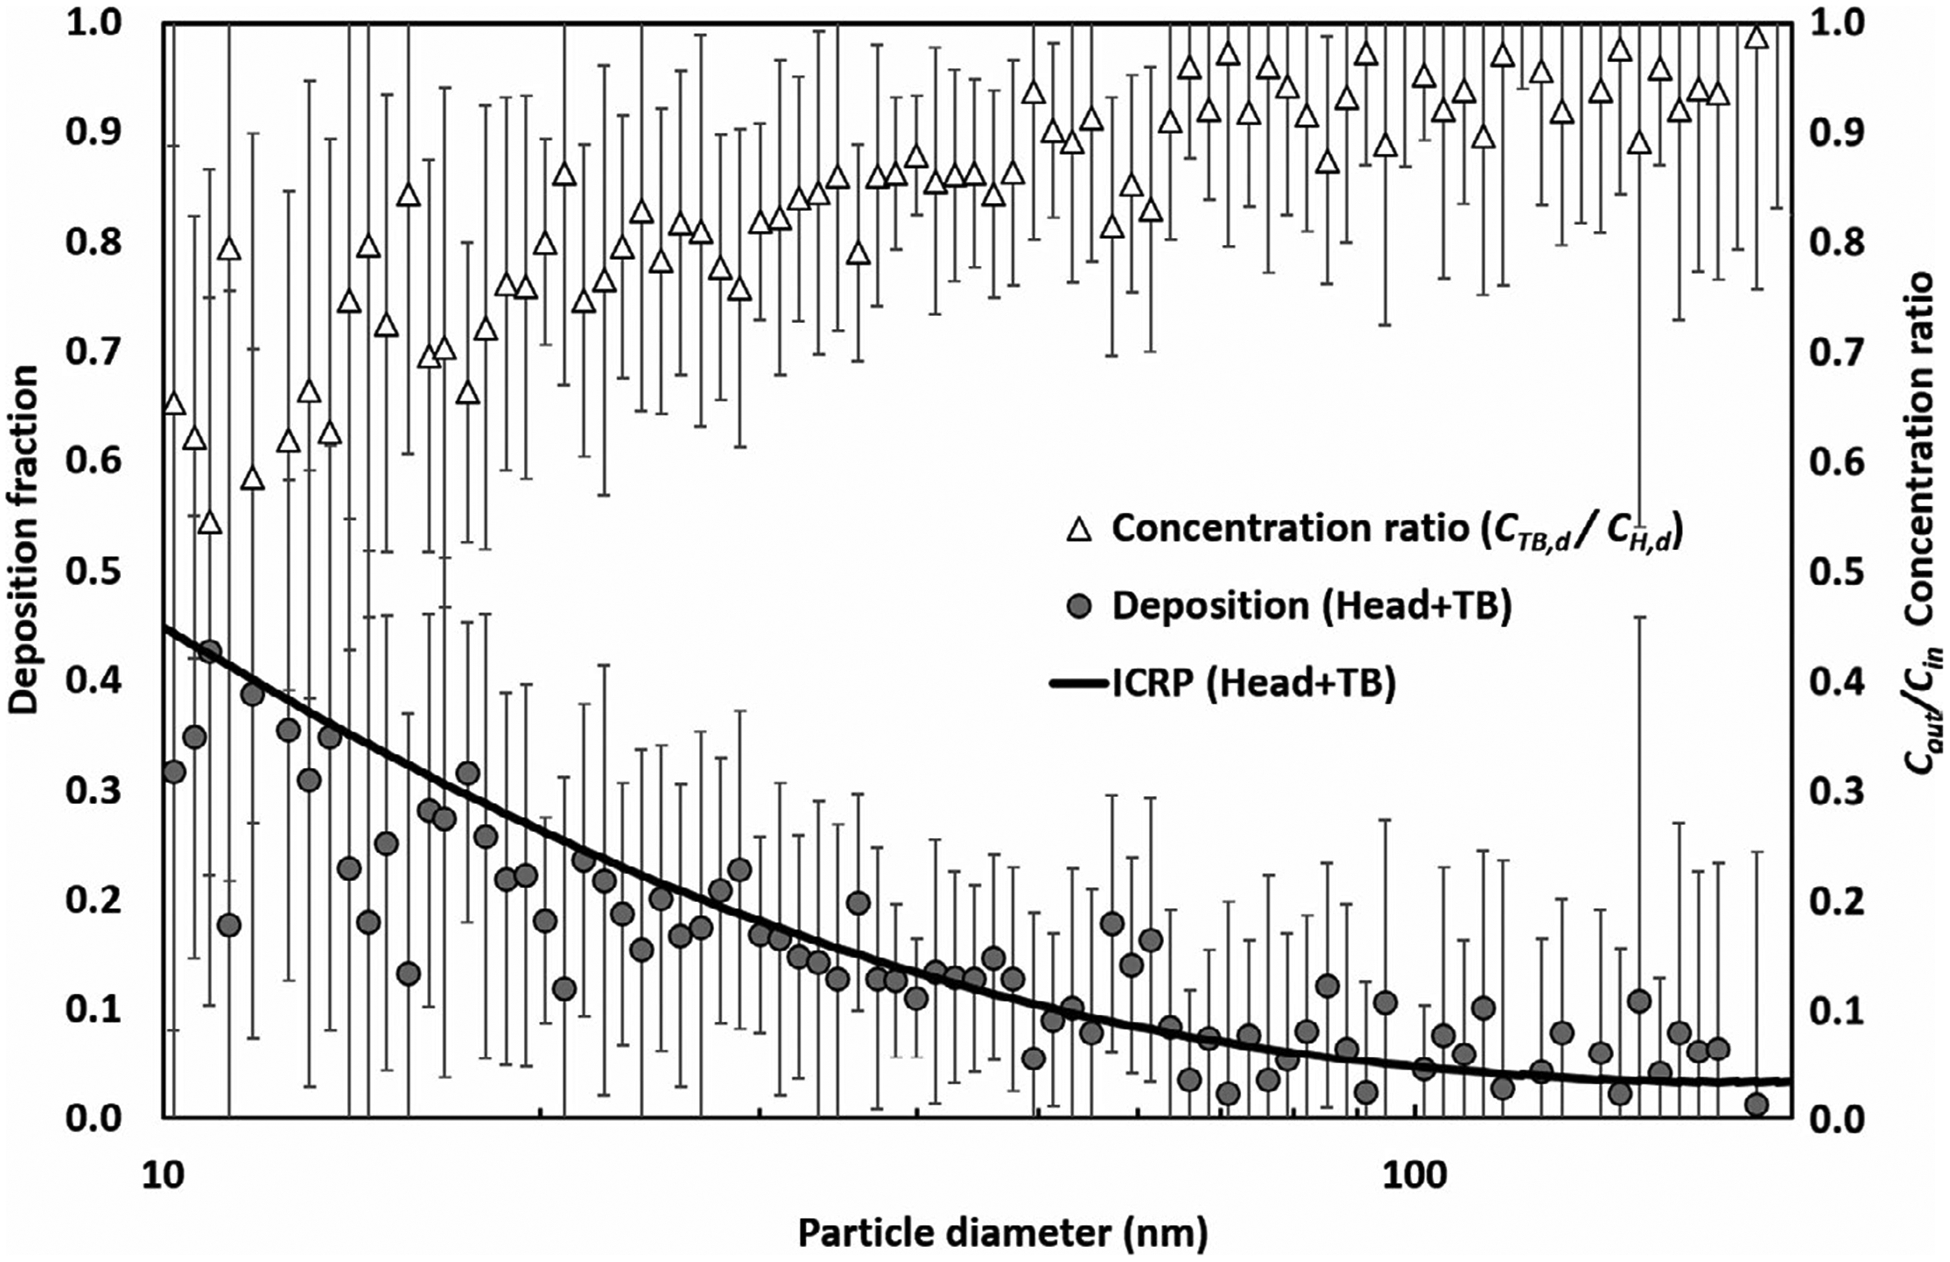
The deposition of e-cigarette aerosol in the human head-to-TB airways through passive vaping (bars represent the error to the mean)
Figure 8 presents the outlet-to-inlet concentration ratios (CAlv,d/CH,d) and the respiratory deposition fraction (after correction) in the human alveolar region obtained by the MALDA approach. Similar to the pattern of CTB,d/CH,d shown in Figure 7, the value of CAlv,d/CH,d decreased as the diameter of e-cigarette aerosol became smaller. Yet, the CAlv,d/CH,d data shifted downward compared to the CTB,d/CH,d data, indicating relatively more aerosol deposition in the representative alveolar section. According to Figure 8, about 60% of the e-cigarette aerosol with the size range of 10–30 nm was found to deposit in the alveolar region, while the deposition was gradually reduced to 10% as the particle diameter increased to 100 nm. Again, the uncertainty in the size range smaller than 20 nm was unavoidable due to the lack of e-cigarette aerosol in that range. Nevertheless, the MALDA-estimated deposition of e-cigarette aerosol in the alveolar region pretty much aligned with the ICRP convention curve, especially for the particle diameter larger than 20 nm. It is known that aerosols generated by condensation, such as fog, cloud, and 3D printing emission, are generally spherical droplets.35 Given that the e-cigarette aerosol is also formed by vapor condensation of heated e-liquid, the e-cigarette aerosol generally contains singular, spherical particles. This explains the excellent match between the experimental data and the ICRP curve as the ICRP convention curves were established based on singular, spherical particles.
FIGURE 8.

The deposition of e-cigarette aerosol in the human alveolar region through passive vaping (bars represent the error to the mean)
All results presented above validate that the newly upgraded MALDA is a useful tool for estimating aerosol respiratory deposition for general spherical or compact particles such as the e-cigarette aerosol in the environment. However, some health-related aerosol in indoor or outdoor environments tends to have irregular shapes (including agglomerates and aggregates) such as fume and smoke generated by combustible cigarettes, incense burning, welding, and diesel combustion.27,36–39 These airborne particulate matters with irregular particle shapes may manifest distinct aerodynamic behaviors in the airstream from those of spherical or compact particles. Thus, the resulting deposition fractions in the human respiratory tract could theoretically deviate from the ICRP convention curves. However, by using the validated MALDA for aerosol respiratory deposition studies, the deposition discrepancy of such irregular-shaped particles in the human airways can be experimentally revealed. Then, by comparing with the corresponding ICRP curves, the respiratory depositions and the health effects associated with those aerosols of interest could be thoroughly investigated.
In addition to the strength of comprehensive coverage of the human airway system, the upgraded MALDA is a very time-efficient tool for conducting aerosol respiratory deposition studies because the required time for a complete set of measurements (CH,d, CTB,d, and CAlv,d) to estimate the deposition fractions in two human airway regions is only 3 minutes. This prominent feature coupled with the feature of easy transportability demonstrates the great potential of applying the MALDA in the future to conduct on-site aerosol respiratory deposition experiments in a variety of indoor real-life settings. Another potentially influential application of the MALDA approach is to integrate the acquired respiratory deposition data (Figures 7 and 8) with the particle size distribution data (Figure 6) together with the size-dependent aerosol constituent data(not available in this study) to estimate the deposition dose of a specific chemical in the airway regions. For example, if the data of e-cigarette aerosol constituent (%) such as the percentages of nicotine and the flavor additives by the aerosol size are available, the deposition doses of nicotine and flavor additives in the alveolar region can then be reasonably estimated for passive vapers. Such information will be useful and crucial for health risk analysis and exposure assessment for passive vaping research as well as for other hazardous indoor aerosol studies.
4 |. CONCLUSION
Passive vaping is expected to become a pressing public health issue with even worse impacts than second-hand tobacco smoking. In this study, a recently upgraded MALDA was evaluated and applied to study the respiratory deposition of e-cigarette aerosol through passive vaping in an indoor real-life setting. The results showed that respiratory depositions of e-cigarette aerosol through passive vaping aligned closely with the ICRP convention curve not only in the head-to-TB region but also in the alveolar region. The results also demonstrate that the MALDA approach is a powerful tool for estimating on-site aerosol respiratory deposition in the human respiratory tract especially in the lower airways. The unique features of MALDA including comprehensive coverage of human airways, easy transportability, and efficient estimation show great promise for a wide variety of applications in real-life settings that could provide crucial information for indoor aerosol-related public health studies.
Practical Implications.
Passive vaping has become an emerging indoor air quality issue and raised substantial public health concerns.
E-cigarette aerosols associated with passive vaping are generally ultrafine particles, and most of them will deposit in the human lower airways causing potential health effects on passive vapers.
The Mobile Aerosol Lung Deposition Apparatus (MALDA) developed in this study could be a useful tool in the future to systematically investigate respiratory depositions for other health-related indoor aerosols.
ACKNOWLEDGEMENTS
Funding for this study was supported by Grant Nos. R21ES031795 from National Institute of Environmental Health Sciences (NIEHS), R01DA049154 from National Institute on Drug Abuse (NIDA), and 5T42OH008421 from the National Institute for Occupational Safety and Health (NIOSH) to the Southwest Center for Occupational and Environmental Health (SWCOEH).
Footnotes
DATA AVAILABILITY STATEMENT
Data available on request from the authors: the data that support the findings of this study are available from the corresponding author upon reasonable request.
REFERENCES
- 1.Wilson FA, Wang Y. Recent findings on the prevalence of E-Cigarette use among adults in the U.S. Am J Prev Med. 2017;52(3):385–390. [DOI] [PubMed] [Google Scholar]
- 2.Wiseman KP, Margolis KA, Bernat JK, Grana RA. The association between perceived e-cigarette and nicotine addictiveness, information-seeking, and e-cigarette trial among U.S. adults. Pre Med. 2019;118:66–72. [DOI] [PubMed] [Google Scholar]
- 3.Anand V, McGinty KL, O’Brien K, Guenthner G, Hahn E, Martin CA. E-cigarette use and beliefs among urban public high school students in north carolina. J Adolesc Health. 2015;57(1):46–51. [DOI] [PubMed] [Google Scholar]
- 4.Levy DT, Borland R, Lindblom EN, et al. Potential deaths averted in USA by replacing cigarettes with e-cigarettes. Tob Control. 2018;27(1):18–25. [DOI] [PMC free article] [PubMed] [Google Scholar]
- 5.Buu A, Hu YH, Wong SW, Lin HC. Comparing American college and noncollege young adults on e-cigarette use patterns including poly-substance use and reasons for using e-cigarettes. J Am Coll Health. 2020;68(6):610–616. [DOI] [PubMed] [Google Scholar]
- 6.Barrington-Trimis JL, Berhane K, Unger JB, et al. The E-cigarette social environment, e-cigarette use, and susceptibility to cigarette smoking. J Adolesc Health. 2016;59(1):75–80. [DOI] [PMC free article] [PubMed] [Google Scholar]
- 7.Hess IM, Lachireddy K, Capon A. A systematic review of the health risks from passive exposure to electronic cigarette vapour. Public Health Res Pract. 2016;26(2):e2621617. [DOI] [PubMed] [Google Scholar]
- 8.Gallart-Mateu D, Elbal L, Armenta S, de la Guardia M. Passive exposure to nicotine from e-cigarettes. Talanta. 2016;152:329–334. [DOI] [PubMed] [Google Scholar]
- 9.Farsalinos KE, Kistler KA, Gillman G, Voudris V. Evaluation of electronic cigarette liquids and aerosol for the presence of selected inhalation toxins. Nicotine Tob Res. 2015;17(2):168–174. [DOI] [PMC free article] [PubMed] [Google Scholar]
- 10.Gerloff J, Sundar IK, Freter R, et al. Inflammatory response and barrier dysfunction by different e-cigarette flavoring chemicals identified by gas chromatography-mass spectrometry in e-liquids and e-vapors on human lung epithelial cells and fibroblasts. Appl In Vitro Toxicol. 2017;3(1):28–40. [DOI] [PMC free article] [PubMed] [Google Scholar]
- 11.Furberg R, Ortiz AM, McCombs M, et al. Exposure to potentially harmful e-cigarette emissions via vape tricks: protocol for a mixed-methods study. JMIR Res Protoc. 2019;8(4):e12304. [DOI] [PMC free article] [PubMed] [Google Scholar]
- 12.Grana R, Benowitz N, Glantz SA. E-cigarettes: a scientific review. Circulation. 2014;129(19):1972–1986. [DOI] [PMC free article] [PubMed] [Google Scholar]
- 13.National Academies of Sciences E, Medicine. Public Health Consequences of E-cigarettes. National Academies Press; 2018. [PubMed] [Google Scholar]
- 14.Hinds WC. Aerosol technology: Properties, Behavior, and Measurement of Airborne Particles. New York: John Wiley & Sons; 1999. [Google Scholar]
- 15.Geiss O, Bianchi I, Barahona F, Barrero-Moreno J. Characterisation of mainstream and passive vapours emitted by selected electronic cigarettes. Int J Hyg Environ Health. 2015;218(1):169–180. [DOI] [PubMed] [Google Scholar]
- 16.ICRP. Human Respiratory Tract Model for Radiological Protection Publication 66. Ann, ICRP Oxford: Pergamon Press; 1994. [Google Scholar]
- 17.Manigrasso M, Buonanno G, Fuoco FC, Stabile L, Avino P. Aerosol deposition doses in the human respiratory tree of electronic cigarette smokers. Environ Pollut. 2015;196:257–267. [DOI] [PubMed] [Google Scholar]
- 18.Sosnowski TR, Kramek-Romanowska K. Predicted deposition of E-cigarette aerosol in the human lungs. J Aerosol Med Pulm Drug Deliv. 2016;29(3):299–309. [DOI] [PubMed] [Google Scholar]
- 19.Cohen BS, Sussman RG, Lippmann M. Ultrafine particle deposition in a human tracheobronchial cast. Aerosol Sci Technol. 1990;12(4):1082–1091. [Google Scholar]
- 20.Cheng YS, Su Y-F, Yeh H-C, Swift DL. Deposition of thoron progeny in human head airways. Aerosol Sci Technol. 1993;18(4):359–375. [Google Scholar]
- 21.Zhou Y, Cheng YS. Particle deposition in a cast of human tracheobronchial airways. Aerosol Sci Technol. 2005;39(6):492–500. [Google Scholar]
- 22.Su W-C, Cheng YS. Fiber deposition pattern in two human respiratory tract replicas. Inhal Toxicol. 2006;18(10):749–760. [DOI] [PubMed] [Google Scholar]
- 23.Smith S, Cheng YS, Yeh HC. Deposition of ultrafine particles in human tracheobronchial airways of adults and children. Aerosol Sci Technol. 2001;35(3):697–709. [Google Scholar]
- 24.Su W-C, Cheng YS. Estimation of carbon nanotubes deposition in a human respiratory tract replica. J Aerosol Sci. 2015;79:72–85. [Google Scholar]
- 25.Marcias G, Fostinelli J, Catalani S, et al. Composition of metallic elements and size distribution of fine and ultrafine particles in a steelmaking factory. Int J Environ Res Public Health. 2018;15(6):1192. [DOI] [PMC free article] [PubMed] [Google Scholar]
- 26.Su W-C, Chen Y, Xi J. A new approach to estimate ultrafine particle respiratory deposition. Inhal Toxicol. 2019;31(1):35–43. [DOI] [PubMed] [Google Scholar]
- 27.Su W-C, Chen Y, Bezerra M, Wang J. Respiratory deposition of ultrafine welding fume particles. J Occup Environ Hyg. 2019;16(10):694–706. [DOI] [PubMed] [Google Scholar]
- 28.Su W-C, Chen Y, Xi J. Estimation of the deposition of ultrafine 3D printing particles in human tracheobronchial airways. J Aerosol Sci. 2020;149:105605. [Google Scholar]
- 29.Ji EH, Sun B, Zhao T, et al. Characterization of electronic cigarette aerosol and its induction of oxidative stress response in oral keratinocytes. PLoS One. 2016;11(5):e0154447. [DOI] [PMC free article] [PubMed] [Google Scholar]
- 30.Zhao T, Nguyen C, Lin C-H, et al. Characteristics of secondhand electronic cigarette aerosols from active human use. Aerosol Sci Technol. 2017;51(12):1368–1376. [Google Scholar]
- 31.Zhang L, Lin Y, Zhu Y. Transport and Mitigation of Exhaled Electronic Cigarette Aerosols in a Multizone Indoor Environment. Aerosol Air Qual Res. 2020;20 https://doi.org/10.4209 [Google Scholar]
- 32.Ingebrethsen BJ, Cole SK, Alderman SL. Electronic cigarette aerosol particle size distribution measurements. Inhal Toxicol. 2012;24(14):976–984. [DOI] [PubMed] [Google Scholar]
- 33.Fuoco FC, Buonanno G, Stabile L, Vigo P. Influential parameters on particle concentration and size distribution in the mainstream of e-cigarettes. Environ Pollut. 2014;184:523–529. [DOI] [PubMed] [Google Scholar]
- 34.Alderman SL, Song C, Moldoveanu SC, Cole SK. Particle size distribution of e-cigarette aerosols and the relationship to cambridge filter pad collection efficiency. Beitr Tab Forsch Int. 2015;26(4):183–190. [Google Scholar]
- 35.Zhang Q, Wong JPS, Davis AY, Black MS, Weber RJ. Characterization of particle emissions from consumer fused deposition modeling 3D printers. Aerosol Sci Technol. 2017;51(11):1275–1286. [Google Scholar]
- 36.Jebet A, Kibet JK, Kinyanjui T, Nyamori VO. Environmental inhalants from tobacco burning: tar and particulate emissions. Sci Afr. 2018;1:e00004. [Google Scholar]
- 37.Višić B, Kranjc E, Pirker L, et al. Incense powder and particle emission characteristics during and after burning incense in an unventilated room setting. Air Qual Atmos Health. 2018;11(6):649–663. [Google Scholar]
- 38.McCarrick S, Wei Z, Moelijker N, et al. High variability in toxicity of welding fume nanoparticles from stainless steel in lung cells and reporter cell lines: the role of particle reactivity and solubility. Nanotoxicology. 2019;13(10):1293–1309. [DOI] [PubMed] [Google Scholar]
- 39.Baldelli A, Trivanovic U, Corbin JC, et al. Typical and atypical morphology of non-volatile particles from a diesel and natural gas marine engine. Aerosol Air Qual Res. 2020;20(4):730–740. [Google Scholar]


