

Abstract
Background
Fibroblast growth factor 23 (FGF23) is a regulator of mineral metabolism, that has been linked to myocardial remodeling including development of left ventricular (LV) hypertrophy and myocardial fibrosis. The aim of this study was to investigate the relationship between intact FGF23 (iFGF23), myocardial infarct size and LV remodeling following a first acute ST-elevation myocardial infarction (STEMI).
Methods and results
Forty-two consecutive patients with first-time STEMI, single vessel disease, successfully treated with primary percutaneous coronary intervention were included. Cardiac magnetic resonance (CMR) imaging was performed at day 2, 1 week, 2 months and 1 year post MI, and blood samples were drawn at admittance and at the same time points as the CMRs. The cohort was divided according to the presence or not of heart failure post MI. In the total cohort, iFGF23 (mean ± SD) was significantly lower at day 0 (33.7 ± 20.6 pg/ml) and day 2 (31.5 ± 23.4 pg/ml) compared with a reference interval based on 8 healthy adults (43.9 pg/ml ± 19.0 pg/ml). iFGF23 increased to normal levels (55.8 ± 23.4 pg/ml) seven days post MI. In the subset of patients with signs of acute heart failure, FGF23 was higher at all measured timepoints, reaching significantly higher FGF23 levels at 2 months and 1 year following revascularization.
Conclusion
There was a reduction in iFGF23 levels during the acute phase of MI, with a normalization at seven days following revascularization. During one-year follow-up, there was a gradual increase in iFGF23 levels in patients with heart failure.
Keywords: FGF23, ST-elevation myocardial infarction, Heart failure
1. Introduction
Fibroblast growth factor 23 (FGF23) is a circulating phosphaturic molecule secreted mainly from osteocytes in bone, acting on the kidney and parathyroid glands to regulate the phosphate-homeostasis and vitamin D metabolism. FGF23 is also implicated in the sodium-phosphate cotransport in the proximal tubule in the kidney. Circulating FGF23 increases early in the development of chronic kidney disease (CKD), and FGF23 has emerged a powerful predictor of adverse outcomes in patients with CKD, and a potential target for medical therapy in these disorders [1], [2], [3].
Several studies have also demonstrated an association between high levels of FGF23, cardiovascular events and all-cause mortality irrespective of the presence of CKD [3], [4], [5], [6]. To this end, the pathophysiological role of FGF23 in cardiac disease has not been established. A recent study has suggested that cardiac myelofibroblasts are the main source of FGF23 within the myocardium [7], and persistent elevation of FGF23 has been associated with myocardial remodeling including the induction of left ventricular (LV) hypertrophy and myocardial fibrosis [8].
In contrast to chronic FGF23 elevation, the role of FGF23 in the setting of acute myocardial damage, such as myocardial infarction (MI) is less clear. FGF23 may induce positive ionotropic effects through alterations in intracellular calcium handling in cardiomyocytes [9]. This may potentially contribute to a compensatory enhancement of contractility in non-infarcted myocardium following acute MI. In animal models, FGF23 is upregulated in myofibroblasts following MI, suggesting a potential physiologic role of FGF23 in the acute phase of a MI [7]. Simultaneously, transforming growth factor-β (TGF-β) was found to be the strongest inhibitor of FGF23 expression, indicating the presence of counter-regulatory mechanisms attenuating the effects of FGF23. Moreover, activated macrophages and dendritic cells express high levels of FGF23, linking this mediator to inflammation. Hence, current data suggest that FGF23 reflects different aspects of myocardial injury and healing at different time-points following acute MI. However, although elevated FGF23 was found to be negatively associated with adverse outcomes and heart failure after MI [5], [10], the impact of FGF23 on post-MI remodeling is still unclear. In particular, few studies have addressed the dynamic relationship between myocardial remodeling and FGF23 following acute MI.
The aim of this study was therefore to investigate the time-dependent changes in FGF23 and the relationship between circulating FGF23 levels and MI size, LV remodeling and systemic biomarkers of inflammation and collagen turnover following MI.
2. Materials and methods
2.1. Study population and study design
This is a single center observational study including patients with a first-time ST-elevation MI (STEMI) due to an occlusion of a single, large coronary artery, successfully revascularized with primary percutaneous coronary intervention (pPCI), assessed by cardiac magnetic resonance (CMR) at 4 time-points during the first year following infarction: at 2 days, 1 week, 2 months and 1 year. The CMR examinations were used to assess infarct size and left ventricular (LV) volumes and ejection fraction (LVEF). Blood samples were drawn at admittance (before revascularization), and at the same time points as the CMRs.
Inclusion and exclusion criteria have previously been described [11]. In brief 42 patients with their first-time STEMI (typical chest pain and ST-elevations on ECG) were recruited if they had acute proximal/ mid-occluded single vessel disease and went through a successful revascularization (pPCI) defined as TIMI 3 flow, and no significant residual stenosis. Patients were excluded if they had evidence of previous MI based on history, ECG or angiography, or if they had more than single vessel disease on angiography or CMR. Patients were excluded if they had co-morbidities such as chronic atrial fibrillation, malignancies, autoimmune disorders or infectious diseases, as well as reinfarction during the first week or contraindications against CMR. All patients were treated according to standard percutaneous coronary intervention (PCI) procedure, with aspirin, clopidogrel, heparin and statins. Post-MI patients were treated according to current guidelines with ACE inhibitor/angiotensin receptor blockers, diuretics and beta-blockers. They were treated with an aldosterone antagonist if indicated, in accordance with the criteria used in the EPHESUS study. Patients with left ventricular dysfunction as documented by a left ventricular ejection fraction of 40 percent or lower, and heart failure as documented by the presence of pulmonary rales, chest radiography showing pulmonary venous congestion. In patients with diabetes who met the criteria for left ventricular dysfunction after acute myocardial infarction, symptoms of heart failure did not have to be demonstrated, since such patients have an increased risk of cardiovascular events similar to that of nondiabetic patients with symptoms of heart failure.[12]. None of our 8 patients receiving aldosterone antagonist, were started because of diabetes. They all had EF < 40% and clinical signs of heart failure. We divided the cohort according to the presence or absence of heart failure post MI, using +/- indication for aldosterone antagonist to divide the group.
The Regional Ethics Committee at the University of Bergen approved the study, and all the patients gave their written informed consent prior to inclusion. The investigation was performed according to the principles in the Declaration of Helsinki.
2.2. Cardiac magnetic resonance imaging
The CMR images were ECG-gated and obtained during breath holding. Patients were scanned in a supine position by a 1.5 T whole body scanner (Intera™ R10, Philips Medical Systems, Best, The Netherlands) using a dedicated cardiac coil. Resting LV function was determined with cine images using a steady-state free precession technique. For first-pass perfusion, a turbo field echo sequence with three short-axis slices per heartbeat (prospective triggering) and a selective saturation recovery prepulse was used. Gadolinium-based contrast agent (Omniscan™, Amersham Health, Little Chalfont, UK) was given at a dose of 0.075 mmol/kg. Immediately following the completion of the first-pass imaging, another 0.175 mmol/kg of contrast agent was infused, and 10–15 min following the latter infusion-delayed hyper enhancement images were acquired. All post- processing was performed on the View Forum™ Software (Philips Medical Systems, Best, The Netherlands) in a random, blinded fashion. Assessment of body surface indexed end-diastolic (LVEDVi), end-systolic (LVEDVSi), and EF was done by short-axis volumetry. Infarct size was assessed manually with plainimetry on each short-axis slice by delineating the hyper enhanced area from the non-enhanced myocardium [13].
2.3. Blood sampling protocol
Venous blood samples were collected on admission to the hospital, immediately prior to PCI, and 2 days, 7 days, 2 months and 1 year following MI. The pyregen-free blood collection tubes were immediately immersed in melting ice (ethylenediaminetetraacetic acid-containing tubes, plasma) or placed in room temperature (tubes without any additives, serum) and centrifuged within 20 min at 2500g for 20 min to obtain platelet-poor plasma, or centrifuged at 1000g for 10 min after coagulation (serum). All samples were stored at −50 °C and thawed only once. Biomarkers were analyzed in one run, after the study was completed.
2.4. Biomarkers
Plasma iFGF23 was measured by commercially available enzyme-linked immunosorbent assay (ELISA) kits from Immutopics International, San Clemente, CA, USA. Freshly thawed samples were measured in duplicates, and the reproducibility of the method monitored by analyzing 4 aliquots of a control with each assay. Intra- and inter-assay coefficient of variation for iFGF23 was <8%. The reference interval for iFGF23 based on 8 healthy adults measured in the same laboratory was on average 43.9 pg/ml (±19.0 pg/ml). Serum levels of connective tissue growth factor (s-CTGF) were determined by a sandwich enzyme-linked immunosorbent assay (ELISA) [14]. The concentration of transforming growth factor b1 (TGF-b1) was measured by EIA (R&D Systems) [15]. Serum 25(OH) vitamin D were quantified by liquid–liquid extraction, derivatization with 4-phenyl-1,2,4-triazoline-3,5-dione reagent (PTAD, Sigma-Aldrich, St. Louis, MO, USA), and analysis by liquid chromatography coupled with tandem mass spectrometry detection [16]. In this study, levels of serum 25(OH) vitamin D are termed deficient < 30 nmol/l (<12 ng/mL), insufficient at 30–50 nmol/L (12–20 ng/mL), sufficient at >50 nmol/L (>20 ng/mL) [17].
Amino-terminal propeptide of procollagen type I (PINP), amino-terminal propeptide of procollagen type III (PIINP) and carboxyterminal type I telopeptid (CITP) as markers of extracellular matrix (ECM) remodelling were analysed using a radioimmunoassay from Orion Diagnostica (Finland). The lower detection limit was 2.0 ng/mL for PINP, 0.20 ng/mL for PIIINP and 0.50 ng/mL for CITP respectively.
C-reactive protein (CRP) concentrations were measured by a particle enhanced immunoturbidimetric method with the use of Roche ModularP automated clinical chemistry analyser (Roche Diagnostics, Basel, Switzerland) and reagents of Tina-quant C-reactive protein (latex) assay (Roche Diagnostics), reference range 0–7 mg/L. Creatinine was analysed on Roche Modular P, enzymatic colorimetric assay (CREA plus), (ref.range 60–105 µmol/L for men and 45–90 µmol/L for women), calcium was analyzed on Roche Modular P using colorimetric assay (ref.range 2.15–2.55 mmol/L), inorganic phosphorus (phosphate) was analyzed on Roche modular P (ref.range 0.85–1.44 mmol/L). Troponin T (TnT) concentrations were measured on Roche Elecsys 2010 (Roche Diagnostics), with the immunoassay Troponin T (Roche Diagnostics), using biotinylated monoclonal troponin T-specific antibody and a monoclonal troponin T-specific antibody labelled with ruthenium forming a sandwich complex, reference range ≤ 14 µg/L. N-terminal pro B-type natriuretic peptide (NT-proBNP) was measured with a Roche Diagnostics NT-proBNP assay on an Elecsys 2010 analyser, reference range 0–100 pg/mL. Plasma intact parathyroid hormone (iPTH) was determined using an intact PTH assay from Abbot Diagnostics, analyzed on Architect i2000SR (Abbott Diagnostics), reference range 1.6–8.5 pmol/L.
2.5. Statistical analysis
Baseline characteristics were assessed by standard descriptive statistics. Data are expressed as mean ± SD for normally distributed data or median and range for non-normally distributed data. Area under the curve (AUC) was calculated for each biomarker at different time points during 1-year follow-up, and correlations were measured cumulatively. ANOVA was used to test for differences between the variables measured at multiple time points, with Bonferroni post-hoc testing where appropriate. Univariate correlations were performed using non-parametric methods (Spearman). Non-parametric tests (Mann-Whitney U, Kruskal-Wallis) were used to test for differences between groups. A two-tailed p-value of <0.05 was considered significant. SPSS version 24.0 was used for statistical analysis.
3. Results
3.1. iFGF and markers of extracellular matrix turn over following MI
The mean (SD) age was 58 (12) years, 34 males and 8 females, Mean (SD) BMI was 27.2 (3.4), mean (SD) blood pressure was systolic 140 (27) mmHg, and diastolic 84 (20) mmHg. 10 patients were previously treatment for hypertension, 3 were diabetic, 20 were current smokers. Mean (SD) creatinine levels were 74.9 (17.4) µmol/L.
Several significant patterns were revealed comparing the pattern during follow-up in MI patients. First, iFGF23 was significantly lower day 0 and day 2 compared with the levels measured in healthy adults, with a significant increase in concentrations during follow-up reaching levels comparable/higher than healthy adults on day 7 with the highest concentrations at 1 year, Fig. 1.
Fig. 1.
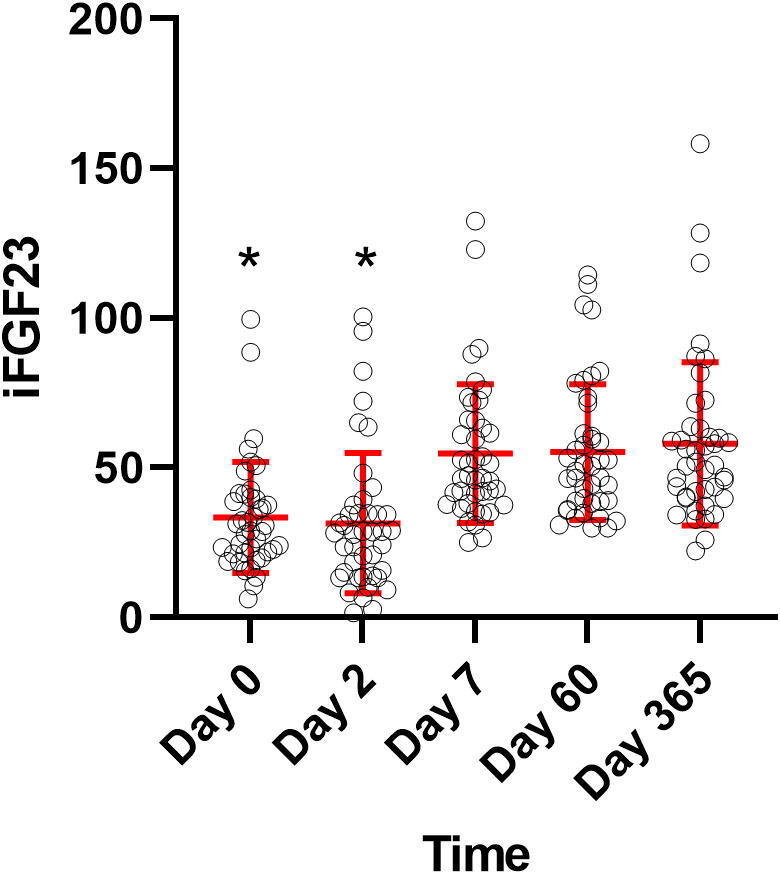
iFGF23 measurements at the different timepoints, Mean ± SD in red. Y-axis: iFGF23, X-axis: time, *p < 0.05, compared with reference interval of 43.9 pg/ml (±19.0 pg/ml). (For interpretation of the references to colour in this figure legend, the reader is referred to the web version of this article.)
Second, type I collagen degradation marker (CITP) increased significantly from day 0 to day 2, and remained elevated throughout the observation period indicating a prolonged increased collagen type I degradation following MI. Third, in contrast to this pattern, type I collagen production marker (PINP) showed a late, significant increase from day 0 reaching the highest level at 1 year, suggesting a slower increase in collagen type I synthesis. Fourth, collagen type III production marker (PIIINP) showed a rapid increase during the first week, with persistent elevation for the rest of the observation period, suggesting a rapid increase in type III collagen synthesis. Finally, there was no significant changes during follow-up in 25(OH) vitamin D, CTGF, TGF-β, creatinine, calcium, phosphate and PTH levels, Table 1. There was no correlation between iFGF23 levels and the other biomarkers at any time-points. However, there was a strong correlation between the AUC of FGF23 and CTGF during the 1-year follow-up (r = 0.53, p < 0.01).
Table 1.
Biomarkers and MRI results.
| Laboratory parameters | Day 0 | Day 2 | Day 7 | Day 60 | Day 365 | p-value (ANOVA) |
|---|---|---|---|---|---|---|
| iFGF23 (pg/ml) | 33.4 ± 18.5 | 31.5 ± 23.4 | 54.7 ± 23.1 | 55.3 ± 22.7 | 58.0 ± 27.3 | <0.001 |
| 25 (OH)D | 51.9 ± 19.7 | 48.6 ± 18.1 | 51.3 ± 19.1 | 51.7 ± 18.8 | 54.4 ± 19.6 | 0.641 |
| (nmol/l) | ||||||
| CITP (ng/mL) | 3.0 ± 1.4 | 4.1 ± 1.6 | 4.0 ± 1.8 | 4.4 ± 3.1 | 4.6 ± 2.5 | 0.006 |
| PINP (ng/mL) | 37.9 ± 17.0 | 37.9 ± 16.4 | 37.7 ± 16.0 | 46.0 ± 19.3 | 57.1 ± 46.0 | 0.002 |
| PIIINP (ng/mL) | 4.1 ± 1.3 | 4.9 ± 1.7 | 4.9 ± 1.6 | 4.6 ± 1.3 | 4.9 ± 1.5 | 0.083 |
| CRP (mg/L) | 5.5 ± 7.5 | 46.1 ± 45.7 | 17.3 ± 26.2 | 2.2 ± 1.8 | 1.8 ± 2.1 | <0.001 |
| TnT (µg/mL) | 0.16 ± 0.24 | 7.14 ± 5.18 | 4.25 ± 3.25 | 3.46 ± 2.83 | 3.13 ± 2.47 | <0.001 |
| TGF-β (ng/mL) | 19.7 ± 7.2 | 21.1 ± 6.6 | 23.3 ± 7.1 | 21.1 ± 6.4 | 22.0 ± 5.3 | 0.163 |
| CTGF (ng/mL) | 134.3 ± 66.3 | 140.8 ± 81.4 | 158.5 ± 183.3 | 163.7 ± 209.9 | 130.9 ± 71.6 | 0.749 |
| NT-proBNP | 12.9 (2.5–345.7) | 157.0 (24.7–1556.0) | 55.4 (14.4–886.4) | 34.9 (7.7–446.0) | – | <0.001 |
| CMR | ||||||
| Myocardial mass (g/m2) | – | 66.0 ± 10.1 | 65.2 ± 10.2 | 59.8 ± 10.9 | 58.3 ± 12.5 | 0.002 |
| Infarcted myocardium (g/m2) | – | 16.1 ± 7.4 | 13.7 ± 6.9 | 10.5 ± 6.5 | 9.8 ± 6.6 | <0.001 |
| Infarct size (%) | – | 24 ± 9 | 21 ± 9 | 17 ± 8 | 16 ± 8 | <0.001 |
| LVEF | – | 47.2 ± 9.0 | 50.2 ± 7.9 | 52.9 ± 9.5 | 52.7 ± 10.6 | 0.020 |
| LVEDVI (mL/m2) | – | 90.0 ± 13.6 | 90.1 ± 15.5 | 89.6 ± 16.5 | 91.1 ± 21.9 | 0.996 |
| LVESVI (mL/m2) | – | 48.5 ± 12.8 | 45.9 ± 12.8 | 45.6 ± 16.8 | 44.9 ± 19.9 | 0.614 |
Normally distributed values are expressed as mean ± SD.
iFGF23 = intact fibroblast growth factor 23, 25 (OH)D = 25-hydroxyvitamin D, CITP = C-terminal telopeptide of type I collagen, PINP = Amino terminal propeptide of type I procollagen, PIINP = amino terminal propeptide of type III procollagen, CRP = C-reactive protein, TnT = troponine T, TGF-β = transforming growth factor-β, CTGF = connective tissue growth factor, NT-proBNP = N-terminal pro B-type natriuretic peptide, EF = ejection fraction, LVEDVI = left ventricular end diastolic volume per m2, LVESVI = left ventricular end systolic volume per m2.
3.2. Cardiac magnetic resonance imaging following MI
CMR findings are listed in Table 1. In the whole group of patients there was a significant reduction in infarct size from 16.1 to 9.8 g/m2 (p < 0.001) and myocardial mass from 66.0 g/m2 to 58.3 g/m2 (p = 0.002) from day 1 to 1 year post MI. LV ejection fraction (EF) increased from 47.2% at baseline to 52.7% at one year follow-up (p < 0.001). Left ventricular end systolic volume (LVESVi) and left ventricular end diastolic volume (LVEDVi) did not change significantly, Table 1. In the group as a whole, there was no correlation between iFGF23 levels and the CMR findings at any time-points.
3.3. FGF23 levels in patients with impaired post-MI myocardial function in the acute phase
As previously described in methods, the studied cohort was divided according to the presence or absence of LV dysfunction or heart failure during the acute course of the MI. A total of 8 patients had LVEF < 40% and signs of acute heart failure. These patients had larger infarct sizes, lower EF and increased end diastolic- and end systolic volume on MRI, Fig. 2.
Fig. 2.

(A) Ejection fraction, (B) infarct size, (C) left ventricular end diastolic volume per m2, (D) left ventricular end systolic volume per m2 in patients without heart failure and with heart failure on treatment with an aldosterone antagonist post MI expressed as mean (95% CI), *p < 0.05.
All the patients with heart failure (n = 8) were treated with aldosterone antagonists following revascularization. iFGF23 levels were higher at all time-points in this group compared with the other patients (n = 34), and significantly higher at day 60 (70.6 ± 23.7 pg/ml vs 51.7 ± 21.2 pg/ml, p = 0.025) and 1 year (83.7 ± 41.8 pg/ml vs 52.0 ± 18.9 pg/ml, p = 0.019) following MI, Fig. 3. Absolute change in iFGF23 levels from baseline to 1 year follow up was 40.0 pg/ml in the heart failure group, and 21.0 pg/ml in the no heart failure group.
Fig. 3.

FGF23 levels in patients without heart failure and with heart failure on treatment with an aldosterone antagonist post MI, mean and 95% CI. Y-axis: iFGF23 concentration, X-axis: time, *p < 0.05.
In the patients with acute heart failure, there was a significant correlation between the AUC of the iFGF23 concentrations 7 days post MI and CMR findings on day 7, with LVEF (r = −0.76, p < 0.05), infarcted mass (r = 0.75, p < 0.05) and infarct size in percent of LV mass (r = 0.71, 0 < 0.05).
4. Discussion
In the present study we show a significant reduction in systemic iFGF23 levels in the very early phase of acute MI followed by a gradual increase during follow-up reaching the highest levels after one year. Notably, patients with heart failure during the acute phase following MI had a significantly higher iFGF23 concentration from day 7 post MI. In contrast, no direct relationship was found between iFGF23 levels and infarct size, myocardial volumes- or function measured by cardiac MRI. There was no correlation with other systemic markers of MI, inflammation, collagen turnover or LV remodeling. Taken together, the present findings suggest that the early suppression of systemic iFGF23 levels in the acute phase of MI is not directly related to the size of myocardial injury or myocardial reperfusion. Interestingly, the largest reduction in iFGF23 levels occurred in the group of patients without evidence of acute LV dysfunction, potentially suggesting that the iFGF23 reduction in the acute phase of MI may represent a physiological response to counteract myocardial failure.
Our findings are in accordance with clinical data from Takahashi et al who found lower levels of FGF23 in MI patients compared with controls, looking at 44 patients with acute MI who underwent PCI. They followed 22 patients with echocardiography 6 months post MI and found an association between high FGF23 and low EF at 6 months [18]. Our study extends these observations to a larger population and a longer duration of one year of follow-up, using cardiac MRI to quantify the size of MI and function; also including a large number of biomarkers of collagen turnover.
We found increased FGF 23 levels in subjects with acute heart failure or LV dysfunction following acute MI as also have been reported by others. Fuernau et al. measured FGF23 in patients with acute MI complicated by cardiogenic shock [19]. They found non-survivors to have significantly higher FGF23 levels at 1, 2 and 3 days post MI. However, the negative prognostic association of FGF23 with adverse outcomes was only significant in patients with creatinine levels above median at admittance [19]. Poss et al. found significantly increased levels of FGF23 in patients with cardiogenic shock, compared with patients with uncomplicated MI [8]. Reindl et al. looked at 88 patients with acute MI who also underwent PCI. They found higher FGF23 levels in patients who developed LV remodeling (13%) on MRI, examined 2 days and 4 months post MI [20]. Our findings are in line with these previous reports, demonstrating higher systemic FGF23 levels in subjects with the clinically worst prognosis. However, our study adds to these findings demonstrating that there is no direct relationship between systemic levels of FGF23 in the acute phase of an MI and the infarct size, LV mass, LV volumes or LVEF assessed by CMR.
Our findings are in apparent contrast to the increasing number of publications suggesting that iFGF23 have direct myocardial actions that may be relevant in the acute MI [7], [21]. FGF23 has been shown to induce LV hypertrophy independently of the most common FGF23 receptor complex consisting of Klotho/ FGF23 receptor, by activating FGF receptor 4 (FGFR4) and subsequently the calcineurin/ nuclear factor of activated T cells (NFAT) signaling in vivo and in vitro [22], [23]. In situations with decreased FGF23 post MI, calcitriol levels increase leading to a blockade of the NFAT signaling pathway. This is possibly a protective mechanism attenuating the development of LV hypertrophy and myocardial fibrosis. It may be speculated that in large MIs, this downregulation is overturned into upregulation of FGF23 and enhanced development of fibrosis post-MI with increased levels of local produced FGF23 and an upregulation of FGFR4 in the myocardium secondary to inflammation [24].
In vitro data also indicate that FGF23 stimulate proliferation and migration of fibroblasts essential to development of replacement fibrosis necessary for normal scar healing and the prevention of wound rupture [25]. In the acute phase a downregulation of FGF23 might protect the heart from developing scarring and fibrosis by increasing the level of calcitriol and thereby blocking the PCɣ/C/NFAT signaling pathway for FGF23 in the myocardium [9]. Inflammation might be a mechanism linking FGF23 to cardiovascular disease [26]. It has been shown that FGF23 in cardiac fibroblasts, is upregulated in systemic inflammation [24]. Herein we found a significantly increased CRP (p < 0.001) at day 2 and day 7 post-MI, Table 1, but there was no significant difference between CRP levels in the 2 groups of patients in our study, questioning the link between FGF23 and inflammation in clinical MI.
Slavic et al have identified aldosterone as an important stimulator of bony FGF23 transcription, where blockade with spironolactone normalized serum FGF23 levels and bone transcription [27]. Serum aldosterone levels correlated with FGF23 in patients with non-ischemic heart failure [28]. Aldosterone increased FGF23 levels in vitro as well as in mice treated with deoxycorticosterone acetat (DOCA) leading to hypertension and end-organ damage [29]. These findings indicate that aldosterone stimulates bone-mediated FGF23 synthesis. This is consistent with our findings where the group of patients with heart failure, treated with an aldosterone antagonist, had higher FGF23 compared with patients without heart failure. The level of FGF23 might have been even higher in these patients without treatment with an aldosterone antagonist.
5. Strengths and limitations
The study explores a relatively small sample size, which makes it susceptible to the impact of biological heterogeneity, but the trial was designed with strict selection criteria to reduce the number of confounders. The cohort represents a unique and homogenous patient sample. When dividing into two groups based on the presence or absence of acute heart failure, we faced a power-problem since the group with the additional treatment contained only 8 patients, meaning that the data provide trends more than statistically significant data.
6. Conclusion
iFGF23 levels were significantly decreased prior to, and at 2 days following pPCI in subjects with a first-time STEMI successfully revascularized. iFGF23 levels normalized on day 7 in patients without heart failure. There was a gradual increase in iFGF23 levels, above normal levels, during one-year follow-up in patients with signs and/or symptoms of heart failure during the acute phase of the MI despite the use of aldosterone antagonist.
Funding
This research was funded by a phd grant to Inga Strand Thorsen from the Western Norway Health Authorities (grant number F-10028/912030).
Declaration of Competing Interest
The authors report no relationships that could be construed as a conflict of interest.
References
- 1.Fliser D., Kollerits B., Neyer U., Ankerst D.P., Lhotta K., Lingenhel A. Fibroblast growth factor 23 (FGF23) predicts progression of chronic kidney disease: the Mild to Moderate Kidney Disease (MMKD) Study. J. Am. Soc. Nephrol.: JASN. 2007;18:2600–2608. doi: 10.1681/ASN.2006080936. [DOI] [PubMed] [Google Scholar]
- 2.Isakova T., Xie H., Yang W., Xie D., Anderson A.H., Scialla J. Fibroblast growth factor 23 and risks of mortality and end-stage renal disease in patients with chronic kidney disease. JAMA. 2011;305:2432–2439. doi: 10.1001/jama.2011.826. [DOI] [PMC free article] [PubMed] [Google Scholar]
- 3.Kendrick J., Cheung A.K., Kaufman J.S., Greene T., Roberts W.L., Smits G. FGF-23 associates with death, cardiovascular events, and initiation of chronic dialysis. J. Am. Soc. Nephrol.: JASN. 2011;22:1913–1922. doi: 10.1681/ASN.2010121224. [DOI] [PMC free article] [PubMed] [Google Scholar]
- 4.Parker B.D., Schurgers L.J., Brandenburg V.M., Christenson R.H., Vermeer C., Ketteler M. The associations of fibroblast growth factor 23 and uncarboxylated matrix Gla protein with mortality in coronary artery disease: the Heart and Soul Study. Ann. Intern. Med. 2010;152:640–648. doi: 10.1059/0003-4819-152-10-201005180-00004. [DOI] [PMC free article] [PubMed] [Google Scholar]
- 5.ter Maaten J.M., Voors A.A., Damman K., van der Meer P., Anker S.D., Cleland J.G. Fibroblast growth factor 23 is related to profiles indicating volume overload, poor therapy optimization and prognosis in patients with new-onset and worsening heart failure. Int. J. Cardiol. 2018;253:84–90. doi: 10.1016/j.ijcard.2017.10.010. [DOI] [PubMed] [Google Scholar]
- 6.Jiang M., Gong D., Fan Y. Elevated fibroblast growth factor-23 and risk of cardiovascular disease or mortality in the general population: A meta-analysis. Int. J. Cardiol. 2016;222:342–345. doi: 10.1016/j.ijcard.2016.07.276. [DOI] [PubMed] [Google Scholar]
- 7.Schumacher D., Alampour-Rajabi S., Ponomariov V., Curaj A., Wu Z., Staudt M. Cardiac FGF23: new insights into the role and function of FGF23 after acute myocardial infarction. Cardiovasc. Pathol. 2019;40:47–54. doi: 10.1016/j.carpath.2019.02.001. [DOI] [PubMed] [Google Scholar]
- 8.Itoh N., Ohta H. Pathophysiological roles of FGF signaling in the heart. Front. Physiol. 2013;4:247. doi: 10.3389/fphys.2013.00247. [DOI] [PMC free article] [PubMed] [Google Scholar]
- 9.Touchberry C.D., Green T.M., Tchikrizov V., Mannix J.E., Mao T.F., Carney B.W. FGF23 is a novel regulator of intracellular calcium and cardiac contractility in addition to cardiac hypertrophy. Am. J. Physiol. Endocrinol. Metabolism. 2013;304:E863–E873. doi: 10.1152/ajpendo.00596.2012. [DOI] [PMC free article] [PubMed] [Google Scholar]
- 10.Poss J., Mahfoud F., Seiler S., Heine G.H., Fliser D., Bohm M. FGF-23 is associated with increased disease severity and early mortality in cardiogenic shock. Eur. Heart J. Acute Cardiovasc. Care. 2013;2:211–218. doi: 10.1177/2048872613494025. [DOI] [PMC free article] [PubMed] [Google Scholar]
- 11.Orn S., Manhenke C., Greve O.J., Larsen A.I., Bonarjee V.V., Edvardsen T. Microvascular obstruction is a major determinant of infarct healing and subsequent left ventricular remodelling following primary percutaneous coronary intervention. Eur. Heart J. 2009;30:1978–1985. doi: 10.1093/eurheartj/ehp219. [DOI] [PubMed] [Google Scholar]
- 12.Pitt B., Remme W., Zannad F., Neaton J., Martinez F., Roniker B. Eplerenone, a selective aldosterone blocker, in patients with left ventricular dysfunction after myocardial infarction. New Engl. J. Med. 2003;348:1309–1321. doi: 10.1056/NEJMoa030207. [DOI] [PubMed] [Google Scholar]
- 13.Manhenke C., Ueland T., Jugdutt B.I., Godang K., Aukrust P., Dickstein K. The relationship between markers of extracellular cardiac matrix turnover: infarct healing and left ventricular remodelling following primary PCI in patients with first-time STEMI. Eur. Heart J. 2014;35:395–402. doi: 10.1093/eurheartj/eht482. [DOI] [PubMed] [Google Scholar]
- 14.Bergestuen D.S., Gravning J., Haugaa K.H., Sahakyan L.G., Aakhus S., Thiis-Evensen E. Plasma CCN2/connective tissue growth factor is associated with right ventricular dysfunction in patients with neuroendocrine tumors. BMC Cancer. 2010;10:6. doi: 10.1186/1471-2407-10-6. [DOI] [PMC free article] [PubMed] [Google Scholar]
- 15.Ueland T., Lekva T., Otterdal K., Dahl T.B., Olarescu N.C., Jorgensen A.P. Increased serum and bone matrix levels of transforming growth factor {beta}1 in patients with GH deficiency in response to GH treatment. Eur. J. Endocrinol./Eur. Federation Endocrine Soc. 2011;165:393–400. doi: 10.1530/EJE-11-0442. [DOI] [PubMed] [Google Scholar]
- 16.Naesgaard P.A., LeonDeLaFuente R.A., Nilsen S.T., Woie L., Aarsland T., Brede C. Serum 25(OH)D is a 2-year predictor of all-cause mortality, cardiac death and sudden cardiac death in chest pain patients from Northern Argentina. PLoS One. 2012;7:e43228. doi: 10.1371/journal.pone.0043228. [DOI] [PMC free article] [PubMed] [Google Scholar]
- 17.Health NIo. Vitamin D summary. https://odsodnihgov/factsheets/VitaminD-HealthProfessional/. National Institutes of Health, 2016.
- 18.Takahashi H., Ozeki M., Fujisaka T., Morita H., Fujita S.I., Takeda Y. Changes in serum fibroblast growth factor 23 in patients with acute myocardial infarction. Circ. J. 2017;82:767–774. doi: 10.1253/circj.CJ-17-0826. [DOI] [PubMed] [Google Scholar]
- 19.Fuernau G., Poss J., Denks D., Desch S., Heine G.H., Eitel I. Fibroblast growth factor 23 in acute myocardial infarction complicated by cardiogenic shock: a biomarker substudy of the Intraaortic Balloon Pump in Cardiogenic Shock II (IABP-SHOCK II) trial. Critical care (London, England). 2014;18:713. doi: 10.1186/s13054-014-0713-8. [DOI] [PMC free article] [PubMed] [Google Scholar]
- 20.Reindl M., Reinstadler S.J., Feistritzer H.J., Mueller L., Koch C., Mayr A. Fibroblast growth factor 23 as novel biomarker for early risk stratification after ST-elevation myocardial infarction. Heart. 2017;103:856–862. doi: 10.1136/heartjnl-2016-310520. [DOI] [PubMed] [Google Scholar]
- 21.Gutierrez O.M., Januzzi J.L., Isakova T., Laliberte K., Smith K., Collerone G. Fibroblast growth factor 23 and left ventricular hypertrophy in chronic kidney disease. Circulation. 2009;119:2545–2552. doi: 10.1161/CIRCULATIONAHA.108.844506. [DOI] [PMC free article] [PubMed] [Google Scholar]
- 22.Faul C. Cardiac actions of fibroblast growth factor 23. Bone. 2016 doi: 10.1016/j.bone.2016.10.001. [DOI] [PMC free article] [PubMed] [Google Scholar]
- 23.Grabner A., Amaral A.P., Schramm K., Singh S., Sloan A., Yanucil C. Activation of cardiac fibroblast growth factor receptor 4 causes left ventricular hypertrophy. Cell Metab. 2015;22:1020–1032. doi: 10.1016/j.cmet.2015.09.002. [DOI] [PMC free article] [PubMed] [Google Scholar]
- 24.Yan L., Bowman M.A. Chronic sustained inflammation links to left ventricular hypertrophy and aortic valve sclerosis: a new link between S100/RAGE and FGF23. Inflammation Cell Signal. 2014;1 doi: 10.14800/ics.279. [DOI] [PMC free article] [PubMed] [Google Scholar]
- 25.Hao H., Li X., Li Q., Lin H., Chen Z., Xie J. FGF23 promotes myocardial fibrosis in mice through activation of beta-catenin. Oncotarget. 2016;7:64649–64664. doi: 10.18632/oncotarget.11623. [DOI] [PMC free article] [PubMed] [Google Scholar]
- 26.Dai B., David V., Martin A., Huang J., Li H., Jiao Y. A comparative transcriptome analysis identifying FGF23 regulated genes in the kidney of a mouse CKD model. PLoS ONE. 2012;7 doi: 10.1371/journal.pone.0044161. [DOI] [PMC free article] [PubMed] [Google Scholar]
- 27.Slavic S., Ford K., Modert M., Becirovic A., Handschuh S., Baierl A. Genetic ablation of Fgf23 or klotho does not modulate experimental heart hypertrophy induced by pressure overload. Sci. Rep. 2017;7:11298. doi: 10.1038/s41598-017-10140-4. [DOI] [PMC free article] [PubMed] [Google Scholar]
- 28.Imazu M., Takahama H., Asanuma H., Funada A., Sugano Y., Ohara T. Pathophysiological impact of serum fibroblast growth factor 23 in patients with nonischemic cardiac disease and early chronic kidney disease. Am. J. Physiol. Heart Circ. Physiol. 2014;307:H1504–H1511. doi: 10.1152/ajpheart.00331.2014. [DOI] [PubMed] [Google Scholar]
- 29.Zhang B., Umbach A.T., Chen H., Yan J., Fakhri H., Fajol A. Up-regulation of FGF23 release by aldosterone. Biochem. Biophys. Res. Commun. 2016;470:384–390. doi: 10.1016/j.bbrc.2016.01.034. [DOI] [PubMed] [Google Scholar]