Abstract
Stable atherosclerotic plaques are characterized by a thick extracellular matrix (ECM)-rich fibrous cap populated by protective ACTA2+ myofibroblast (MF)-like cells, assumed to be almost exclusively derived from smooth muscle cells (SMC). Herein, we show that in murine and human lesions, 20 to 40% of ACTA2+ fibrous caps cells, respectively, are derived from non-SMC sources, including endothelial cells (EC) or macrophages that have undergone Endothelial-to-Mesenchymal (EndoMT) or Macrophage-to-Mesenchymal (MMT) transitions. In addition, we show that SMC-specific knockout of the platelet derived growth factor receptor beta (PDGFRB) in Apoe−/− mice fed a Western diet (WD) for 18 weeks resulted in brachiocephalic artery (BCA) lesions nearly devoid of SMC but with no changes in lesion size, remodeling, or indices of stability including percent of ACTA2+ fibrous cap cells. However, prolonged WD feeding of SMC-PDGFRB knockout mice resulted in reduced indices of stability, indicating that EndoMT and MMT-derived MFs cannot compensate indefinitely for loss of SMC-derived MFs. Using single cell and bulk RNA-seq analyses of the BCA region and in vitro models, we provide evidence that SMC to MF transitions (SMC-MFT) are induced by PDGF and TFGβ and dependent on aerobic glycolysis, while EndoMT is induced by IL1β and TGFβ. Together, we provide evidence that the ACTA2+ fibrous cap originates from a tapestry of cell types, which transition to an MF state through distinct signaling pathways that are either dependent on or associated with extensive metabolic reprogramming.
Despite significant advances in treating cardiovascular disease, rupture and erosion of unstable atherosclerotic plaques leading to myocardial infarction or stroke remain the leading cause of death worldwide. Detailed pathologic analyses of human arteries have demonstrated that lesions with a thick extracellular matrix (ECM)-rich fibrous cap, with many ACTA2+ and few CD68+ cells are more stable and less likely to rupture1–3. It has been previously assumed that nearly all of the protective ACTA2+ cells that produce ECM in the fibrous cap are derived from smooth muscle cells (SMC)1,3. However, the relative contributions and functions of the SMC and non-SMC present within the fibrous cap have not been rigorously defined.
Recent lineage-tracing studies of SMC, endothelial cells (EC), and macrophages have revealed that marker protein staining alone is insufficient to identify the origins of lesion cells. Our previous studies have shown that greater than 80% of the SMC within atherosclerotic lesions downregulate their characteristic markers, including ACTA2 and almost half of these ACTA2− SMC exhibit markers and functional characteristics of macrophages, mesenchymal stem cells, or myofibroblasts (MF)4,5. Several recent studies using EC-lineage tracing have shown that endothelial-to-mesenchymal transitions (EndoMT) account for a large fraction of mesenchymal cells in atherosclerosis. Specifically, one mouse study estimated that 20–45% of all lesion cells positive for the MF marker, FAP, were of endothelial origin, and another mouse study found that more than 20% of all EC express ACTA2 after 16 weeks of Western diet (WD)6,7. Importantly, EC-specific loss of FRS2α (which impaired FGF signaling and increased the rate of EndoMT) exacerbated lesion development, suggesting that dysregulated EndoMT was detrimental for atherogenesis6. Additionally, previous work has shown that a subset of ACTA2+ cells in human coronary lesions are of myeloid origin8, and up to 17% of ACTA2+ cells in aortic root lesions of mice are derived from LysM-Cre+ cells that have undergone macrophage-to-myofibroblast transitions (MMT)9. Whereas these studies show that lesion cells exhibit remarkable plasticity, they have not defined the contribution of these cells to the fibrous cap or if transitions impart beneficial or detrimental effects on lesion stability.
In fact, despite decades of research, little is known regarding the factors and mechanisms that promote formation and maintenance of a stable fibrous cap. Previous studies from our lab have shown that SMC are critical for maintaining indices of lesion stability and protective fibrotic responses like ECM deposition and organization. Radiation exposure or SMC-specific knockout of Il1r1, Col15a1, or Oct4, resulted in lesions with multiple characteristics of instability including reduced SMCs in the lesion, decreased collagen content, and impaired fibrous cap formation5,10–13. Together, results suggest that therapeutically augmenting SMC accumulation within the fibrous cap would result in increased lesion stability. While numerous studies have identified pathways that regulate SMC dedifferentiation, migration, and ECM synthesis in vitro, no factors have been shown to be essential for their accumulation within the fibrous cap during atherosclerosis.
Platelet-derived growth factor (PDGF) is a key mitogen and chemotactic factor for SMC recruitment during vascular development14. Yet, despite strong evidence that SMC promote lesion stability, previous studies have proposed treating atherosclerosis using PDGFRB antagonists, assuming this would reduce lesion size by inhibiting SMC recruitment and proliferation. However, this approach resulted in evidence of reduced lesion stability, including delayed fibrous cap formation15,16. These results suggest that PDGFRB signaling plays a critical role in regulating fibrous cap development, but fail to provide direct insight into the role of PDGFRB signaling in SMC and its role in maintaining lesion stability.
SMC investment in the atherosclerotic lesion and fibrous cap requires PDGFRB signaling
To test if loss of PDGFRB in SMC is critical for formation and maintenance of a stable lesion and fibrous cap, we generated tamoxifen-inducible SMC-specific conditional Pdgfrb knockout mice with simultaneous SMC lineage-tracing on an Apoe−/− background (Apoe−/− Myh11-CreERT2 ROSA26-STOPFL/FL-eYFP PdgfrbFL/FL or −WT/WT mice); henceforth referred to as PdgfrbSMC-Δ/Δ or PdgfrbSMC-WT/WT mice, respectively, after tamoxifen treatment (Extended Data Fig 1, see Methods). PdgfrbSMC-Δ/Δ mice exhibited highly efficient PDGFRB knockout (Extended Data Fig 1c). Following 18 weeks of WD feeding (Figure 1a), PdgfrbSMC-Δ/Δ mice had a 90% reduction in Myh11-eYFP+ cell investment into advanced brachiocephalic (BCA) lesions (Figure 1b,c) and a 94% reduction in Myh11-eYFP+ cells in the fibrous cap area (standardized herein as the 30μm subluminal space, Figure 1b,c & Supplement 1) versus PdgfrbSMC-WT/WT littermate controls. Similarly, aortic root lesions showed a 71% decrease in Myh11-eYFP+ cells within the fibrous cap in PdgfrbSMC-Δ/Δ versus PdgfrbSMC-WT/WT mice (Extended Data Fig 2). Loss of SMC accumulation in lesions was likely due to impaired migration into the lesion and/or to retention of SMC within the media since we found no change in SMC dedifferentiation or apoptosis, and increased proliferation of medial SMC (Extended Data Fig 2d–i). These data show that SMC-PDGFRB signaling plays a critical role in SMC investment within the lesion and the fibrous cap. Given the dogma that SMC are required for plaque stability3, we expected to see a profound decrease in multiple indices of lesion stability. Instead, we observed no significant differences in any of the indices of stability examined including collagen content of the lesion and fibrous cap (Figure 1d,e), intraplaque hemorrhage (TER119; Figure 1f,g), and necrotic core area (Extended Data Fig 3e). Furthermore, PdgfrbSMC-Δ/Δ mice showed no differences in lesion area, remodeling indices (external elastic lamina (EEL) area), or lumen area, as compared to littermate control PdgfrbSMC-WT/WT mice after 18 weeks of WD (Extended Data Fig 3a–d). Most surprisingly, the profound decrease in SMC investment in lesions was also not associated with a reduction in ACTA2+ cells within lesions (Figure 1h).
Figure 1: SMC-PDGFRB KO resulted in a dramatic reduction in SMC investment but no effect on indices of stability in BCA lesions including the number of ACTA2+ cells in the fibrous cap following 18 weeks of WD feeding.
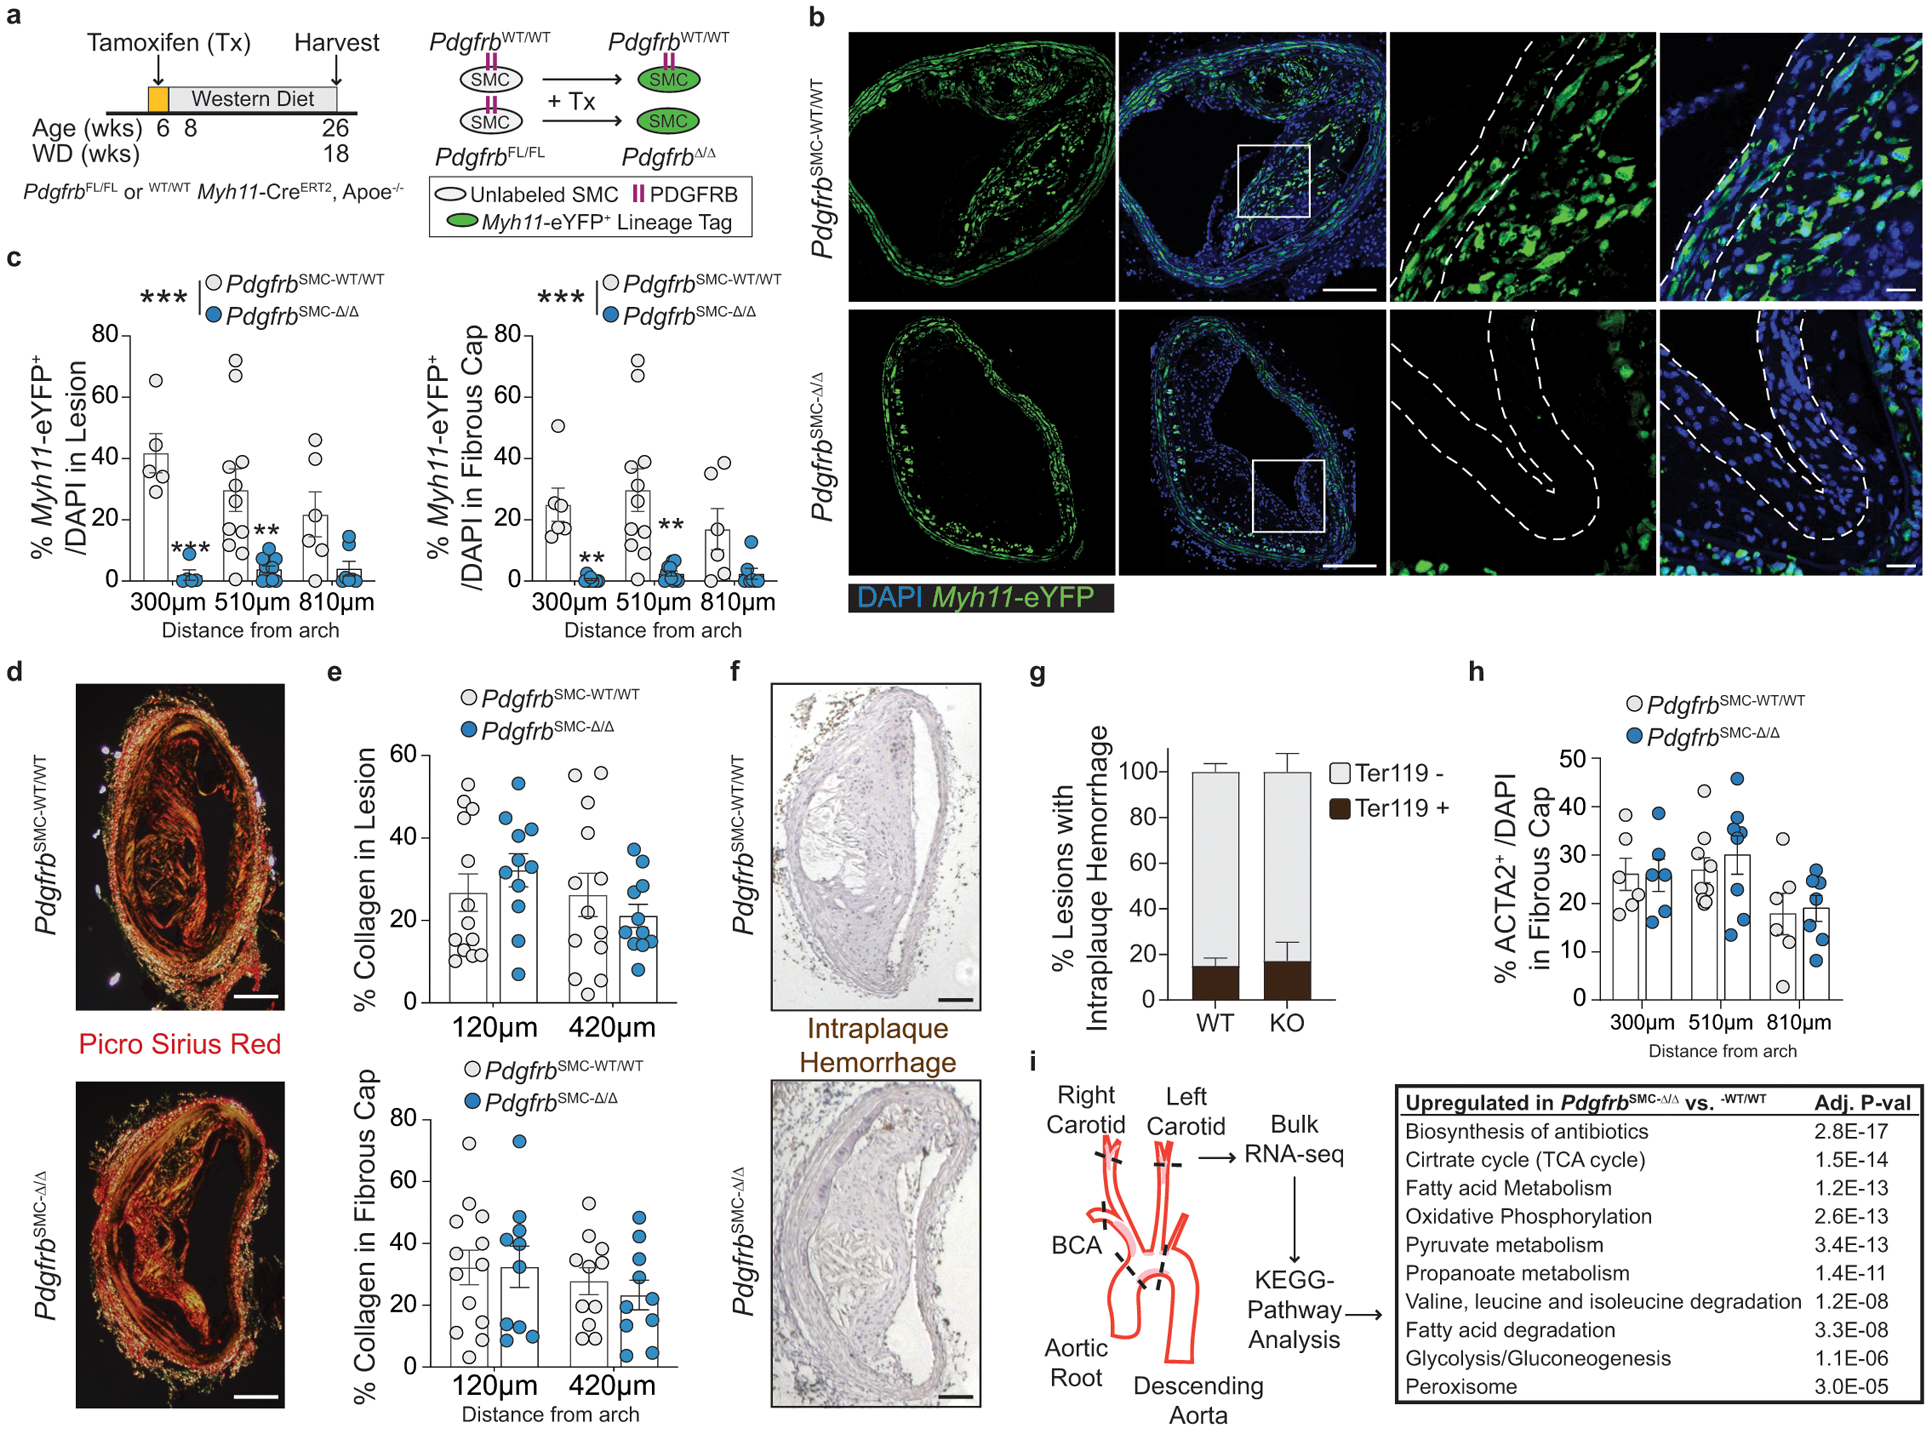
(A) BCA lesions of PDGFRB WT and KO littermate mice fed WD for 18 weeks were harvested and analyzed for SMC content. (B top) PdgfrbSMC-WT/WT mice exhibited robust SMC accumulation within the lesion and fibrous cap, outlined by dashed lines. (B bottom) PdgfrbSMC-Δ/Δ mice showed greatly reduced numbers of SMC within the lesion and fibrous cap. (C) Quantification of single cell counting of eYFP/DAPI within the lesion and fibrous cap at three locations. ***p-values < 0.0001. (D) Representative images of PicroSirius Red staining representing collagen deposition. (E) No significant changes were observed for collagen deposition within the lesion and fibrous cap. (F) Representative images of Ter119 staining for intraplaque hemorrhage. (G) There were no significant differences in Ter119 staining at three locations past the aortic arch. (H) Despite loss of SMC, the total percentage of ACTA2+ cells was unchanged in the fibrous cap. (I) Schematic for RNA-seq analysis on the entire carotid, BCA, aortic arch region showing the top upregulated pathways in the PdgfrbSMC-Δ/Δ vs. PdgfrbSMC-WT/WT mice. Scale bar: 100μm (B, D, F) or 20μm (B zoom). X-axis values represent distance past the aortic arch. Graphs were analyzed using two-way ANOVA with Sidak correction and multiple comparisons (C, E, G, H), biologically independent animals are indicated as individual dots (C, E, H), intraplaque hemorrhage was analyzed as either positive or negative staining and n = 12, 13, 11 (WT: 240, 540, 840 μm) or n = 10, 12, 9 (KO) (G), error bars represent mean ± SEM, p-values displayed refer to two-way ANOVA between genotype unless otherwise indicated.
Major transcriptional changes in energy metabolism underlie loss of SMC-PDGFRB signaling
To better understand how lesions maintain indices of stability despite nearly complete loss of SMC, we performed bulk RNA-sequencing (RNA-seq) to assess transcriptional differences between the BCA lesion-containing region of PdgfrbSMC-Δ/Δ and PdgfrbSMC-WT/WT mice (Figure 1i). Pathway analysis showed that substrate utilization and energy production (bioenergetic) pathways comprised nearly all of the top 10 upregulated pathways in the PdgfrbSMC-Δ/Δ compared to PdgfrbSMC-WT/WT mice, suggesting that significant bioenergetic changes occur within the lesions and may be required to maintain plaque stability in the absence of SMC. Importantly, these dramatic changes represent the cumulative differences in transcription of all cell types within the lesion, media, and adventitia of the entire BCA, aortic arch, and the carotid area downstream of initial PDGFRB knockout in SMC. Of interest, altered glycolysis-derived metabolite concentrations have been shown to correlate with, and may be a useful biomarker of symptomatic human lesions17. Therefore, the major differences noted in cellular metabolism following loss of SMC-PDGFRB signaling, despite maintaining lesion stability indices, may be a predictor of a vulnerable lesion. However, it is unclear if these metabolism-related transcriptional changes were the result of global bioenergetic reprogramming in all vessel wall and lesion cells (including SMC, EC, adventitial cells, and macrophages), or if one or a few specific cell populations reprogram to compensate for the lack of SMC-derived cells in the lesion and fibrous cap.
To further understand these changes, we performed single cell RNA-sequencing (scRNA-seq) on three groups of cells from the BCA region of PdgfrbSMC-Δ/Δ and PdgfrbSMC-WT/WT mice: (group 1) sorted Myh11-eYFP+ derived SMC from the media (to determine transcriptional changes that may prevent SMC from exiting the media), (group 2) unsorted medial and adventitial cells (to determine the overall impact of loss of SMC-PDGFRB), and (group 3) cells isolated from the lesion (to investigate transcriptional changes in lesion cells that help compensate for the loss of SMC) (Figure 2). Uniform Manifold Approximation and Projection (UMAP) analysis showed clusters of cells aligning with published studies18–20, including seven SMC-derived clusters. Interestingly, we observed a decrease in clusters 1–3 consisting of Myh11-eYFP+ cells expressing classic SMC markers, including Myh11, Acta2, and Tagln), a decrease in cluster 6 (a Myh11-eYFP+ cluster expressing Col15a1; Extended Data 4e), and increases in clusters 4 and 5 (Myh11-eYFP+ cells lacking expression of SMC-marker genes but expressing ECM and osteochondrogenic marker genes like Sox9, Trpv4, and Alpl) in PdgfrbSMC-Δ/Δ mice (Figure 2 & Extended Data 4f–h). Additionally, we found that BCA lesions from PdgfrbSMC-Δ/Δ mice had an increase in cluster 12 including macrophages expressing antioxidant defense genes, or “Mox”21,22, clusters 14 & 15 (pro-inflammatory monocytes), and cluster 18 (T-cells), while having a decreased proportion of clusters 10 (Cx3cr1- and Cd68-expressing macrophages) and cluster 17 (B-cells; Figure 2d). These changes in cell clusters between PdgfrbSMC-Δ/Δ and PdgfrbSMC-WT/WT were further assessed as a function of spatial location and origin (i.e. “group”), confirming that loss of PDGFBR plays a key role in SMC (group 3) phenotype (Extended Data Fig 4b, bottom) and that there are distinct effects in the lesion downstream of SMC-PDGFBR KO in cells expressing multiple immune markers in the lesion (e.g. group 2, Extended Data 4b, middle). Furthermore, four of the top five upregulated pathways were implicated in regulating metabolic state, including oxidative phosphorylation, which was significantly upregulated in the sorted medial Myh11-eYFP+ cells (group 3), and in the unsorted lesion cells in PdgfrbSMC-Δ/Δ mice (group 2; Figure 2e). These scRNA-seq data show that PDGF-dependent metabolic reprogramming takes place within both SMC-derived medial and lesion cells during atherosclerosis.
Figure 2: scRNA-seq analysis of advanced BCA lesions in PdgfrbSMC-WT/WT and PdgfrbSMC-Δ/Δ identified 19 distinct cell clusters, including a primarily SMC-derived ECM cluster that is Pdgfrb-dependent.
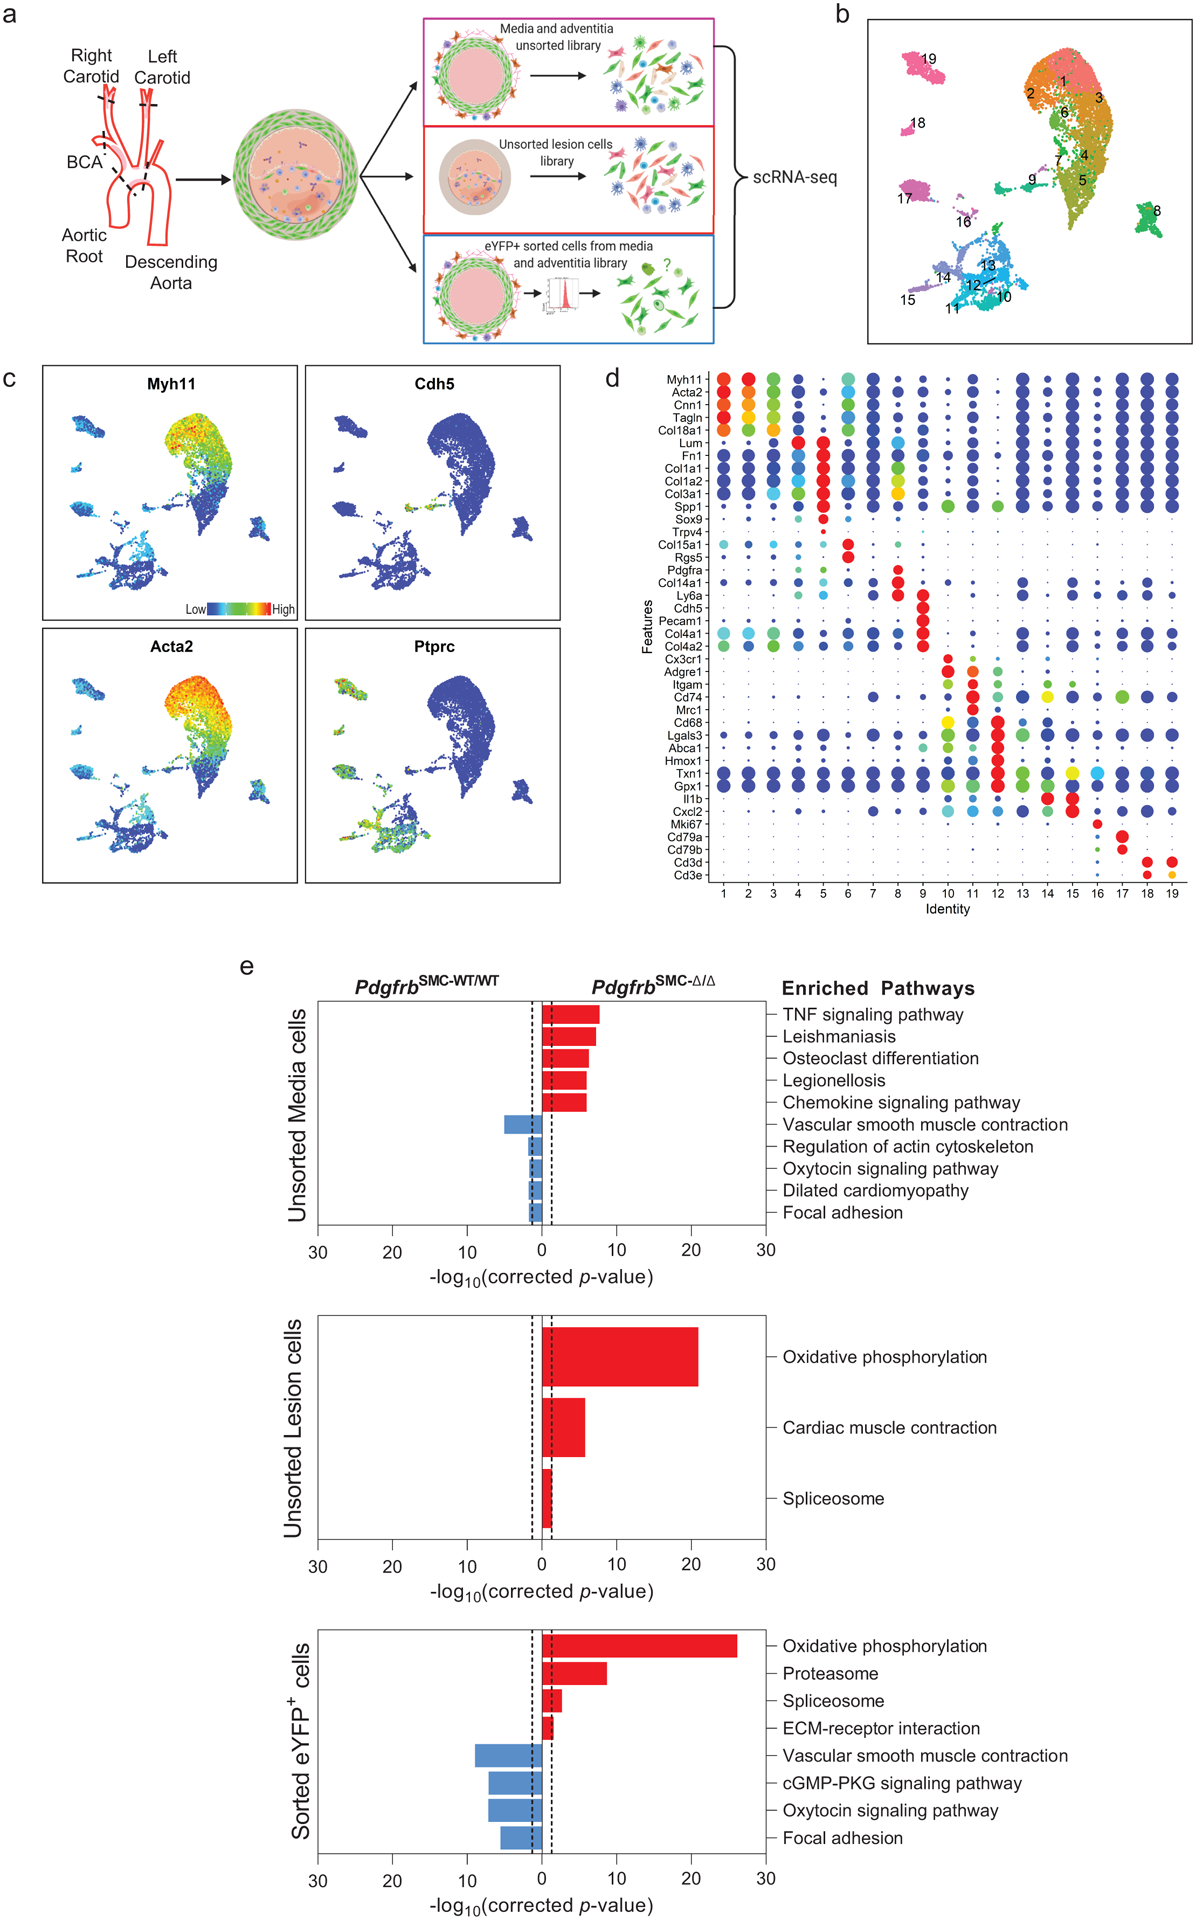
A) Schematic of experimental design showing that cells were harvested for scRNA-seq from micro dissected advanced BCA lesions from PdgfrbSMC-WT/WT and PdgfrbSMC-Δ/Δ mice fed 18 weeks of WD. Three libraries were generated per genotype: 1. unsorted medial and underlying adventitial cells (top right); 2. unsorted lesion cells (middle right); and 3. Myh11-eYFP+ sorted cells from the medial and underlying adventitial cells (lower right). These data are the results of 6 Chromium 10X libraries made from 7 mice. (B) UMAP results shows 19 different clusters and (C) UMAP analysis shows cells from PdgfrbSMC-WT/WT (right) and from PdgfrbSMC-Δ/Δ (left), colored by origin/library. (D) Dot plot showing gene expression of traditional markers used for cell identity, as well as markers related to unique clusters. Clusters 1–3 correspond to mature SMC with the expression of Myh11+, Acta2+, Cnn1+. Cluster 4 appears to be a transition state with low expression of traditional markers and with cells activating Ly6a. Cluster 5 is an ECM/osteo-chondrocyte-like phenotype. Cluster 6 has lowered but still present expression of SMC markers including Myh11+ and Acta2+, but high expression of Col15a1. Cluster 7 appears as an intermediate SMC-associated. Cluster 8 has high levels of Ly6a and ECM genes, likely representing a fibroblast population. Cluster 9 is characterized by endothelial markers. Clusters 10–15 are different macrophage cell types. Cluster 16 is composed of cells that are in the process of replicating, indicated by Mki67 expression. Cluster 17 represents B cells. Clusters 18 and 19 represent T-cells. (E) Pathway analysis shows the top up-regulated (red) and down-regulated (blue) pathways in PdgfrbSMC-Δ/Δ compared to PdgfrbSMC-WT/WT in (top) Unsorted media and adventitia cells, (middle) Unsorted lesion cells, and (bottom) Sorted media and adventitia cells. Importantly, Oxidative Phosphorylation is notably upregulated in the PdgfrbSMC-Δ/Δ mice consistent with our observations in the bulk RNA-seq.
ACTA2 cells in the fibrous cap are derived from multiple cell origins
To understand the populations of cells that comprise the ACTA2+ fibrous cap (Figure 1h), we first quantified Myh11-eYFP+ SMC within the ACTA2+ fibrous cap in PdgfrbSMC-WT/WT mice. Unexpectedly, we found that only 60% of the ACTA2+ fibrous cap cells were derived from SMC (Figure 3a), meaning that a large fraction of the ACTA2+ fibrous cap cells are normally derived from non-SMC sources. To determine their sources, we assessed co-staining of putative MMT and EndoMT markers, as both macrophages and EC have been shown to express ACTA2 in atherosclerotic lesions6–9,23,24. Coincident marker analysis demonstrated that nearly 30% of ACTA2+ cells in the fibrous cap were comprised of cells positive for markers of MMT (Figure 3b & Extended Data 3f) or EndoMT (Figure 3c & Extended Data 3g), using LGALS3, a marker of pro-fibrotic M2 cells, and CD31 expression, respectively. Remarkably, in PdgfrbSMC-Δ/Δ animals, where SMC accumulation was greatly reduced, the percentage of ACTA2+ cells associated with markers for EndoMT or MMT in the fibrous cap was greater than 70% (Figure 3d).
Figure 3: EndoMT and MMT are markedly upregulated in lesions lacking SMC investment.
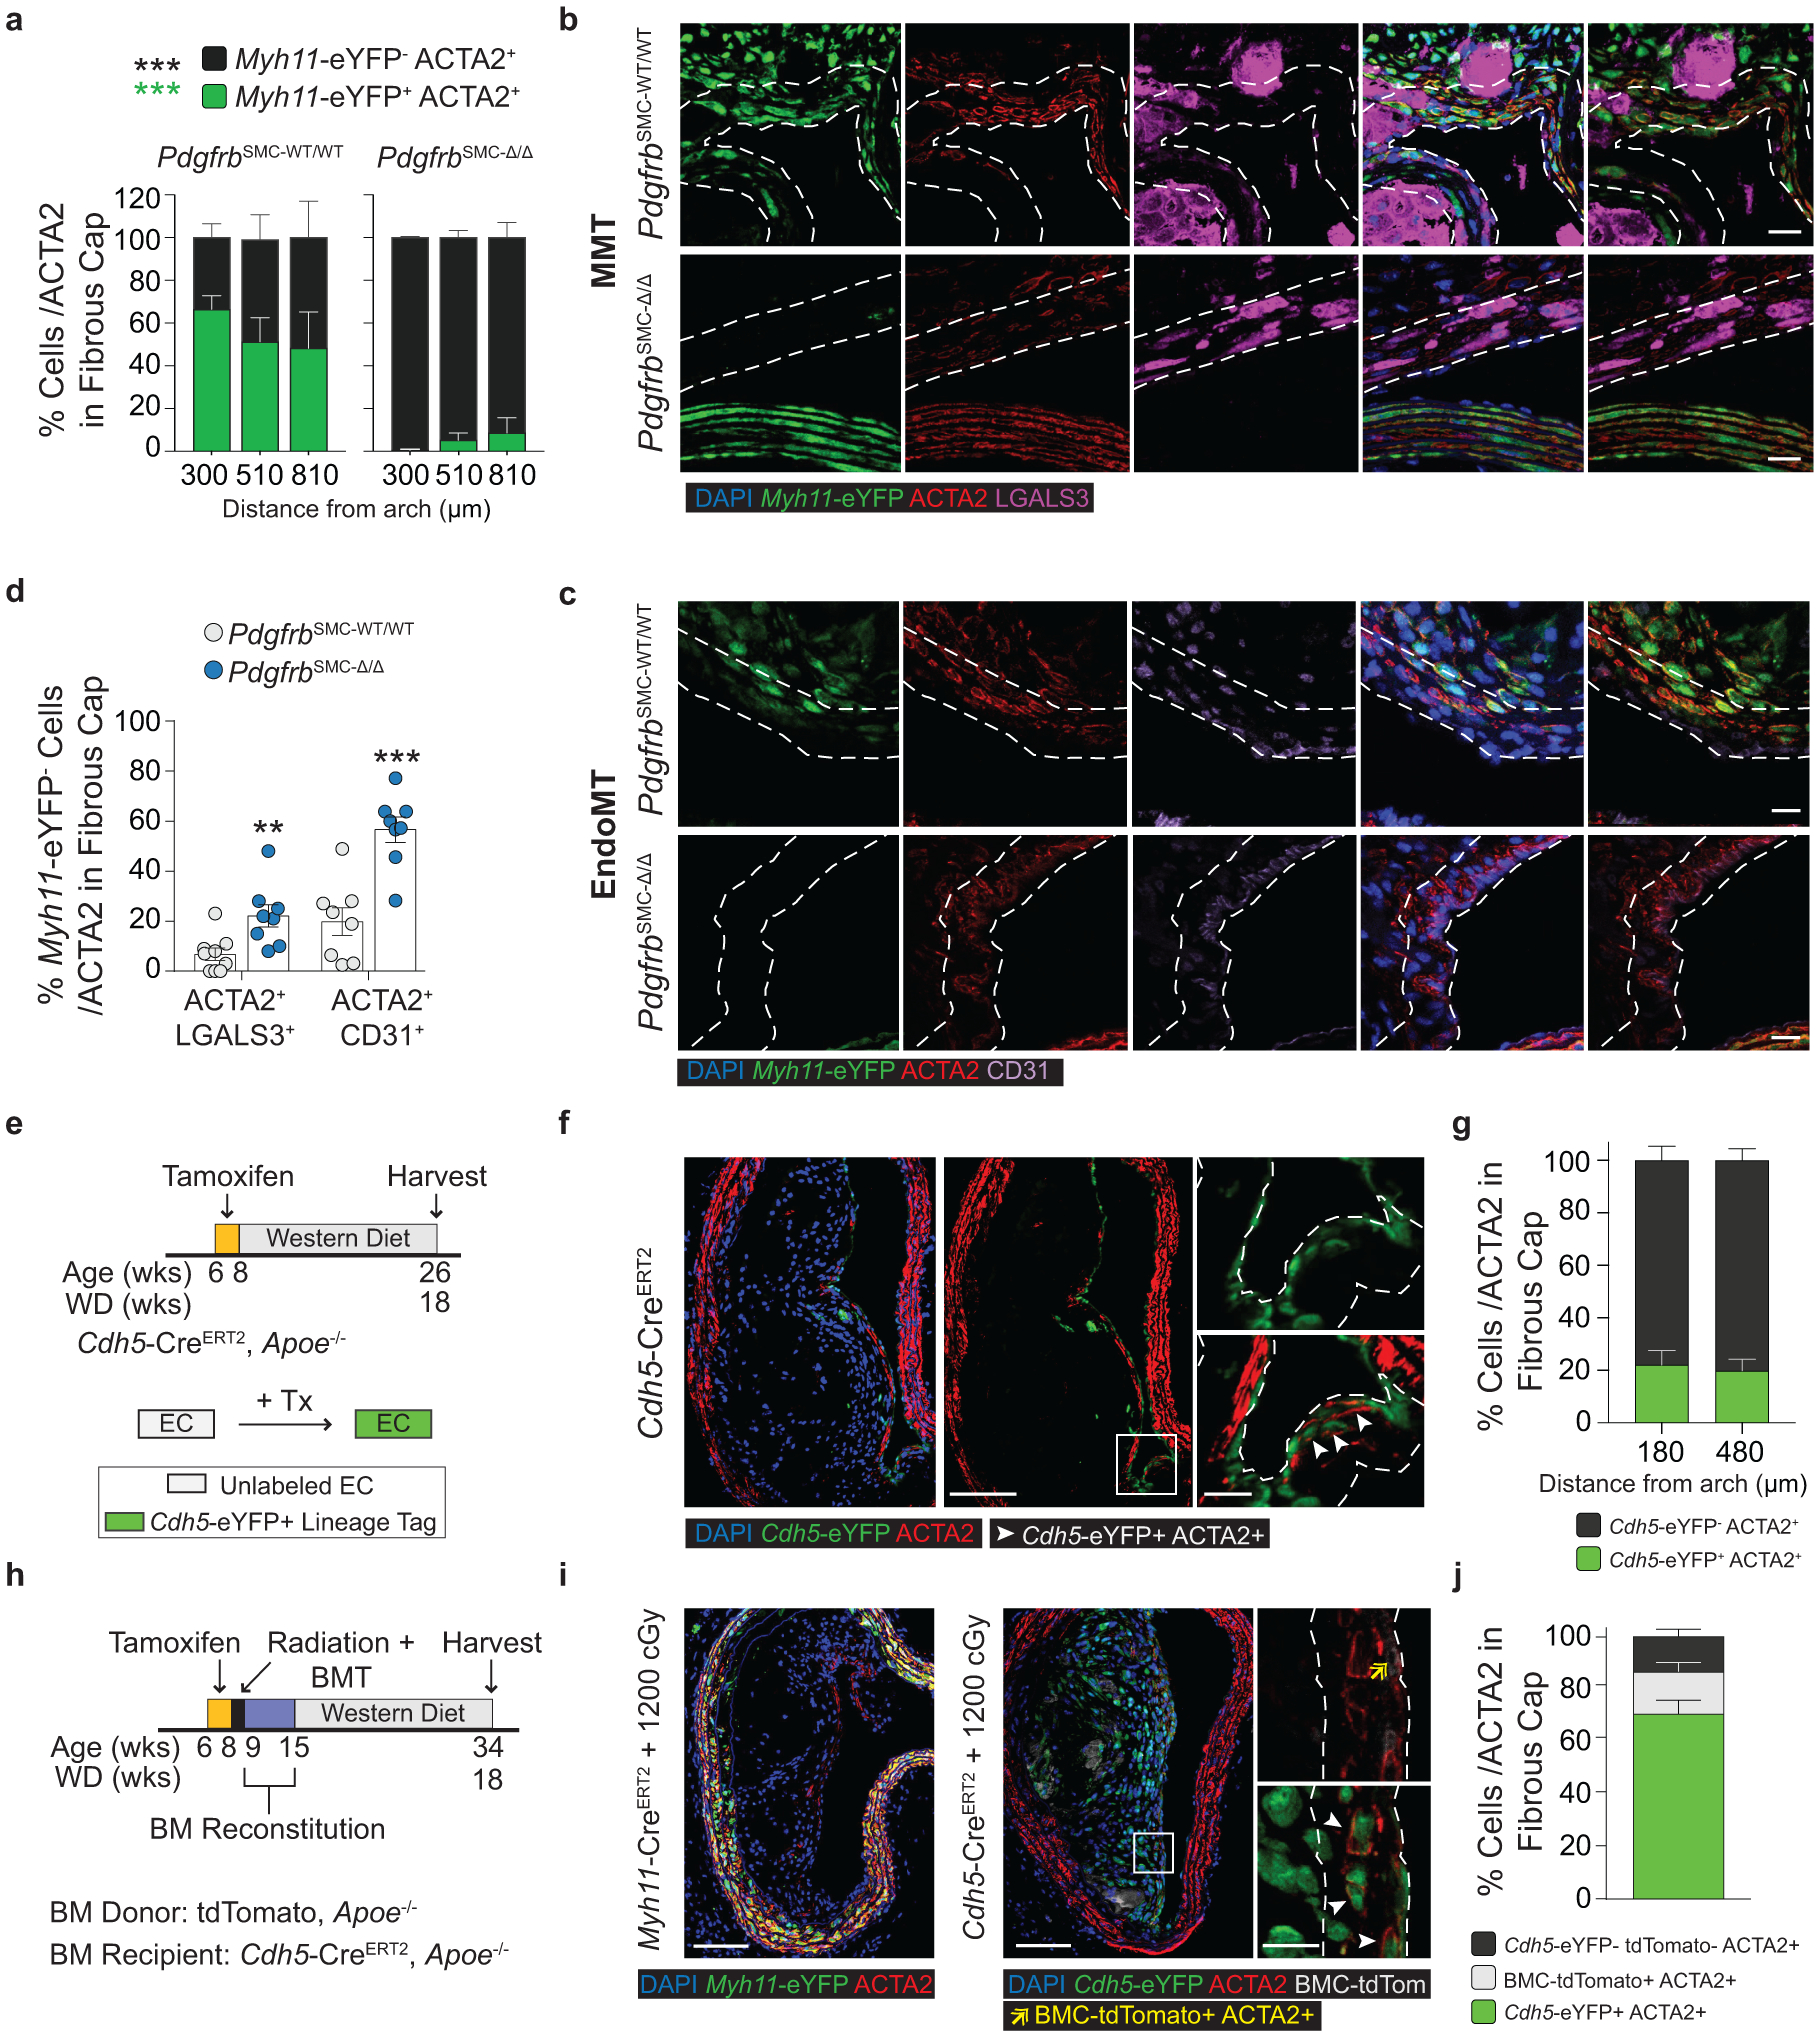
Loss of Pdgfrb signaling significantly increased the proportion of non-SMC derived ACTA2+ fibrous cap following 18 weeks of WD feeding. ***p-value < 0.0001.(A) SMC account for only about 60% of the ACTA2+ fibrous cap cells in PdgfrbSMC-WT/WT mice. Representative images of MMT (B) and EndoMT. (C). (D) Marker protein staining and single-cell counting indicates that up to 40% of ACTA2+ cells were derived from EndoMT, ***p-value = 0.0006, or MMT, **p-value = 0.0059, in PdgfrbSMC-WT/WT lesions, with these contributions increasing dramatically in PdgfrbSMC-Δ/Δ mice. (E) EC-lineage-tracing mice (Cdh5-eYFP) were fed a WD for 18 weeks and analyzed for EC-derived cells within the fibrous cap. (F) Representative image of a lesion from the Cdh5-eYFP mice. (G) Quantification shows about 20% of ACTA2+ cells within the fibrous cap were derived from EC. (H) Cdh5-eYFP mice underwent lethal irradiation and BMT with tdTomato+ bone marrow prior to WD feeding to ablate SMC accumulation within BCA lesions. (I) Representative image showing loss of SMC within Myh11-eYFP lesions (left) and accumulation of EC within Cdh5-eYFP lesions (right) after lethal radiation. (J) Cdh5-eYFP+ cells account for nearly 70% of the ACTA2+ fibrous cap cells following radiation-induced loss of SMC accumulation. BM-tracing shows nearly 16% of ACTA2+ fibrous cap cells are tdTomato+ and thus of bone marrow origin. Scale bar: 100μm (B, C, F, I) or 20μm (F, I; zoom). Graphs were analyzed using two-tailed Mann-Whitney U test (D) or two-way ANOVA with Sidak correction and multiple comparisons (A) biologically independent animals are indicated as individual dots in (D) and n = 8, 9, 6 (WT: 300, 450, 750 μm) or n = 8, 8, 7 (KO) in (A), n= 12, 13 for each location (G), n= 12 (J), error bars represent mean ± SEM, p-values displayed refer to two-way ANOVA between genotype unless otherwise indicated.
To test that results were not unique to the Apoe−/− model of murine atherosclerosis, we used two additional atherosclerotic mouse models to quantify the origins of ACTA2+ cells within the fibrous cap. Myh11-CreERT2 ROSA26-STOPFL/FL-eYFP animals infected with gain of function mutant (m)PCSK9-AAV8 and Ldlr−/− Myh11-CreERT2 ROSA26-STOPFL/FL-eYFP mice demonstrated similar results to those in PdgfrbSMC-WT/WT mice (Extended Data Fig 5, see Methods). The higher-than-expected percentage of non-SMC contributing to the ACTA2+ fibrous cap in wild type lesions suggests an underappreciated lesion-stabilizing role for MMT and EndoMT at baseline and that compensatory myofibroblast transitions of these cells and investment into the fibrous cap are markedly increased if SMC investment is impaired.
Because of the well-documented ambiguity of relying on marker staining for lineage identification in the context of atherosclerosis and to rule out Myh11-eYFP− fibrous cap cells representing false negatives, we utilized a tamoxifen-inducible EC lineage-tracing model (Apoe−/− Cdh5-CreERT2 ROSA26-STOPFL/FL-eYFP mice, henceforth “Cdh5-eYFP”) to directly assess the contribution of EndoMT to the fibrous cap (Figure 3e, Extended Data 6, see Methods). We fed Cdh5-eYFP mice 18 weeks of WD. Consistent with our observations of coincident marker staining, we found that ~20% of the ACTA2+ cells in the fibrous cap of advanced BCA lesions were derived from lineage-traced EC (Figure 3f,g) indicating that EndoMT is a substantial source of ACTA2+ fibrous cap cells during atherosclerosis development. We next sought to determine if the extraordinary increase in the contribution of EndoMT to the fibrous cap occurred in other models characterized by reductions in lesion SMC. We performed lethal irradiation of Cdh5-eYFP mice, which we have previously shown completely abrogates SMC investment into BCA lesions13. Cdh5-eYFP mice were reconstituted with tdTomato+ Apoe−/− bone marrow cells, allowing for simultaneous EC (Cdh5-eYFP) and hematopoietic cell (tdTomato) lineage-tracing (Figure 3h). Consistent with our observations in PdgfrbSMC-Δ/Δ mice, we found that Cdh5-eYFP+ cells underwent a marked expansion, comprising the majority of overall lesion cells and approximately 70% of the ACTA2+ fibrous cap cells (Cdh5-eYFP+ ACTA2+ /ACTA2; Figure 3i,j & Extended Data 7). In addition, we found that about 16% of the ACTA2+ fibrous cap cells originated from bone marrow cells (tdTomato+ ACTA2+ /ACTA2; Figure 3i,j, Extended Data 7h). These results challenge the long-standing dogma that EndoMT within lesions is detrimental and that SMC are the near exclusive cell type responsible for the formation of the protective ACTA2+ fibrous cap.
Prolonged loss of SMC-PDGFRB leads to decreased indices of plaque stability
Given the chronic nature of atherosclerosis, which develops over decades in humans, we asked if indices of lesion stability were maintained with longer-term WD feeding after SMC-PDGFBR loss. We assessed lesion composition and indices of stability after 26 weeks of WD in PdgfrbSMC-WT/WT and PdgfrbSMC-Δ/Δ mice (Figure 4a & Supplement 2). Similar to the 18-week WD experiment, the lesions that developed in the PdgfrbSMC-Δ/Δ animals fed 26 weeks of WD had a 95% reduction in Myh11-eYFP+ investment within the lesion and fibrous cap (Figure 3b) without any change in morphometry (Supplement 2), compared to PdgfrbSMC-WT/WT animals. However, after 26 weeks of WD, PdgfrbSMC-Δ/Δ lesions had significantly reduced indices of stability, including reduced collagen content in the lesion and fibrous cap (Figure 4c,d) and increased intraplaque hemorrhage (Figure 4e,f). Interestingly, the proportion of ACTA2+ cells within the fibrous cap between PdgfrbSMC-WT/WT and PdgfrbSMC-Δ/Δ animals remained unchanged (Figure 4g). Similar to mice fed 18 weeks of WD, PdgfrbSMC-Δ/Δ animals fed 26 weeks of WD showed comparable increases in Myh11-eYFP− ACTA2+ cells that co-stained with CD31 (EndoMT) or LGALS3 (MMT) (Figure 4h). Taken together, these data suggest that in the absence of SMC investment, mesenchymal transitions of non-SMC-derived cells are capable of only temporarily maintaining indices of lesion stability.
Figure 4: After 26 weeks of WD feeding, PdgfrbSMC-Δ/Δ mouse lesions lack SMC investment and have reduced indices of lesion stability.
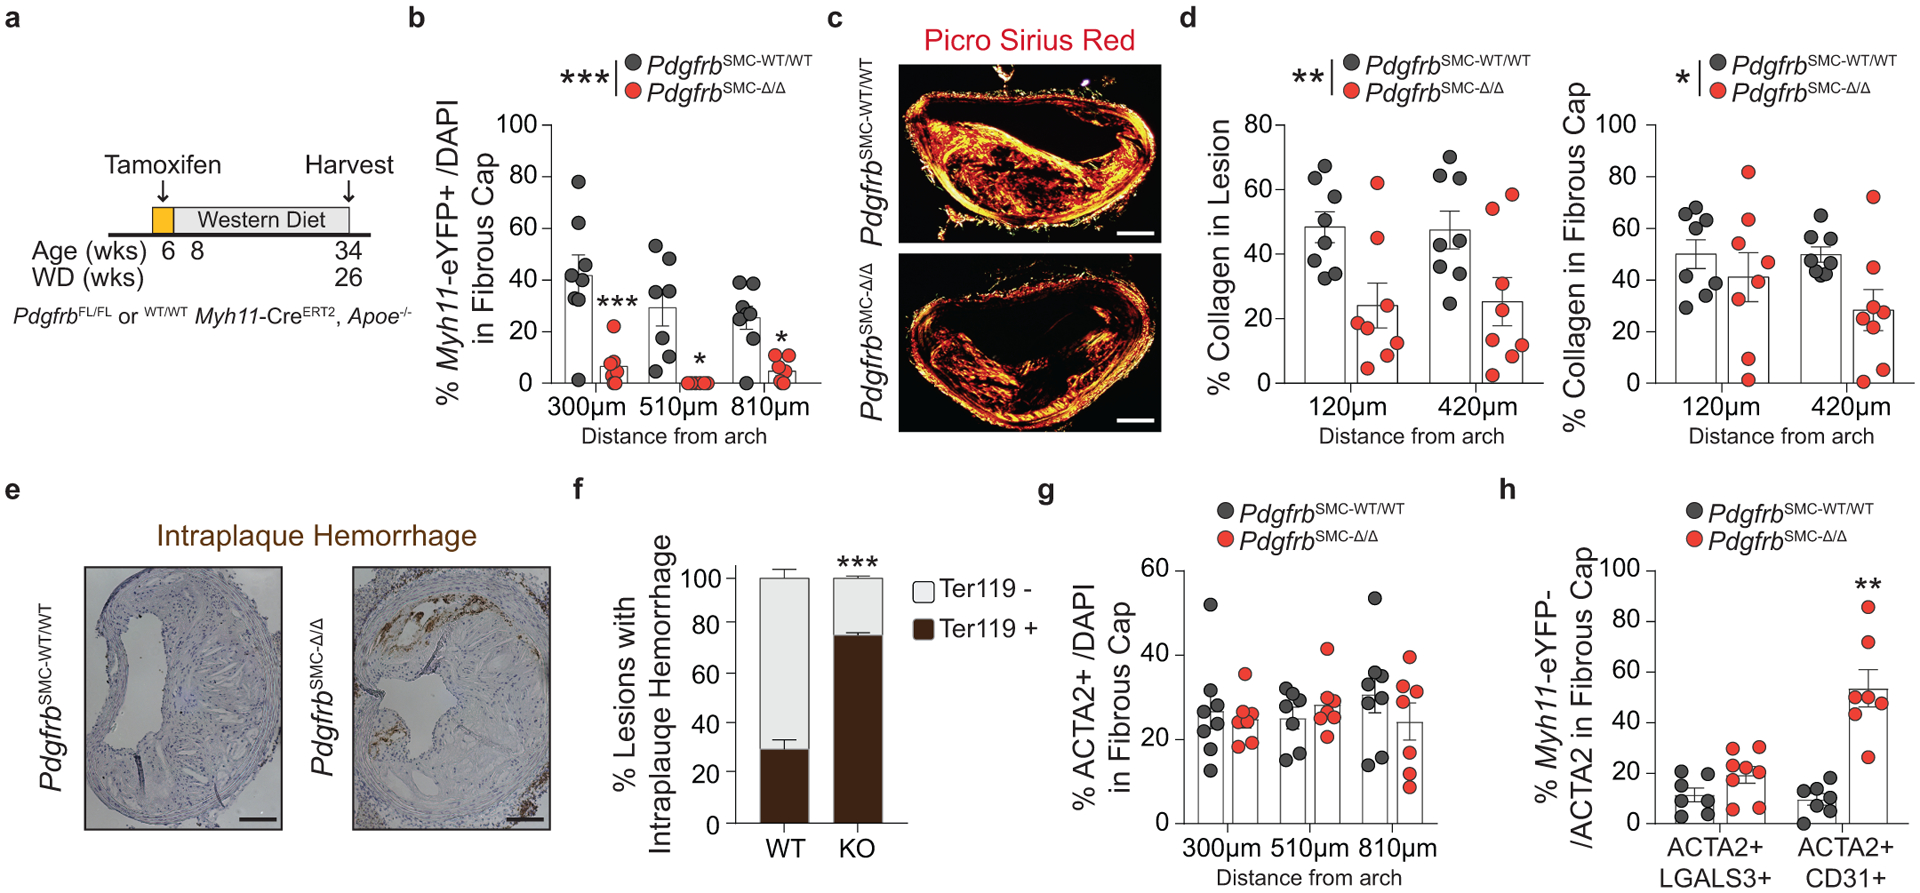
(A) After 26 weeks of WD, (B) PdgfrbSMC-WT/WT mice exhibited robust SMC accumulation within the fibrous cap, which was reduced by more than 90% in PdgfrbSMC-Δ/Δ mice. ***p-value < 0.0001. (C) Representative PSR images and (D) quantification of collagen in the lesion, **p-value = 0.001, and fibrous cap, *p-value < 0.0368, demonstrated significantly reduced collagen content. (E) Representative Ter119 staining and (F) quantification of intraplaque hemorrhage in the lesion showed significantly increased Ter119 staining over three locations. ***p-value of interaction < 0.0001. (G) Despite loss of SMC, there were no changes in the percentage of total ACTA2+ cells within the fibrous cap at 26 weeks of WD, likely due to compensatory increases in EndoMT, **p-value = 0.0006, and MMT, p-value = 0.0876, as assessed by marker protein staining (H). X-axis values represent distance past the aortic arch. Scale bar: 100μm. Graphs were analyzed using two-tailed Mann-Whitney U test (H) or two-way ANOVA with Sidak correction and multiple comparisons (B, D, F, G), biologically independent animals are indicated as individual dots in (B, D, G, H), intraplaque hemorrhage was analyzed as either positive or negative staining and n = 6, 8, 8 (WT: 270, 570, 870 μm) or n = 9 (KO) in (G), error bars represent mean ± SEM, p-values displayed refer to two-way ANOVA between genotype unless otherwise indicated.
ACTA2 cells in human lesions are derived from both SMC and non-SMC sources
To quantify SMC and non-SMC-derived ACTA2+ cells within the fibrous cap of stable human coronary lesions, we used a unique in situ hybridization-proximity ligation assay (ISH-PLA) to determine the fraction of ACTA2+ Myh11-promoter-H3K4diMe+ (SMC-derived, henceforth: “PLA+”) and ACTA2+ Myh11-promoter-H3K4diMe− (non-SMC-derived: “PLA−”) cells within the fibrous cap. This method, which is currently the only means to reliably identify cells of SMC origin in human lesions, was previously developed by our lab to detect SMC-specific epigenetic signatures within single cells25–27. Importantly, we previously showed that Myh11-promoter-H3K4diMe+ is a SMC-specific epigenetic signature that persists in SMC in atherosclerotic vessels, even if SMC have undergone phenotypic transitions characterized by loss of expression of their characteristic SMC markers, including ACTA25,10,12,25. Due to the possibility of false negatives (i.e. a SMC-derived cell that is PLA−) inherent with this ISH-PLA method, all results were corrected based on detection frequency of PLA in the SMC-rich media, corresponding to each individual histological lesion section (see Methods). Corrected results showed that only 78.6±21.7% of ACTA2+ cells throughout advanced human coronary artery lesions were derived from SMC. Moreover, of major significance, we found that 24.2±6.0% of fibrous cap ACTA2+ cells were PLA− and thus likely of non-SMC origin (Extended Data Fig 8a,c,d, see Methods). These data are consistent with previous reports that ACTA2+ cells can be derived from a myeloid origin in human atherosclerotic lesions8 but are the first to define that non-SMC substantially contribute to the ACTA2+ fibrous cap population in human lesions. Further, assessment of EndoMT in the fibrous cap showed that about 10.4±3.7% of the ACTA2+ cells are also CD31+ (Extended Data Fig 8b,e,f). Taken together, these data suggest that similar to our observations in mice, the ACTA2+ fibrous cap of human atherosclerotic lesions is derived from multiple cellular origins.
Loss of SMC-PDGFRB signaling reduced stability in mice with established atherosclerosis
Thus far, our data has shown that the investment of SMC into the fibrous cap is dependent on PDGFRB signaling and that prolonged loss of SMC investment into the fibrous cap results in decreased indices of lesion stability. However, whether PDGFRB signaling is critical for maintaining SMC content after the development of advanced lesions, or if pharmacologic inhibition would adversely affect indices of lesion stability is unclear. This is important because any therapeutic intervention in patients would likely occur decades after initial lesion development. Previous animal studies antagonized PDGFRB signaling in advanced lesions, presumably to reduce lesion size, and found an overall reduction in ACTA2+ cells15. However, these studies lacked lineage-tracing and thus were unable to provide mechanistic insights for their observed effects, specifically how interventions impacted the contributions of SMC and non-SMC to the ACTA2+ population of advanced lesions. To test this, we administered tamoxifen to PdgfrbSMC-FL/FL and PdgfrbSMC-WT/WT mice from 16 to 18 weeks of WD, such that the mice would already have developed advanced lesions prior to the loss of PDGFBR signaling (Figure 5a). This allowed for simultaneous lineage-tracing and deletion of PDGFRB in cells expressing Myh11 (henceforth: delayed-PdgfrbSMC-WT/WT or −Δ/Δ mice, Figure 5b).
Figure 5: Persistent PDGFRB signaling in Myh11+ cells within advanced lesions is required for maintenance of ACTA2+ cell number and collagen content within the fibrous cap.
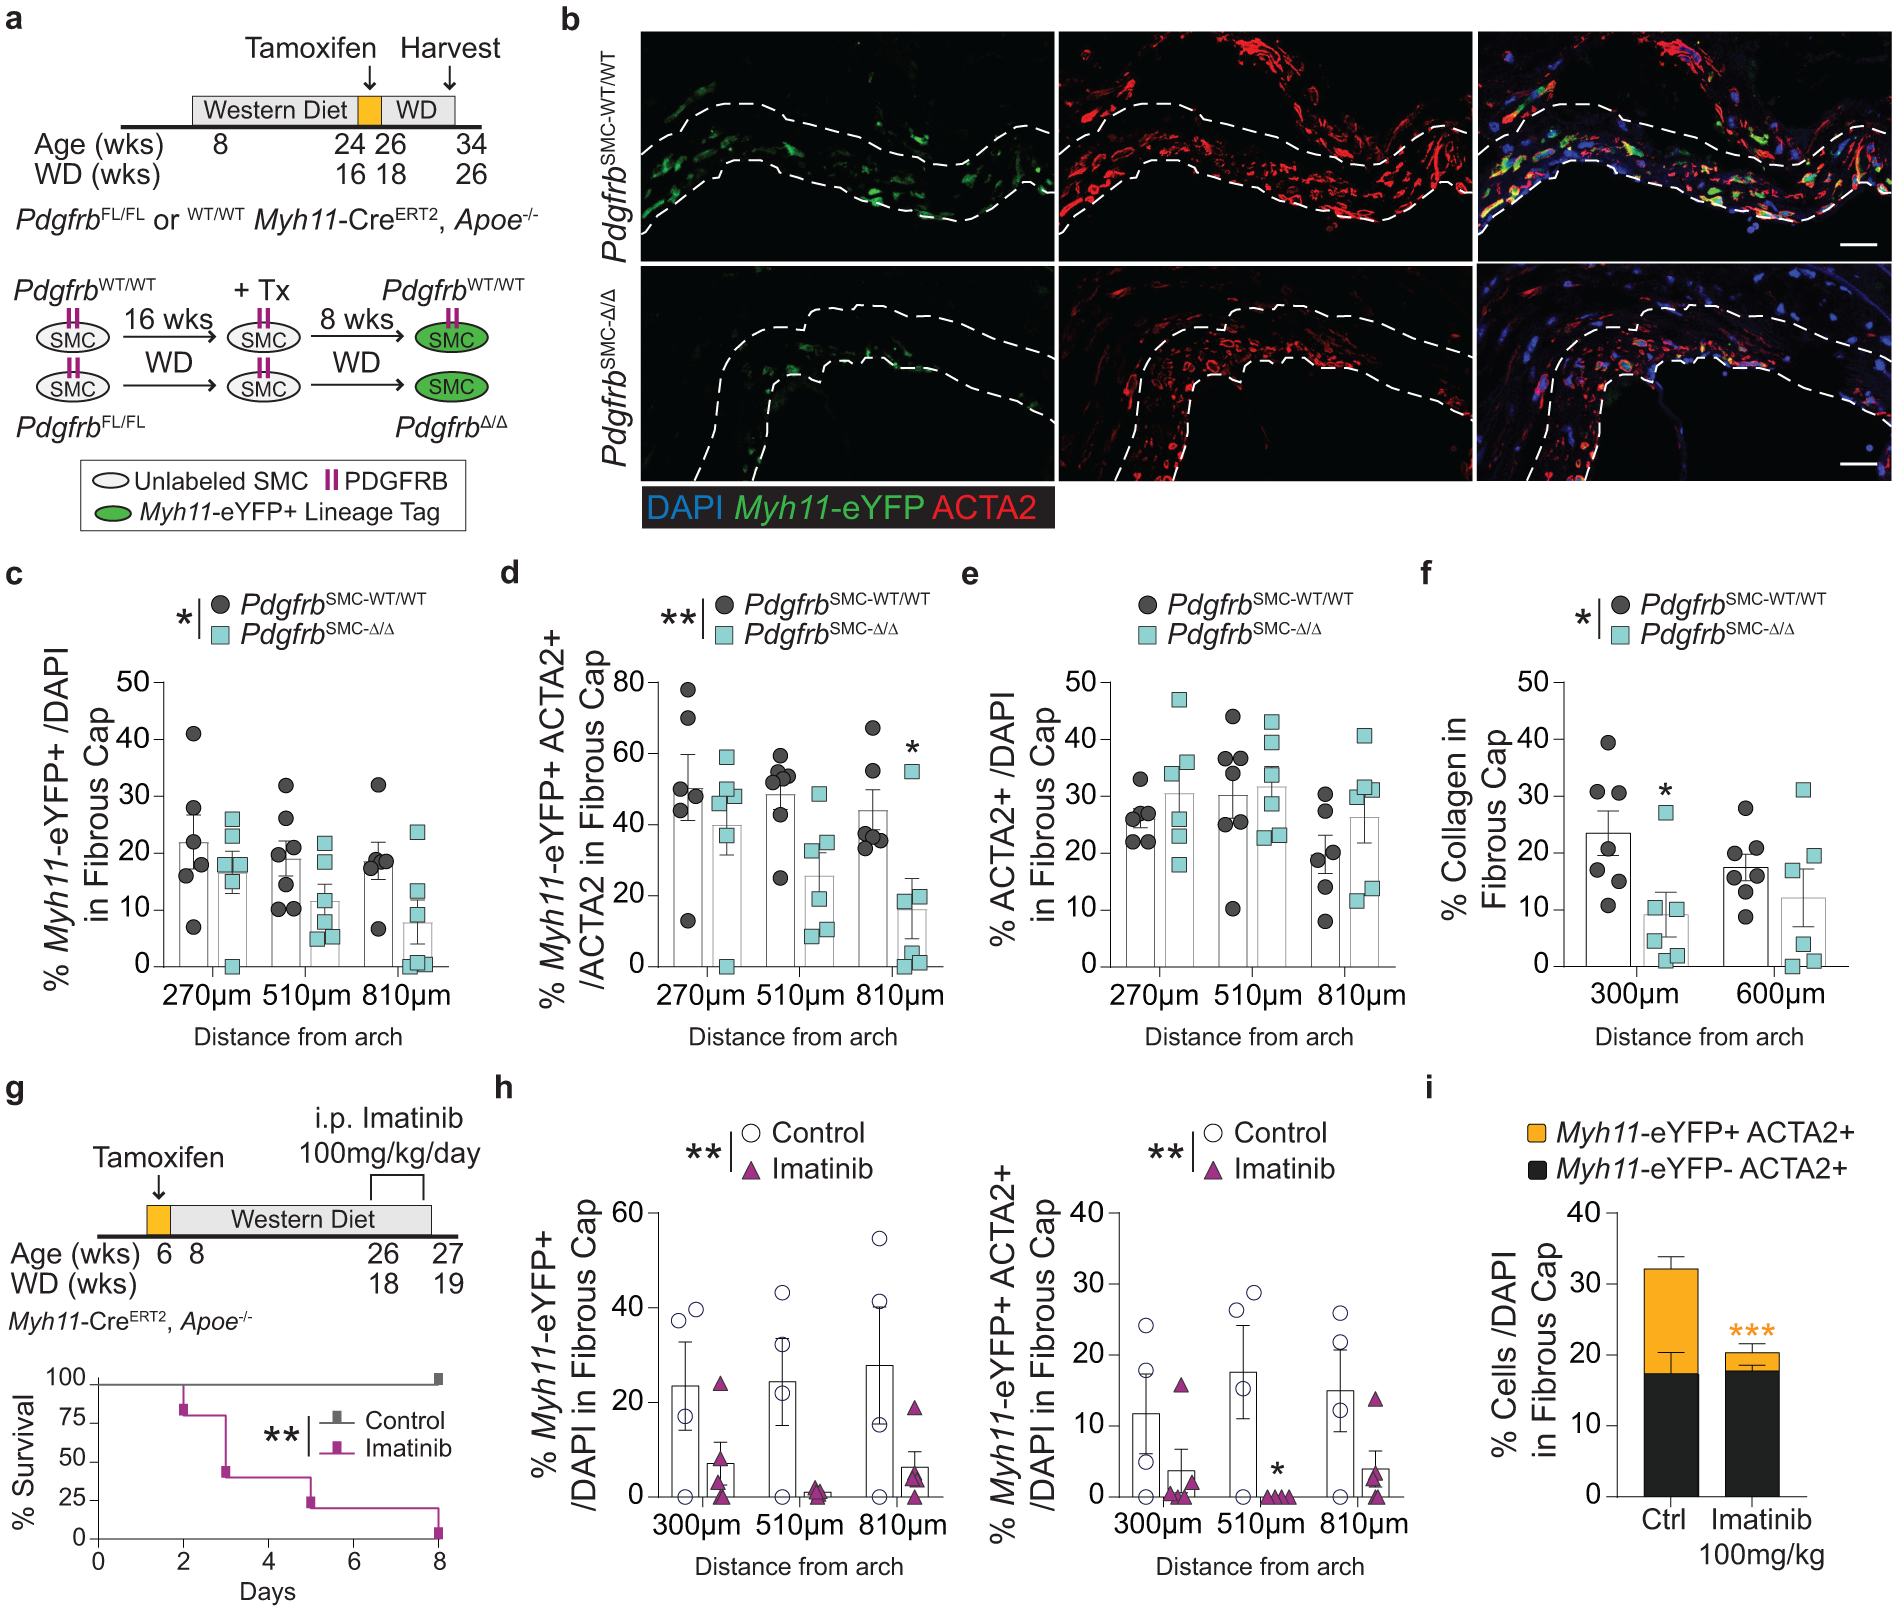
(A)Schematic of tamoxifen administration in mice with advanced lesions, which results in delayed-Pdgfrb deletion and Myh11-eYFP labelling in the subset of cells expressing Myh11-CreERT2 (located mainly within the media and fibrous cap). Lesions were harvested eight weeks after the final tamoxifen injection. (B) Representative images of the fibrous cap of PdgfrbSMC-WT/WT and PdgfrbSMC-Δ/Δ mice, outlined with dashed lines. Single cell counting of the fibrous cap shows KO of Pdgfrb in Myh11-CreERT2 -expressing cells resulted in (C) a reduction in total Myh11-eYFP+ cells, *p-value = 0.0126, and (D) decreased Myh11-eYFP+ ACTA2+ cells per total ACTA2+ cells in the fibrous cap, **p-value = 0.0016, despite (E) no change in the percentage of total ACTA2+ cells. (F) PdgfrbSMC-Δ/Δ resulted in decreased collagen deposition within the fibrous cap. *p-value = 0.0366. (G) To test global antagonism of PDGFRB, Myh11-eYFP mice were put on WD for 18 weeks prior to receiving daily injections of Imatinib or saline. (H) 100mg/kg/day of Imatinib resulted in 100% morbidity within 8 days as well as significant reductions in Myh11-eYFP+ cells, **p-value = 0.0017 (left) and SMC-derived ACTA2+ cells, **p-value = 0.0025 (right), in the fibrous cap. This resulted in a significant decrease in the overall number of ACTA2+ cells ***p-value of treatment = 0.009 (I) within the fibrous cap. X-axis values represent distance past the aortic arch. Scale bar: 20μm. Graphs were analyzed using two-way ANOVA with Sidak correction and multiple comparisons (C-F, H, I), or Kaplan-Meier curve with Log-rank test (G), n = 4 (WT) and n = 5 (KO) for each location in (I), error bars represent mean ± SEM, p-values displayed refer to two-way ANOVA between genotype unless otherwise indicated.
After an additional eight weeks of WD feeding (totaling 26 weeks of WD), we found a 30% reduction in the percent of Myh11-eYFP+ cells within the fibrous cap of delayed-PdgfrbSMC-Δ/Δ animals (Figure 5c), as well as a 50% reduction in Myh11-eYFP+ cells expressing ACTA2 (Figure 5d). This was associated with a significant decrease in collagen content in the fibrous cap (Figure 5f), despite no changes in the total number of ACTA2+ cells (Figure 5e). These results indicate that persistent PDGFRB signaling is required to maintain the SMC-derived ACTA2+ population within the fibrous cap of established lesions and that collagen content relies on their sustained presence. Notably these results are likely to underestimate the contribution of SMC-PDGFRB signaling in late-stage lesions since only about 20% of SMC-derived lesion cells, predominately fibrous cap cells, express Myh11 at this stage of the disease and would undergo CreERT2-induced recombination5.
To better mimic a clinical intervention, we tested how therapeutic disruption of PDGFRB signaling would affect the cellular composition of the fibrous cap. Myh11-eYFP mice fed 18 weeks of WD were administered 100mg/kg/day Imatinib Mesylate via intraperitoneal injections (Figure 5g, see Methods), which inhibits the tyrosine kinases PDGFRB, BCR-ABL, and c-KIT28. Imatinib is generally well-tolerated and has resulted in an incredible reduction in the mortality of certain cancer patients, albeit with an increased long term risk of CVD29. In our WD fed atherosclerotic mice, Imatinib administration resulted in 100% morbidity (limb paralysis, significant weight loss, sudden death) compared to saline treated control mice, which showed no morbidity or mortality (Figure 5g). Following Imatinib administration, BCA lesions showed large reductions in the percentage of Myh11-eYFP+ and Myh11-eYFP+ ACTA2+ cells in the fibrous cap (Figure 5h). Although, the overall reduction in ACTA2+ cells was entirely due to a reduction in Myh11-eYFP+ cells (Figure 5i); there was no change in the percent of non-SMC-derived ACTA2+ cells, suggesting that non-SMC-derived cells were unable to compensate for the rapid loss of SMC-derived ACTA2+ cells. There were no associated changes in collagen content, but a near -significant increase in intraplaque hemorrhage (p = 0.064, Supplement 3), indicating that even a short period of Imatinib treatment resulted in a marked loss of both SMC-derived cells and overall ACTA2+ cells within the fibrous cap and with increased mortality. Taken together, both the delayed-PdgfrbSMC-Δ/Δ and Imatinib-treated mice show that disrupting PDGFRB signaling in pre-existing atherosclerotic lesions has major detrimental effects, including decreasing SMC-derived ACTA2+ cells in the fibrous cap and collagen content in the delayed-PdgfrbSMC-Δ/Δ mice.
SMC require aerobic glycolysis to dedifferentiate and drive ECM transcription
To elucidate how SMC maintain an ECM-rich fibrous cap, we revisited our bulk and scRNA-seq datasets (Figure 1i, 2, Extended Data 4) that identified multiple bioenergetic pathways, specifically Pyruvate Metabolism and Oxidative Phosphorylation, as markedly upregulated in the BCA of atherosclerotic PdgfrbSMC-Δ/Δ mice. We hypothesized that the cellular adaptations required to maintain atherosclerotic plaque stability following SMC-specific deletion of Pdgfrb would require major shifts in energy consumption and that the transition of fibrous cap cells to a MF-like, ECM-synthesizing state would be associated with extensive metabolic reprogramming.
To test this hypothesis, we isolated SMC from the thoracic aorta of Myh11-eYFP lineage-tracing mice (Supplement 4, see Methods) and stimulated them with recombinant PDGF and TGFβ1 to induce SMC to MF transitions (SMC-MFT; Figure 6a–c)30. Interestingly, SMC-MFT was associated with a 6-fold increase in glycolytic capacity and 3-fold increase in respiratory capacity (Figure 6d). We used inhibitors of lactate dehydrogenase (LDH; Galloflavin) and the pyruvate dehydrogenase complex (PDHC; CPI613) to test whether this bioenergetic shift was required for expression of collagen and other ECM-related genes by SMC (Figure 6a)31–35. In addition to the previously published studies confirming the specificity of these inhibitors for their targets, we utilized four different experimental approaches to demonstrate that these compounds inhibit the intended target pathways in cultured SMC (Extended Data Fig 9,10 and Supplement 5–9,10). We found that blocking aerobic glycolysis with Galloflavin significantly reduced expression of multiple ECM genes (Figure 6e). Additionally, boosting aerobic glycolysis by blocking the glucose-driven Krebs cycle and oxidative phosphorylation with CPI613 (6,8-bis(benzylthio)-octanoic acid; Supplement 5) further increased PDGF-driven mRNA expression. This included key ECM-reorganizing genes, such as Col15a1 and Mmp3 (Extended Data Fig 9), and PDGF and TGFβ-driven synthesis of Spp1 (Figure 6e), which encodes the ECM protein osteopontin, shown to inhibit vascular calcification36,37. Of major interest, inducing SMC-MFT with TGFβ and PDGF in the presence of Imatinib abrogated the PDGF-driven contribution to glycolytic capacity and Col15a1 expression (Supplement 6). Together, these data provide evidence that SMC require metabolic reprogramming to aerobic glycolysis in order to carry out their essential lesion-stabilizing functions, namely ECM synthesis and remodeling. Furthermore, these in vitro data suggest that disrupting the PDGF-PDGFRB axis abrogates protective lesion-stabilizing SMC transitions and ECM synthesis in vivo.
Figure 6: Aerobic glycolysis is necessary for the PDGF/TGFB-driven transition of cultured SMC to an ECM producing myofibroblast-like state.
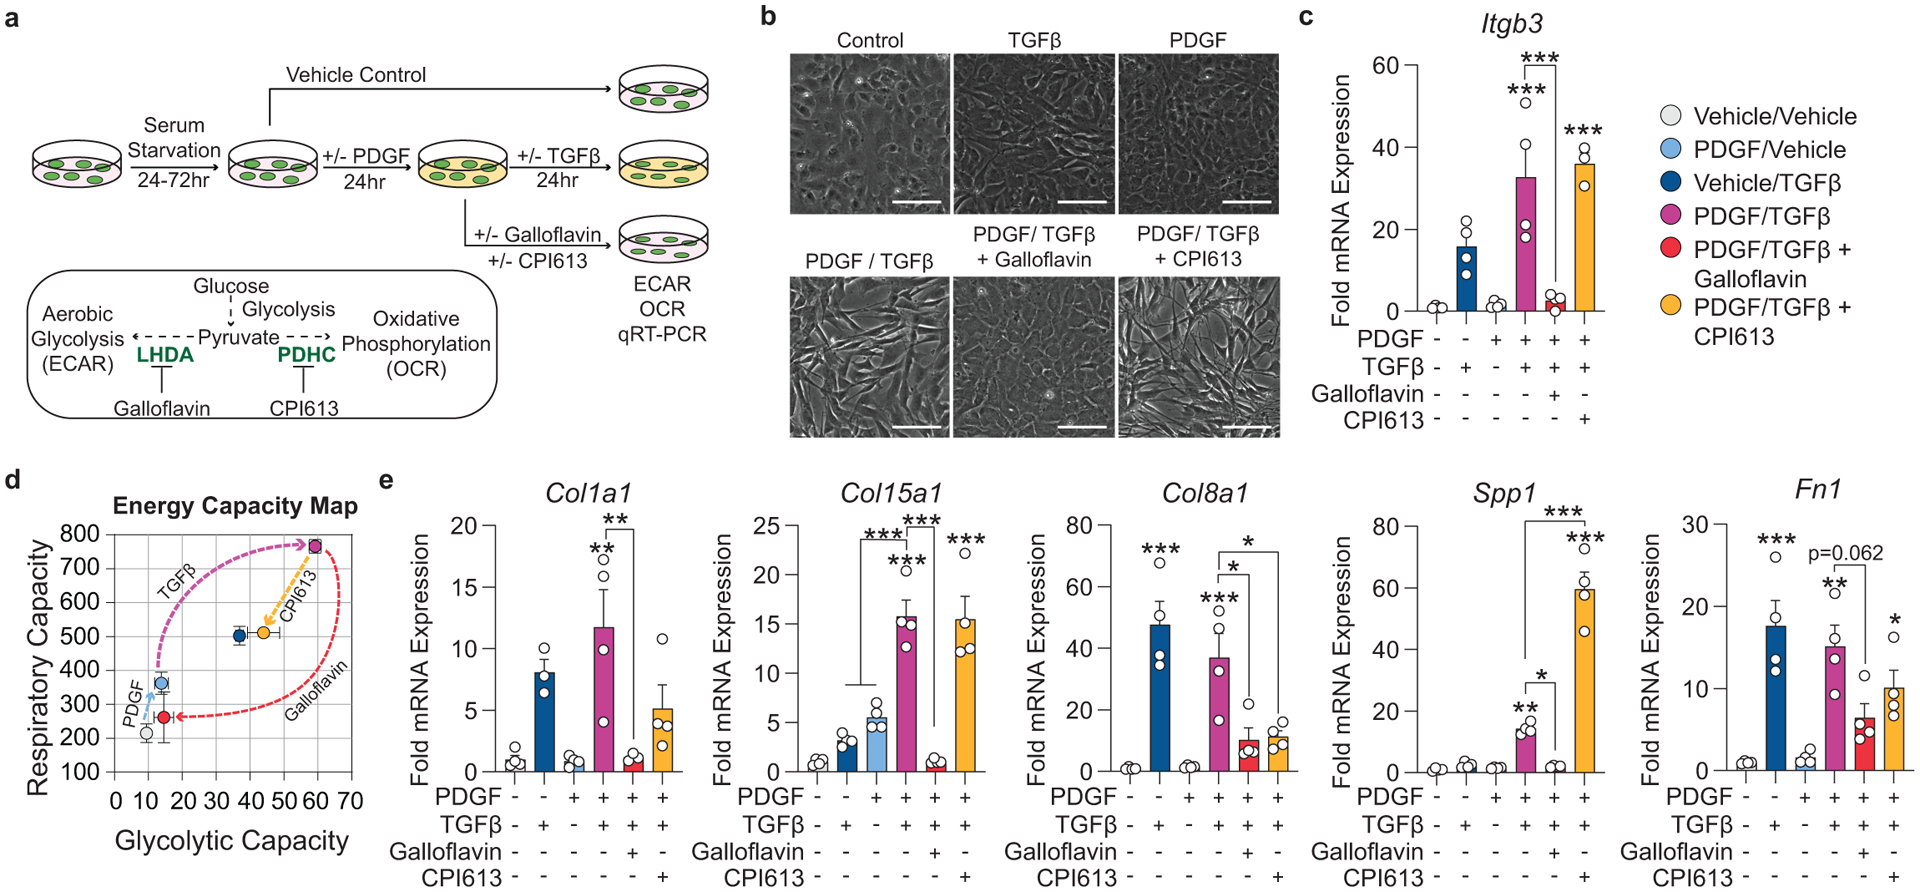
(A) Schematic showing the experimental design. Briefly, isolated flow-sorted murine aortic SMC were plated, serum starved, and treated with recombinant PDGF-DD for 24hr followed by recombinant TGFβ1 with or without LDH-inhibitor Galloflavin or PDHC-inhibitor CPI613 for 24 hours. (B) Representative phase contrast images and (C) gene expression showing PDGF and TGFβ induced Itgb3, representative of a myofibroblast-like state. [Itgb3 p = 0.0001, p = 0.0002, and p = 0.0001]. Blocking LDH or PDHC resulted in a change in myofibroblast gene expression. (D) Energy capacity map representing the bioenergetic potential of SMC using glycolytic capacity (x-axis, maximal ECAR) and respiratory capacity (y-axis, maximal OCR). (E) mRNA expression of ECM-associated genes. [Col1a1 p = 0.0024 and p = 0.0056; Col15a1 p = 0.0001, p < 0.0001, p < 0.0001, and p < 0.0001; Col8a1 p < 0.0001, p = 0.0006, p = 0.0106, and p = 0.0147; Spp1 p = 0.0082, p = 0.0158, p < 0.0001, and p < 0.0001; Fn1 p = 0.0002, p = 0.0012, p = 0.0622, and p = 0.0481]. Scale bar: 100μm. Graphs were analyzed using one-way ANOVA with Tukey’s correction for post-hoc analysis, error bars represent mean ± SEM, p-values displayed refer to two-way ANOVA between genotype unless otherwise indicated.
EndoMT relies on IL1 signaling both in vitro and during atherogenesis
Given that changes in energy consumption underlie matrix-synthesizing capabilities of MF-like SMC, we hypothesized that ECM expression in EC undergoing EndoMT would also require shifts in energy consumption. To test this hypothesis, we attempted to induce EndoMT in cultured human umbilical vein endothelial cells (HUVECs) with PDGF, TGFβ, and IL1β. Multiple studies have demonstrated a critical role for IL1 signaling on EC function, including leukocyte adhesion, hemostasis38, and inducing EndoMT in vitro6,39. Of interest, we previously showed that global suppression of IL1β in mice with advanced atherosclerosis resulted in a dramatic loss of ACTA2+ cells within the fibrous cap and loss of collagen content10. We found that in confluent HUVECs, IL1β treatment alone – but not TGFβ or PDGF – increased ACTA2 mRNA synthesis and that the combined treatment of IL1β and TGFβ induced a state consistent with EndoMT (Figure 7a–c). This included a significant increase in COL1A1 production and an associated drop in respiratory capacity with no changes in glycolytic capacity (Figure 7c,d). These data suggest that IL1β is a major regulator of not only EC-derived collagen production but also of their transition to an ACTA2+ state, that EndoMT results in a metabolic profile distinct from MF-like SMC in culture, and that mesenchymal transitions of HUVECs occur through distinct metabolic reprogramming compared to SMC.
Figure 7: EC expression of ACTA2 and ECM components is interleukin-1 dependent.
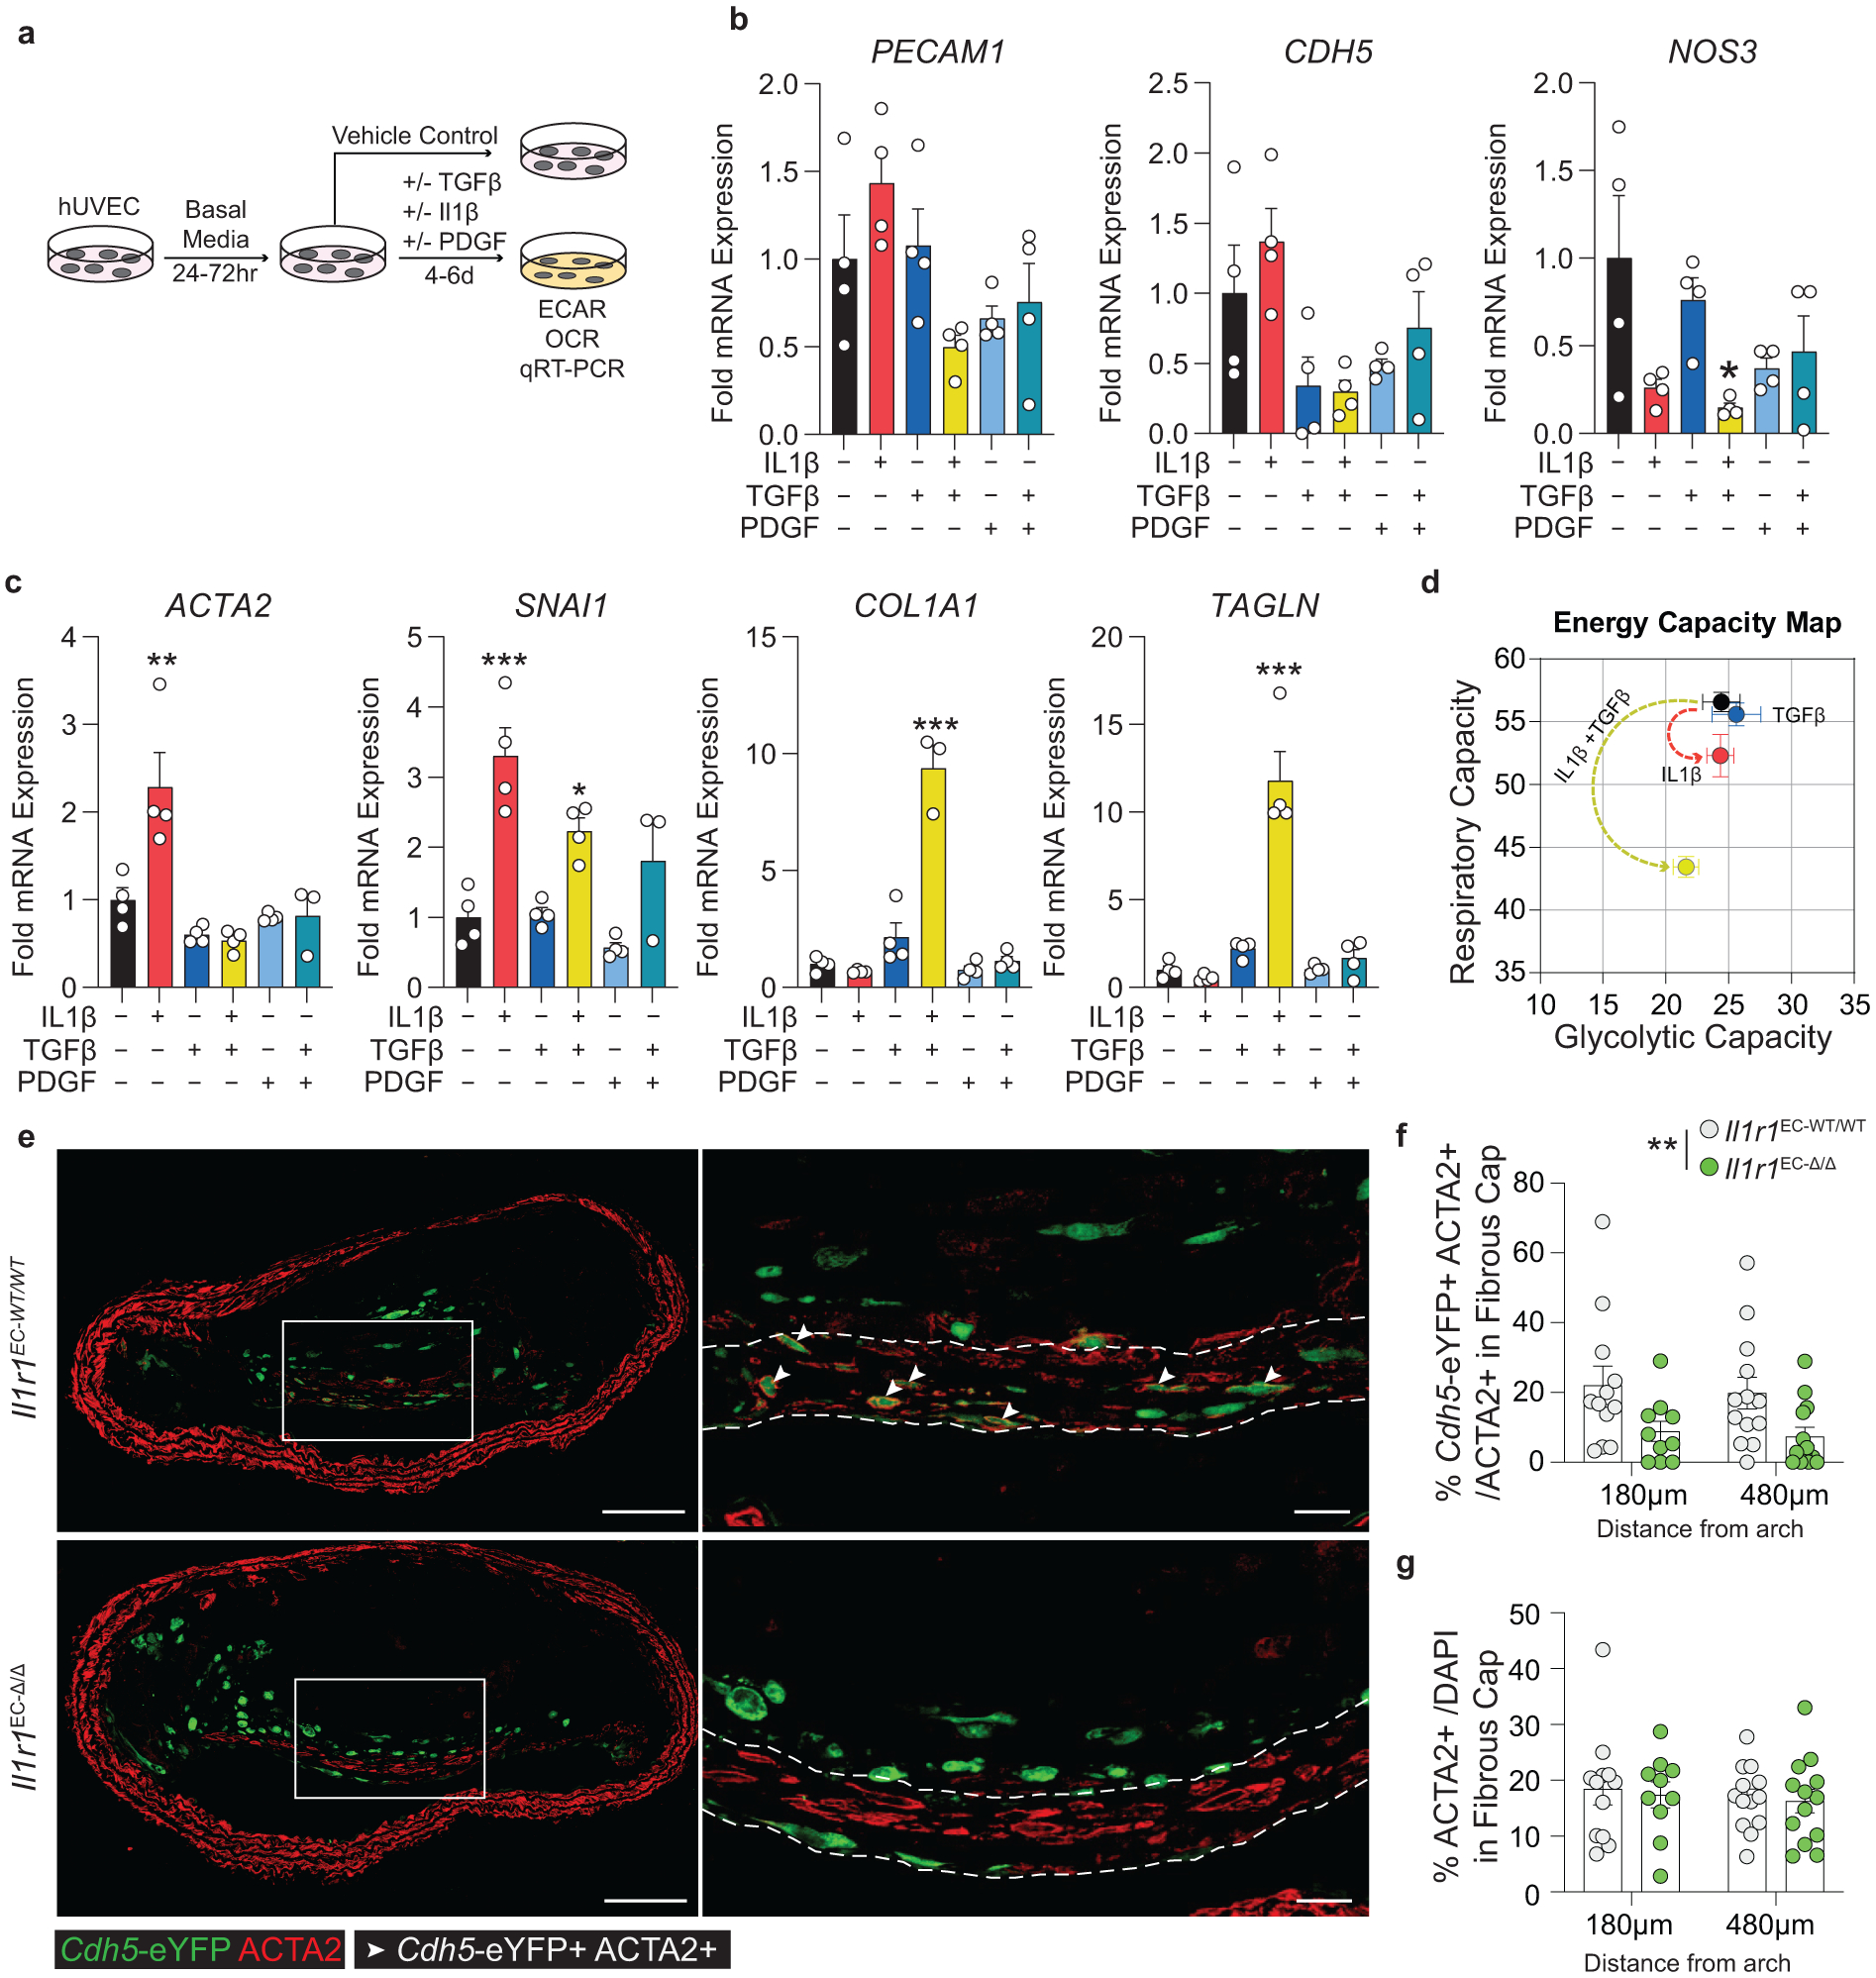
(A) Schematic showing experimental design. Briefly, human umbilical vein endothelial cells (HUVEC) were plated at confluence and incubated in basal media for 24–72 hours. Cells were treated with Vehicle, IL1β (10ng/mL), TGFβ2 (10ng/mL), and PDGF-DD (10ng/mL) for 4–6 days. (B) mRNA expression of endothelial marker genes including PECAM, CDH5, and NOS3, measured by qPCR. [NOS3 p = 0.0311]. (C) mRNA expression of EndoMT genes including ACTA2, SNAI1, TAGLN, and COL1A1. [ACTA2 p = 0.0022; SNAI1 p = 0.0002 and p = 0.0472; COL1A1 p < 0.0001; TAGLN p < 0.0001]. (D) Energy capacity map representing the bioenergetic potential of EC using glycolytic capacity (x-axis, maximal ECAR) and respiratory capacity (y-axis, maximal OCR). (E) Representative images of BCA lesions from Il1r1EC-WT/WT and Il1r1EC-Δ/Δ mice fed 18 weeks of WD that were harvested and analyzed for EC content. EC-specific deletion of IL1R1 significantly reduced the contribution of EC to the ACTA2+ fibrous cap population, **p-value = 0.0034, (F), but had no effect on the overall percent of ACTA2+ cells within the fibrous cap (G). Arrows indicate Cdh5-eYFP+ ACTA2+ cells. Scale bar: 100μm (whole lesion) or 20μm (zoom). Graphs were analyzed using two-way ANOVA with with Sidak correction and multiple comparisons (F-G) or one-way ANOVA with Tukey’s correction for post-hoc analysis (B, C), error bars represent mean ± SEM, p-values displayed refer to two-way ANOVA between genotype unless otherwise indicated.
Given the critical role of IL1 signaling in the expression of ACTA2 in cultured EC, we sought to test if EC-IL1 signaling is necessary for EndoMT during atherosclerosis. We generated tamoxifen-inducible EC-specific IL1R1 knockout mice with simultaneous EC lineage-tracing by crossing Il1r1FL/FL mice with Cdh5-eYFP mice (henceforth: Il1r1EC-WT/WT and Il1r1EC-Δ/Δ after tamoxifen; Extended Data 6). After 18 weeks of WD, we observed EC-derived cells in the lumen monolayer, the 30μm fibrous cap (excluding the monolayer), and within the lesion core6,7 (Figure 7e). We analyzed EC within the BCA to understand the effect of EC-specific loss of IL1-signaling on EC phenotype and found that Il1r1EC-Δ/Δ mice exhibited a greater than 50% reduction in Cdh5-eYFP+ ACTA2+ cells within the fibrous cap compared to Il1r1EC-WT/WT mice (Figure 7f). Interestingly, despite this reduction in EC-derived ACTA2+ cells, there was no change in the overall number of ACTA2+ cells or the collagen content within the fibrous cap (Figure 7g, Supplement 11), suggesting that in the absence of EC-derived cells in the fibrous cap, other cell types (likely including SMC) maintain the protective ACTA2+ population. This further emphasizes the distinct mechanisms by which multiple cell populations maintain a continuous ACTA2+ fibrous cap layer, leading to a more resilient, dynamic structure even when the abundance of one of the cellular sources is reduced.
Discussion
The protective ACTA2+ cells within the fibrous cap of atherosclerotic lesions have been widely considered to be of smooth muscle origin, and studies over the last several decades have established the key role of these ACTA2+ cells in preventing catastrophic plaque rupture and its resultant cardiovascular complications1–3. This study provides critical insights into the cellular origins and mechanisms regulating the maintenance of the fibrous cap. First, we unexpectedly discovered that in BCA lesions of mice, only about 60% of the ACTA2+ cells within the fibrous cap are of smooth muscle origin – much fewer than previously assumed40. Consistent with these data, we provide evidence that the fibrous cap of advanced human lesions also contains 20–25% of ACTA2+ cells from a non-SMC origin. Second, EC-derived cells comprise ~20% of ACTA2+ fibrous cap cells in murine lesions during normal lesion development. Third, continued PDGFRB signaling is essential for SMC investment into and retention within the lesion and fibrous cap, which is required to maintain indices of stability. Depleting SMC investment by either SMC-specific PDGFRB ablation or radiation exposure resulted in a dramatic increase in EndoMT and MMT, which was unexpectedly associated with transient maintenance of indices of lesion stability. This suggests that these processes play an underappreciated protective role in maintaining lesion stability and collagen deposition. Fourth, we describe divergent mechanisms whereby these different sources of ACTA2+ cells attain their protective phenotype. Specifically, the transition of SMC to a myofibroblast-like state appears to require a PDGFRB-dependent metabolic shift characterized by increased aerobic glycolysis, while the EC to myofibroblast transition requires IL1-signaling. Taken together, our studies refine our understanding of the fibrous cap and reveal potential strategies to therapeutically augment lesion stability.
PDGF signaling through PDGFRB is tightly conserved evolutionarily due to its essential role in cardiovascular development where it directs SMC migration to nascent endothelial tubes. In fact, global knockout of PDGFB or PDGFRB is embryonically lethal because of multiple defects in cardiovascular development, which are likely secondary to SMC hypoplasia41,42. This suggests immense evolutionary pressure favoring mechanisms that control the plasticity and ability of SMC and other vascular cells to respond to and repair vascular injury. However, it is still unclear whether MF-like cells in the fibrous cap derived from EndoMT or MMT are detrimental or beneficial for lesion stability. Studies have demonstrated that EC and macrophages can synthesize and organize collagen6,7,43, and our current studies show that in the absence of SMC, their expansion can be associated with maintained indices of stability. This beneficial role and the fact that these MF transitions constitute a sizable fraction of fibrous cap cells during normal atherosclerosis development suggest that the prevailing dogma that EndoMT is always a maladaptive process6,7 be reconsidered. Indeed, there is clear evidence that EndoMT occurs extensively during development and contributes a large fraction of vital mesenchymal cells during heart valve formation and perivascular cells during coronary artery formation. Yet, the idea that EndoMT is detrimental in atherosclerosis has largely emerged from a study showing that genetic augmentation of EndoMT in all endothelial cells exacerbated atherosclerosis, making it impossible to determine the role of naturally occurring EndoMT in atherosclerosis6. A follow-up study showed that reducing EndoMT by selectively ablating TGFBR1/2 in EC showed reduced lesion size. However, the same study also reported a significant depletion in ACTA2+ cells and collagen content, which is contrary to the desired effect of interventional therapy for atherosclerosis44. These results reinforce our observations that EndoMT is an essential component of the fibrous cap and suggest that therapeutic inhibition of EndoMT be considered with caution6,7.
A previous study from our lab showed that disrupting IL1-signaling resulted in multiple detrimental effects on fibrous cap stability mediated in part through IL1-signaling in SMC, which we hypothesize may have contributed to the modest beneficial effects seen in the CANTOS trial10,45. Our current studies expand these observations by showing that loss of IL1-signaling also reduces the contribution of EndoMT-derived cells to the fibrous cap. Similarly, we believe that indiscriminately inhibiting PDGFRB signaling could dramatically inhibit key processes that regulate lesion stability, including delaying fibrous cap development and significantly reducing ACTA2+ cells within the fibrous cap15,16. Indeed, sustained PDGFRB signaling is essential for retention of ACTA2+ SMC and collagen content within the fibrous cap, suggesting a critical protective role of PDGFRB signaling in fibrous cap development and maintenance. Therefore, contrary to dogma, we propose that augmenting46 rather than reducing PDGFRB signaling in SMC during late-stage atherosclerosis, would be a beneficial therapeutic strategy for maintaining lesion stability. Unlike many chronic diseases where fibrosis drives tissue dysfunction, atherosclerotic plaque stability relies on a robust fibrotic response to produce a protective fibrous cap. As such, our results may help explain why patients treated with Imatinib or other anti-cancer treatments have increased CVD, including peripheral artery disease47–50. Together, this data shows for the first time in vivo that PDGFRB signaling is a critical component of the protective machinery that typifies a stable atherosclerotic lesion.
Further studies are necessary to identify strategies to safely augment the beneficial effects of PDGFRB-signaling in fibrous cap SMC. However, we provide evidence that PDGFRB function is closely intertwined with aerobic glycolysis and overall cellular bioenergetics. In fact, recent multi-omics studies on mouse and human lesions have suggested that the metabolic signature of lesions may be a prognostic biomarker of stability17,51–53. We have further shown that a PDGF/TGFβ-induced shift in bioenergetic pathway directly affects ECM synthesis in cultured SMC that have phenotypically modulated to a MF-like state. These data suggest that the beneficial impact of PDGFRB signaling in SMC is in part due to a shift in metabolism that allows for robust ECM synthesis, which suggests that therapeutically augmenting SMC aerobic glycolysis may induce similar plaque-stabilizing benefits.
The data presented in these studies demonstrate that expansion of the protective MF-like cells in the fibrous cap is an inherent adaptation shared by multiple cell types for maintaining plaque stability. Finally, we propose a mechanism to promote cell-specific phenotypic transitions to an MF-like state through bioenergetic reprogramming, paving the way for identifying potential therapeutic approaches for enhancing plaque stability.
Methods:
Details about materials can be found in the Reporting Summary associated with this manuscript.
Animal Handling and Tissue Processing for Murine Atherosclerosis Studies
Animal protocols were approved by the University of Virginia Institutional Animal Care and Use Committee. SMC lineage-tracing studies were performed on male Myh11-CreERT2, ROSA26-STOPFL/FL-eYFP+/+, littermates backcrossed at least nine times to C57BL/6J. Males were used as the Myh11-CreERT2 transgene is located on the Y chromosome, males and females were used for Cdh5-CreERT2 (see Supplement 11). All mice were given a 5-digit numerical code, which was recorded in a micro-transponder placed subcutaneously at the time of weaning. Mice used for all atherosclerosis studies were crossed to an Apoe−/− background or an Ldlr−/− background except for the PCSK9 administered mice. Cre-lox mediated recombination of ROSA26-LSL-eYFP was induced in 6–8-week-old mice after intraperitoneal injections of 1mg of tamoxifen (T-5648, Sigma) per mouse per day for 10 days over two weeks, except in the case of delayed tamoxifen studies, which received tamoxifen between 16–18 weeks of WD feeding (24–26 weeks of age). At 8 weeks of age, mice were put on Western diet (WD) containing 21% milk fat and 0.2% cholesterol (Harlan Teklad 88137) and remained on WD for 18 or 26 weeks (26–34 weeks old).
On the day of harvest, and at least 4 hours after fasting, mice were euthanized by CO2 asphyxiation. Mice were weighed, the identity of each mouse was confirmed using implanted radio-frequency transponders, and a segment of the tail was taken to repeat genotyping and assess recombination when appropriate. Blood was drawn for lipid analyses prior to the gravity- perfusion/fixation via the left ventricle with 5 mL of PBS, 10 mL of 4% paraformaldehyde (PFA; EMS 15710), and an additional 5 mL of PBS. Organs were harvested and weighed. Vascular locations, including the BCA and aortic root, were carefully dissected, processed, and embedded in paraffin. To test for hyperlipidemia, plasma cholesterol and triglyceride levels were analyzed by the University of Virginia Clinical Pathology Laboratory. Any animal without elevated lipids after WD was excluded.
PDGFRB deletion in smooth muscle cells in vivo
PDGFRB studies used male Myh11-CreERT2, ROSA26-STOPFL/FL-eYFP+/+, Apoe−/− mice crossed with PdgfrbFL mice to generate PdgfrbSMC-WT/FL lineage tracing mice. PdgfrbSMC-WT/FL mice were bred to produce Pdgfrb-WT and KO (“PdgfrbSMC-WT/WT” and “−Δ/Δ”) littermates. Mice were allocated to groups by genotyping. Recombination resulted in eYFP expression and knockout of Pdgfrb, specifically in SMC (Extended Data Fig 1). Pdgfrb excision was validated by PCR using primers to validate the excision of exon 7 of the Pdgfrb gene, as well as single cell analysis of SMC by immunofluorescence in the vessel media after 18 weeks of WD. Only animals with greater than 95% excision of PDGFRB in SMC (% Myh11-eYFP+ PDGFBR− /Myh11-eYFP+) in the media after 18 weeks of WD were included in subsequent analyses.
Endothelial cell lineage-tracing in vivo
EC lineage-tracing mice were generated by crossing Cdh5-CreERT2 mice with the ROSA26-STOPFL/FL-eYFP+/+ reporter mouse. Although for the Myh11-eYFP experiments, we were limited to studying male mice given the location of the transgene on the Y Chromosome, both male and female mice were used for Cdh5-lineage tracing experiments, in adherence with NIH guidelines. We have separated the data by sex in Supplement 11. IL1R1 studies used Cdh5-CreERT2, ROSA26-STOPFL/FL-eYFP+/+, Apoe−/− (Cdh5-eYFP) crossed with Il1r1FL mice to generate Il1r1EC-WT/FL lineage-tracing mice. Il1r1EC-WT/FL mice were bred to produce Il1r1-WT and KO (“Il1r1EC-WT/WT” and “−Δ/Δ”) littermates. Mice were allocated to groups by genotyping at the time of weaning. Recombination resulted in eYFP expression and knockout of Il1r1, specifically in EC (Extended Data Fig 6). Il1r1 excision was validated by PCR using primers that detect excision of exon 4 of the Il1r1gene. The genotype and recombination status was confirmed for every experimental mouse using PCR at the time of harvest. Mice failing to undergo recombination were excluded from the analysis. In addition, Cdh5-eYFP+ cells were sorted from the aorta of IL1R1EC-WT/WT or −Δ/Δ mice, and recombination was confirmed in the KO and absent in the WT.
PCSK9-AAV8 model of murine atherosclerosis
The gain of function mutant murine pAAV/D377Y-mPCSK9 plasmid was purchased from Addgene (Cat# 58376)54. The amplified plasmid was purified using a Qiagen endotoxin-free purification kit (Qiagen#12362). Viral vector serotype 8 (rAAV8-D377Y-mPCSK9) was produced by Vigene biosciences (Rockville, MD) with the purified the Addgene plasmid. To induce Cre-recombination, SMC lineage-tracing Myh11-CreERT2, ROSA26-STOPFL/FL-eYFP+/+ mice were fed a 250 mg per kg body weight tamoxifen diet (Cat# TD.130855-Envigo) from 6 to 8 weeks of age. To ensure sufficient tamoxifen consumption, the diet was given both as pellets and mixed with drinking water in a paper cup inside the cage, which was changed three times a week. One week later, mice were anesthetized with methoxyflurane (2,2-dichloro-1,1-difluoroethyl methyl ether) and a single dose of 1×10¹¹ mPCSK9-AAV8 viral genome was injected intravenously in the tail vein. Mice were then fed WD for 18 weeks to induce atherosclerosis prior to harvest and processing.
LDLR deletion model of murine atherosclerosis
For atherosclerosis studies in low-density lipoprotein (LDL) receptor-deficient (Ldlr−/−) mice, SMC lineage-tracing Myh11-CreERT2, ROSA26-STOPFL/FL-eYFP+/+ mice were crossed with Ldlr−/− mice (on a mixed C57BL/6×129 background). To avoid strain differences, these mice were backcrossed seven generations with the Myh11-CreERT2, ROSA26-STOPFL/FL-eYFP+/+ mice prior to setting up experimental cohorts. Between 6–8 weeks, male Myh11-CreERT2 ROSA26-STOPFL/FL-eYFP+/+ Ldlr−/− mice were injected with tamoxifen as described above. At eight weeks of age, mice were fed a WD (Harlan Teklad 88137) for another 18 weeks to induce atherosclerosis prior to harvest and processing.
Lethal Irradiation and Bone Marrow Transplant
At nine weeks of age, male and female Cdh5-eYFP mice underwent lethal irradiation, receiving two 600 cGy doses, 3 hours apart, using a cesium-137 irradiator (Mark 1–68a) and reconstituted 30–60 minutes later with >1 × 10⁶ unfractionated bone marrow (BM) cells via tail vein injection from tdTomato Apoe−/− mice13,55. The 1200 cGy dosage was chosen based on multiple previous reports. BM was harvested from the femur and tibia from donors aged 4 to 7 weeks13. After BMT, mice were given antibiotics via drinking water (Sulfa water: 80mg/mL sulfamethoxazole, 16 mg/mL trimethoprim, Teva Pharmaceuticals) for 6 to 7 weeks during BM reconstitution before being placed on WD (Figure 2).
Delayed Tamoxifen Administration Studies
PdgfrbSMC-WT/WT and PdgfrbSMC-FL/FL animals were put on WD starting at eight weeks of age. Between 16 and 18 weeks of WD, mice were injected with tamoxifen to induce recombination of eYFP and Pdgfrb specifically in Myh11-CreERT2 expressing cells. This method labels approximately 20% of the SMC within the lesion, primarily those located in the fibrous cap. Mice remained on WD and were harvested eight weeks later.
Imatinib Mesylate Administration Studies
Myh11-CreERT2, ROSA26-STOPFL/FL-eYFP+/+, Apoe−/− mice were injected with tamoxifen between 6–8 weeks of age and fed a WD for 18–20 weeks before being randomly allocated to receive either Imatinib or saline as a control treatment via intraperitoneal injection once daily for seven days. Treatment mice received 100 mg/kg/day of Imatinib based on numerous pre-clinical studies showing the tolerability of this dosage in mice56,57, and its relevance to the human dosing regimen (up to 400 mg BID; Gleevec by Novartis). Imatinib was purchased as a mesylate salt (Selleckchem) and was resuspended in 0.9% medical-grade sterile saline prior to each injection. Mice were euthanized if they exhibited symptoms of distress such as hunching or hind-limb paralysis per ACUC guidelines. Saline treated control mice were euthanized after seven injections, corresponding to the final Imatinib injection.
Immunohistochemistry
Murine tissue preparation, lesion morphology, and immunofluorescence staining
PFA-fixed paraffin-embedded tissues were sectioned at a thickness of 10μm with three sections per slide. Brachiocephalic arteries were prepared with care to record the distance of the section from the vessel’s origin at the aortic arch5.
To assess vessel morphometry and composition, Modified Russell-Movat pentachrome (MOVAT) staining was performed, which provides excellent contrast between vascular features. Image Pro Plus Software was used to determine vessel, lesion, lumen, and media areas at 3 locations, 300μm apart. The lesion measurements in Supplement 11 were obtained by tracing the differential interference contrast image using ImageJ. Necrotic core areas were measured at two locations 300μm apart. Collagen content was visualized by PicroSirius Red staining at two locations, 300μm apart. The sample size is indicated in all graphs by individual dots.
Paraffin-embedded BCA lesions were deparaffinized in xylene and rehydrated in ethanol. Citrate-based antigen retrieval was performed (H-3300 Vector Laboratories) as described by the manufacturer. Slides were blocked for 1 hour at room temperature with a mixture of PBS, fish skin gelatin, and 10% horse serum. Slides were then incubated with the following primary antibodies: GFP (Abcam ab6673, 1:250), PDGFRB, (Abcam ab32570, 1:250), CD31 (Abcam ab124430, 1:500), LGALS3 (Cedarlane CL8942AP, 1:500), MKi67 (Abcam ab15580, 1:250), cleaved caspase-3 (CASP3; Cell Signaling no. 9661S, 1:75), MYH11 (Kamiya Biomedical Company MC-352, 1:500), or their isotype IgG as negative control. Each slide had 2 sections stained with primary antibodies and 1 section used for IgG control antibodies. ACTA2 was conjugated to -FITC (Sigma F3777 clone 1A4 1:500) or -Cy3 (Sigma C6198, clone 1A4, 1:500). Secondary antibodies for immunofluorescence included the following: donkey anti-goat 488 (Invitrogen A11055, 1:250), donkey anti-rat Dylight 550 (Abcam ab102261, 1:250), and donkey anti-rabbit 555 (Invitrogen A21206, 1:250), donkey anti-goat 647 (Invitrogen A21447, 1:250), and donkey anti-rat Dylight 650 (Abcam ab102263, 1:250). Red blood cell analysis was performed using DAB (Acros Organics), a primary Ter119 antibody (rat anti-mouse Santa-Cruz Biotechnology, Inc; 1:200), and rabbit secondary antibody (Vector Labs BA-4001; 1:200). Sections were washed in a series of PBS-Tween and PBS baths between antibody steps. Nuclear counterstaining was performed with DAPI (ThermoFisher Scientific D3571), and slides were mounted with Prolong Gold Antifade (Invitrogen).
Image acquisition of murine lesions
Immunofluorescence imaging of BCA sections was performed using a Zeiss LSM700 or LSM880 confocal microscope. Acquisition settings were determined using the IgG isotype control. Images were acquired at 1024 × 1024 or 2048 × 2048 resolution using a 20x magnification at 0.5 zoom. A series of 1μm Z-stack images were acquired for single cell analyses of the entire media, lesion, or fibrous cap areas. The fibrous cap area was determined as the 30μm area under the lumen, and the lumen was determined by Differential Interference Contrast (DIC) channel.
Determining fibrous cap area in murine lesions
The 30μm area under the lumen was selected as a standard to measure the fibrous cap across the different experimental assays within this study. This standard was selected after analysis of ACTA2+ cell location by the two following methods.
For the first method, we determined the depth of the contiguous ACTA2+ cell area. To do this, 15 evenly spaced points were drawn along the lumen of Myh11-CreERT2 animals fed 18 weeks of WD, starting at the middle and extending toward the two shoulder regions of the lesion. Perpendicular lines from the points on the lumen were drawn to measure contiguous ACTA2+ cell depth (ACTA2+ staining that was not separated by ACTA2− DAPI+ cells). The lengths of the 15 points were averaged to determine depth of the fibrous cap (Supplement 1).
For the second method, we determined the distribution of all ACTA2+ cells within the lesions, relative to the lumen. The distance from the lumen of all ACTA2+ cells within the lesion was measured. ACTA2+ eYFP+ or ACTA2+ eYFP− cells were indicated as graphical elements in the Zeiss Zen Black or Zen Blue software (3.2) and imported into FIJI for further analysis58. Using the DIC channel, the interface between the plaque and the lumen was outlined and added to the ROI manager. Next, the indicated cells were detected using the Analyze Particles module and also added to the ROI manager. Code modified from the office of collaborative Science Microscopy Core at New York University was then used to determine the shortest distance (tangent) between the identified nuclei and the lumen (Supplement 1).
Single cell counting and image analysis of murine lesions
Single cell counting, as denoted by DAPI, was performed using the Zeiss Zen software to determine cell composition and co-localization of markers within a single DAPI+ nucleus. All counting studies were performed blinded to mouse genotype. For EC lineage tracing image analysis, EC were counted in three different locations within the lesion: 1) DAPI+ cells within the lumen monolayer, 2) within the 30μm fibrous cap area, and 3) located >30μm into the lesion. The distinction of whether EC remained within the lumen monolayer was based on cellular morphology, whether the cellular border was in contact with lumen as determined by DIC image, and whether a nucleated cell separated the cell from the lumen. Fibrous cap counting in Supplement 11f includes only those cells in group two while those in Supplement 11h and Figure 7f included both groups 1 and 2 to gain a comprehensive understanding of the cells within the 30μm fibrous cap area, matching the counting approach used for the Myh11-CreERT2 mice. Linear or gamma brightness adjustments for print were applied equally to all panels within an image, and figure images were pseudo-colored. Scale bars were added in Adobe Photoshop or Illustrator.
Single cell counting was performed on the entire lesion, media, or 30μm fibrous cap area. Each DAPI+ cell was marked and counted as an “event”. Subsequently, eYFP+, ACTA2+, and CD31+, LGALS3+, or tdTomato staining were associated with each DAPI+ nucleus by scanning through the Z-stacks to ensure ownership of that marker for the particular cell. eYFP and LGALS3 were considered positive if they were observed throughout the cytoplasm of the cell. ACTA2 staining was considered positive if it displayed cytoplasmic staining with distinct structural morphology. CD31 staining, generally localized to the cell membrane, was considered positive if it was associated with a DAPI+ nucleus. Staining for tdTomato was considered positive if it was cytoplasmic and not associated with a Cdh5-eYFP+ DAPI+ cell. After individual stains were attributed to a DAPI nucleus, double and triple positive cells were counted and expressed as a percent over total DAPI or total ACTA2 cells within the region of interest. The sample size is represented by individual dots within each figure (each dot is one location of one individual mouse). Multiple locations counted for a single stain were specified in microns past the aortic arch on the X-axis. Cell counting is innately subjective, and therefore every effort was made to minimize human influence by keeping counters blinded to mouse genotype throughout each experiment, to perform quality control spot-checks using a second, blinded investigator, and to corroborate findings with multiple mouse lines.
PicroSirius Red staining was imaged by fiber birefringence under polarized light using an Olympus BX51 camera with a polarized lens. Ter119 status was analyzed as a binary: either a lesion was had staining (Ter119+) or did not have staining (Ter119−). The percentage of lesions with or without staining were analyzed per location and then combined into a single bar graph with analyses performed as a function of genotype and Ter119 status over three locations (specified in the respective figure legends). Movat and Ter119 staining were imaged using a Zeiss Axioskope2 fitted with an AxioCamMR3 camera, using AxioVision40 V4.6.3.0 software (Carl Zeiss Imaging Solution). Image Pro Plus software (Media Cybernetics) was used to analyze Ter119, Movat, and PicroSirius Red. Areas of Interest were drawn denoting the external elastic lamina (“EEL”), internal elastic lamina (“IEL”), lesion, and 30μm fibrous cap. The lumen area was the difference between IEL and lesion. Pixels were selected for Ter119 and Picro Sirius Red analyses to denote positive staining and defined using color-cube based method. Researchers were blinded to mouse genotype.
ISH-PLA and immunofluorescence staining of human tissue
Human coronary processing
De-identified human coronary artery specimens were obtained from the CVPATH Institute. Advanced lesions classified as “plaque rupture”, “plaque erosion”, or “stable” were selected from the CVPATH Institute Sudden Death Registry. Briefly, the artery segments were fixed in formalin, 2 to 3mm segments were embedded in paraffin. Cross-sections 5μm thick were cut from each of the segments mounted on slides and stained with hematoxylin eosin (H&E) and/or Movat for histopathology evaluation. The diagnosis of coronary disease and histopathological determination severe coronary artery disease with stable lesions were performed by an experienced cardiac pathologist at the CVPath Institute. This study has been approved by CVPATH Institutional Review Board (IRB) as an exempt study (#RP0074).
ISH-PLA staining
Paraffin-embedded Human coronary lesions were deparaffinized in xylene and rehydrated in ethanol. Citrate-based antigen retrieval was performed as described by the manufacturer (H-3300 Vector Laboratories). Slides were blocked for 1 hour at room temperature with a mixture of PBS, fish skin gelatin, and 10% horse serum. ISH-PLA staining for H3K4me2 at the Myh11 promoter was performed7 using Duolink Probe anti-mouse MINUS (Millipore Sigma DUO92004) and anti-rabbit PLUS (Millipore Sigma DUO92002) and In Situ Orange (Millipore Sigma DUO92007). Antibodies were as follows: mouse H3K4me2 (Millipore Sigma 05–1338, 100 μg, clone CMA303, 1:100), rabbit Biotin (Abcam ab53494, 1 mg/mL, 1:100), ACTA2 was conjugated to -FITC (Sigma F3777 clone 1A4, 1:500). Nuclear counterstain was performed with DAPI containing mounting media (DUO82040 Sigma-Aldrich Duolink In Situ Mounting Medium with DAPI). Notes important to hybridization: Pepsin solution pH=4.3. Human Cot-1 DNA was from Millipore Sigma (11581074001 Roche).
CD31 staining of human coronary artery lesions
After blocking, slides were incubated with the following primary antibodies: CD31 (Abcam ab32457, 1:100), LGALS3 (Cedarlane CL8942AP, 1:500) or their isotype IgG controls. Each slide had at least two sections stained with primary antibody and at least one section used as an IgG control. ACTA2 was conjugated to -FITC (Sigma F3777 clone 1A4 1:500). Secondary antibodies for immunofluorescence were as follows: donkey anti-rabbit 555 (Invitrogen A21206, 1:250) and donkey anti-rat Dylight 650 (Abcam ab102263, 1:250). Nuclear counterstain was performed with DAPI (ThermoFisher Scientific D3571), and slides were mounted with Prolong Gold Antifade (Invitrogen).
Imaging of human coronary artery lesions
Coronary arteries were imaged using an HC PL APO CS 40x/0.85 DRY objective on a DMI8 Leica Thunder Imager (v 3.7.1.21655). Images were reduced to a single z-plane using the extended depth of field (EDoF; developed by A. Prudencio) method and converted to 8-bit to prevent integer floats. The fibrous cap region was determined by the CVPATH Institute based on H&E or Movat staining and superimposed on a merged tile image of the immunofluorescent stained section (Extended Data Fig 8). The merged tile image served as a map to determine the region of interest for analysis. Images were then imported into Cellprofiler 3.0, for automated cell segmentation and object counting.
Nuclei segmentation and identification of ISH-PLA signal in human samples
The fibrous cap region of interest was manually identified, and DAPI was used to identify and segment cells as primary objects using Otsu three-class thresholding. Artifacts of red blood cell autofluorescence and elastic lamina were filtered based on the MADIntensity in the 488 channel. Next, the nuclei primary objects were expanded and used to mask the ISH-PLA channel (as ISH-PLA signal can be present just outside of the nucleus25). ISH-PLA dots were detected as primary objects using Otsu three-class segmentation in the masked image and filtered based on size and circularity. ACTA2 intensity within expanded nuclei primary objects was then used to determine if a cell was ACTA2+ or ACTA2−. Finally, RelateObjects was used to associate ISH-PLA dots to the closest cell, and results were exported as outlines on the original image and in an excel spreadsheet. Based on the exported images, any region with significant misidentification of nuclei was removed from the analysis. Medial regions not underlying the plaque were used to establish a baseline for ISH-PLA efficiency for each sample, which was then applied as a correction factor to the fibrous cap raw values. Assuming that all ACTA2+ medial cells are derived from SMC (i.e. should be PLA+), we used (Eq. 1) to calculate efficiency of 38% in the sections used (Extended Data Fig 8). We used this correction to calculate the proportion of all ACTA2+ fibrous cap cells that are of SMC (Eq. 2) and non-SMC origin (Eq. 3).
Efficiency of the ISH-PLA process was determined by:
| Eq. 1 |
Proportion of ACTA2+ cells in the fibrous cap derived from a SMC origin was determined by:
| Eq. 2 |
Proportion of ACTA2+ cells in the fibrous cap derived from a non-SMC origin was determined by:
| Eq. 3 |
Nuclei segmentation and coincidence determination of ACTA2 and CD31 in human samples
The fibrous cap region of interest was manually identified as described above, and DAPI was used to identify and segment cells as primary objects using Otsu three-class thresholding. Artifacts of red blood cell autofluorescence and elastic lamina were filtered based on the MADIntensity in the 488 channel. ACTA2 and CD31 positivity was determined by the MADIntensity staining within and directly surrounding the nuclei primary objects. Results were exported as outlined images and an excel spreadsheet. Based on the exported images, any region with significant misidentification of nuclei was removed from the analysis. EndoMT was defined as (CD31+ACTA2+ /ACTA2+).
Metabolic Flux Measurements
Cell Culture
To ensure a true population of SMC-derived cells in culture, SMC were isolated from the thoracic aorta of Myh11-eYFP+ mice. The thoracic aorta was excised from 4–7-week-old Myh11-CreERT2 lineage-tracing mice and carefully cleaned in PBS and dissected to remove all periadventitial fat. Aortae were then placed in a collagenase mixture (Sigma) at 37°C until the adventitia started to digest (assessed by brightfield microscopy). The enzyme was inactivated using serum-containing media, and the adventitia was carefully peeled away from the smooth muscle layer. The vessel was cut open en face in PBS, and the endothelial layer was gently removed using forceps. The smooth muscle layer was rinsed gently in PBS and dissociated using a Liberase digestion cocktail (Sigma). The single cell suspension was subjected to flow-assisted cytometric sorting (FACS) for eYFP+ cells and placed in culture flasks with DF10 [DMEM/F12 media (Gibco; cat#:11320–033) containing 10% FBS (Hyclone; cat#: SH3007.03)]. Once the cells reached 80–90% confluence, cells were subjected to FACS to enrich for eYFP+ cells. Ultimately, the final cultures of the murine aortic SMC cultures were >99% eYFP+ as assessed by flow cytometry, indicating a pure SMC-derived population (gating strategy found in Supplement 4). Human umbilical vein endothelial cells (HUVEC; Lonza) exposed to cytokines IL1β and TGFβ2 were used as a model of endothelial-to-mesenchymal transitions (upregulation of multiple mesenchymal markers and downregulation of multiple EC markers), in accordance with previous studies6,39. Human coronary artery smooth muscle cells (HCASMC; Lonza) were used according to manufacturer’s protocols and were serum-starved for 24–72 hours prior to each experiment.
Quantitative Real-Time PCR
Myh11-eYFP+ SMC were plated on tissue culture plates and grown in DF10 [DMEM/F12 media (Gibco; cat#:11320–033) with 10% FBS (Hyclone; cat#: SH3007.03)] to confluence before being switched to serum free media for 24–72 hours. Cells were washed with 1x PBS and treated with one or a combination of the following, depending on the experiment: PDGF-BB or -DD (10–50ng/mL; vehicle – 4mM HCl in PBS), TGFβ1 (10–50ng/mL; vehicle – 4mM HCl in PBS), Galloflavin (10–50μM; vehicle – DMSO), CPI613 (20μM; vehicle – DMSO), FX-11 (5–50μM; vehicle – DMSO), 2-deoxy-D-glucose (2DG; 10mM; vehicle – PBS), or vehicle control. RNA was extracted using RNEasy Mini Kit (Qiagen). cDNA synthesis was performed using iScript cDNA Synthesis Kit (Bio-Rad) using 250ng of RNA per sample. qRT-PCR was performed using SensiFast SYBR No-ROX and run on a Bio-Rad CFX56 Real-Time System. The analysis was performed using 2−ΔΔCt method with beta-2-microglobulin (B2m), 18s ribosomal RNA (18s), or Ldha variant 2 (Ldha v.2) as the normalization factor (housekeeping gene). For each unique experimental design, non-random variance was assessed for each housekeeping gene to select the normalization factor least influenced by the treatment (e.g. 18s was not used for TGFB-containing experiments, as TGFβ1 increased 18s transcript abundance).
Glycolytic and Mitochondrial Stress Test
4×10⁴ Myh11-eYFP+ SMC were seeded onto a Seahorse 24-well tissue culture plate (Agilent Technologies) in DF10. One to three days before the treatment, the culture medium was replaced with serum-free media (SFM), supplemented with 2.8μg/mL insulin, 6.25ng/mL sodium selenate, 0.2mM ascorbic acid, 5μg/mL transferrin, and 1.6mM glutamine. Cells were then treated accordingly for 24–48 hours in serum free media prior to metabolic assessment. The metabolic assessment was performed as outlined below22.
Briefly, to measure respiratory capacity, cells were subjected to a mitochondrial stress test (MST). At the beginning of the assay, the media was changed to DMEM with pyruvate (Thermo-Fisher, pH=7.35 at 37°C), and the cells were allowed to equilibrate for 30 minutes. Oxygen consumption rate (OCR) was measured using a Seahorse XF24 Flux Analyzer (Agilent Technologies). After three basal OCR measurements (3 min mix, 3 min wait, 4 min measurement), compounds to modulate cellular respiratory function [1μM Oligomycin (Sigma-Aldrich); 2μM BAM15 (Cayman Chemical Company); 1μM Antimycin A & 100nM Rotenone (Sigma-Aldrich)] were individually injected after every set of three measurements. Basal respiration was calculated by subtracting the average of the first three measurements by the average of the post-Antimycin A & Rotenone measurements. Respiratory capacity was calculated by subtracting the average of the post-BAM15 measurements by the average of the post-Antimycin A & Rotenone measurements. Reserve capacity was calculated by subtracting the average of the basal measurements from the average of the post-BAM15 measurements.
To measure glycolytic capacity, cells were subjected to a glycolytic stress test (GST). For this test, extracellular acidification rate (ECAR), a measurement of lactate export, was measured using a Seahorse XF24 Flux Analyzer. Cells were seeded onto a Seahorse 24-well tissue culture plate. At the beginning of the assay, the media was changed to unbuffered, glucose-free, DMEM (Sigma-Aldrich cat#: D5030, pH=7.35 at 37°C), supplemented with 143mM NaCl and 2mM Glutamine. After three basal ECAR measurements, the drugs of interest were injected into the plate, and ECAR was measured every three minutes. Compounds to modulate glycolysis [20mM Glucose; 1μM Oligomycin; 80mM 2-Deoxyglucose (Sigma)] were injected after every three measurements. Basal glycolysis was calculated by subtracting the average of the post-2-Deoxyglucose measurements from the average of the post-Glucose measurements. Glycolytic capacity was calculated by subtracting the average of the post-2-Deoxyglucose from the average of the post-Oligomycin measurements. Glycolytic reserve capacity was calculated by subtracting the average of the post-Oligomycin measurements from the average of the post-Glucose measurements.
RNA-seq Analysis
Bulk RNA-seq
The BCA, aortic arch, and carotid arteries from 18-week Western diet fed PdgfrbSMC-WT/WT (n=5) and PdgfrbSMC-Δ/Δ (n=5) mice were flash frozen in liquid nitrogen for RNA-seq analysis. Total RNA was extracted from arteries using Trizol (Invitrogen). Directional RNA-sequencing with ribosomal reduction and strand specificity was performed by HudsonAlpha Institute for Biotechnology (Illumina HiSeq v4, pe, 100bp, 25M reads), and the sequences were aligned by the University of Virginia Bioinformatics Core.
RNA-seq data were analyzed as outlined below12. Briefly, 100 nt paired-end reads were mapped to the mm9 reference genome using STAR software version 2.4. A table of gene counts/quantification was generated using FeatureCounts in the Subread package. DESeq2 Bioconductor R package was used to identify differentially expressed genes at a 5% (Padj ≤ 0.05) false discovery rate (FDR). Benjamini–Hochberg was used to adjust p-values. Gene IDs were mapped using GENCODE/Ensembl. Significantly regulated genes were identified using the Benjamini-Hochberg procedure to adjust p-values (Padj) to less than or equal to 5% false discovery rate. Kyoto Encyclopedia of Genes and Genomes (KEGG) pathway analysis was performed on all significantly up- or down-regulated genes in the PdgfrbSMC-Δ/Δ vs. PdgfrbSMC-WT/WT samples, as well as all down-regulated genes based on Padj. This in vivo RNA-seq procedure analyzes RNA from all cell types (including endothelial cells and adventitial cells) within the lesions and surrounding vessels and demonstrates the net downstream effect of Pdgfrb loss in SMC in advanced atherosclerosis. The data that support the findings of this study are available from the corresponding author upon request.
Cell processing for scRNA-seq
Six samples (unsorted media and adventitia, sorted media and adventitia, and unsorted lesions) from PdgfrbSMC-WT/WT and PdgfrbSMC-Δ/Δ were prepared as outlined below18. Briefly, samples were minced and digested with Liberase (Roche, Cat: #355374) plus 1μg/mL Actinomycin-D (Cat #) for 1 hour at 37°C. Unsorted samples were counted and submitted directly to scRNA-seq, and sorted samples were flow sorted before submission. Gating strategy is outlined in Supplement 12. Libraries were prepared using the Chromium 10X genomic library according to the manufacturer’s protocol, and 2,000 cells were targeted. Sequencing was performed on the Illumina NextSeq™, 150 cycle high-output.
scRNA-seq Data Analysis
Quality control, cell filtering, integration, and downstream analysis were performed using Seurat in R as outlined below18. Briefly, filters were set for 200–5000 reads UMI, 10% or less mitochondrial and 5% or less hemoglobin gene content. Integration was performed using the scTransform algorithm/function. Significant principal components of variation (PCs) were calculated using JackStraw test with 10000 repetitions, and clusters were calculated with 26 PCs. Differential expression analysis was done using Model-based Analysis of Single-cell Transcriptomics (MAST), and pathway analysis was performed using KEGG. The data and code that support the findings of this study are available from the corresponding author upon request.
Statistical Analysis and Reproducibility
Statistics were performed using GraphPad Prism software. Data were assessed for outliers by a ROUT test and excluded if indicated. Data for individual locations between wildtype and knockout animals were assessed by a two-sided, unpaired Mann-Whitney U-test. The sample size is represented by the number of data points within individual graphs or is indicated in the figure legend. When comparing multiple locations (e.g. distinct animals assessed at two or three locations past the arch) between genotypes, a two-way ANOVA with multiple comparisons and Sidak correction was performed to determine significant differences between genotype, or the interaction of treatment and genotype in the case of intraplaque hemorrhage analysis. Regression analyses were plotted with 95% confidence interval. Each murine and in vitro experiment was repeated at least twice. Data are presented as mean ± SEM. All p-values reflect significant differences between control and experimental groups, and animal numbers and type of statistical analysis done are reflected within figures. A p-value ≤ 0.05 was considered statistically significant.
Data Availability
The data and code that support the findings of this study are available at GSE163519.
Primers
Genotyping
| Pdgfrb | tdTomato |
| GCCATCAACATCTCTGTGATCGG | AAGGGAGCTGCAGTGGAGTA |
| CTCCAGCAGCCGCACGTAGCCAT | CGGGCCATTTACCGTAAGTTAT |
| Pdgfrb Excision | CCGAAAATCTGTGGGAAGTC |
| TAGACTTCCCACCGAGCCTAGT | CD45.1 |
| ACGGCCAGTTCCCCTAAACTAC | CTCACAGGCACATGAACGAT |
| eYFP | CGCTTCAAGCATGTCTTCTG |
| GGAGCGGGAGAAATGGATATG | dsRed |
| AAGTTCATCTGCACCACCG | CCCATGGTCTTCTTCTGCAT |
| TCCTTGAAGAAGATGGTGCG | AAGGTGTACGTGAAGCACCC |
| CGTGATCTGCAACTCCAGTC | CTAGGCCACAGAATTGAAAGATCT |
| Myh11-Cre | GTAGGTGGAAATTCTAGCATCATCC |
| TGACCCCATCTCTTCACTCC | Il1r1 |
| AACTCCACGACCACCTCATC | CTAGTCTGGTGGAACTTACATGC |
| AGTCCCTCACATCCTCAGGTT | AACTGAAAGCTCAGTTGTATACAGC |
| Apoe | GGGGATGGAGGTAGAGGTATGG |
| GCCTAGCCGAGGGAGAGCCG | GATAAAGCAGAGCTGGAGACAGG |
| TGTGACTTGGGAGCTCTGCAGC | |
| GCCGCCCCGACTGCATCT |
qPCR – Mus musculus
| 18s | Fn1 |
| F - CGGCTACCACATCCAAGGAA | F - TCTGGGAAATGGAAAAGGGGAATGG |
| R - AGCTGGAATTACCGCGGC | R - CACTGAAGCAGGTTTCCTCGGTTGT |
| Ldha v.2 | Spp1 |
| F - AACTTGGCGCTCTACTTGCT | F - CTGGCTGAATTCTGAGGGACT |
| R - GGACTTTGAATCTTTTGAGACCTTG | R - TTCTGTGGCGCAAGGAGATT |
| B2m | Col1a1 |
| F - GCTATCCAGAAAACCCCTCAAATTCA | F - CAGGCTGGTGTGATGGGATT |
| R - GCAGGCGTATGTATCAGTCTCAGTG | R - AAACCTCTCTCGCCTCTTGC |
| Acta2 | Col8a1 |
| F - CGCTGTCAGGAACCCTGAGA | F - GGCAAAGAGTACCCACACCTACC |
| R - CGAAGCCGGCCTTACAGA | R - GACCTTGTTCTCCGCGCAAACTG |
| Itgb3 | Col15a1 |
| F - CAGTGGCCGGGACAACTC | F - CTGTCCACTTTCCGAGCCTTT |
| R - TGTGGTACAGATGTTGGACTCTCC | R - AAAGCACTTGGCCCTTGAGA |
| Mmp3 | |
| F - TAAAGACAGGCACTTTTGGCG | |
| R - GGAGACCCAGGGTGTGAATG |
qPCR – Homo sapiens
| LDHA | SNAI1 |
| F - GCTGTTCCACTTAAGGCCCC | F - GCTGCAGGAACTCTAATCCAGA |
| R - AAGGAATCGGGAATGCACGTC | R - ATCTCCGGAGGTGGGATG |
| B2M | PECAM1 |
| F - GAGTATGCCTGCCGTGTGAA | F - AACAGTGTTGACATGAAGAGCC |
| R - GCTTACATGTCTCGATCCCACT | R - TGTAAAACAGCACGTCATCCTT |
| ACTA2 | CDH5 |
| F - TATCCCCGGGACTAAGACGG | F - TTGGAACCAGATGCACATTGAT |
| R - CACCATCACCCCCTGATGTC | R - TCTTGCGACTCACGCTTGAC |
| TAGLN | COL1A1 |
| F - CTGAGGACTATGGGGGTCATC | F - GGACACAGAGGTTTCAGTGGT |
| R - TAGTGCCCATCATTCTTGGT | R - CACCATCATTTCCACGAGCA |
| NOS3 | |
| F - ATTTCCACGGAAACTACAGG | |
| R - TCTCCCTAAGCTGGTAGGTG |
Extended Data
Extended Data Fig. 1. Generation and validation of SMC-specific conditional PDGFRB deletion in SMC lineage-tracing mice.
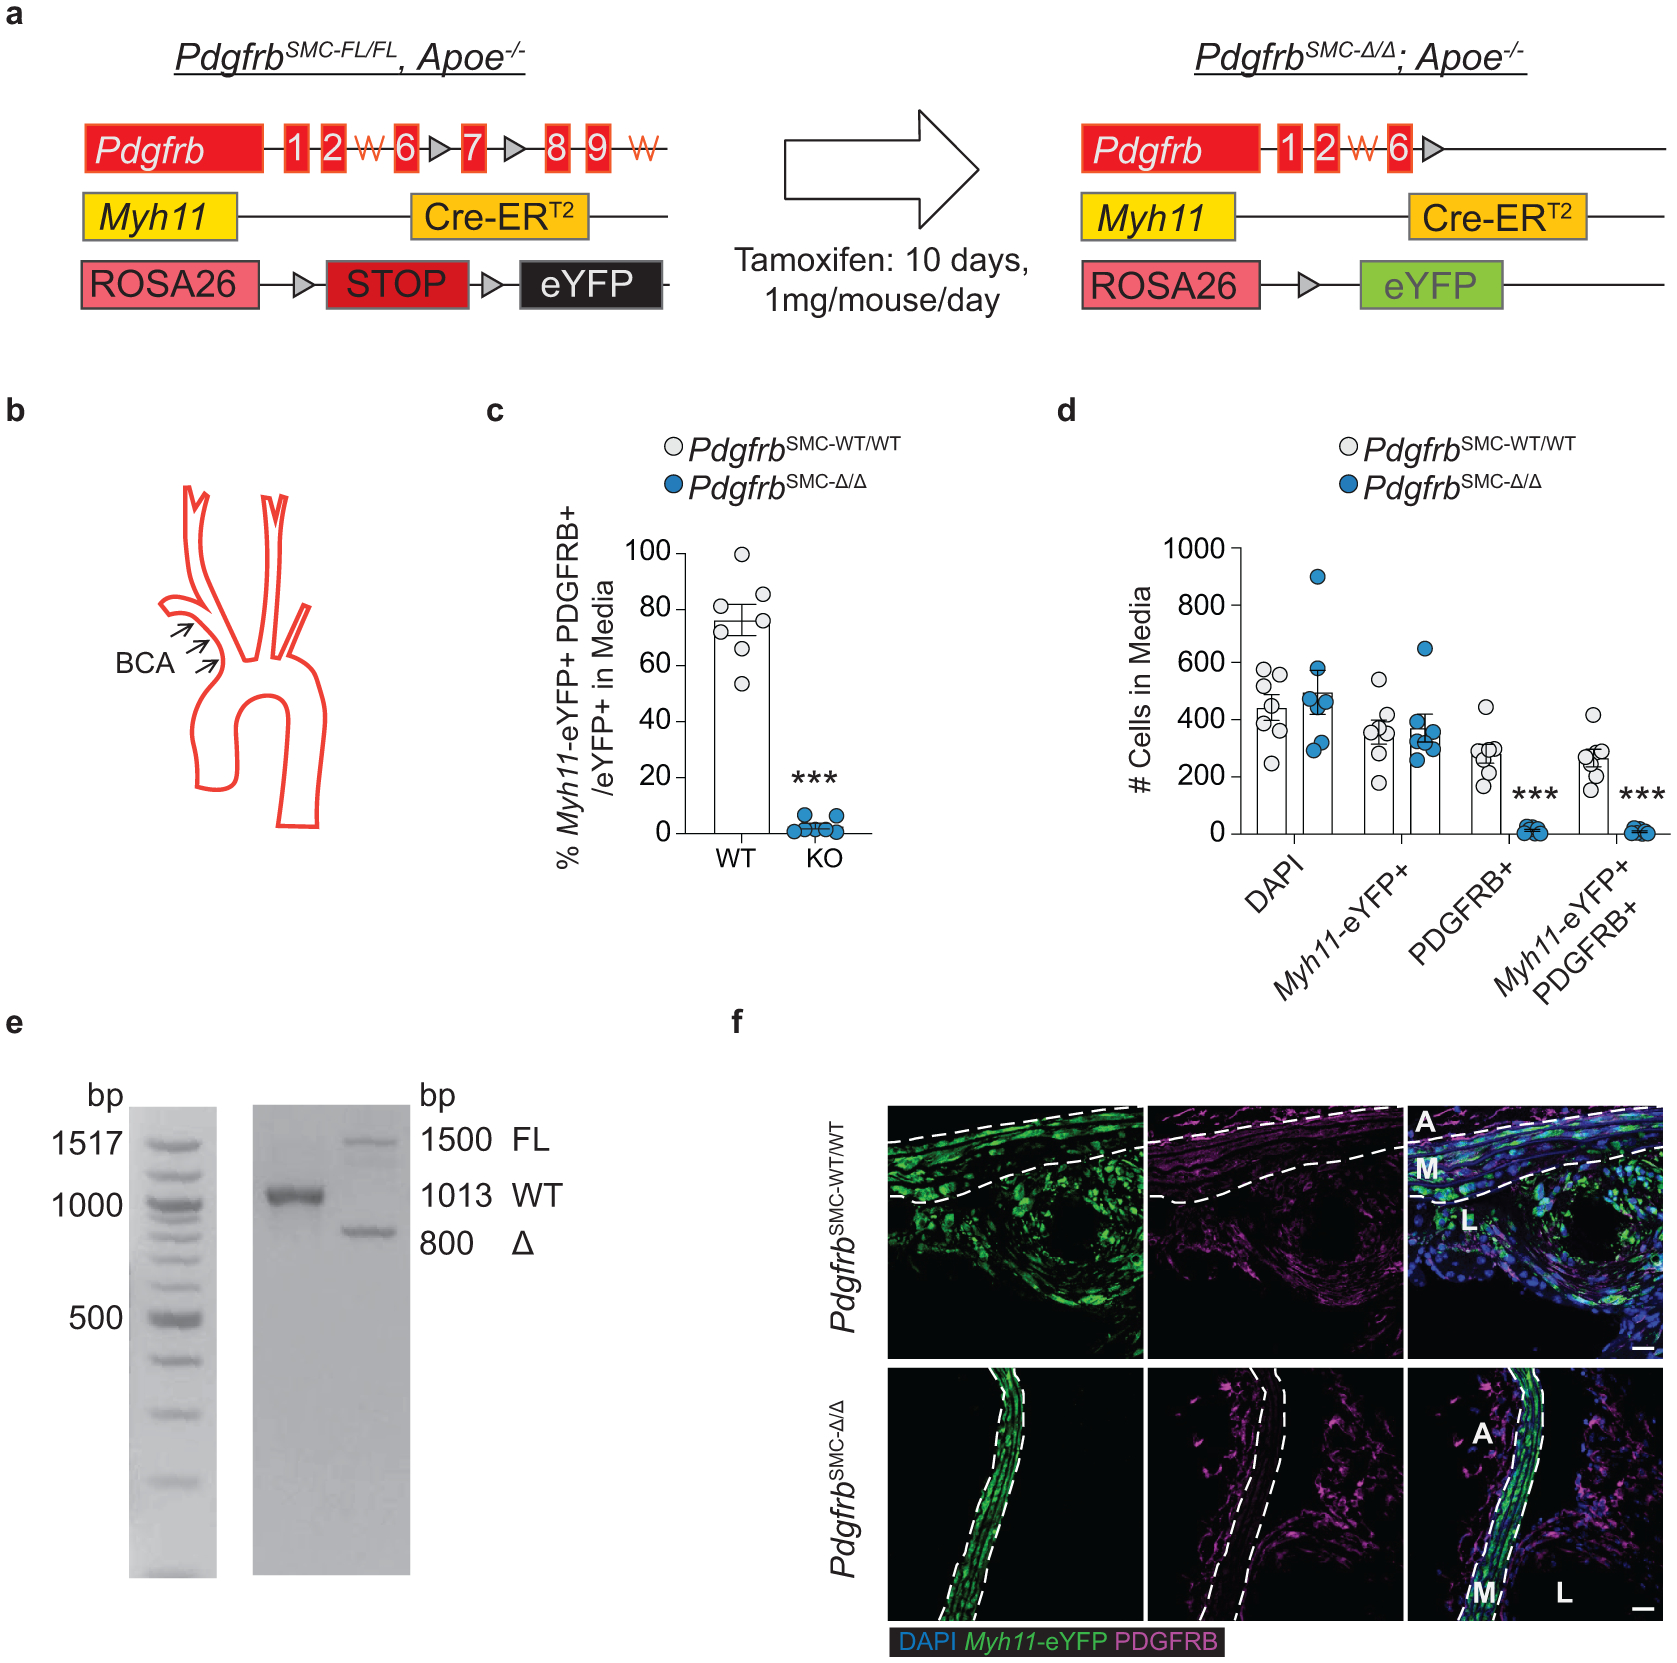
(A) Myh11-CreERT2/ROSA-STOPFL/FL/eYFP; Apoe−/− (Myh11-CreERT2) mice were crossed with a PdgfrbFL/FL mouse to generate PdgfrbSMC-FL/FL and −WT/WT animals. Heterozygote animals were bred (PdgfrbFL/WT; Myh11-CreERT2/ROSA STOPFL/FL/eYFP; Apoe−/−) to generate littermate FL/FL and WT/WT controls, which were used in all experiments. (B) Analyses were conducted on the BCA, at multiple locations past the aortic arch in order to assess patterns across the entire region, or within the aortic root. (C) Quantification of IF staining at 18 weeks of WD in the media of BCA lesions showed efficient KO of PDGFRB in >94% of SMC. ***p-value = 0.0006. (D) PDGFRB KO in SMC is not associated with decreases in the total number of DAPI+ or Myh11-eYFP+ cells (SMC) in the media, but there was a significant reduction in the total number of PDGFRB+ cells and Myh11-eYFP+ PDGFRB+ cells. ***p-values = 0.0006. (E) Validation of genetic deletion of Pdgfrb gene was confirmed for each experimental mouse. (F) Representative images showing PDGFRB loss within the SMC-rich media in PdgfrbSMC-Δ/Δ mice. Scale bar: 20μm. Graphs were analyzed using two-tailed Mann-Whitney U test, biologically independent animals are indicated as individual dots in (C, D), error bars represent mean ± SEM.
Extended Data Fig. 2. SMC investment is significantly impaired in the aortic root of PdgfrbSMC-Δ/Δ mice and SMC-PDGFRB KO did not show reduced dedifferentiation, proliferation, or apoptosis of medial SMC following 18 weeks of WD.
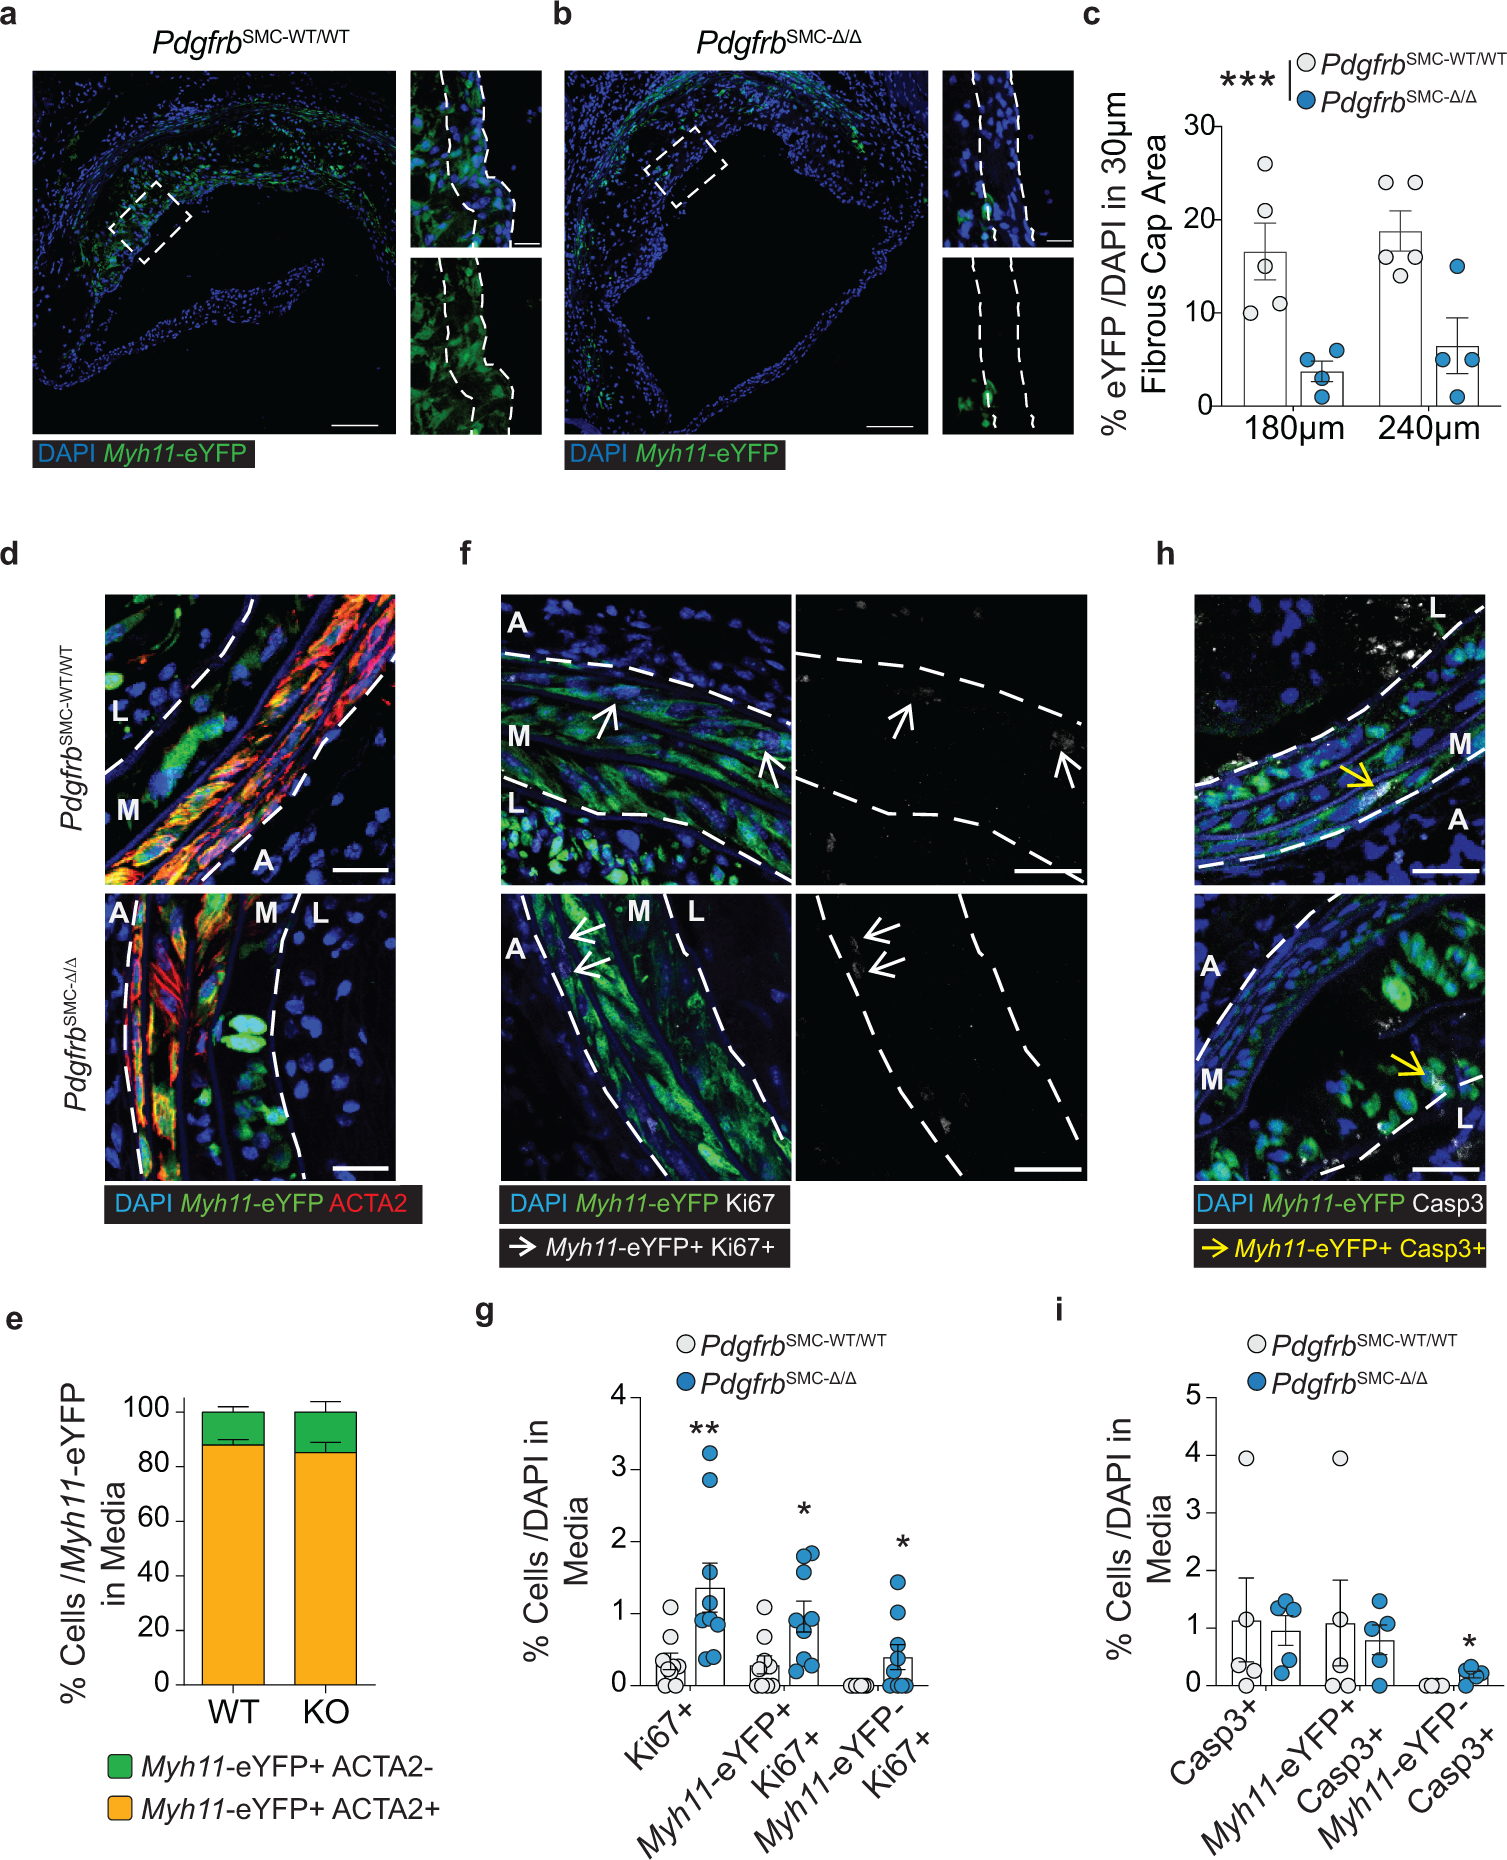
(A) Representative images of aortic root lesions from PdgfrbSMC-WT/WT and (B) PdgfrbSMC-Δ/Δ mice. (C) Quantification of Myh11-eYFP+ cells content in the fibrous caps of aortic root lesions from PdgfrbSMC-WT/WT and PdgfrbSMC-Δ/Δ mice, demonstrated a significant reduction in SMC-derived cells in aortic root lesions. ***p-value = 0.0002. (D) Representative image of the media from the BCA of PdgfrbSMC-WT/WT and PdgfrbSMC-Δ/Δ mice show ACTA2 downregulation in the innermost layer of the media. (E) Quantification of Myh11-eYFP+ACTA2+ cells in the media. (F) Representative image of Ki67 staining in Myh11-eYFP+ SMC in the media. (G) Quantification of Ki67 expression in the media, representing proliferation. Ki67+: **p-value = 0.0017, Myh11-eYFP+ Ki67+ *p-value = 0.0130, Myh11-eYFP− Ki67+ *p-value = 0.0337. (H) Representative image of cleaved caspase 3 staining in Myh11-eYFP+ SMC in the media. Myh11-eYFP− Casp3+ p-value = 0.0476. (I) Quantification of Casp3 expression in the media, representing apoptosis. *p-value = 0.0476. A: Adventitia, M: Media, L: Lesion. Scale bar: 100μm (whole lesion) or 20μm (zoom). Graphs were analyzed using Graphs were analyzed using two-way ANOVA with Sidak correction and multiple comparisons or two-tailed Mann-Whitney U test, biologically independent animals are indicated as individual dots in (C, H, I), n = 8 (WT and KO) in (G), error bars represent mean ± SEM.
Extended Data Fig. 3. PdgfrbSMC-Δ/Δ did not result in differences in BCA lesion size or remodeling indices after 18 weeks of WD and ACTA2+ cells co-localize with LGALS3 or CD31 in lesions lacking SMC investment.
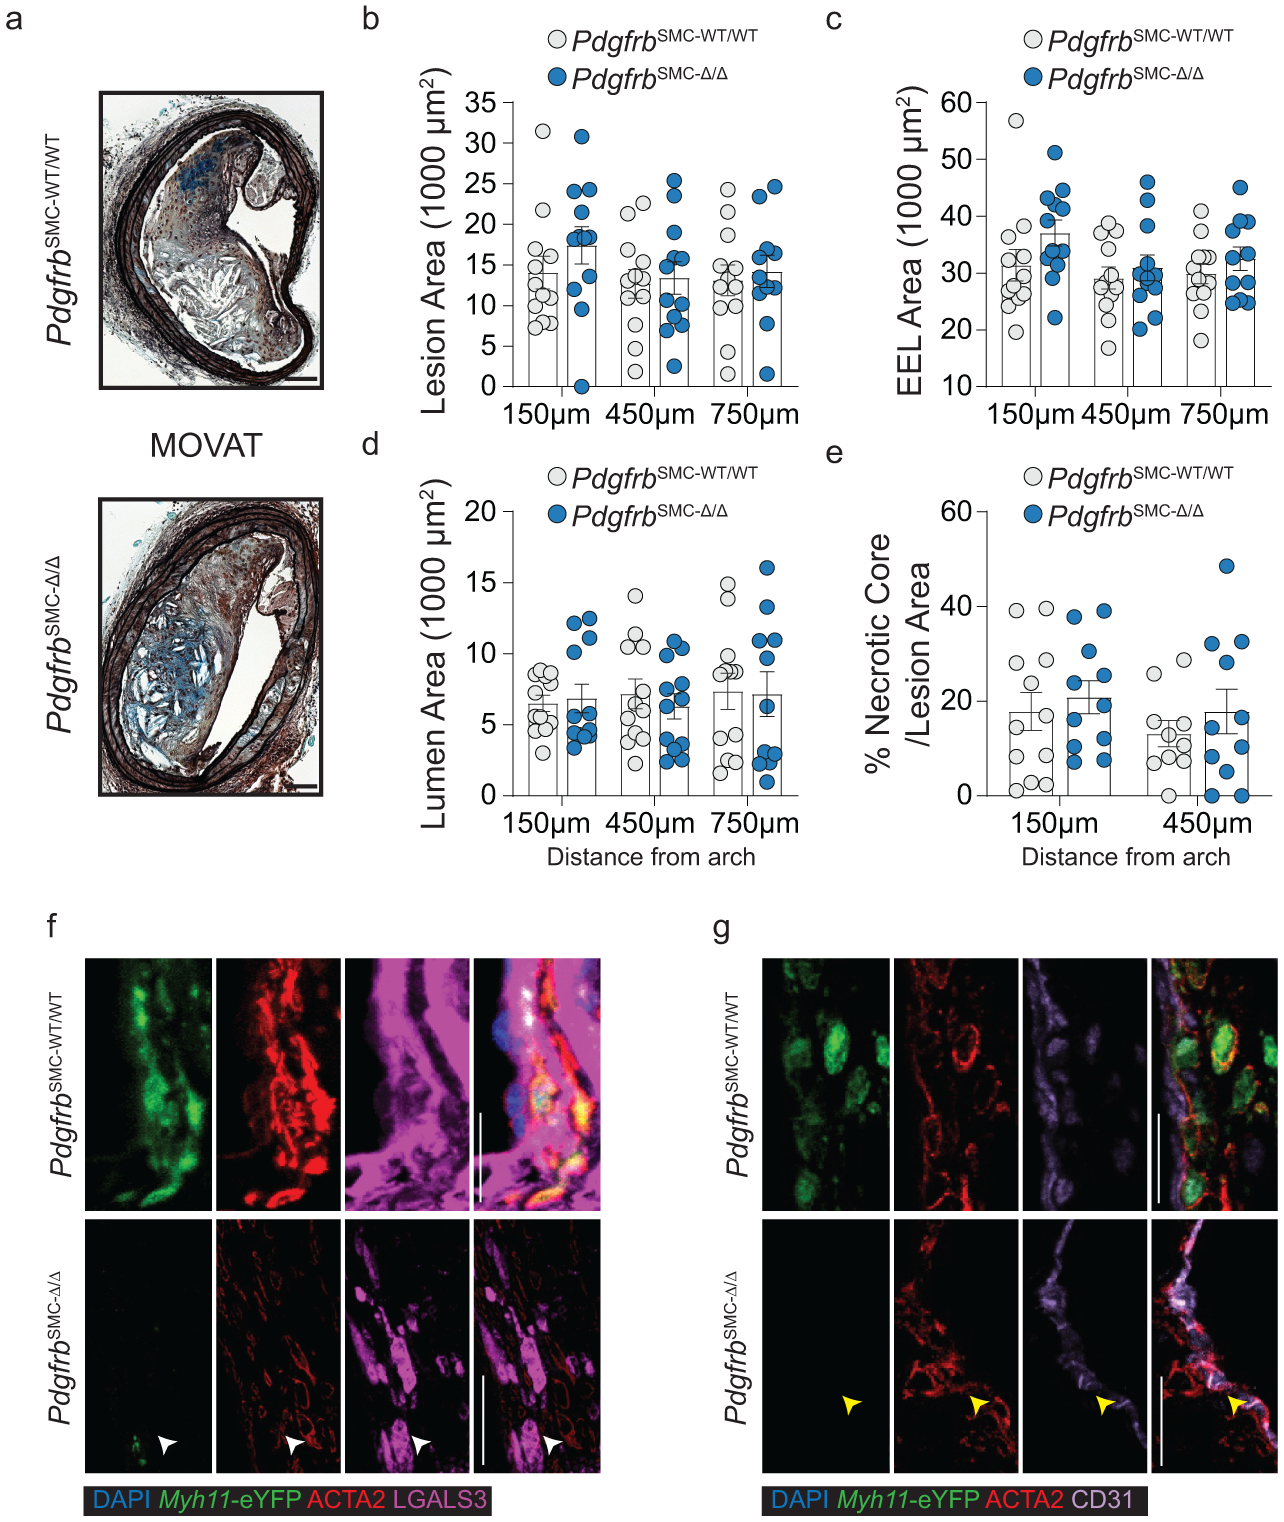
(A) MOVAT representation of PdgfrbSMC-WT/WT and PdgfrbSMC-Δ/Δ mice after 18 weeks of WD. (B) Lesion, (C) External elastic lamina (EEL), (D) or lumen area were not significantly changed at three locations. (E) Necrotic core area was also unchanged. ACTA2 staining co-localizes with LGALS3 (F) or CD31 (G) in the fibrous cap of PdgfrbSMC-Δ/Δ mice. In PdgfrbSMC-WT/WT mice, ACTA2+ eYFP+ cells co-stain with LGALS3 (white) or CD31 (yellow). Scale bar: 100μm (A) and 20μm (F, G). X-axis values represent distance past the aortic arch. Graphs were analyzed using two-way ANOVA with Sidak correction and multiple comparisons, biologically independent animals are indicated as individual dots in (B, C, D, E), error bars represent mean ± SEM.
Extended Data Fig. 4. UMAP presentation of scRNA-seq data showing gene expression of the eYFP transgene, Pdgfrb, and Col15a1 in PdgfrbSMC-WT/WT and PdgfrbSMC-Δ/Δ mice.
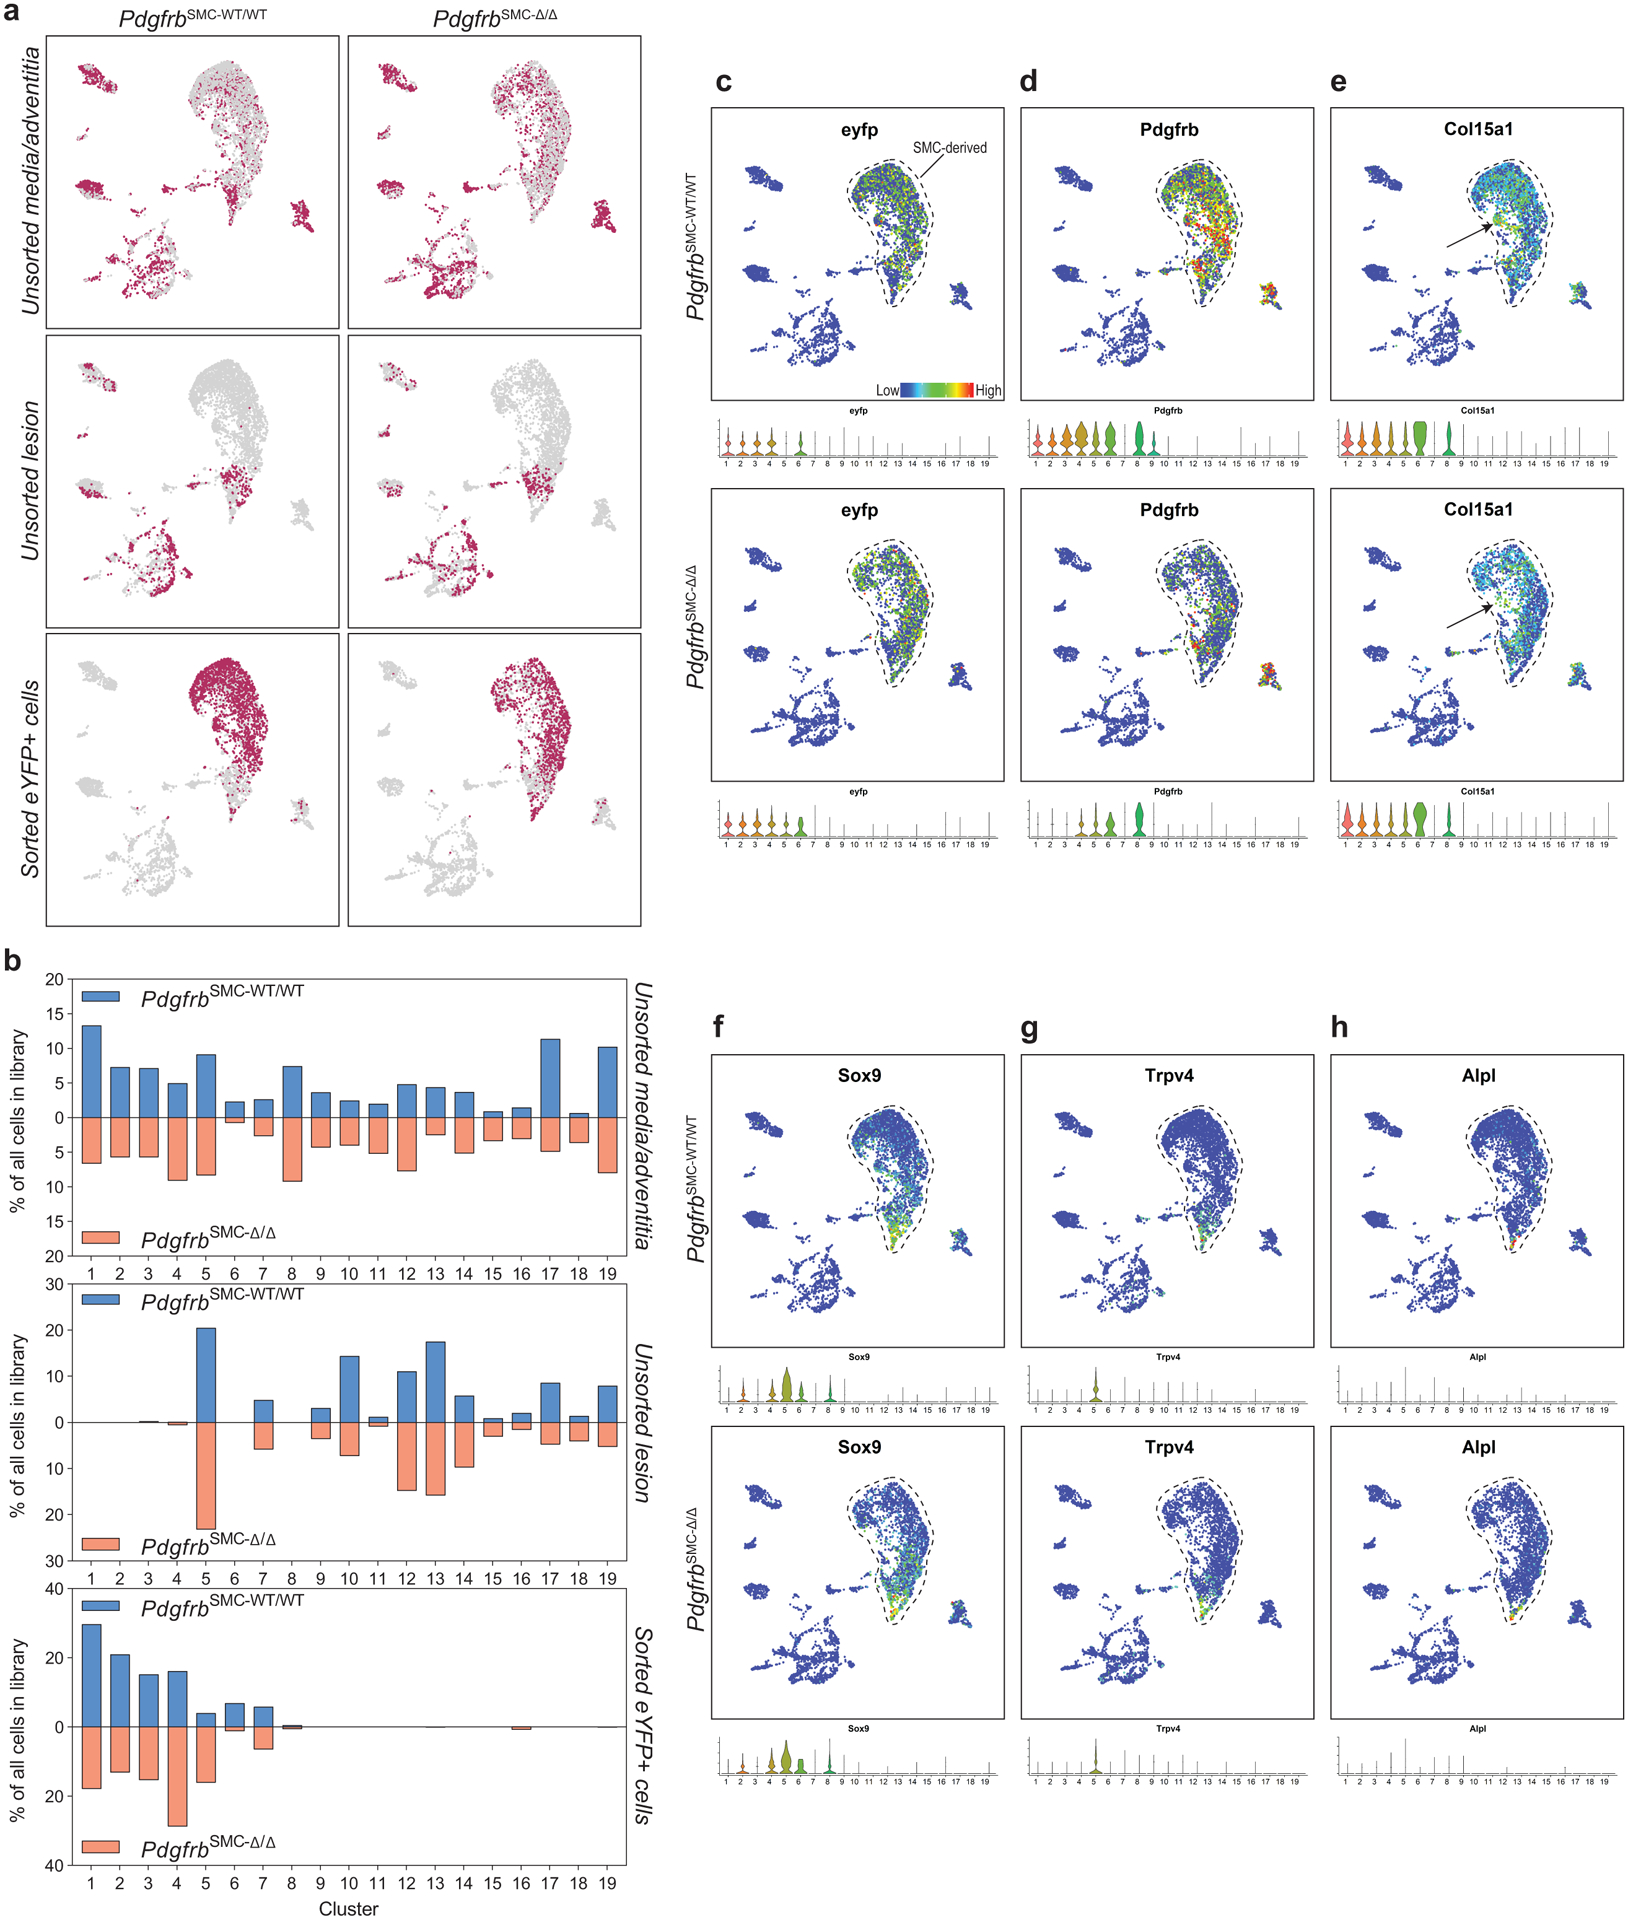
A)UMAP representations of each scRNA-seq library from cells isolated from BCAs from PdgfrbSMC-WT/WT and PdgfrbSMC-Δ/Δ mice fed 18 weeks of WD. (B) Percentage of cells in each cluster from each respective group described in A, unsorted media and underlying adventitia cells (left), unsorted lesion cells (middle), and eYFP+ sorted cells from media and underlying adventitia cells (right). (C-H) UMAP representations of expression levels of target genes from scRNA-seq analysis of cells isolated from BCAs of mice fed 18 weeks of WD (top). Violin plots showing expression of each target gene by cluster (bottom). (C) Demonstrates presence of eYFP transgene, identifying the SMC-derived cell populations. (D) Demonstrates loss of Pdgfrb gene expression in PdgfrbSMC-Δ/Δ mice only in SMC-derived cells. (E) Col15a1 gene expression is highly enriched and specific for cluster 6, which is reduced in the PdgfrbSMC-Δ/Δ mice. (F-H) Osteochondrogenic genes represented in SMC clusters.
Extended Data Fig. 5. Analysis of BCA lesions from gain of function mutant (m) PCSK9-AAV8 and Ldlr−/− models of murine atherosclerosis.
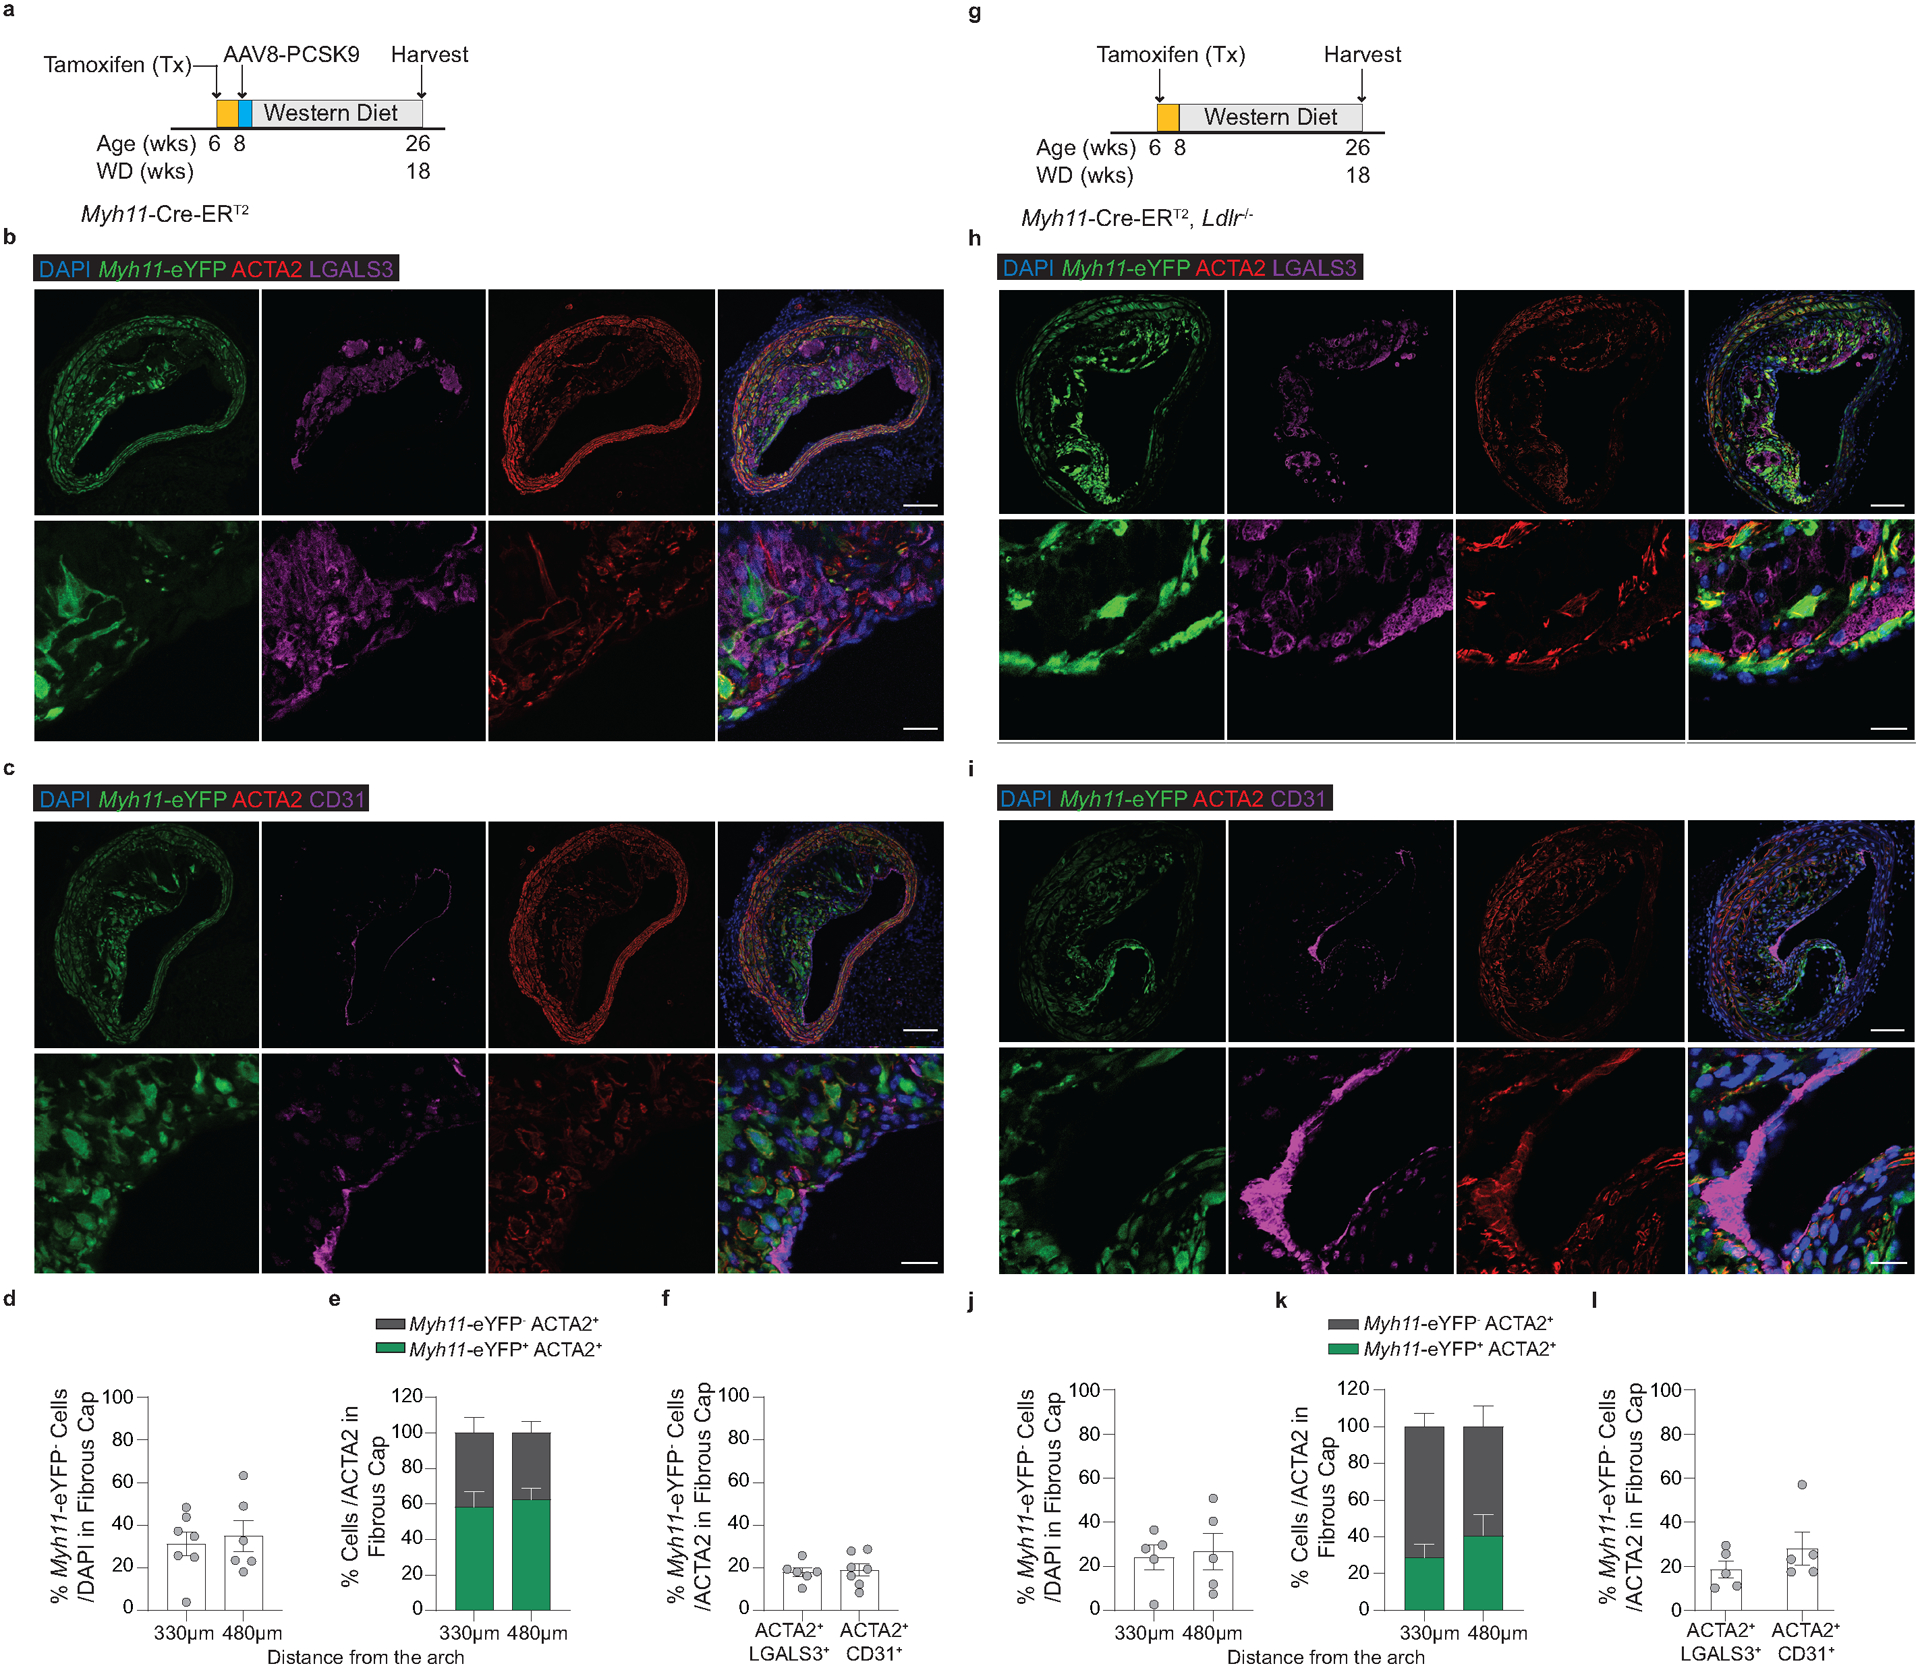
(A) Schematic of experimental design for experiments using Myh11-CreERT2/ROSA-STOPFL/FL-eYFP mice infected once with mPCSK9-AAV8 (Myh11-CreERT2 mPCSK9). Representative images depicting (B) EndoMT (eYFP− ACTA2+ CD31+ /ACTA2+) and (C) MMT (eYFP− ACTA2+ LGALS3+ /ACTA2+). (D) Quantification of Myh11-eYFP+ cells in the 30μm fibrous cap area. (E) Quantification of the percentage of ACTA2+ cells derived from SMC (Myh11-eYFP+ ACTA2+) and from non-SMC sources (Myh11-eYFP−ACTA2+) in Myh11-CreERT2 mPCSK9 mice. (F) Quantification of MMT and EndoMT from (B & C). (G) Schematic of Ldlr−/− Myh11-CreERT2/ROSA-STOPFL/FL-eYFP (Myh11-CreERT2 Ldlr−/−) experimental design. Representative images depicting (H) EndoMT (Myh11-eYFP− ACTA2+ CD31+ /ACTA2+) and (I) MMT (Myh11-eYFP− ACTA2+ LGALS3+ /ACTA2+). (J) Quantification of Myh11-eYFP+ cells in the 30μm fibrous cap area. (K) Quantification of the percentage of ACTA2+ cells derived from SMC (Myh11-eYFP+ ACTA2+) and from non-SMC sources (Myh11-eYFP− ACTA2+) in Myh11-CreERT2 Ldlr−/− mice. (L) Quantification of MMT and EndoMT from (H) & (I). Scale bar: 100μm (B, C, H, I top) or 20μm (B, C, H, I bottom). Biologically independent animals are indicated as individual dots in (D, F, J, L), (E) n = 7, 6 (WT and KO: 330, 480μm), (K) n=5 (WT and KO), error bars represent mean ± SEM.
Extended Data Fig. 6. Generation and validation of EC-lineage tracing mice and EC-specific deletion of Il1r1.
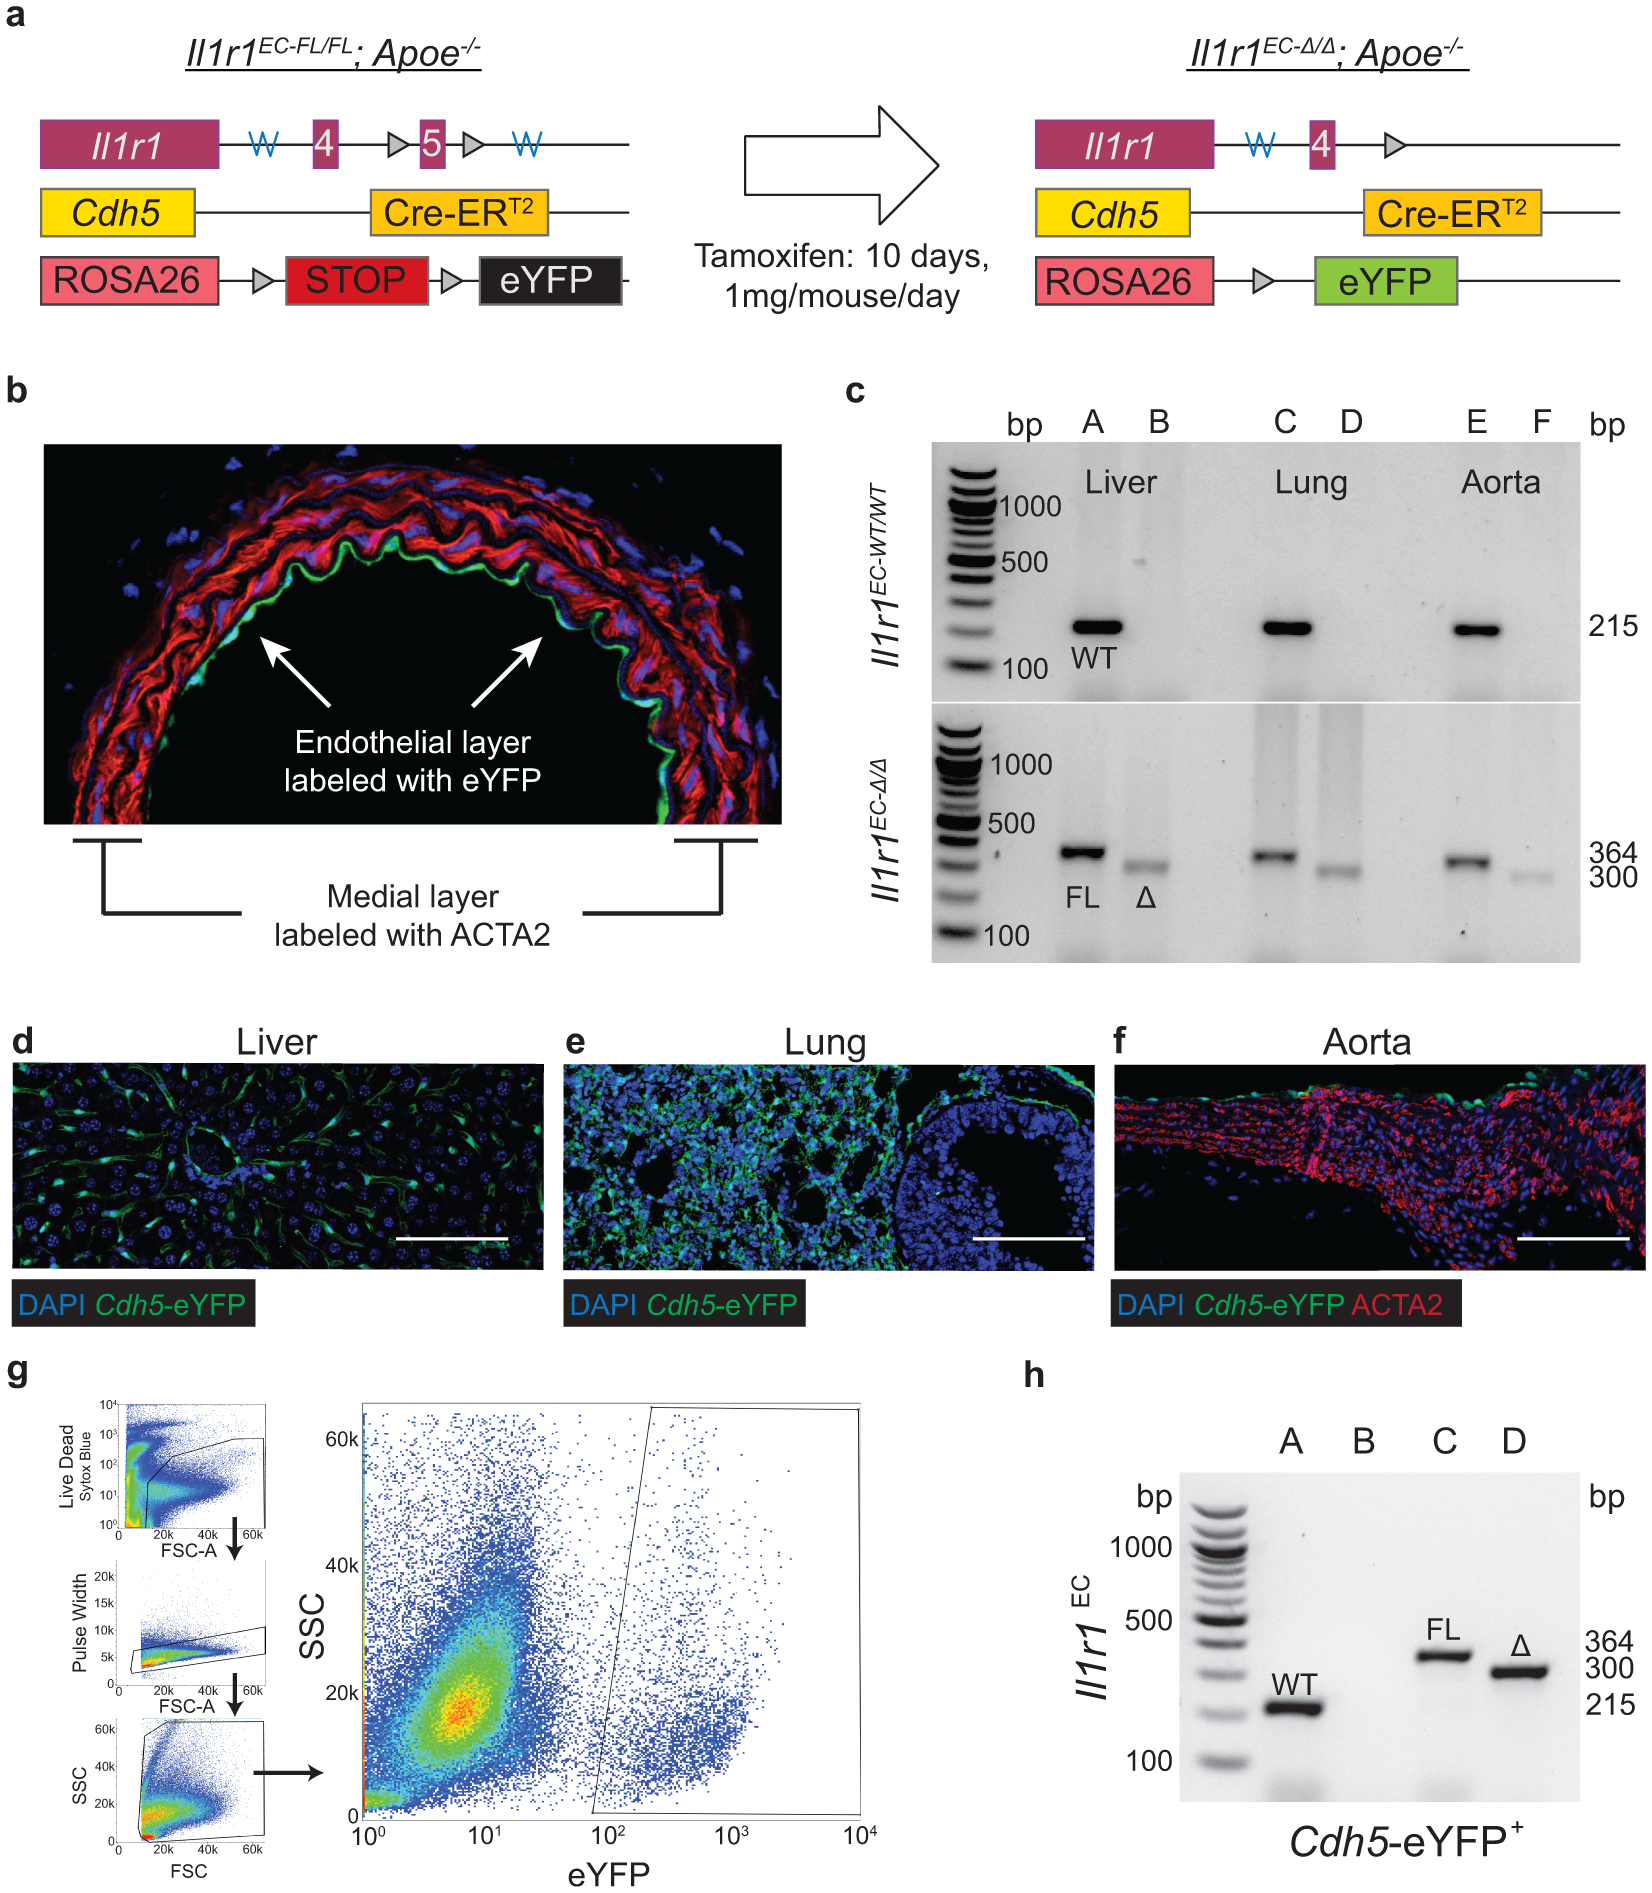
(A) Cdh5-CreERT2/ROSA-STOPFL/FL-eYFP/Apoe−/− (Cdh5-CreERT2) mice were generated to lineage trace EC and their progeny within the BCA. Mice were then crossed to an Il1r1-Flox mouse to generate Il1r1EC-fl/fl and -WT/WT animals. Heterozygote animals were bred (Il1r1Fl/WT; Cdh5-CreERT2/ROSA-STOPFL/FL-eYFP/Apoe−/−) to generate littermate FL/FL and WT/WT controls, which were used in all experiments. (B) Image denoting the endothelial monolayer with Cdh5-eYFP+ staining only in this layer. (C) Validation of genetic deletion of Il1r1 in organs using isolated DNA. Lanes A, C, E contain the FL and WT genotyping reactions while lanes B, D, F contain the excision reaction. Representative images of Cdh5-eYFP+ staining in (D) Liver, (E) Lung, and (F) Aorta. (G) Gating strategy for isolation of Cdh5-eYFP+ endothelial cells. (H) Genotyping and recombination analysis of Cdh5-eYFP+ cells sorted from Il1r1EC-WT/WT (lanes A, B) and Il1r1EC-FL/FL (lanes C, D) mice. Lanes A, C contain FL and WT genotyping reaction while B, D contain the excision reaction. Scale bar: 100μm (D, E, F).
Extended Data Fig. 7. Lethal radiation and BMT significantly increases the percentage of EC in the lesion and fibrous cap.
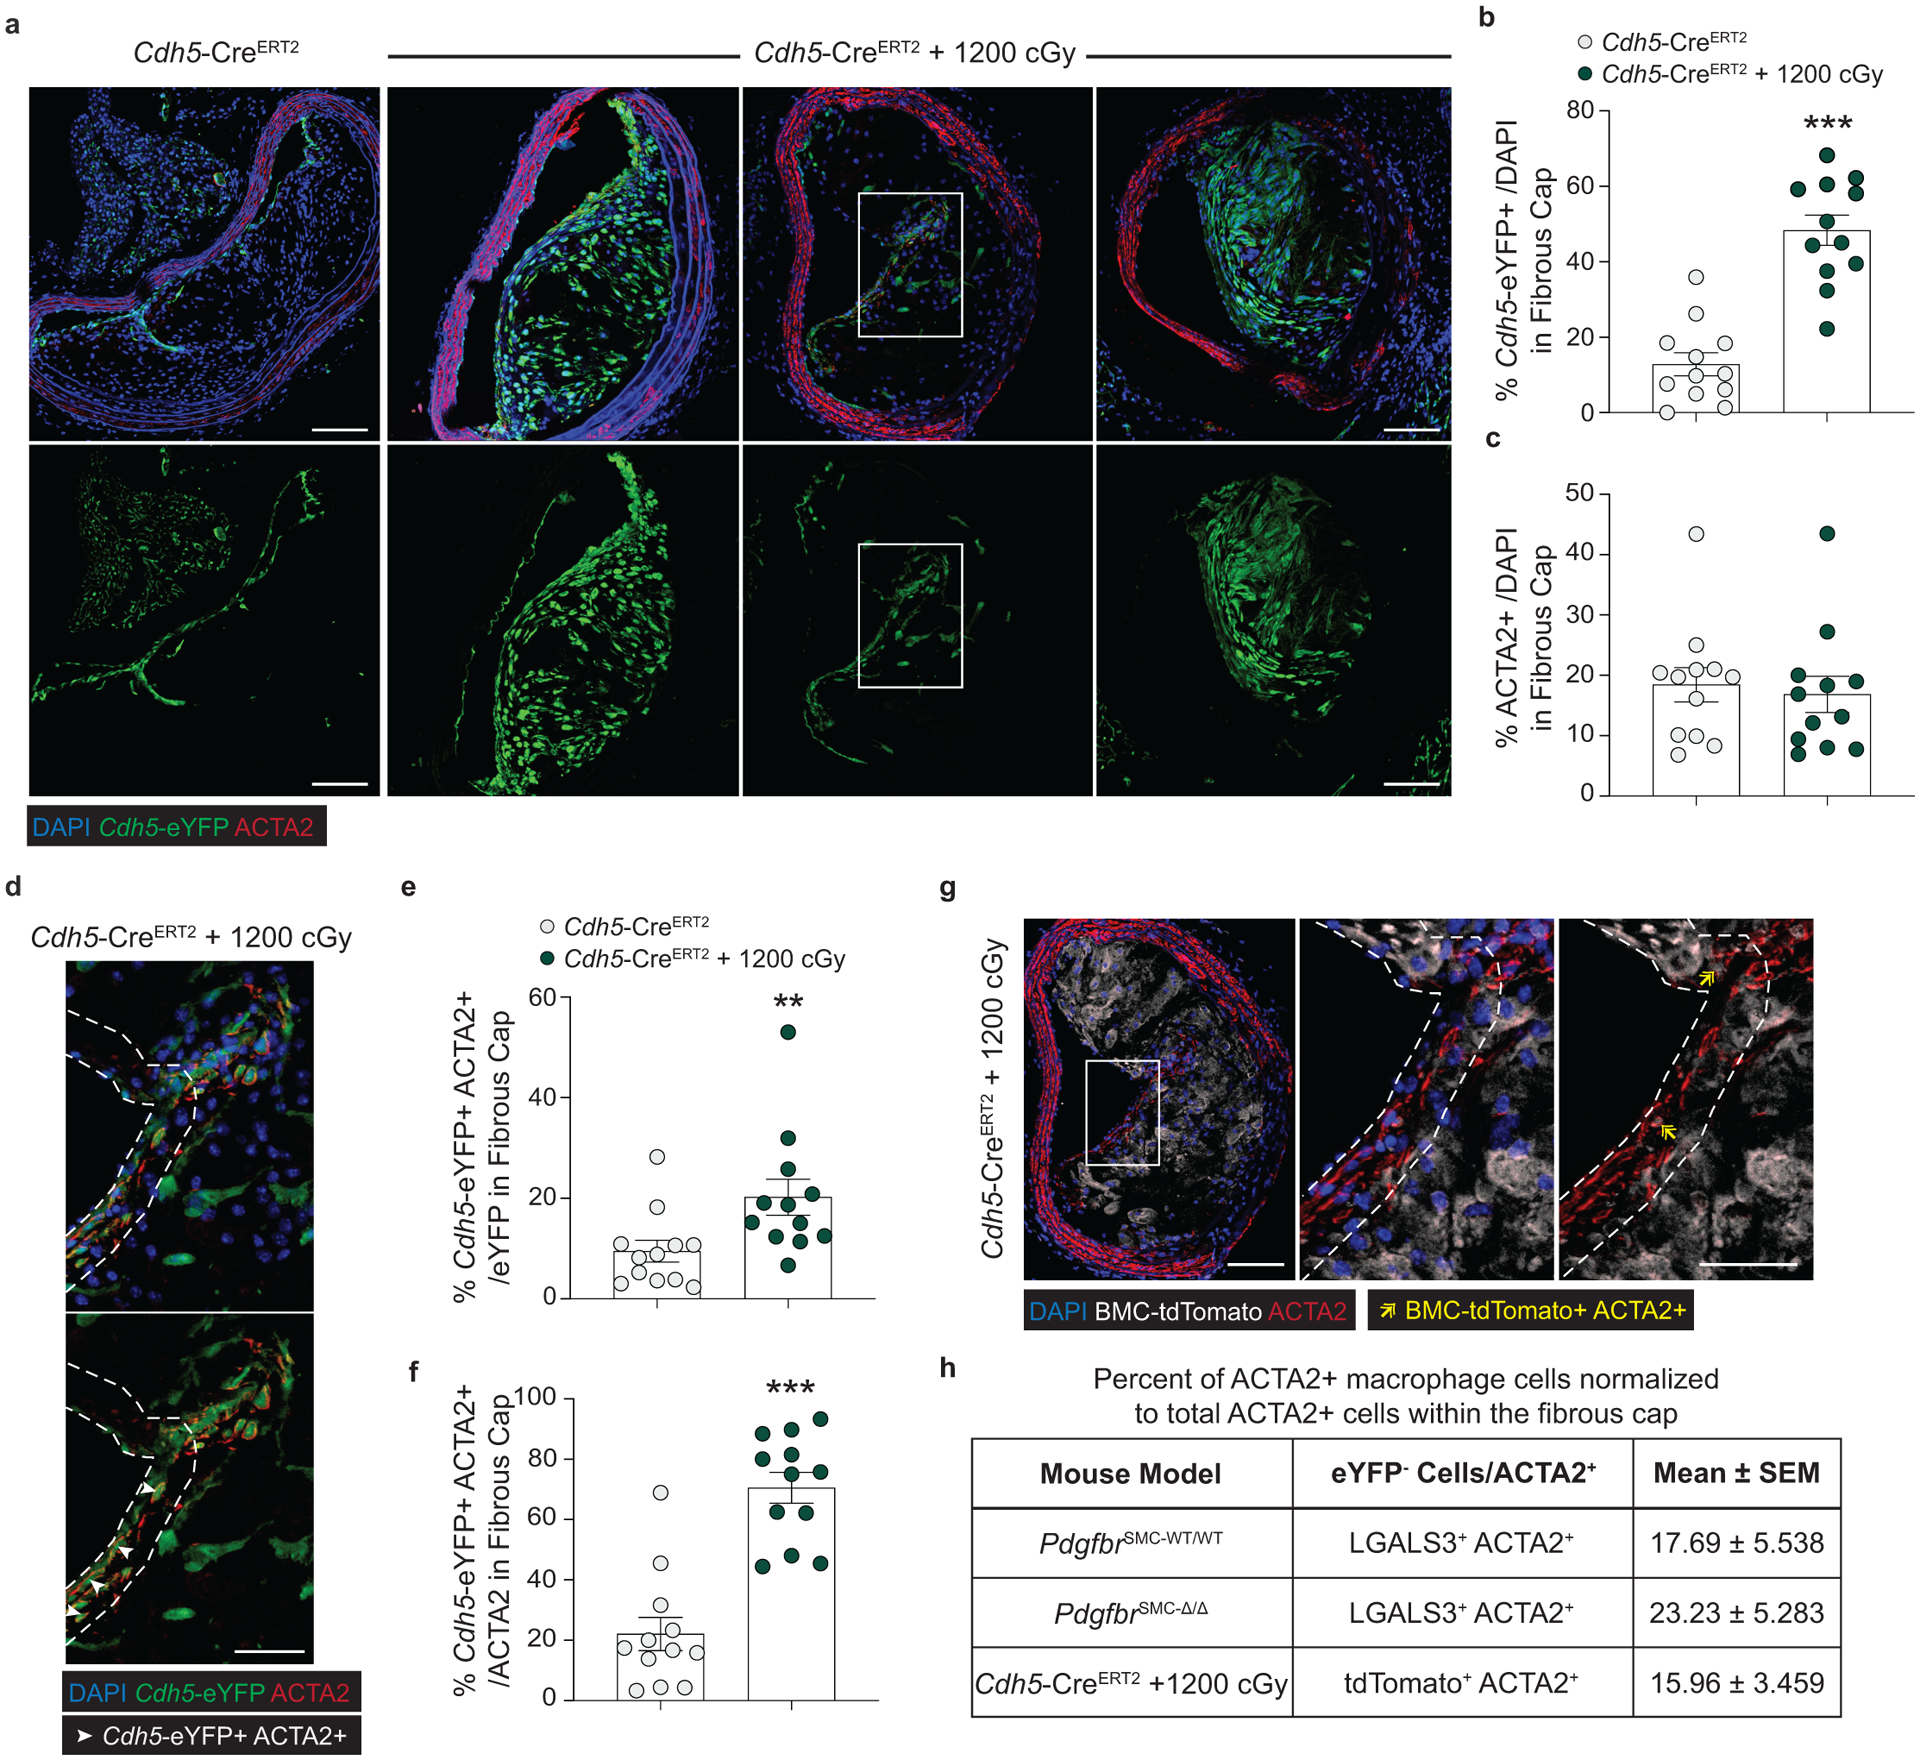
((A) Representative images of BCA lesions in Cdh5-CreERT2 mice fed 18 weeks of WD with or without 1200cGy of radiation, which is known to ablate SMC accumulation within the lesion and fibrous cap. (B) Quantification of Cdh5-eYFP+ cells in the fibrous cap showed significantly increased EC-derived cells after radiation. ***p-values < 0.0001. (C) The increased percentage of EC-derived cells within the fibrous cap was not associated with changes in overall ACTA2+ cells within the fibrous cap. (D) Zoom in of highlighted area in (A) showing EC-derived cells express ACTA2. Single cell breakdown and quantification of Cdh5-eYFP+ ACTA2+ cells per total Cdh5-eYFP+ (E) or per total ACTA2+ cells, **p-value = 0.0023, (F) within the fibrous cap, ***p-values < 0.0001. (G) Representative image of bone marrow cells (BMC) expressing ACTA2 within the fibrous cap of Cdh5-CreERT2 mice after radiation. (H) Quantification and comparison of MMT by co-incident staining of ACTA2 and marker protein staining for LGALS3 or for the BMC lineage tag, tdTomato. Scale bar: 100μm (whole lesion) or 50μm (zoom). Graphs were analyzed using two-tailed Mann-Whitney U test, error bars represent mean ± SEM.
Extended Data Fig. 8. A subset of ACTA2+ cells in human coronary lesions are derived from a non-SMC source.
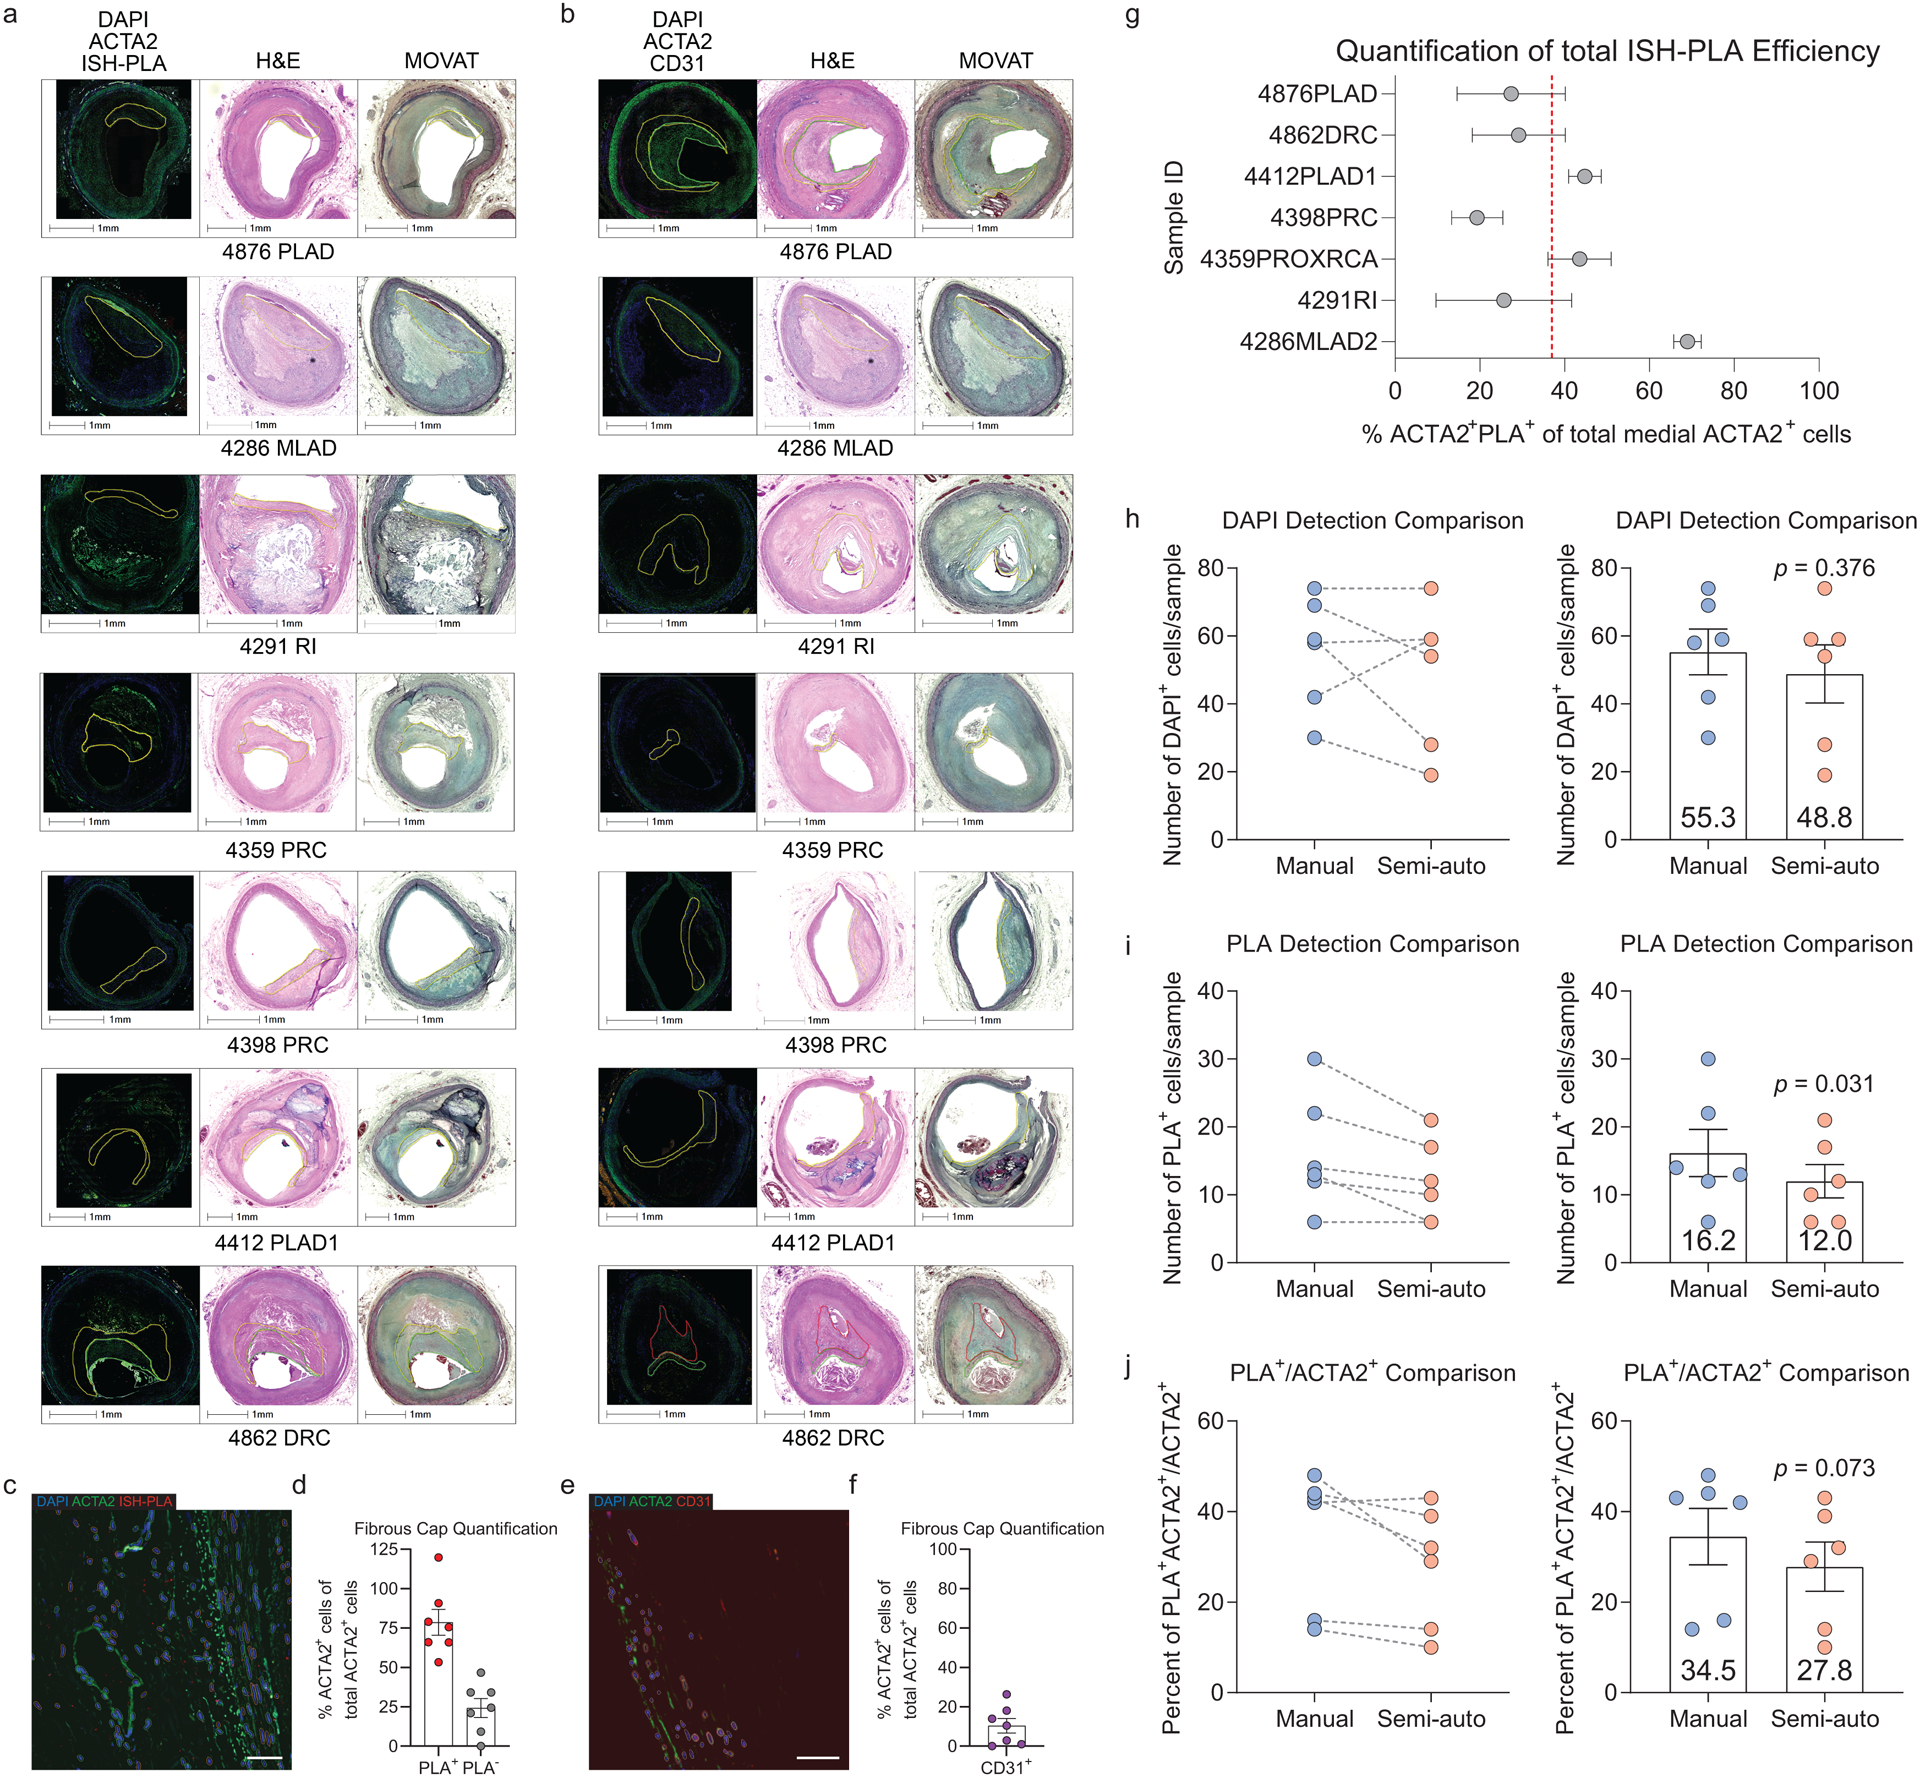
Representative images of stable human lesions of (A) ISH-PLA staining or (B) CD31 staining, showing the fibrous cap outlined using serially stained H&E and MOVAT slides. (C) Analysis following ISH-PLA, where PLA dots correspond to cells with H3K4me2 on the MYH11 promoter. (D) Graph representing the portion of ACTA2+ cells that are SMC (ACTA2+ PLA+) or non-SMC derived in human lesions (ACTA2+ PLA−). (E) Analysis of the percent of ACTA2+ cells that are CD31+ within the fibrous cap of human coronary lesions. (F) Graph representing a portion of ACTA2+ cells that co-stain with CD31 within the fibrous cap. Data were obtained by assessing co-localization of DAPI, ACTA2, and PLA or DAPI, ACTA2, and CD31 (see Methods). (G) Total calculated efficiency of ISH-PLA positivity (ACTA2+ ISHPLA+) calculated based on total # of ACTA2+ cells within media, with the assumption that 100% of ACTA2+ cells in the media will be PLA+. Each Sample ID is a distinct patient and this total efficiency includes error introduced by the semi-automated quantification pipeline, calculated separately in (H-J). Comparison of single-cell counting by manual human input and the semi-automated pipeline of DAPI (H), PLA+ (I), and PLA+ ACTA2+ /ACTA2+ (J) using 6 distinct subsections of human coronary artery vessels, that were chosen to keep the manual counter blinded. Statistical analysis of Manual versus semi-auto detection comparison was performed with paired two-tailed t-tests. Individual patients are indicated as individual dots in (D, F-J). Scale bar: 1000μm (A, B) or 100μm (C, E). Graphs shown as mean ± SEM.
Extended Data Fig. 9. Bioenergetic and transcriptional changes of SMC in response to PDGF and inhibitors of pyruvate metabolism.
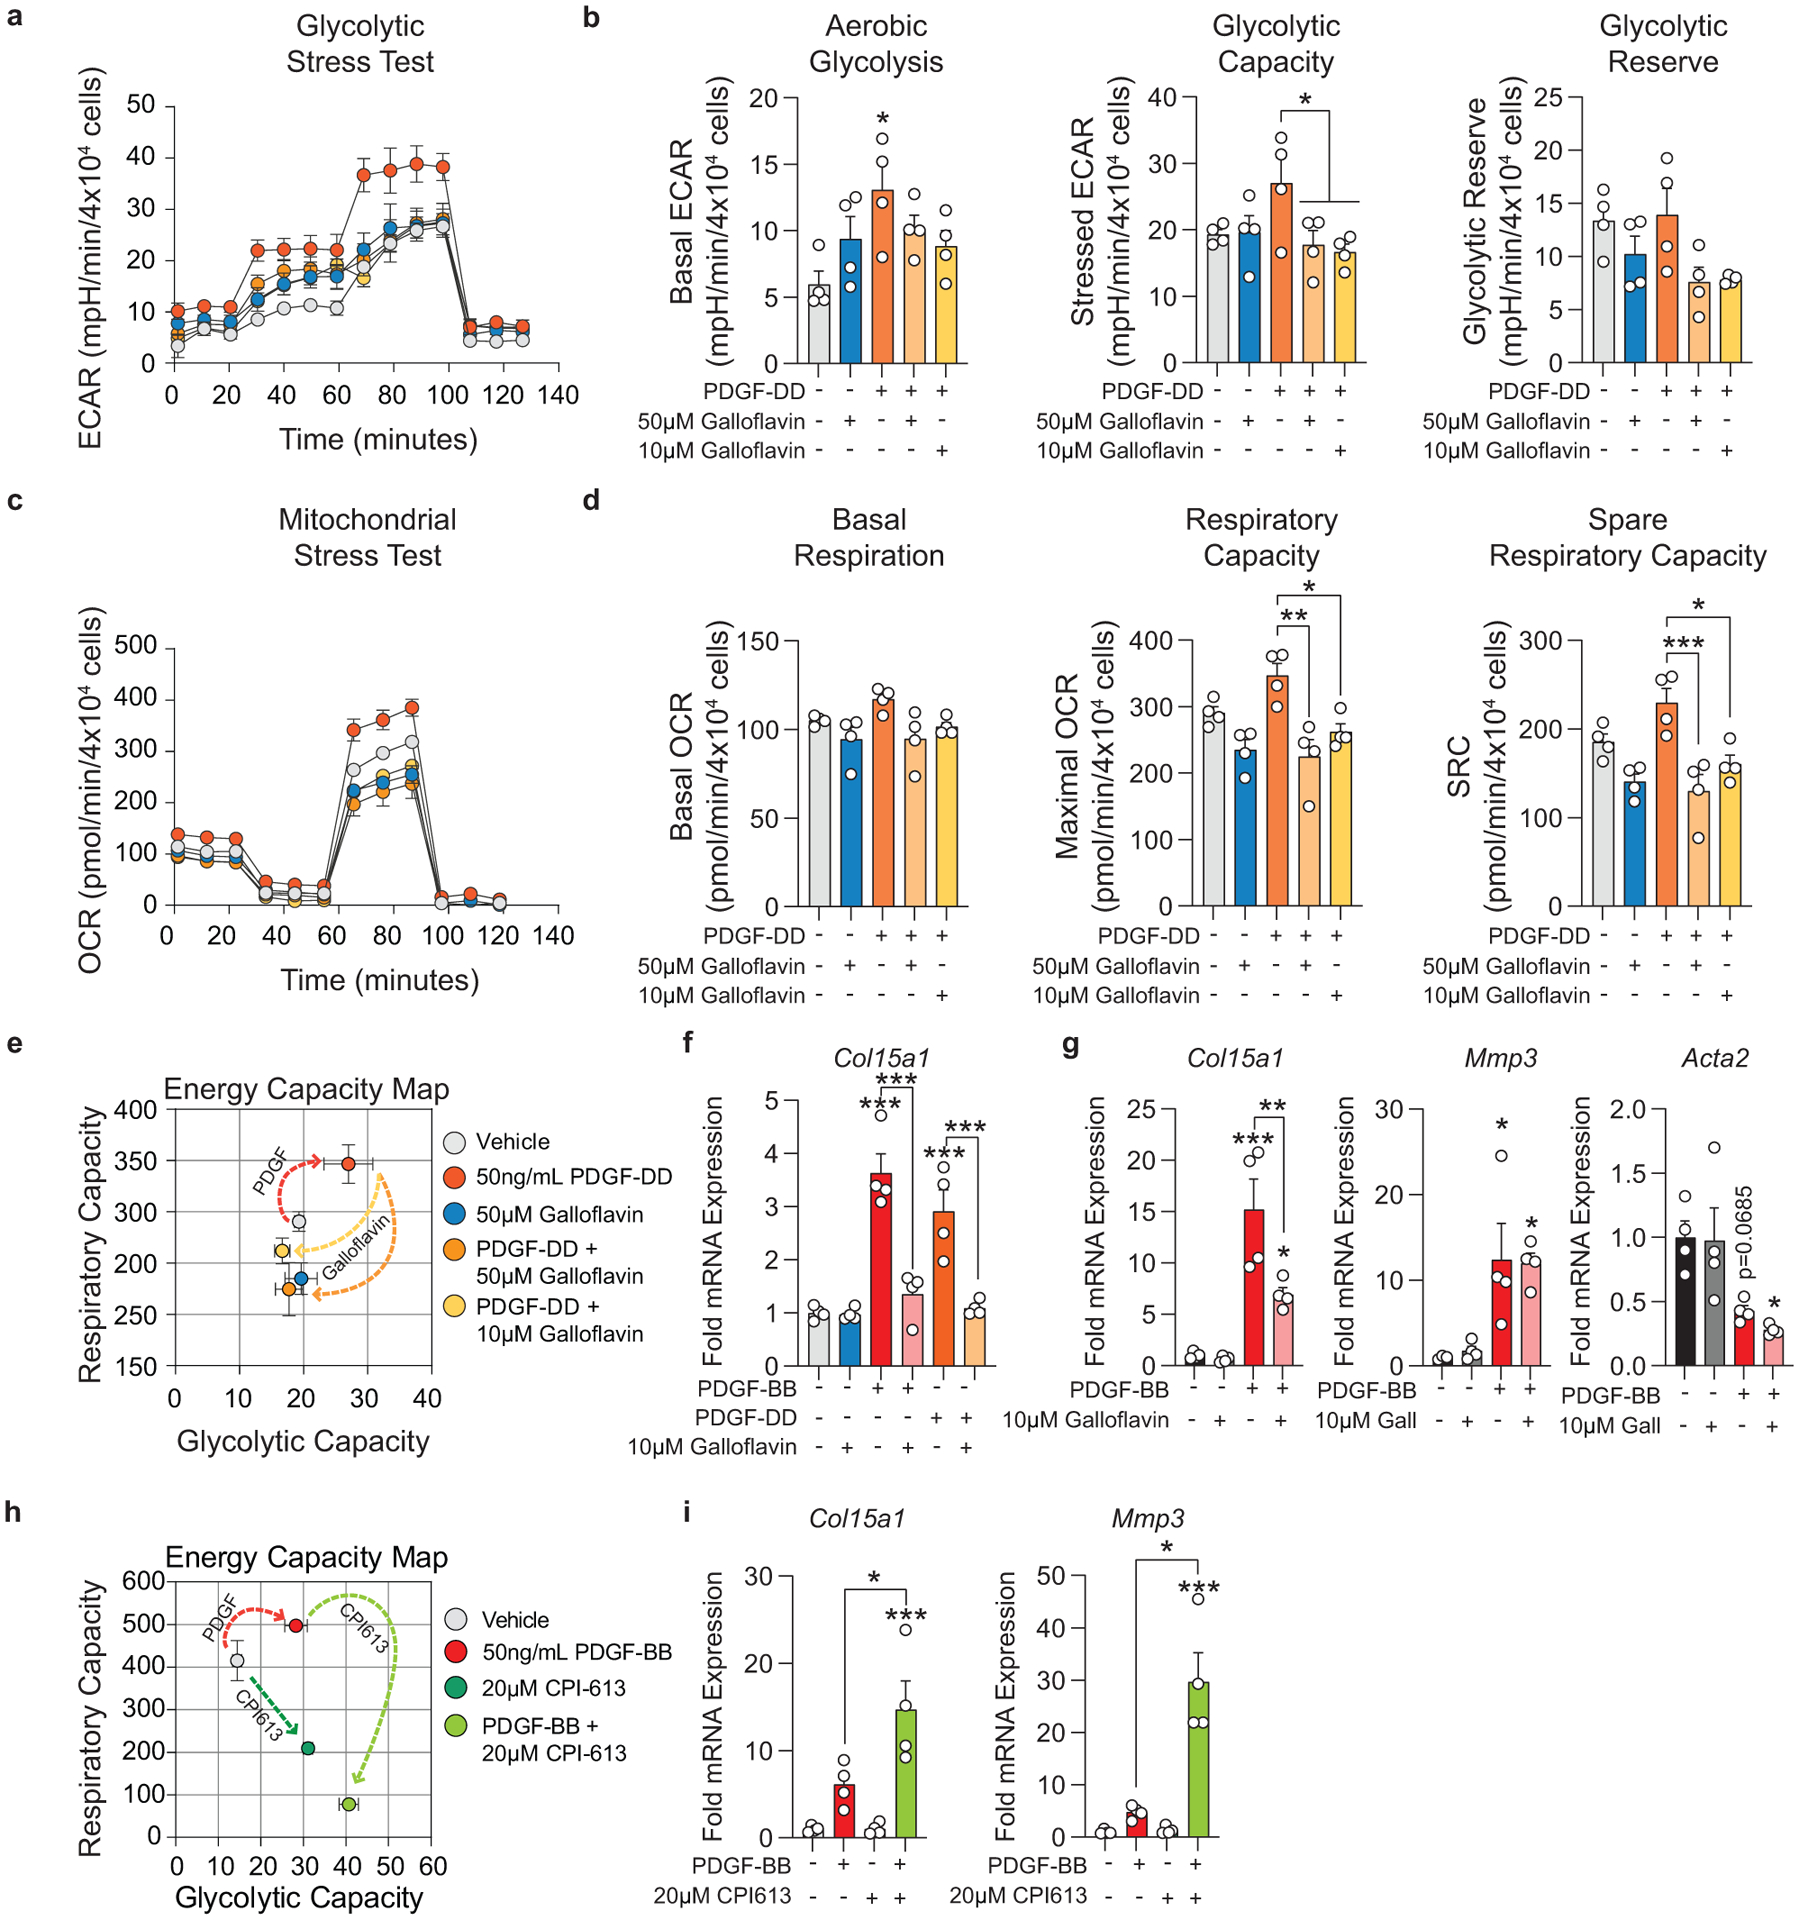
Murine SMC were serum starved for 24–72 hours and then treated with Vehicle, PDGF-BB or -DD (50ng/mL), and/or Galloflavin (10μM or 50μM) or CPI613 (20μM). (A) Glycolytic stress test (GST) measuring extracellular acidification rate (ECAR) of treated SMC, representing glycolytic ability. (B) ECAR was measured initially in the absence of glucose, after injection of 20mM D-glucose (basal glycolysis), 1μM oligomycin (glycolytic capacity), and 80mM 2-deoxy-D-glucose (non-glycolytic; used for normalization). Glycolytic reserve was determined by subtracting post-glucose ECAR from post-oligomycin ECAR. [Aerobic glycolysis p = 0.0206; Glycolytic capacity p = 0.0441 and p = 0.0234]. (C) Mitochondrial stress test (MST) measuring the oxygen consumption rate (OCR) of cells, representing mitochondrial respiratory ability. (D) OCR was measured initially (basal respiration), and after injection of 1μM oligomycin, 2μM BAM15 (respiratory capacity), and 10μM antimycin A & 1μM rotenone (non-mitochondrial; used for normalization). Spare respiratory capacity was determined by subtracting the initial OCR from the post-BAM15 OCR. [Respiratory capacity p = 0.0013 and p = 0.0248; Spare respiratory capacity p = 0.0007 and p = 0.0165]. (E) Energy capacity map representing the bioenergetic potential of SMC (x-axis, maximal ECAR; y-axis, maximal OCR). (F) mRNA expression of Col15a1, measured by qPCR in SMC treated for 24 hours. [Vehicle p < 0.0001, PDGF-BB p < 0.0001, PDGF-DD p = 0.0004, and Galloflavin 10μM p = 0.0007]. (G) mRNA expression of Col15a1, Mmp3, and Acta2, measured by qPCR in SMC treated with Vehicle, PDGF-BB, and/or Galloflavin 10μM for 24 hours [Col15a1 p <0.0001, p = 0.003, and p = 0.0457; Mmp3 p = 0.0354 and p = 0.0437; Acta2 p = 0.0685 and p = 0.0192]. (H) Energy capacity map representing the bioenergetic potential of SMC treated with Vehicle, PDGF-BB, and/or CPI613 for 24 hours. (I) mRNA expression of Col15a1, and Mmp3, measured by qPCR. [Col15a1 p = 0.0226 and p = 0.0007; Mmp3 p = 0.0002 and p < 0.0001]. Graphs were analyzed using one-way ANOVA with Tukey’s correction for post-hoc analysis, error bars represent mean ± SEM.
Extended Data Fig. 10. Cultured SMC stimulated to myofibroblast-like state with PDGF and TGFβ, require aerobic glycolysis to maintain myofibroblast-associated gene expression.
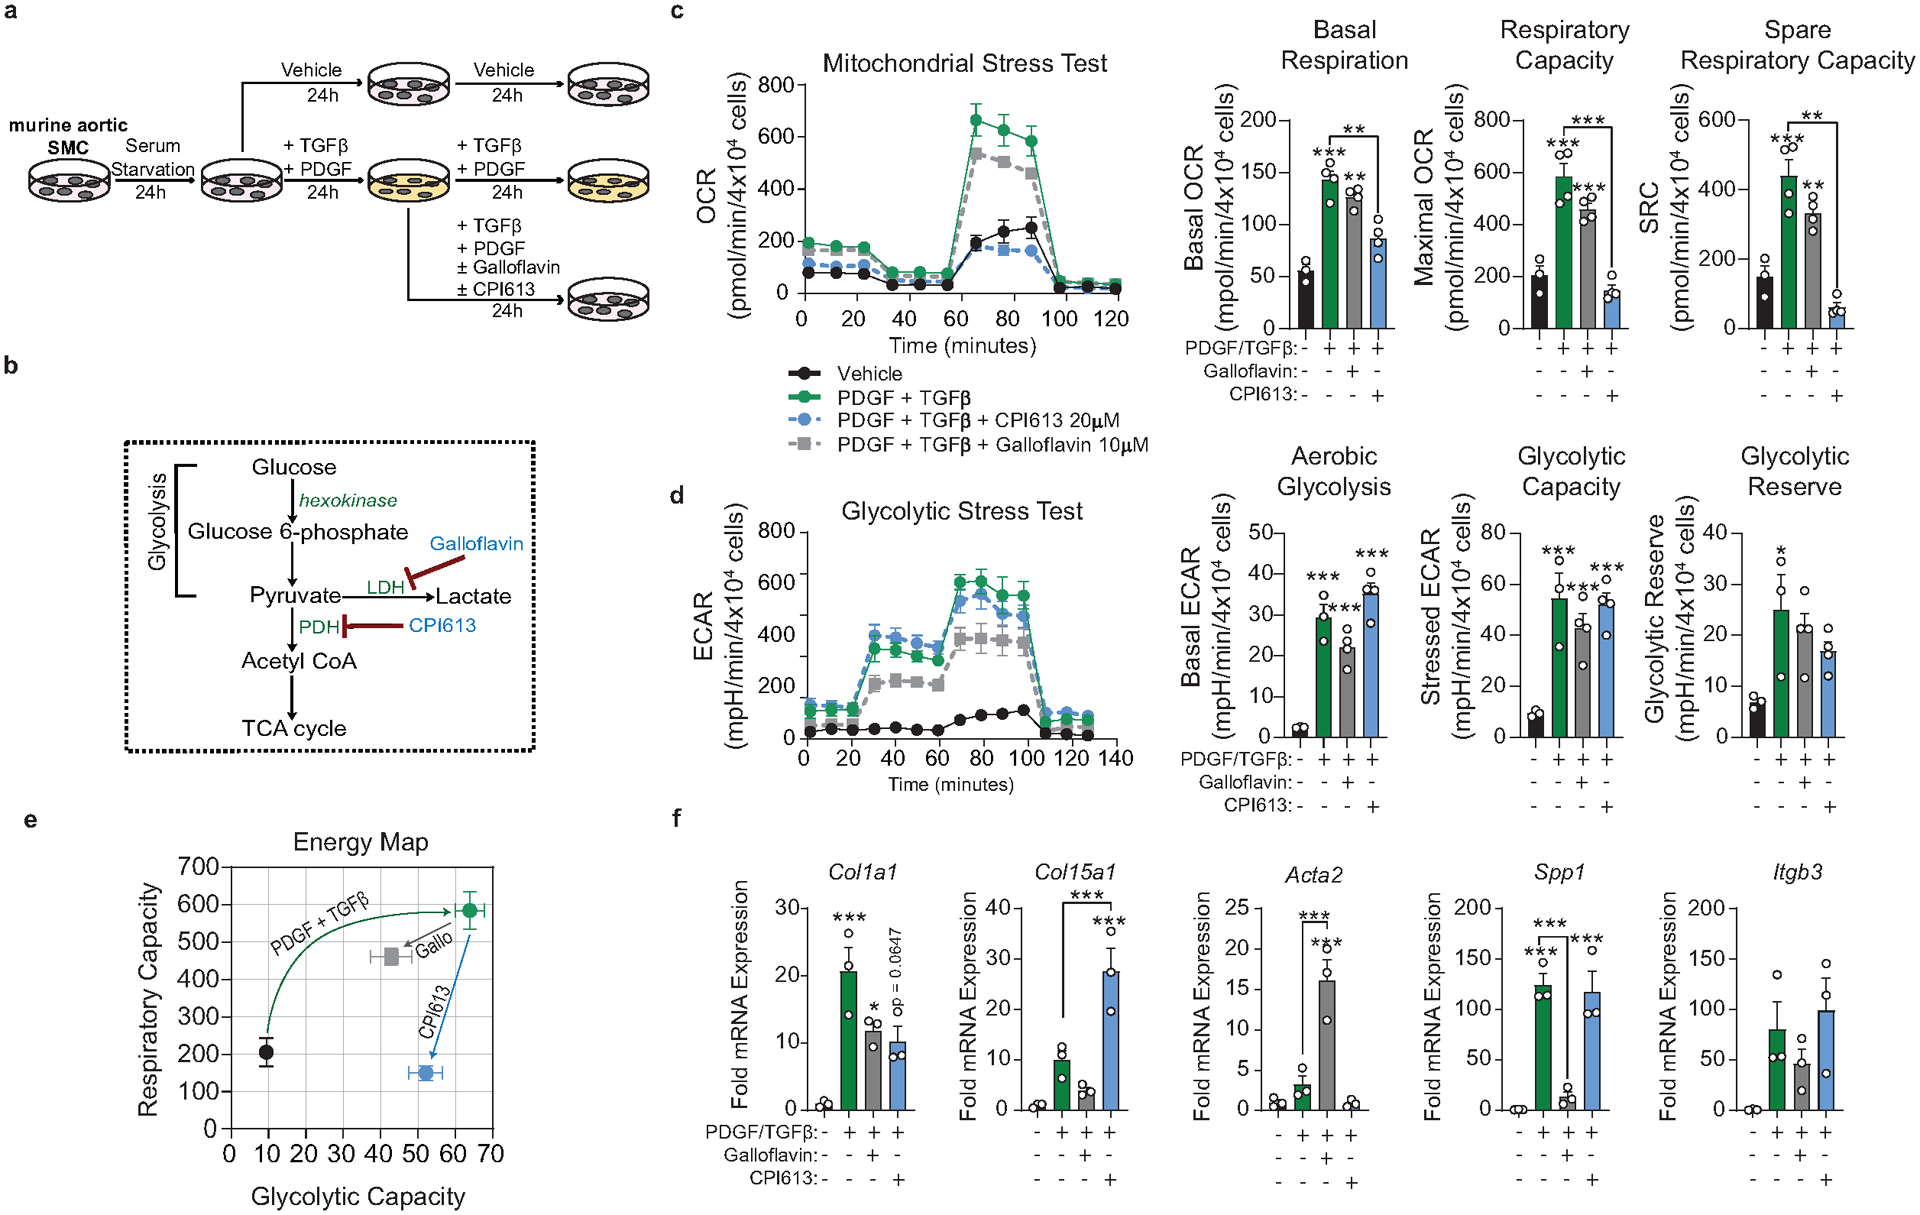
A) Murine aortic SMC were serum starved for 24–72 hours. After serum starvation, SMCs were treated with vehicle control or PDGF-DD (10ng/mL) and TGFβ1 (10ng/mL), Galloflavin (10μM), and/or CPI613 (20μM) for 24 hours. Next, cells were treated a second time, with PDGF-DD (10ng/mL) and TGFβ1 (10ng/mL), this time in combination with Galloflavin (10μM) or CPI613 (20μM) for another 24 hours. (B) Pyruvate metabolism pathway map, highlighting lactate dehydrogenase (LDH) as the target of Galloflavin and pyruvate dehydrogenase (PDH) as the target of CPI613. (C) Mitochondrial stress test (MST) measuring the oxygen consumption rate (OCR). OCR was measured initially (basal respiration), and after injection of 1μM oligomycin, 2μM BAM15 (respiratory capacity), and 10μM antimycin A & 1μM rotenone (non-mitochondrial; used for normalization). Spare respiratory capacity was determined by subtracting the initial OCR from the post-BAM15 OCR. [Basal respiration p = 0.0003, p = 0.009, and p = 0.0026; Respiratory Capacity p < 0.0001, p < 0.0001, and p = 0.0008] (D) Glycolytic stress test (GST) measuring extracellular acidification rate (ECAR). ECAR was measured initially in the absence of glucose, after injection of 20mM D-glucose (basal glycolysis), 1μM oligomycin (glycolytic capacity), and 80mM 2-deoxy-D-glucose (non-glycolytic; used for normalization). [Glycolysis p < 0.0001, p = 0.0002, and p < 0.0001; Glycolytic Capacity p = 0.0006, p = 0.0052, and p = 0.0006]. (E) Energy capacity map representing the bioenergetic potential of SMC (x-axis, maximal ECAR; y-axis, maximal OCR). (F) mRNA expression of ECM and ECM-interacting genes as measured by qPCR. [Col1a1 p = 0.0009, p = 0.0310, p = 0.0647; Col15a1 p = 0.0049 and p = 0.0003; Acta2 p = 0.0009 and p = 0.0003; Spp1 p = 0.0004, p = 0.0008, and p = 0.0006]. Graphs were analyzed using one-way ANOVA with Tukey’s correction for post-hoc analysis with n≥ 3, error bars represent mean ± SEM.
Supplementary Material
Acknowledgements:
Authors acknowledge R. Tripathi for her help isolating and maintaining the lineage-tagged murine SMC line. W. Britt Evans for help in image preprocessing for the automated counting pipeline. R. Adams and R. Klein (MPI) for providing the PdgfrbFL/FL mouse and R. Adams for providing the Cdh5-CreERT2 mouse (MPI). E Pinteaux (University of Manchester) for generating and sharing the Il1r1FL/FL mouse and S. Francis (University of Sheffield) for her advice on the in vivo murine endothelial cell experiments. Myh11-CreERT2 mice are available from Jackson (#019079). V. Newman Albert for aid using Adobe Illustrator. Parts of this work were performed with the assistance of University of Virginia Core Facilities, including the Flow Cytometry Facility, Advanced Microscopy Facility, Genome Technology and Analysis Core, and Bioinformatics Core. This work was supported by NIH R01 grants HL132904, HL136314 and HL141425, as well as a Leducq Fondation Transatlantic Network Grant to GKO. AACN was supported by the Basic and Translational Cardiovascular Training Grant 5 T32 HL 007284-41. VS was supported by the Basic and Translational Cardiovascular Training Grant 5 T32 HL007284-43. RAB was supported by NIH Fellowship F30 HL 136188-04 and the Basic and Translational Cardiovascular Training Grant 5 T32 HL 007284-40. MSR was supported by a Small Research and Travel Grant, Ingrassia Family Echols Scholars Research Grant, and Harrison Undergraduate Research Award.
Footnotes
Competing Interest Statement:
AF declares one competing interest with Amgen Inc. All other authors declare no competing interests.
References:
- 1.Virmani Renu, Kolodgie Frank D., Burke Allen P., Farb Andrew & Schwartz Stephen M. Lessons From Sudden Coronary Death. Arteriosclerosis, Thrombosis, and Vascular Biology 20, 1262–1275 (2000). [DOI] [PubMed] [Google Scholar]
- 2.Davies MJ, Richardson PD, Woolf N, Katz DR & Mann J Risk of thrombosis in human atherosclerotic plaques: role of extracellular lipid, macrophage, and smooth muscle cell content. Heart 69, 377–381 (1993). [DOI] [PMC free article] [PubMed] [Google Scholar]
- 3.Libby P, Ridker PM & Hansson GK Progress and challenges in translating the biology of atherosclerosis. Nature 473, 317–325 (2011). [DOI] [PubMed] [Google Scholar]
- 4.Feil S et al. Transdifferentiation of vascular smooth muscle cells to macrophage-like cells during atherogenesis. Circ. Res 115, 662–667 (2014). [DOI] [PubMed] [Google Scholar]
- 5.Shankman LS et al. KLF4-dependent phenotypic modulation of smooth muscle cells has a key role in atherosclerotic plaque pathogenesis. Nature Medicine 21, 628–637 (2015). [DOI] [PMC free article] [PubMed] [Google Scholar]
- 6.Chen P-Y et al. Endothelial-to-mesenchymal transition drives atherosclerosis progression. J Clin Invest 125, 4514–4528 (2015). [DOI] [PMC free article] [PubMed] [Google Scholar]
- 7.Evrard SM et al. Endothelial to mesenchymal transition is common in atherosclerotic lesions and is associated with plaque instability. Nature Communications 7, 11853 (2016). [DOI] [PMC free article] [PubMed] [Google Scholar]
- 8.Caplice NM et al. Smooth muscle cells in human coronary atherosclerosis can originate from cells administered at marrow transplantation. Proc Natl Acad Sci U S A 100, 4754–4759 (2003). [DOI] [PMC free article] [PubMed] [Google Scholar]
- 9.Albarrán-Juárez J, Kaur H, Grimm M, Offermanns S & Wettschureck N Lineage tracing of cells involved in atherosclerosis. Atherosclerosis 251, 445–453 (2016). [DOI] [PubMed] [Google Scholar]
- 10.Gomez D et al. Interleukin-1β has atheroprotective effects in advanced atherosclerotic lesions of mice. Nature Medicine 24, 1418 (2018). [DOI] [PMC free article] [PubMed] [Google Scholar]
- 11.Durgin BG et al. Smooth muscle cell-specific deletion of Col15a1 unexpectedly leads to impaired development of advanced atherosclerotic lesions. American Journal of Physiology-Heart and Circulatory Physiology 312, H943–H958 (2017). [DOI] [PMC free article] [PubMed] [Google Scholar]
- 12.Cherepanova OA et al. Activation of the pluripotency factor OCT4 in smooth muscle cells is atheroprotective. Nature Medicine 22, 657–665 (2016). [DOI] [PMC free article] [PubMed] [Google Scholar]
- 13.Newman AAC et al. Irradiation abolishes smooth muscle investment into vascular lesions in specific vascular beds. JCI Insight 3, (2018). [DOI] [PMC free article] [PubMed] [Google Scholar]
- 14.Betsholtz C Insight into the physiological functions of PDGF through genetic studies in mice. Cytokine & Growth Factor Reviews 15, 215–228 (2004). [DOI] [PubMed] [Google Scholar]
- 15.Hideto Sano et al. Functional Blockade of Platelet-Derived Growth Factor Receptor-β but Not of Receptor-α Prevents Vascular Smooth Muscle Cell Accumulation in Fibrous Cap Lesions in Apolipoprotein E–Deficient Mice. Circulation 103, 2955–2960 (2001). [DOI] [PubMed] [Google Scholar]
- 16.Kozaki K et al. Blockade of Platelet-Derived Growth Factor or Its Receptors Transiently Delays but Does Not Prevent Fibrous Cap Formation in ApoE Null Mice. The American Journal of Pathology 161, 1395–1407 (2002). [DOI] [PMC free article] [PubMed] [Google Scholar]
- 17.Tomas L et al. Altered metabolism distinguishes high-risk from stable carotid atherosclerotic plaques. Eur Heart J 39, 2301–2310 (2018). [DOI] [PMC free article] [PubMed] [Google Scholar]
- 18.Alencar Gabriel F et al. The Stem Cell Pluripotency Genes Klf4 and Oct4 Regulate Complex SMC Phenotypic Changes Critical in Late-Stage Atherosclerotic Lesion Pathogenesis. Circulation 0,. [DOI] [PMC free article] [PubMed] [Google Scholar]
- 19.Wirka RC et al. Atheroprotective roles of smooth muscle cell phenotypic modulation and the TCF21 disease gene as revealed by single-cell analysis. Nature Medicine 1 (2019) doi: 10.1038/s41591-019-0512-5. [DOI] [PMC free article] [PubMed] [Google Scholar]
- 20.Winkels H et al. Atlas of the immune cell repertoire in mouse atherosclerosis defined by single-cell RNA-sequencing and mass cytometry. Circulation research 122, 1675 (2018). [DOI] [PMC free article] [PubMed] [Google Scholar]
- 21.Kadl A et al. Identification of a novel macrophage phenotype that develops in response to atherogenic phospholipids via Nrf2. Circ Res 107, 737–746 (2010). [DOI] [PMC free article] [PubMed] [Google Scholar]
- 22.Serbulea V et al. Macrophage phenotype and bioenergetics are controlled by oxidized phospholipids identified in lean and obese adipose tissue. PNAS 115, E6254–E6263 (2018). [DOI] [PMC free article] [PubMed] [Google Scholar]
- 23.Gomez D & Owens GK Smooth muscle cell phenotypic switching in atherosclerosis. Cardiovasc. Res 95, 156–164 (2012). [DOI] [PMC free article] [PubMed] [Google Scholar]
- 24.Allahverdian S, Pannu PS & Francis GA Contribution of monocyte-derived macrophages and smooth muscle cells to arterial foam cell formation. Cardiovasc Res 95, 165–172 (2012). [DOI] [PubMed] [Google Scholar]
- 25.Gomez D, Shankman LS, Nguyen AT & Owens GK Detection of histone modifications at specific gene loci in single cells in histological sections. Nature Methods 10, 171–177 (2013). [DOI] [PMC free article] [PubMed] [Google Scholar]
- 26.McDonald OG, Wamhoff BR, Hoofnagle MH & Owens GK Control of SRF binding to CArG box chromatin regulates smooth muscle gene expression in vivo. J Clin Invest 116, 36–48 (2006). [DOI] [PMC free article] [PubMed] [Google Scholar]
- 27.McDonald Oliver G & Owens Gary K Programming Smooth Muscle Plasticity With Chromatin Dynamics. Circulation Research 100, 1428–1441 (2007). [DOI] [PubMed] [Google Scholar]
- 28.Carroll M et al. CGP 57148, a tyrosine kinase inhibitor, inhibits the growth of cells expressing BCR-ABL, TEL-ABL, and TEL-PDGFR fusion proteins. Blood 90, 4947–4952 (1997). [PubMed] [Google Scholar]
- 29.Kerkelä R et al. Cardiotoxicity of the cancer therapeutic agent imatinib mesylate. Nature Medicine 12, 908–916 (2006). [DOI] [PubMed] [Google Scholar]
- 30.Sarrazy V et al. Integrins αvβ5 and αvβ3 promote latent TGF-β1 activation by human cardiac fibroblast contraction. Cardiovasc Res 102, 407–417 (2014). [DOI] [PMC free article] [PubMed] [Google Scholar]
- 31.Fiume L et al. Galloflavin prevents the binding of lactate dehydrogenase A to single stranded DNA and inhibits RNA synthesis in cultured cells. Biochemical and Biophysical Research Communications 430, 466–469 (2013). [DOI] [PubMed] [Google Scholar]
- 32.Manerba M et al. Galloflavin (CAS 568-80-9): A Novel Inhibitor of Lactate Dehydrogenase. ChemMedChem 7, 311–317 (2012). [DOI] [PubMed] [Google Scholar]
- 33.Gibson FS, Gupta D, Shorr R & Rodriguez R An Efficient, Economical Synthesis of the Novel Anti-tumor Agent CPI-613. Org. Process Res. Dev 15, 855–857 (2011). [Google Scholar]
- 34.Egawa Y, Saigo C, Kito Y, Moriki T & Takeuchi T Therapeutic potential of CPI-613 for targeting tumorous mitochondrial energy metabolism and inhibiting autophagy in clear cell sarcoma. PLOS ONE 13, e0198940 (2018). [DOI] [PMC free article] [PubMed] [Google Scholar]
- 35.Alistar A et al. Safety and tolerability of the first-in-class agent CPI-613 in combination with modified FOLFIRINOX in patients with metastatic pancreatic cancer: a single-centre, open-label, dose-escalation, phase 1 trial. The Lancet Oncology 18, 770–778 (2017). [DOI] [PMC free article] [PubMed] [Google Scholar]
- 36.Steitz SA et al. Osteopontin Inhibits Mineral Deposition and Promotes Regression of Ectopic Calcification. The American Journal of Pathology 161, 2035–2046 (2002). [DOI] [PMC free article] [PubMed] [Google Scholar]
- 37.Speer MY et al. Inactivation of the Osteopontin Gene Enhances Vascular Calcification of Matrix Gla Protein–deficient Mice: Evidence for Osteopontin as an Inducible Inhibitor of Vascular Calcification In Vivo. Journal of Experimental Medicine 196, 1047–1055 (2002). [DOI] [PMC free article] [PubMed] [Google Scholar]
- 38.Bevilacqua MP, Pober JS, Wheeler ME, Cotran RS & Gimbrone MA Interleukin-1 activation of vascular endothelium. Effects on procoagulant activity and leukocyte adhesion. Am J Pathol 121, 394–403 (1985). [PMC free article] [PubMed] [Google Scholar]
- 39.Maleszewska M et al. IL-1β and TGFβ2 synergistically induce endothelial to mesenchymal transition in an NFκB-dependent manner. Immunobiology 218, 443–454 (2013). [DOI] [PubMed] [Google Scholar]
- 40.Bennett Martin R, Sinha Sanjay & Owens Gary K. Vascular Smooth Muscle Cells in Atherosclerosis. Circulation Research 118, 692–702 (2016). [DOI] [PMC free article] [PubMed] [Google Scholar]
- 41.Levéen P et al. Mice deficient for PDGF B show renal, cardiovascular, and hematological abnormalities. Genes Dev. 8, 1875–1887 (1994). [DOI] [PubMed] [Google Scholar]
- 42.Lindahl P, Johansson BR, Levéen P & Betsholtz C Pericyte Loss and Microaneurysm Formation in PDGF-B-Deficient Mice. Science 277, 242–245 (1997). [DOI] [PubMed] [Google Scholar]
- 43.Wang S et al. TGF-β/Smad3 signalling regulates the transition of bone marrow-derived macrophages into myofibroblasts during tissue fibrosis. Oncotarget 7, 8809–8822 (2015). [DOI] [PMC free article] [PubMed] [Google Scholar]
- 44.Chen P-Y et al. Endothelial TGF-β signalling drives vascular inflammation and atherosclerosis. Nature Metabolism (2019) doi: 10.1038/s42255-019-0102-3. [DOI] [PMC free article] [PubMed] [Google Scholar]
- 45.Baylis RA, Gomez D, Mallat Z, Pasterkamp G & Owens GK The CANTOS Trial: One Important Step for Clinical Cardiology but a Giant Leap for Vascular Biology. Arterioscler. Thromb. Vasc. Biol 37, e174–e177 (2017). [DOI] [PMC free article] [PubMed] [Google Scholar]
- 46.He C et al. PDGFRβ signalling regulates local inflammation and synergizes with hypercholesterolaemia to promote atherosclerosis. Nature Communications 6, 7770 (2015). [DOI] [PMC free article] [PubMed] [Google Scholar]
- 47.Giles FJ et al. Nilotinib in imatinib-resistant or imatinib-intolerant patients with chronic myeloid leukemia in chronic phase: 48-month follow-up results of a phase II study. Leukemia 27, 107–112 (2013). [DOI] [PubMed] [Google Scholar]
- 48.Hochhaus A et al. Long-term benefits and risks of frontline nilotinib vs imatinib for chronic myeloid leukemia in chronic phase: 5-year update of the randomized ENESTnd trial. Leukemia 30, 1044–1054 (2016). [DOI] [PMC free article] [PubMed] [Google Scholar]
- 49.Kim TD et al. Peripheral artery occlusive disease in chronic phase chronic myeloid leukemia patients treated with nilotinib or imatinib. Leukemia 27, 1316–1321 (2013). [DOI] [PubMed] [Google Scholar]
- 50.Larson RA et al. Efficacy and Safety of Nilotinib (NIL) vs Imatinib (IM) in Patients (pts) With Newly Diagnosed Chronic Myeloid Leukemia in Chronic Phase (CML-CP): Long-Term Follow-Up (f/u) of ENESTnd. Blood 124, 4541–4541 (2014). [Google Scholar]
- 51.Manuel Mayr et al. Proteomic and Metabolomic Analyses of Atherosclerotic Vessels From Apolipoprotein E-Deficient Mice Reveal Alterations in Inflammation, Oxidative Stress, and Energy Metabolism. Arteriosclerosis, Thrombosis, and Vascular Biology 25, 2135–2142 (2005). [DOI] [PubMed] [Google Scholar]
- 52.Bories GFP & Leitinger N Macrophage metabolism in atherosclerosis. FEBS Letters 591, 3042–3060 (2017). [DOI] [PubMed] [Google Scholar]
- 53.Theodorou K & Boon RA Endothelial Cell Metabolism in Atherosclerosis. Front Cell Dev Biol 6, (2018). [DOI] [PMC free article] [PubMed] [Google Scholar]
- 54.Bjørklund Martin Mæng et al. Induction of Atherosclerosis in Mice and Hamsters Without Germline Genetic Engineering. Circulation Research 114, 1684–1689 (2014). [DOI] [PubMed] [Google Scholar]
- 55.Hiroshi Iwata et al. Bone Marrow–Derived Cells Contribute to Vascular Inflammation but Do Not Differentiate Into Smooth Muscle Cell Lineages. Circulation 122, 2048–2057 (2010). [DOI] [PubMed] [Google Scholar]
- 56.Pouwer MG et al. The BCR-ABL1 Inhibitors Imatinib and Ponatinib Decrease Plasma Cholesterol and Atherosclerosis, and Nilotinib and Ponatinib Activate Coagulation in a Translational Mouse Model. Front Cardiovasc Med 5, 55 (2018). [DOI] [PMC free article] [PubMed] [Google Scholar]
- 57.Rossi F et al. Imatinib upregulates compensatory integrin signaling in a mouse model of gastrointestinal stromal tumor and is more effective when combined with dasatinib. Mol. Cancer Res 8, 1271–1283 (2010). [DOI] [PMC free article] [PubMed] [Google Scholar]
- 58.Schindelin J et al. Fiji: an open-source platform for biological-image analysis. Nature Methods 9, 676–682 (2012). [DOI] [PMC free article] [PubMed] [Google Scholar]
Associated Data
This section collects any data citations, data availability statements, or supplementary materials included in this article.
Supplementary Materials
Data Availability Statement
The data and code that support the findings of this study are available at GSE163519.


