Abstract
Objective
To determine whether MRI-based cerebral small vessel disease (CSVD) burden assessment, in addition to clinical and CT data, improved prediction of cognitive impairment after spontaneous intracerebral hemorrhage (ICH).
Methods
We analyzed data from ICH survivors enrolled in a single-center prospective study. We employed 3 validated CSVD burden scores: global, cerebral amyloid angiopathy (CAA)–specific, and hypertensive arteriopathy (HTNA)–specific. We quantified cognitive performance by administering the modified Telephone Interview for Cognitive Status test. We utilized linear mixed models to model cognitive decline rates, and survival models for new-onset dementia. We calculated CSVD scores' cutoffs to maximize predictive performance for dementia diagnosis.
Results
We enrolled 612 ICH survivors, and followed them for a median of 46.3 months (interquartile range 35.5–58.7). A total of 214/612 (35%) participants developed dementia. Higher global CSVD scores at baseline were associated with faster cognitive decline (coefficient −0.25, standard error [SE] 0.02) and dementia risk (sub–hazard ratio 1.35, 95% confidence interval 1.10–1.65). The global score outperformed the CAA and HTNA scores in predicting post-ICH dementia (all p < 0.05). Compared to a model including readily available clinical and CT data, inclusion of the global CSVD score resulted in improved prediction of post-ICH dementia (area under the curve [AUC] 0.89, SE 0.02 vs AUC 0.81, SE 0.03, p = 0.008 for comparison). Global CSVD scores ≥2 had highest sensitivity (83%) and specificity (91%) for dementia diagnosis.
Conclusions
A validated MRI-based CSVD score is associated with cognitive performance after ICH and improved diagnostic accuracy for predicting new onset of dementia.
Intracerebral hemorrhage (ICH) is among the most severe forms of acute stroke, accounting for almost half of stroke-related morbidity and mortality.1 Recent advances in ICH surgical management and neurocritical care resulted in reduced mortality, but did not consistently reduce disability among survivors. Multiple recent studies clarified that ICH survivors are at very high risk of poststroke dementia, with cognitive impairment being a primary contributor to ICH-related long-term disability.2–5 Identification of ICH survivors at high risk for cognitive impairment is therefore a priority, in order to guide secondary stroke prevention efforts and inform further research into amelioration of long-term ICH outcomes.
Cerebral small vessel disease (CSVD) is the most common underlying etiology for primary (i.e., spontaneous) ICH. Among the most common forms of CSVD, hypertensive arteriopathy (HTNA, i.e., arteriolosclerosis) and cerebral amyloid angiopathy (CAA) are responsible for the majority of ICH cases.6 Because of their established effect on cognitive decline, these CSVD subtypes emerged as a key determinant of post-ICH dementia risk.2,7 Most studies to date associated CSVD markers on MRI with increased risk of post-ICH dementia. However, for the most part they did not evaluate all CSVD markers including white matter hyperintensities (WMH), lacunes, cerebral microbleeds (CMBs), enlarged perivascular spaces (EPVS), and cortical superficial siderosis (cSS), either individually or incorporated in validated CSVD scores.2,3,7 Furthermore, while readily available clinical and imaging information (i.e., older age, clinical severity at presentation, and lobar ICH location) have been consistently associated with cognitive decline after ICH, previous studies did not investigate whether an MRI-based evaluation of CSVD severity can improve prognostication of post-ICH dementia risk in clinical practice.2,3
We therefore sought to determine whether MRI-based information on CSVD severity can inform prediction of cognitive decline and risk of dementia following ICH. We specifically planned to test, in addition to well-established clinical and CT-based predictors, the informative potential of (1) individual CSVD markers and (2) validated scores summarizing global CSVD, CAA-specific, and HTNA-specific MRI burden.8–10 To do so, we leveraged longitudinal data from a long-running, single-center prospective study of ICH with baseline MRI scans (at time of ICH) and repeated cognitive testing during follow-up.
Methods
Study Eligibility and Patient Recruitment
We performed a retrospective analysis of prospectively collected data drawn from the ongoing longitudinal ICH study conducted at Massachusetts General Hospital (Boston).2,11 Study subjects were consecutive patients admitted to Massachusetts General Hospital between January 1, 1998, and December 31, 2017, with a diagnosis of spontaneous ICH. All participants were 18 years or older at time of acute primary (i.e., spontaneous) ICH. The initial ICH diagnosis was formulated by the attending stroke neurologist, and confirmed via CT scan obtained within 24 hours of symptom onset. Patients with intracranial hemorrhage due to trauma, conversion of an ischemic infarct, rupture of a vascular malformation or aneurysm, or brain tumor were not considered eligible. ICH events occurring on oral anticoagulation were classified as spontaneous ICH for the purpose of the present study. In order to study new-onset cognitive impairment after ICH, we excluded patients with previous history of dementia on the basis of a dedicated research interview and review of medical records at time of enrollment.2 At time of enrollment, patients and their family members took part in a dedicated research interview to obtain information on demographics and socioeconomic status, personal medical and family history, and pre-ICH medications use, as previously described in-depth.11 This in-person interview was supplemented via semi-automated review of electronic medical records, using a previously validated methodology.12 Finally, participants had to undergo MRI brain within 90 days of ICH symptoms' onset, according to the protocol summarized below.8,13
Standard Protocol Approvals, Registrations, and Patient Consents
This study was performed with the approval of and in accordance with the guidelines of the institutional review board of Massachusetts General Hospital. Written informed consent was obtained from all participants or authorized surrogates at time of enrollment.
Neuroimaging
MRI Data Analysis
MRIs were obtained using a 1.5T MR scanner (GE Sigma) and included whole brain T2-weighted, T1-weighted, diffusion-weighted images, T2*-weighted gradient-recalled echo (echo time 750/50 ms, 5 mm slice thickness, 1 mm inter-slice gap), and fluid-attenuated inversion recovery (FLAIR). Neuroimaging markers of CSVD severity were rated according to STRIVE (Standards for Reporting Vascular Changes on Neuroimaging) consensus criteria.13 The severity of WMH in deep (range 0–3) and periventricular regions (range 0–3) was evaluated in axial brain FLAIR sequences using the Fazekas scale.14 Lacunes were defined as small, ovoid, subcortical cavity of between 3 and 15 mm in diameter and hypointense on T1 imaging with corresponding hyperintense lesion on FLAIR images.13 CMBs were defined on axial blood-sensitive MRI as punctate foci of hypointensity less than 10 mm in diameter, distinct from vascular flow voids and leptomeningeal hemosiderosis. The location and number of CMBs were evaluated according to current consensus criteria and as previously described.13,15 EPVS were rated on axial T2-weighted MRI in the basal ganglia (BG) and centrum semiovale (CSO) with a validated 4-point visual rating scale (0 = no EPVS, 1 = <10 EPVS, 2 = 11–20 EPVS, 3 = 21–40 EPVS, and 4 = >40 EPVS).16 The presence or absence of cSS was evaluated in this study according to current consensus criteria.8 We classified cSS in focal (restricted to 3 or less sulci) and disseminated (diffuse to more than 3 sulci). The degree of cerebral atrophy was scored on a 4-point rating scale based on the size of the gyri and sulci from 0 (no cortical atrophy) to 3 (severe cortical atrophy) at 5 regions (frontal, parietal, temporal and occipital lobes, and the insular region) with use of reference scans. The sum of these 5 regions (0–15) was calculated.17 All MRI analyses were performed and recorded blinded to all clinical information.
MRI-Based CSVD Scores
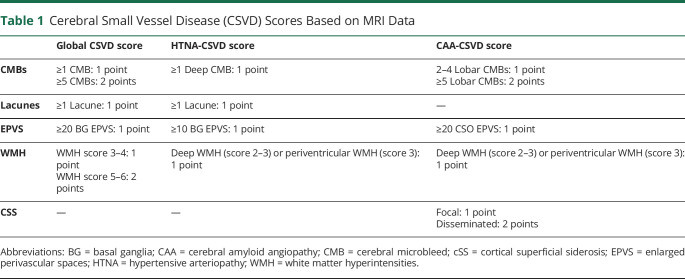
Based on a recently described and validated total CSVD score, we rated global CSVD burden on an ordinal scale from 0 to 6.9 We allocated one point for presence of (a) lacunes; (b) 1–4 CMBs; (c) moderate to severe BG EPVS (>20); (d) moderate WMH (total periventricular + subcortical WMH grade 3–4). We allocated 2 points for presence of (a) ≥ 5 CMBs; and (b) severe WMH (total periventricular + deep WMH grade 5–6). We also evaluated total CAA burden on MRI using a recently validated ordinal score that ranges from 0 to 6.8 One point was allocated for presence of (a) 1–4 lobar CMBs; (b) presence of moderate to severe CSO EPVS (>20 CSO EPVS); (c) deep WMH ≥2 or periventricular WMH >3; (d) focal cSS. We allocated 2 points for (a) ≥5 lobar CMBs; and (b) disseminated cSS. Finally, we evaluated HTNA burden on MRI using a previously validated ordinal scale ranging from 0 to 4.10 One point was allocated for presence of (a) lacunes; (b) periventricular WMH grade 3 or deep WMH grade 2–3; (c) presence of 1 or more deep CMBs; (d) presence of moderate to severe BG EPVS (>10 BG EPVS). CSVD MRI scores are summarized in table 1.
Table 1.
Cerebral Small Vessel Disease (CSVD) Scores Based on MRI Data
ICH Etiologic Classification
All patients with ICH were classified based on the location of ICH and CMBs and presence of cSS as HTNA-related ICH, CAA-related ICH, or mixed ICH. Patients with HTNA-related ICH had strictly deep (when located in the BG, thalamus, brainstem, or cerebellum) hemorrhages with or without exclusively deep located CMBs (lobar CMBs and cSS not allowed). Patients with CAA-related ICH had lobar ICH involving the cerebral cortex and the underlying white matter with or without exclusively lobar located CMBs and cSS (deep located CMBs not allowed), meeting modified Boston criteria for probable and possible CAA.18 Patients with mixed ICH fulfilled one of the following criteria: (1) lobar ICH and ≥1 deep CMBs, (2) deep ICH and ≥1 lobar CMBs or presence of cSS, or (3) deep and lobar ICHs with or without CMBs in any location.19
Longitudinal Follow-Up
ICH survivors and their caregivers were contacted for phone interviews by trained study personnel at 3 and 6 months after index ICH, and every 6 months thereafter, per established protocols.2 Study staff collected medical records and information from participants pertaining to recurrence of ICH, ischemic stroke, death, functional status, and current medication regimens. Cognitive testing was performed at all follow-up times using the modified Telephone Interview for Cognitive Status (TICS-m). TICS-m is a validated, telephone-based, global cognitive assessment tool that measures overall cognitive performance, with scores ranging from 0 (worst performance) to 39 (best performance).2,12,20 We supplemented telephone-based collection of follow-up data with semiautomated review of longitudinal electronic medical records as previously described.11 We excluded from analyses patients who were missing one or more cognitive measurements during follow-up. Participants missing one or more follow-up phone calls were considered lost to follow-up, and data censored accordingly at time of last recorded contact.
Statistical Methods
Overall Analysis Plan
Our initial analyses focused on exploring associations between MRI markers of CSVD and 2 cognitive outcomes of interest: (1) rate in cognitive decline over time after ICH; (2) new clinical diagnosis of dementia after ICH. For each outcome, we first explored associations with individual CSVD markers (i.e., WMH, lacunes, CMBs, EPVS, and cSS) in univariable and multivariable models. We then investigated associations between CSVD MRI scores (global, CAA-specific, and HTNA-specific) and outcomes of interest, and then compared predictive performance for dementia diagnosis. We also compared predictive performance for dementia diagnosis between a model including only readily available clinical and CT data, and one adding MRI-based CSVD burden assessment. Finally, we repeated all CSVD scores' analyses within etiology-specific subsets of ICH survivors with CAA-ICH, HTNA-ICH, or mixed ICH.
Variables' Definition
Age at index ICH was analyzed as a continuous variable. Race/ethnicity was analyzed as a categorical variable, with White patients as the reference group owing to their numerical preponderance. Educational level was dichotomized using a cutoff of 12 or more years of education. CSVD MRI markers were analyzed and scores created as described above. TICS-m scores were normalized via z score transformation for subsequent analyses. We defined incident dementia for outcome analyses as patients meeting both of the following criteria: (1) relevant ICD-9 or ICD-10 codes entered in electronic medical records; and (2) TICS-m scores dropping below a cutoff score of 20 (based on published normative data) and remaining in said range for the remainder of follow-up.21,22 We previously demonstrated excellent sensitivity and specificity of these criteria for dementia diagnosis compared with clinical evaluation by a board-certified neurologist.2,12
Association Analyses and Outcome Prediction
To investigate the association of CSVD MRI markers with cognitive decline, we constructed linear mixed-effects models (LMMs) to determine changes in cognitive function over time. Time was expressed as months from index ICH. In addition to CSVD markers of interest, we included as fixed effects risk factors for cognitive decline after ICH, including participant demographics (age, sex, race/ethnicity, and education), clinical factors (history of stroke or TIA before index ICH), acute ICH characteristics (NIH Stroke Scale [NIHSS] score at index ICH presentation, lobar vs nonlobar location, hematoma volume), baseline cognitive functioning (Informant Questionnaire on Cognitive Decline in the Elderly [IQCODE] at enrollment), and baseline cerebral atrophy.3,6,7 We also included random effects for intercept and slope for time, in order to allow for correlation of cognitive measures within participants during follow-up, thus modeling participant-specific rates of cognitive decline over time. To determine whether CSVD MRI markers are associated with incident post-ICH dementia, we employed a survival competing risk analysis framework using the Fine and Gray model. We prespecified for inclusion in survival models as covariates all variables previously entered in the LMM analyses. We additionally screened all other available covariates for inclusion, based on a prespecified significance threshold in univariable analyses of p < 0.20. Death was included as a competing risk in all models. Heterogeneity of effects for association of CSVD MRI data with cognitive outcomes was evaluated for statistical significance using the metareg function, part of the meta package for the R statistical program (The R Foundation for Statistical Computing). To evaluate predictive performance for post-ICH dementia, we determined dementia status at 5 years from index ICH as a dichotomous (i.e., yes/no) variable, and calculated sensitivity, specificity, and area under the curve (AUC) for different CSVD markers and scores. AUC for different MRI markers and scores were compared using the roc test function of the pROC package for R.
Multiple Testing Adjustment
We corrected for multiple testing using the Benjamini-Hochberg false discovery rate (FDR) method for adjustment.23 We report p values after FDR adjustment of original results. All significance tests were 2-tailed, and significance was set at p < 0.05 (after FDR adjustment). All analyses were performed using R software (The R Foundation for Statistical Computing), version 3.6.2.
Data Availability
The authors certify they have documented all data, methods, and materials used to conduct the research presented. Anonymized data pertaining to the research presented will be made available upon reasonable request from external investigators.
Results
Study Participants, MRI Data, and Follow-Up Information
After application of prespecified inclusion and exclusion criteria to 1,549 consecutive ICH cases potentially eligible for inclusion (figure 1), we analyzed data for 612 survivors of primary ICH enrolled in our longitudinal study. The majority of excluded participants (485 of 937, 52%) were excluded due to mortality within 90 days of ICH. Lack of MRI data of sufficient quality for analysis was the second most common reason for exclusion, affecting 279 participants (30% of all excluded participants). We found no significant differences in demographics, medical history, or ICH location and volume when comparing ICH survivors with vs without MRI data (all p > 0.20). In addition, availability of MRI data was not associated with trajectory of cognitive decline during follow-up (coefficient +0.1, standard error [SE] 0.04, p = 0.79). For ICH survivors with available MRI data, median time from hospital arrival to scan was 4.2 days (interquartile range [IQR] 3.3–5.8). Participants were followed for a median time of 46.3 months (IQR 35.5–58.7). We estimated average yearly loss to follow-up at 1.3%. A total of 214/612 (35%) study participants met our prespecified diagnostic criteria for dementia during follow-up.
Figure 1. Enrollment Flow Chart and Study Inclusion and Exclusion Criteria.
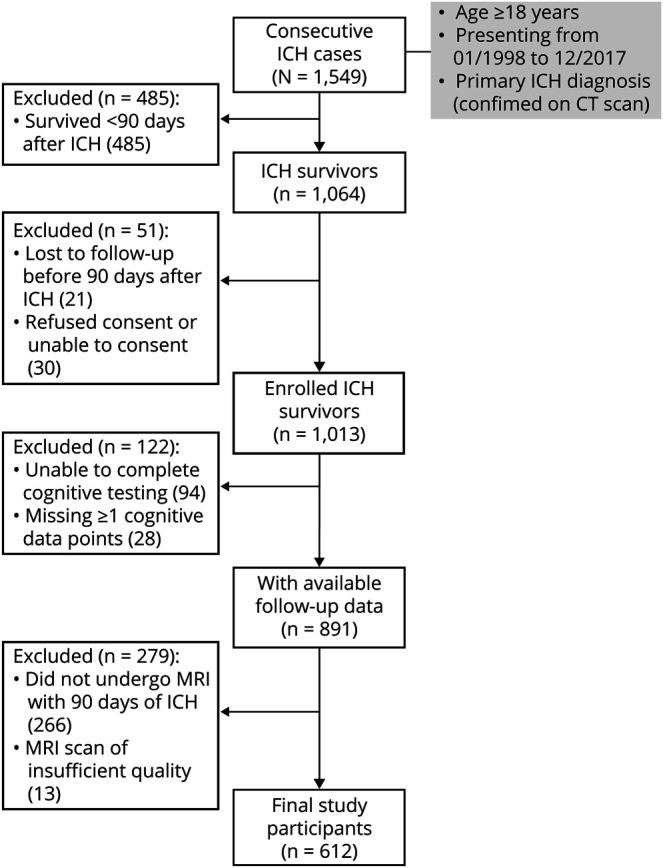
FU = follow-up; ICH = intracerebral hemorrhage.
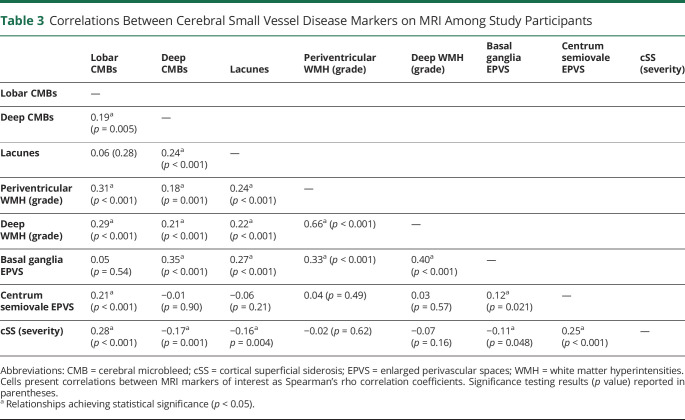
We present key characteristics for participating ICH survivors (including severity of cerebral atrophy and CSVD markers identified on enrollment MRI scans) in table 2. Upon examining MRI data, we identified multiple statistically significant correlations across CSVD markers ranging in magnitude from weak to strong (Spearman correlation coefficients ranging from −0.17 to 0.66), as summarized in table 3. Higher lobar CMB counts, presence of lacunes, periventricular WMH grade 3 (Fazekas scale), and presence of disseminated cSS were associated with increasing cerebral atrophy scores in both univariable and multivariable analyses (all p < 0.05). We separately analyzed global, CAA-specific, and HTNA-specific MRI scores and found them to be highly correlated to each other (Spearman correlation coefficients ranging from 0.60 to 0.81, all correlation p < 0.001). All MRI-based CSVD scores were associated with severity of cerebral atrophy on baseline MRI (all p < 0.001).
Table 2.
Characteristics of Study Participants

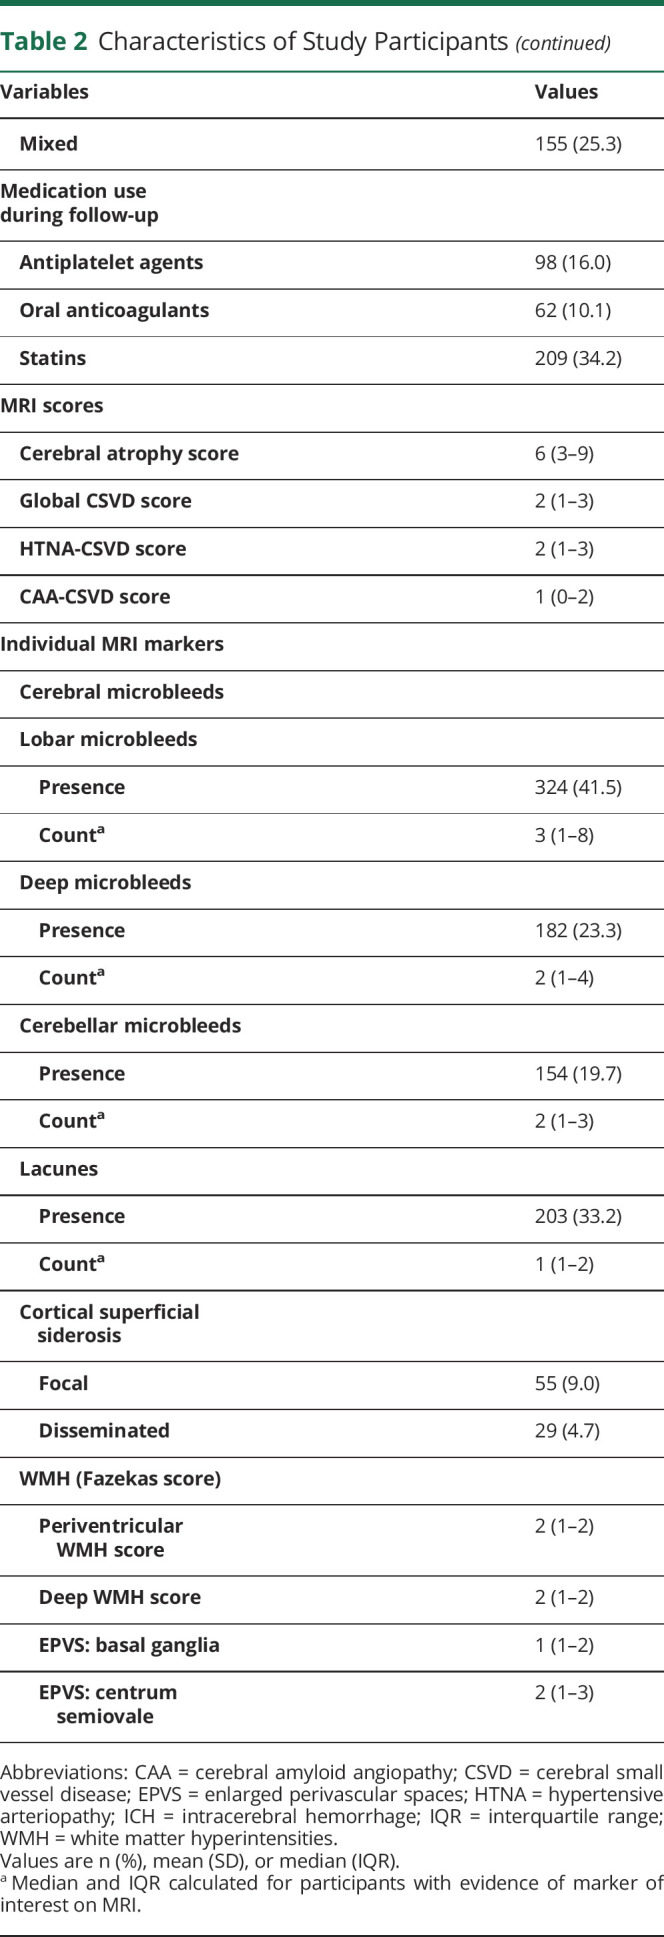
Table 3.
Correlations Between Cerebral Small Vessel Disease Markers on MRI Among Study Participants
Rates of Cognitive Decline After ICH
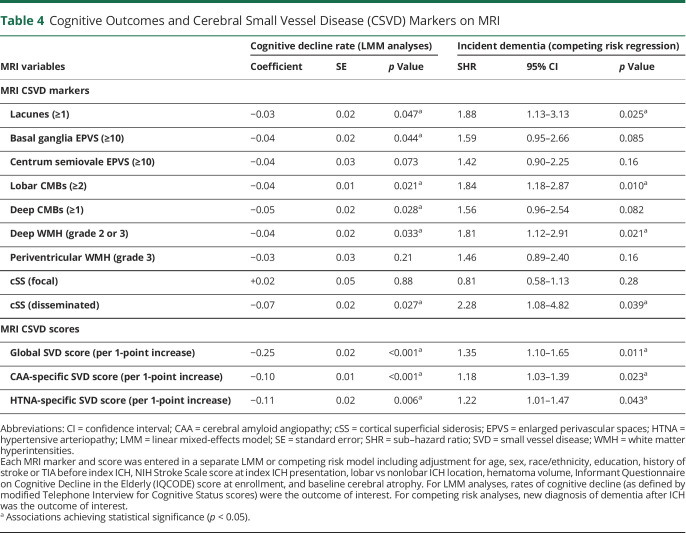
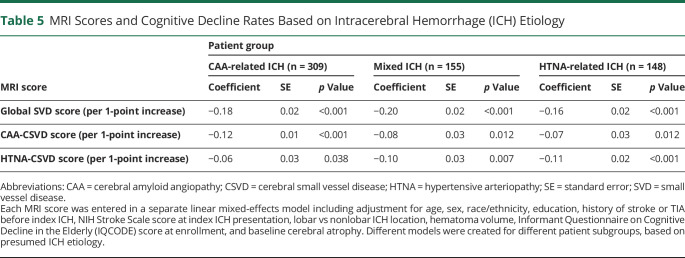
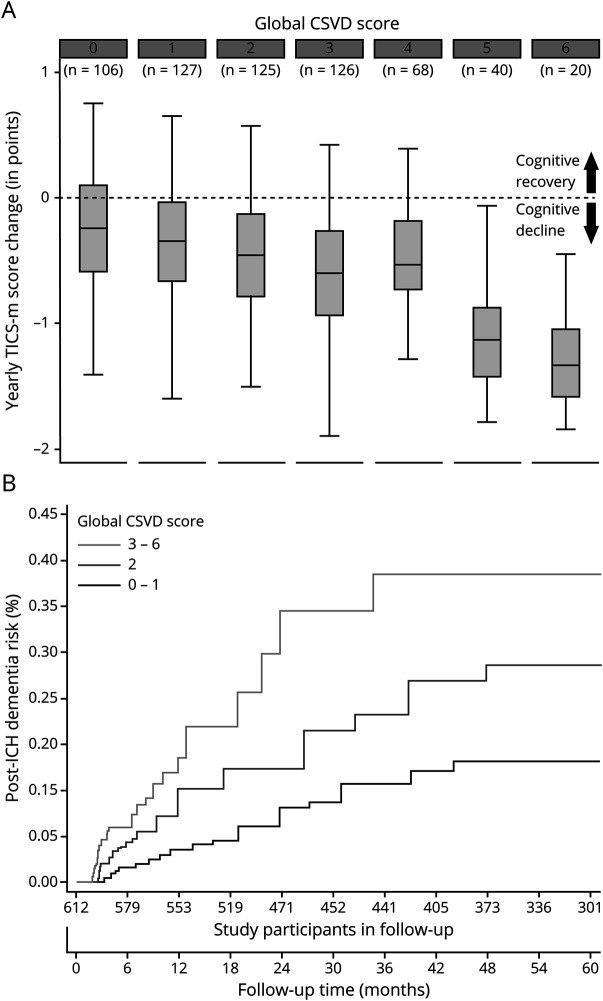
We first explored the association between individual markers of CSVD on MRI and rate of cognitive decline via LMM analyses, as presented in table 4. Of all markers, only CSO EPVS, focal cSS, and periventricular WMH were not associated with individual rates of cognitive decline (all others had p < 0.05). None of the significantly associated markers exerted a significantly larger or smaller influence on cognitive performance over time after ICH (all p > 0.20 for comparison of effect sizes). All computed CSVD scores were also associated with rates of cognitive decline after ICH (all p < 0.05), as presented in table 4. Compared to the CAA-specific CSVD score, HTNA-specific CSVD score, and all individual MRI markers, the global CSVD score had a significantly larger effect size on post-ICH cognitive performance over time (all p < 0.01 for comparisons after adjustment for multiple testing). We then evaluated the associations between CSVD scores of interest and cognitive function over time in a subset of ICH survivors determined by ICH etiology (table 5). The global CSVD score consistently displayed larger effect sizes for association with cognition after ICH across all CSVD etiologies, when compared to subtype-specific scores (all p < 0.05 for comparisons after adjustment for multiple testing). We provide a graphical representation of the relationship between the global CSVD score and annual average change in TICS-m scores in figure 2 (top panel).
Table 4.
Cognitive Outcomes and Cerebral Small Vessel Disease (CSVD) Markers on MRI
Table 5.
MRI Scores and Cognitive Decline Rates Based on Intracerebral Hemorrhage (ICH) Etiology
Figure 2. Cognitive Decline Rates and Global CSVD Score on MRI.
(A) Average yearly change in TICS-m scores during follow-up, values for the global CSVD score on MRI imaging at time of enrollment. Boxplot upper and lower margins indicate 25th and 75th percentiles, horizontal lines in the boxes indicate median values. The dash horizontal line across boxes indicates stable cognitive performance, separating cognitive recovery from cognitive decline changes over time (arrows). (B) Cumulative incidence function curves presenting incidence of dementia after ICH within patient subgroups defined by values for the global CSVD score on MRI imaging at time of enrollment. CSVD = cerebral small vessel disease; ICH = intracerebral hemorrhage; TICS-m = modified telephone interview for cognitive status.
Dementia Risk After ICH
In univariable analyses, all MRI markers were associated with new-onset dementia after ICH, except for periventricular WMH severity and focal cSS (all other p < 0.05). We then constructed multivariable models, including adjustment for other established risk factors for post-ICH dementia (table 4). We found that presence of lacunes, lobar CMBs, severe deep WMH, and disseminated cSS were associated with dementia risk after ICH. Finally, we created a single multivariable model including all MRI markers and other risk factors of interest. We found that lacunes (sub–hazard ratio [SHR] 1.87, 95% confidence interval [CI] 1.13–3.04, p = 0.021), severe deep WMH (SHR 1.70, 95% CI 1.07–2.71, p = 0.033) and disseminated cSS (SHR 2.18, 95% CI 1.20–3.98, p = 0.020) were independently associated with post-ICH dementia risk.
Clinical Prediction of Post-ICH Dementia Using MRI Data
We first evaluated the post-ICH dementia predictive performance for individual MRI markers by calculating AUC values. Individual markers had modest predictive capability at best (AUC range 0.59–0.68) with none significantly outperforming others (all AUC comparisons with p > 0.20). The global CSVD score had highest predictive capability (AUC 0.83, SE 0.04), and outperformed the CAA-specific CSVD score (AUC 0.72, SE 0.03, p = 0.024 for comparison with global CSVD score) and the HTNA-specific CSVD score (AUC 0.70, SE 0.04, p = 0.012 for comparison with global CSVD score). Compared to a model including readily available clinical and CT data (age, sex, race/ethnicity, education, history of stroke or TIA, NIHSS for index ICH, lobar vs nonlobar ICH location, hematoma volume), inclusion of the global CSVD score resulted in improved prediction of post-ICH dementia (AUC 0.89, SE 0.02 vs AUC 0.81, SE 0.03, p = 0.008 for comparison). A cutoff of 2 points or more on the global CSVD score had the best combination of sensitivity (0.83, 95% CI 0.77–0.88) and specificity (0.91, 95% CI 0.88–0.94) for prospective diagnosis of post-ICH dementia. Figure 2 (bottom panel) details incidence of dementia after ICH within patient subgroups defined by values for the global CSVD score on MRI at time of enrollment.
Discussion
Our analyses demonstrate that markers of CSVD on MRI are strongly associated with cognitive decline after primary ICH, up to and including onset of dementia. Previously validated CSVD burden scores based on MRI data are a highly practical and effective way of summarizing the contribution of multiple markers, providing increased predictive power for future dementia risk than CSVD markers alone. A global CSVD score including contribution from both CAA and hypertensive subtypes of CSVD (e.g., arteriolosclerosis) consistently outperformed subtype-specific MRI scores. This observation is consistent with a substantial degree of etiologic heterogeneity for cognitive decline following CSVD-related ICH. Compared to a model including only readily available clinical and CT data, inclusion of the global CSVD score resulted in a significant improved accuracy for predicting post-ICH dementia. The predictive performance of the global CSVD score may therefore warrant inclusion in clinical care of ICH survivors in the future, and is certainly deserving of additional investigative efforts.
Despite representing a single, cross-sectional, and indirect evaluation of underlying CSVD, MRI markers at time of ICH (either individually or incorporated in CSVD scores) were consistently associated with subsequent cognitive decline in the present study. Our findings are consistent with prior observations in ICH survivors, survivors of CSVD-related ischemic stroke, and in the general population.8–10,24,25 In the context of already available evidence, our study confirms that underlying CSVD evaluated with MRI is a primary determinant of future cognitive outcome for ICH survivors.2,3 Interventions aimed at controlling its progression (e.g., blood pressure control) are therefore likely to play a key role in lowering future dementia risk for ICH survivors, with its catastrophic implication in terms of disability and dependence.26,27
Of note, MRI markers and scores of CSVD were not only associated with rates of cognitive decline after ICH, but able to predict the onset of post-ICH dementia: a clinical endpoint of immediate practical relevance for patients, families, and health care providers. The previously validated overall CSVD burden score, in particular, had excellent predictive performance for future diagnosis of dementia after ICH. Furthermore, we found that the addition of the global CSVD score to clinical and CT-based data significantly improves prediction of post-ICH dementia. Our findings suggest that use of CSVD information for prediction of dementia risk after ICH is a highly promising approach, and deserves additional investigative efforts.
We found that the global CSVD score consistently had greater predictive performance for post-ICH dementia than subtype-specific scores, even when restricting analysis to patients presenting with a specific etiologic CSVD subtype (i.e., CAA-related vs HTNA-related ICH). These findings suggest that most ICH survivors harbor some degree of mixed CSVD, as reflected by contributions of different etiologic mechanisms (i.e., CAA and HTNA) for the development of cognitive impairment. The etiology of microvascular disease among ICH survivors is typically inferred from location of hemorrhagic lesions (lobar vs nonlobar), with the Boston criteria being the preferred instrument to separate CAA-ICH from non–CAA-related ICH.28 We recently proposed the concept of mixed etiology ICH (concomitant presence of deep and lobar CMBs or ICH) to account for discrepancies in hemorrhagic lesion locations, and identified independent risk factors profile and long-term outcomes for patient in this category.19 Findings from the present study expand upon these observations, suggesting a higher degree of heterogeneity in small vessel disease contributions to post-ICH cognitive decline than previously hypothesized. Future studies with pathologic or molecular imaging data are warranted to specifically address this hypothesis.
Our study has some limitations. We obtained information on cognitive performance during follow-up primarily via administration of the TICS-m during telephone-based evaluations, rather than during in-person interviews. The use of TICS-m might have underestimated cognitive decline among patients with more subtle cognitive deficits at time of enrollment, such as individuals with history of previous stroke. However, the TICS-m has been validated extensively as a reliable tool for evaluation of global cognitive performance in a variety of settings, including among ischemic and hemorrhagic stroke survivors.21,22 We previously demonstrated excellent sensitivity and specificity for use of the TICS-m in diagnosis of dementia after ICH (as compared to an in-person evaluation by a board-certified neurologist).2 Furthermore, our analyses employed mixed effect models to specifically model the impact of exposures of interest (e.g., history of prior stroke) on individual trajectories of cognitive decline. We also include in our modeling information on global and regional cortical atrophy, which is expected to provide a more granular estimation of pre-ICH cognitive impairment. We therefore managed to minimize the impact of limited testing accuracy in identifying more subtle cognitive deficits, as is likely the case among patients with previous ischemic or hemorrhagic stroke. We also focused on MRI information on CSVD severity readily derived from most scanning protocols applied in clinical practice. As a result, we did not include in our analyses information on advanced neuroimaging markers of CSVD (e.g., information on microstructural integrity of gray and white matter as derived from diffusor tensor imaging) that would have likely further increased predictive capability for post-ICH dementia.29,30 We also did not have information on CSVD progression over time on repeat MRI scans. However, this approach more closely mirrors information available to clinicians caring for patients with ICH in clinical settings, thus providing better insight into the potential and feasibility of MRI-based risk prediction of cognitive decline after ICH. Our study cohort also comprised individuals presenting to a tertiary care center with dedicated expertise in ICH care and MRI neuroimaging, thus potentially limiting generalizability to ICH survivors at large. Furthermore, for the purpose of our study we decided to include only those patients who had an MRI. While this may have resulted in introduction of selection bias, we did not identify significant differences between ICH survivors with vs without MRI in terms of baseline clinical characteristics or cognitive decline trajectories. Finally, as MRI markers of CSVD are frequent findings in patients with ICH, we cannot exclude a potential ceiling effect of the global CSVD score in dementia prediction. Future studies will be required to further validate and expand upon our findings, ideally including different health care settings. Our approach also displays several strengths. Using a validated longitudinal follow-up methodology, we achieved low rates of loss to follow-up in a biologically very frail population at high risk for recurrent stroke and dementia. We were also able to gather extensive personal, clinical, and neuroimaging data to create detailed models of cognitive function over time after ICH. In turn, this approach clarified that CSVD burden plays a relevant role in post-ICH cognitive performance across age categories, racial/ethnic groups, and regardless of preexisting degenerative cerebral changes (i.e., cerebral atrophy) or small vessel disease subtype.
We found evidence of consistent associations between MRI markers of CSVD, either individually or incorporated in CSVD scores, and cognitive function over time after primary ICH. Validated scores summarizing overall CSVD burden suggest that post-ICH cognitive impairment is often related to a combination of amyloid angiopathy and hypertensive microvascular disease, the most common CSVD subtypes. CSVD scores derived from MRI scans obtained at time of ICH have significant predictive power for subsequent risk of dementia, increasing diagnostic accuracy in addition to well-established clinical and CT-based data. These findings support investigating the potential role of MRI in guiding clinical research and care for survivors of primary ICH.
Acknowledgment
The authors' work on this study was supported by funding from the US NIH (K23NS100816, R01NS093870, and R01AG26484). The funding entity had no role in the design and conduct of the study; collection, management, analysis, or interpretation of the data; preparation, review, or approval of the manuscript; or decision to submit the manuscript for publication.
Glossary
- AUC
area under the curve
- BG
basal ganglia
- CAA
cerebral amyloid angiopathy
- CI
confidence interval
- CMB
cerebral microbleed
- CSO
centrum semiovale
- cSS
cortical superficial siderosis
- CSVD
cerebral small vessel disease
- EPVS
enlarged perivascular spaces
- FDR
false discovery rate
- FLAIR
fluid-attenuated inversion recovery
- HTNA
hypertensive arteriopathy
- ICD
International Classification of Diseases
- ICH
intracerebral hemorrhage
- IQR
interquartile range
- LMM
linear mixed-effects model
- NIHSS
NIH Stroke Scale
- SE
standard error
- SHR
sub–hazard ratio
- TICS-m
modified Telephone Interview for Cognitive Status
- WMH
white matter hyperintensities
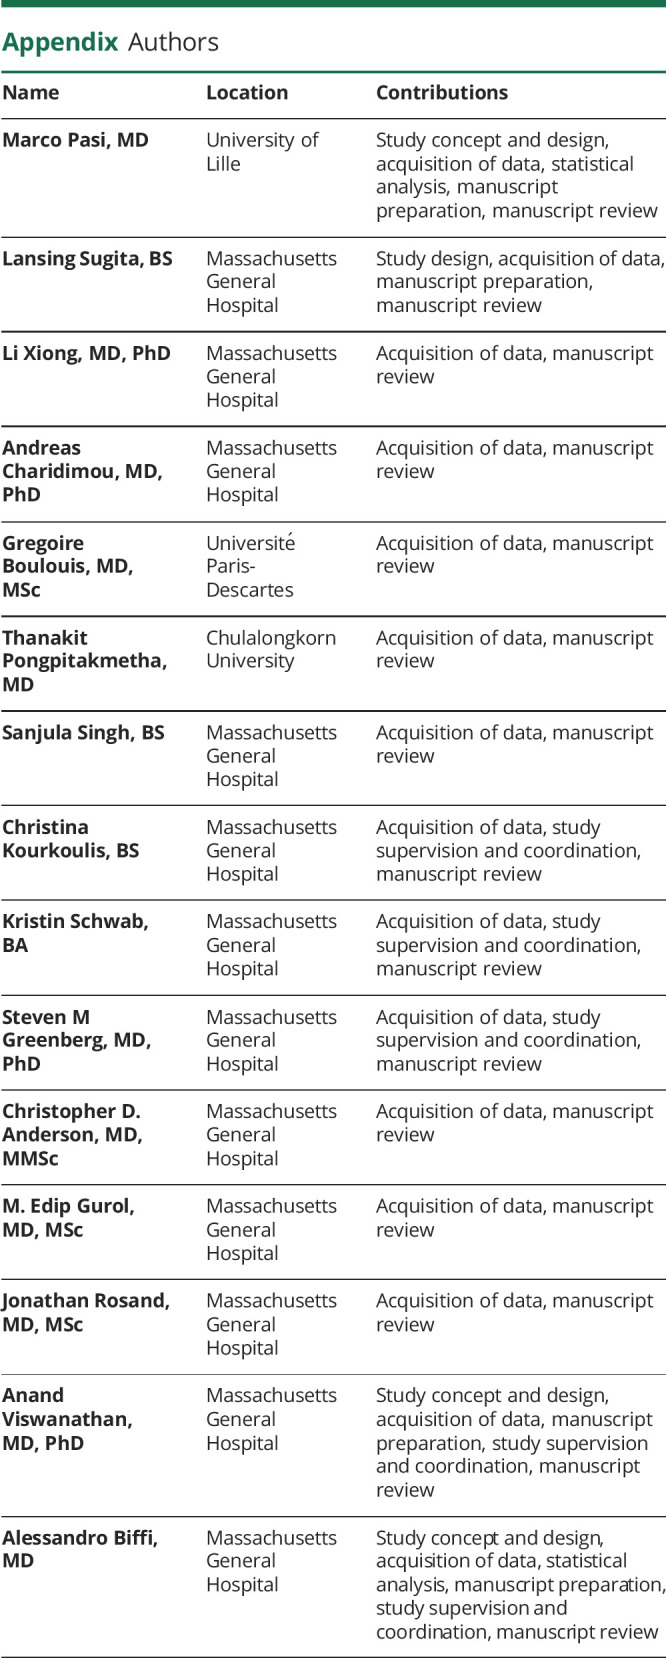
Appendix. Authors
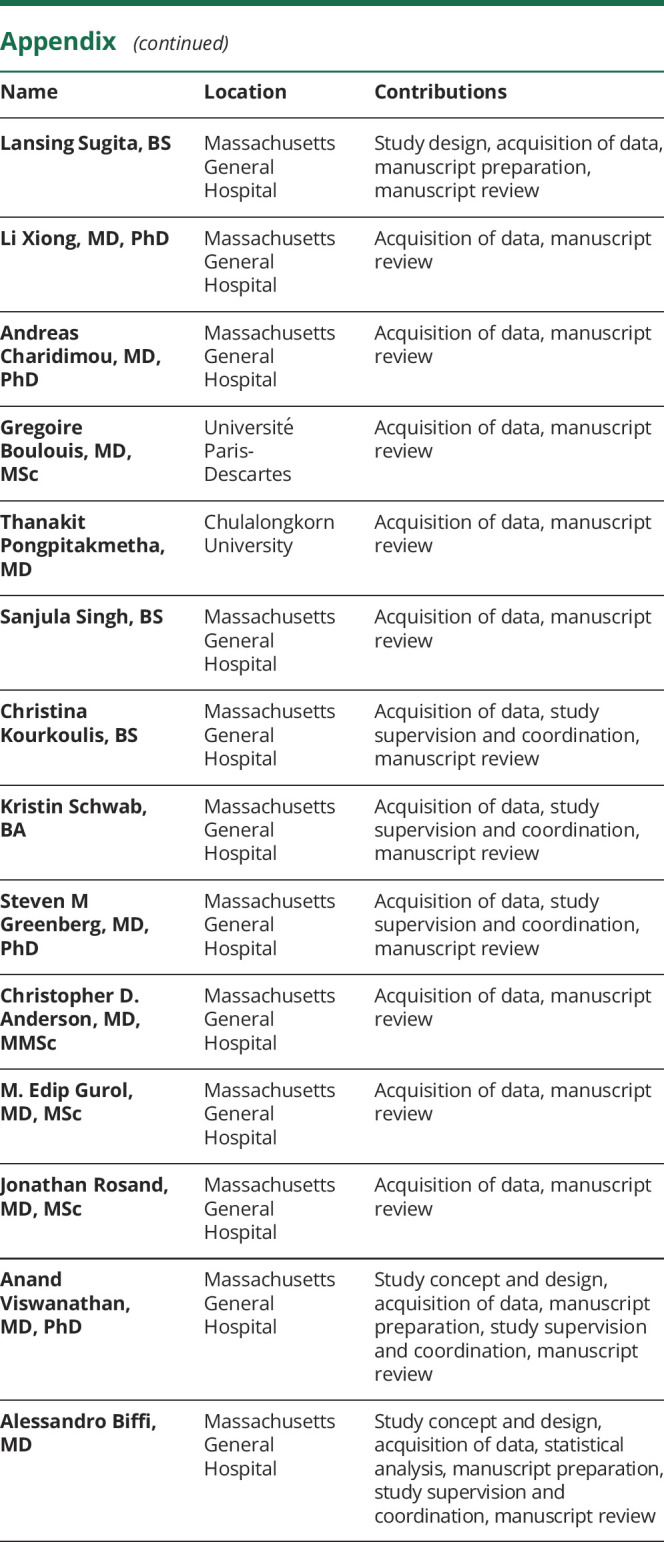
Study Funding
Supported by NIH (K23NS100816, R01NS093870, and R01AG26484).
Disclosure
Dr. Pasi, L. Sugita, Dr. Xiong, Dr. Charidimou, Dr. Boulouis, Dr. Pongpitakmetha, S. Singh, C. Kourkoulis, and K. Schwab report no disclosures. Dr. Greenberg is supported by R01AG26484. Dr. Anderson is supported by R01NS103924, AHA 18SFRN34110082, and the MGH Center for Genomic Medicine, and has consulted for ApoPharma, Inc. Dr. Gurol is supported by K23NS083711. Dr. Rosand is supported by R01NS036695, UM1HG008895, R01NS093870, and R24NS092983, and has consulted for New Beta Innovations, Boehringer Ingelheim, and Pfizer Inc. Dr. Viswanathan is supported by R01AG047975, R01AG026484, and P50AG005134. Dr. Biffi is supported by K23NS100816. Go to Neurology.org/N for full disclosures.
References
- 1.Poon MT, Fonville AF, Al-Shahi Salman R. Long-term prognosis after intracerebral haemorrhage: systematic review and meta-analysis. J Neurol Neurosurg Psychiatry 2014;85:660–667. [DOI] [PubMed] [Google Scholar]
- 2.Biffi A, Bailey D, Anderson CD, et al. Risk factors associated with early vs delayed dementia after intracerebral hemorrhage. JAMA Neurol 2016;73:969–976. [DOI] [PMC free article] [PubMed] [Google Scholar]
- 3.Moulin S, Labreuche J, Bombois S, et al. Dementia risk after spontaneous intracerebral haemorrhage: a prospective cohort study. Lancet Neurol 2016;15:820–829. [DOI] [PubMed] [Google Scholar]
- 4.Garcia PY, Roussel M, Bugnicourt JM, et al. Cognitive impairment and dementia after intracerebral hemorrhage: a cross-sectional study of a hospital-based series. J Stroke Cerebrovasc Dis 2013;22:80–86. [DOI] [PubMed] [Google Scholar]
- 5.Corraini P, Henderson VW, Ording AG, Pedersen L, Horvath-Puho E, Sorensen HT. Long-term risk of dementia among survivors of ischemic or hemorrhagic stroke. Stroke 2017;48:180–186. [DOI] [PMC free article] [PubMed] [Google Scholar]
- 6.Planton M, Raposo N, Danet L, Albucher JF, Peran P, Pariente J. Impact of spontaneous intracerebral hemorrhage on cognitive functioning: an update. Rev Neurol 2017;173:481–489. [DOI] [PubMed] [Google Scholar]
- 7.Benedictus MR, Hochart A, Rossi C, et al. Prognostic factors for cognitive decline after intracerebral hemorrhage. Stroke 2015;46:2773–2778. [DOI] [PubMed] [Google Scholar]
- 8.Charidimou A, Martinez-Ramirez S, Reijmer YD, et al. Total magnetic resonance imaging burden of small vessel disease in cerebral amyloid angiopathy: an imaging-pathologic study of concept validation. JAMA Neurol 2016;73:994–1001. [DOI] [PMC free article] [PubMed] [Google Scholar]
- 9.Lau KK, Li L, Schulz U, et al. Total small vessel disease score and risk of recurrent stroke: validation in 2 large cohorts. Neurology 2017;88:2260–2267. [DOI] [PMC free article] [PubMed] [Google Scholar]
- 10.Staals J, Makin SD, Doubal FN, Dennis MS, Wardlaw JM. Stroke subtype, vascular risk factors, and total MRI brain small-vessel disease burden. Neurology 2014;83:1228–1234. [DOI] [PMC free article] [PubMed] [Google Scholar]
- 11.Biffi A, Anderson CD, Battey TW, et al. Association between blood pressure control and risk of recurrent intracerebral hemorrhage. JAMA 2015;314:904–912. [DOI] [PMC free article] [PubMed] [Google Scholar]
- 12.Biffi A, Rattani A, Anderson CD, et al. Delayed seizures after intracerebral haemorrhage. Brain 2016;139(pt 10):2694–2705. [DOI] [PMC free article] [PubMed] [Google Scholar]
- 13.Wardlaw JM, Smith EE, Biessels GJ, et al. Neuroimaging standards for research into small vessel disease and its contribution to ageing and neurodegeneration. Lancet Neurol 2013;12:822–838. [DOI] [PMC free article] [PubMed] [Google Scholar]
- 14.Fazekas F, Barkhof F, Wahlund LO, et al. CT and MRI rating of white matter lesions. Cerebrovasc Dis 2002;13(suppl 2):31–36. [DOI] [PubMed] [Google Scholar]
- 15.Greenberg SM, Vernooij MW, Cordonnier C, et al. Cerebral microbleeds: a guide to detection and interpretation. Lancet Neurol 2009;8:165–174. [DOI] [PMC free article] [PubMed] [Google Scholar]
- 16.Charidimou A, Boulouis G, Pasi M, et al. MRI-visible perivascular spaces in cerebral amyloid angiopathy and hypertensive arteriopathy. Neurology 2017;88:1157–1164. [DOI] [PMC free article] [PubMed] [Google Scholar]
- 17.Heijer T, Skoog I, Oudkerk M, et al. Association between blood pressure levels over time and brain atrophy in the elderly. Neurobiol Aging 2003;24:307–313. [DOI] [PubMed] [Google Scholar]
- 18.Linn J, Halpin A, Demaerel P, et al. Prevalence of superficial siderosis in patients with cerebral amyloid angiopathy. Neurology 2010;74:1346–1350. [DOI] [PMC free article] [PubMed] [Google Scholar]
- 19.Pasi M, Charidimou A, Boulouis G, et al. Mixed-location cerebral hemorrhage/microbleeds: underlying microangiopathy and recurrence risk. Neurology 2018;90:e119-e126. [DOI] [PMC free article] [PubMed] [Google Scholar]
- 20.Castanho TC, Amorim L, Zihl J, Palha JA, Sousa N, Santos NC. Telephone-based screening tools for mild cognitive impairment and dementia in aging studies: a review of validated instruments. Front Aging Neurosci 2014;6:16. [DOI] [PMC free article] [PubMed] [Google Scholar]
- 21.Barber M, Stott DJ. Validity of the Telephone Interview for Cognitive Status (TICS) in post-stroke subjects. Int J Geriatr Psychiatry 2004;19:75–79. [DOI] [PubMed] [Google Scholar]
- 22.Pendlebury ST, Welch SJ, Cuthbertson FC, Mariz J, Mehta Z, Rothwell PM. Telephone assessment of cognition after transient ischemic attack and stroke: modified Telephone Interview of Cognitive Status and telephone Montreal Cognitive Assessment versus face-to-face Montreal Cognitive Assessment and neuropsychological battery. Stroke 2013;44:227–229. [DOI] [PMC free article] [PubMed] [Google Scholar]
- 23.Keselman HJ, Cribbie R, Holland B. Controlling the rate of type I error over a large set of statistical tests. Br J Math Stat Psychol 2002;55:27–39. [DOI] [PubMed] [Google Scholar]
- 24.Boulouis G, Charidimou A, Jessel MJ, et al. Small vessel disease burden in cerebral amyloid angiopathy without symptomatic hemorrhage. Neurology 2017;88:878–884. [DOI] [PMC free article] [PubMed] [Google Scholar]
- 25.Yilmaz P, Ikram MK, Niessen WJ, Ikram MA, Vernooij MW. Practical small vessel disease score relates to stroke, dementia, and death. Stroke 2018;49:2857–2865. [DOI] [PubMed] [Google Scholar]
- 26.Wardlaw JM, Chappell FM, Valdes Hernandez MDC, et al. White matter hyperintensity reduction and outcomes after minor stroke. Neurology 2017;89:1003–1010. [DOI] [PMC free article] [PubMed] [Google Scholar]
- 27.Dufouil C, Chalmers J, Coskun O, et al. Effects of blood pressure lowering on cerebral white matter hyperintensities in patients with stroke: the PROGRESS (Perindopril Protection Against Recurrent Stroke Study) magnetic resonance imaging substudy. Circulation 2005;112:1644–1650. [DOI] [PubMed] [Google Scholar]
- 28.Charidimou A, Frosch MP, Al-Shahi Salman R, et al. Advancing diagnostic criteria for sporadic cerebral amyloid angiopathy: study protocol for a multicenter MRI-pathology validation of Boston criteria v2.0. Int J stroke 2019;14:956–971. [DOI] [PubMed] [Google Scholar]
- 29.Smith EE, Beaudin AE. New insights into cerebral small vessel disease and vascular cognitive impairment from MRI. Curr Opin Neurol 2018;31:36–43. [DOI] [PubMed] [Google Scholar]
- 30.Wardlaw JM, Smith C, Dichgans M. Mechanisms of sporadic cerebral small vessel disease: insights from neuroimaging. Lancet Neurol 2013;12:483–497. [DOI] [PMC free article] [PubMed] [Google Scholar]
Associated Data
This section collects any data citations, data availability statements, or supplementary materials included in this article.
Data Availability Statement
The authors certify they have documented all data, methods, and materials used to conduct the research presented. Anonymized data pertaining to the research presented will be made available upon reasonable request from external investigators.


