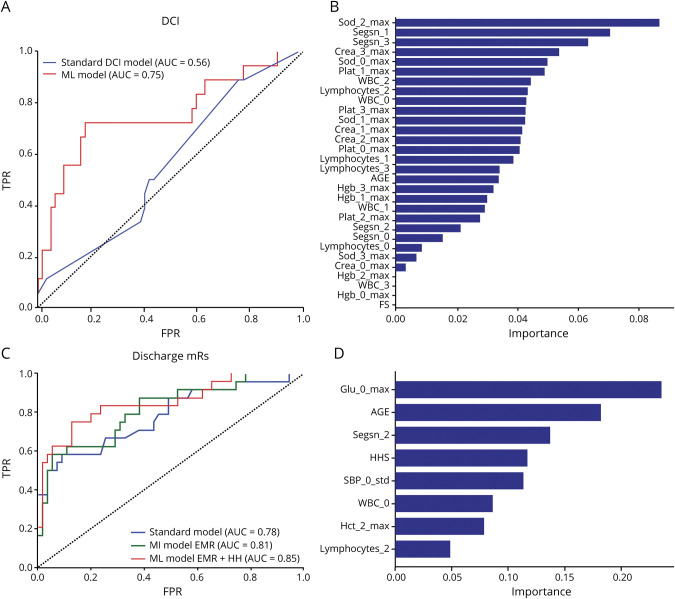
Figure 2. Evaluation of Machine Learning (ML) Model and Standard Model Performance on the Same Test/Evaluation Set.
(A) Comparison of receiver operating characteristic (ROC) curves of the standard delayed cerebral ischemia (DCI) prediction model with the ML model. The area under the ROC curve (AUC) of the ML model (0.75 ± 0.07, 95% confidence interval [CI] 0.65 to 0.84) was higher (0.19 ± 0.11, 95% CI −0.02 to 0.42, p = 0.08, DeLong test) than the AUC of the standard model (0.56 ± 0.07, 95% CI 0.44 to 0.66). The standard model is a logistic regression model that included age and the modified Fisher score. The ML model included the modified Fisher score and other variables including white blood cells (WBC), neutrophils, lymphocytes, platelets, creatinine, sodium, and hemoglobin. (B) Variables used in the ML model are ranked by the gradient boost model based on their importance. Among the 31 variables included in the ML model, variables pertaining to serum sodium, neutrophil, creatinine, and WBC count levels during the pre-DCI phase were ranked most important in predicting impending DCI. (C) Comparison of the standard model and 2 ML models (one that included only electronic medical record [EMR] variables and another that included both EMR variables and the Hunt-Hess scale [HH] score). The standard model is a logistic regression model that included age and HH score. The AUC of the ML model that included only EMR variables (0.81 ± 0.05, 95% CI 0.71 to 0.89) was higher than the AUC of the standard model (0.78 ± 0.06, 95% CI 0.67 to 0.86), but the differences were not statistically significant (p = 0.6). The AUC of the ML model that included both the EMR measures and the HH score (0.85 ± 0.05, 95% CI 0.75 to 0.92) was significantly higher than the AUC of the standard model (p = 0.05, DeLong test) (D) Variables in the best ML model were ranked using the random forest model to identify relative importance of variables in prognosticating discharge outcomes. The variables are named with the prefix of the EMR measure (e.g., Sod = sodium), followed by the day in which it was recorded and then the aggregation (max, min, SD, or average). For instance, Sod_3_Max denotes the maximum value of sodium levels at day 3 after admission. Besides age and clinical severity, glucose levels at admission, segmented neutrophil count, and variations in systolic blood pressure were ranked among the top variables used by the model. mRS = modified Rankin Scale; SBP = systolic blood pressure.

