

Abstract
Objective
To determine whether ibudilast has an effect on brain volume and new lesions in progressive forms of multiple sclerosis (MS).
Methods
A randomized, placebo-controlled, blinded study evaluated ibudilast at a dose of up to 100 mg over 96 weeks in primary and secondary progressive MS. In this secondary analysis of a previously reported trial, secondary and tertiary endpoints included gray matter atrophy, new or enlarging T2 lesions as measured every 24 weeks, and new T1 hypointensities at 96 weeks. Whole brain atrophy measured by structural image evaluation, using normalization, of atrophy (SIENA) was a sensitivity analysis.
Results
A total of 129 participants were assigned to ibudilast and 126 to placebo. New or enlarging T2 lesions were observed in 37.2% on ibudilast and 29.0% on placebo (p = 0.82). New T1 hypointense lesions at 96 weeks were observed in 33.3% on ibudilast and 23.5% on placebo (p = 0.11). Gray matter atrophy was reduced by 35% for those on ibudilast vs placebo (p = 0.038). Progression of whole brain atrophy by SIENA was slowed by 20% in the ibudilast group compared with placebo (p = 0.08).
Conclusion
Ibudilast treatment was associated with a reduction in gray matter atrophy. Ibudilast treatment was not associated with a reduction in new or enlarging T2 lesions or new T1 lesions. An effect on brain volume contributes to prior data that ibudilast appears to affect markers associated with neurodegenerative processes, but not inflammatory processes.
Classification of Evidence
This study provides Class II evidence that for people with MS, ibudilast does not significantly reduce new or enlarging T2 lesions or new T1 lesions.
Ibudilast is a small molecule phosphodiesterase (PDE) inhibitor of PDE3A, PDE4, PDE10, and PDE11, with additional inhibitory effects on macrophage inhibitory factor and Toll-like receptor 4.1–3 A phase 2, placebo-controlled trial in 297 patients with relapsing-remitting multiple sclerosis (MS) did not reveal a benefit on annualized relapse rate or new MRI lesions.4 However, a 33% reduction in percent brain volume change (PBVC) was observed at 12 months for those taking the 60 mg dose (p = 0.04). A post hoc analysis demonstrated that the proportion of new lesions evolving into persistent black holes was lower for those taking the 60 mg (0.14; p = 0.004) and 30 mg (0.17; p = 0.036) doses, compared to those assigned to placebo (0.24).4 An exploratory analysis found less confirmed disability progression for those on active treatment for 2 years. As these results suggested a benefit on brain atrophy, tissue integrity, and disability, NN102/SPRINT-MS (NeuroNEXT 102/Secondary and Primary Progressive Ibudilast NeuroNEXT Trial in Multiple Sclerosis) was conducted in people with progressive forms of MS.
SPRINT-MS (Secondary and Primary Progressive Ibudilast NeuroNEXT Trial in Multiple Sclerosis) was a phase 2, placebo-controlled, multicenter, randomized, double-blind, parallel-group, 96-week trial to evaluate the efficacy and safety of ibudilast at a dose between 60 and 100 mg per day.5 The primary endpoint, whole brain atrophy as measured by brain parenchymal fraction (BPF), was reduced by 48% with ibudilast treatment over 96 weeks. Ibudilast was also associated with relative preservation of normal-appearing brain tissue magnetization transfer ratio and slowed cortical atrophy.
Here, we report the effects of ibudilast on additional MRI analyses performed during SPRINT-MS. These include the effect on T2-weighted (T2) lesions, T1-weighted (T1) hypointense lesion count, gray matter atrophy, and a sensitivity analysis of whole brain atrophy using structural image evaluation, using normalization, of atrophy (SIENA).6
Methods
Standard Protocol Approvals, Registrations, and Patient Consents
The SPRINT-MS study (ClinicalTrials.gov identifier NCT01982942) was approved by a central institutional review board and conducted in accordance with the International Council for Harmonisation guidelines for Good Clinical Practice and the Declaration of Helsinki. All patients provided written informed consent prior to screening.
Study Design
SPRINT-MS was a 96-week, phase 2, randomized, multicenter, parallel-group, placebo-controlled study that evaluated the efficacy and safety of ibudilast in progressive forms of MS, as previously reported.5 The present analyses were conducted to determine the effect of ibudilast on new MRI lesions and brain volumes (Class II). Participants with primary progressive (PP) and secondary progressive (SP) MS could remain on their established injectable MS therapies, with randomization to ibudilast or placebo. MRI scans from each site were evaluated in a blinded manner by qualified personnel at 2 central reading facilities. BPF and gray matter atrophy were analyzed at Cleveland Clinic Foundation (OH). T2-weighted lesions, T1-weighted lesions, and SIENA were analyzed by NeuroRx Research (Montreal, Canada).
T2 hyperintense and T1 hypointense lesion volumes were determined at baseline. An initial segmentation of T2 lesions was performed by an expert, trained MRI reader using starting labels generated by in-house software at NeuroRx that incorporated a multispectral Bayesian classifier with anatomical priors.7 Lesion maps were reviewed by the reader, and false-positives and false-negatives were corrected. A revised set of labels was then created, incorporating any changes, and reviewed by the reader to finalize a corrected set of lesion labels, from which the total T2 lesion volume was computed. T1 lesions were defined as regions inside T2 lesions with an intensity ≤84% of surrounding normal-appearing white matter on the T1-weighted image and identified using in-house software at NeuroRx. An expert reader reviewed all labels and made corrections if necessary.
New or enlarging (N/E) T2 lesion counts were determined at 24, 48, 72, and 96 weeks using in-house software as previously described, and reviewed by an expert reader and corrected if necessary.8 T2 hyperintense and T1 hypointense lesion volumes were assessed at baseline and 96 weeks. T1 lesions were defined as regions inside T2 lesions with an intensity ≤84% of surrounding normal-appearing white matter on the T1-weighted image, and were identified using in-house software at NeuroRx. An expert reader reviewed all labels and made corrections if necessary. N/E T1 lesions at 96 weeks with respect to baseline were identified on registered images by performing a spatial operation of the N/E T2 lesion label computed at 96 weeks with respect to baseline with the T1 lesion label at 96 weeks, and then removing any voxels that were identified as T1 lesion at baseline. Labels were generated by in-house software developed at NeuroRx and were reviewed by an expert reader and corrected if necessary.
Because prior studies demonstrated no effect on active lesions, gadolinium was not administered for this protocol, which also allowed imaging time to be devoted to advanced imaging sequences. Fractional brain volume was previously reported as BPF, a method that evaluates the ratio of brain tissue volume to the total volume within the outer surface contour of the brain. For this report, SIENA PBVC was assessed from baseline to 24, 48, 72, and 96 weeks. SIENA is a longitudinal brain atrophy method that detects the change in brain surface between 2 time points, with the scaling of the longitudinal registration constrained by the skull. Gray matter fraction (GMF) utilized gray matter segmentation and pairwise Jacobian integration.9,10 The primary endpoint, previously reported, was the difference over 96 weeks in the change of BPF by treatment allocation. Analysis of T2 and T1 lesion volumes was defined in the protocol as secondary analyses, N/E T2 lesion count, N/E T1 lesion count, and 96 weeks GMF were tertiary analyses, and PBVC determined by SIENA was included in the protocol as a sensitivity analysis, to determine the robustness of the primary outcome of a change in brain volume with different methodologies.
Statistical Analyses
Results were analyzed on a modified intention-to-treat (mITT) population, defined as all patients who were randomized, received at least 1 dose of their treatment allocation, and had at least 1 efficacy assessment after baseline. Data collected at early withdrawal visits were used to replace the next scheduled visit.
The incidence (at least 1 lesion) and frequency (total number) of T1 and T2 lesion counts were compared between treatment groups using distinct models for each lesion type. N/E T2 lesions were aggregated over the entire study period. The incidence of T1 and T2 lesions was modeled using logistic regression adjusted for time on study and the randomization strata. The estimated odds ratio (OR) of 1 or more lesions from baseline to end of study for ibudilast vs placebo and the corresponding 95% confidence interval (CI) from the model are given. The frequency of T1 and T2 lesions were assessed using negative binomial regression models with an offset of months on study. Akaike information criterion (AIC) was used to select the negative binomial distribution over the Poisson. The model was adjusted for the randomization strata covariates. We estimated the rate ratio of lesions for ibudilast vs placebo along with the 95% CI.
The difference in the change (post − pre) in T1 and T2 lesion volume was evaluated using separate rank-based nonparametric random intercept linear mixed models (LMMs) due to the skewed distribution of the lesion volumes. Models included an interaction of visit (categorical) and treatment and adjusted for the randomization strata and months since randomization of the visit. We report the p value from the rank-based LMM and estimates from a model based on the untransformed values for ease of interpretation. Rates of change in GMF were compared between treatment groups using an LMM. PBVC by SIENA was modeled using an LMM with adjustment for baseline BPF. Both models adjusted for the randomization strata, disease subtype, and concurrent use or nonuse of immunomodulating therapy. The GMF and PBVC models included a shared baseline between treatment groups and a fixed effect interaction of month of visit and treatment. For both GMF and PBVC models, AIC indicated the linear fit was optimal over the nonlinear for both models. The LMMs included a subject-specific random intercept and slope and an unstructured covariance structure. No adjustment for multiplicity was utilized. Statistical analyses were performed in SAS 9.4 (SAS Institute, Cary, NC).
The primary outcome of change in BPF was powered at 80% for an effect size of ≥33% with type I error rate of 0.10.
Data Availability
Any data not published within the article are available in a public repository and include digital object identifiers (doi) or accession numbers to the datasets or where stated that anonymized data will be shared by request from any qualified investigator.
Results
Baseline Demographic and Disease Characteristics
At baseline, 129 participants were randomized to ibudilast and 126 were randomized to placebo (figure 1). The mITT cohort with at least a baseline MRI included 244 participants (121 ibudilast, 123 placebo). Groups were generally well balanced (table 1), with the placebo group slightly older (mean 55 ± 8 years for ibudilast vs 57 ± 7 years for placebo, p = 0.02). Baseline demographics and disease characterization were notable in that the majority were women, about one-third were receiving an injectable disease-modifying therapy, median disease duration was about 10 years, median Expanded Disability Status Scale (EDSS) score was 6.0, and the median timed 25-foot walk was between 9 and 10 seconds. Baseline mean BPF was 0.80 ± 0.03 and baseline mean T2-weighted lesion volume was 10 ± 11 cm3 for both groups.
Figure 1. CONSORT (Consolidated Standards of Reporting Trials) Diagram.

A schematic of patient disposition in NN102/SPRINT-MS (NeuroNEXT 102/Secondary and Primary Progressive Ibudilast NeuroNEXT Trial in Multiple Sclerosis).
Table 1.
Baseline Demographics

Brain Lesion Counts
New/Enlarging T2 Hyperintense Lesion Counts
The majority of participants (>60%) had 0 median N/E T2 lesions over the 96-week study, irrespective of treatment assignment (figure 2A). N/E T2 lesions were observed in 45 participants (37.2%) assigned to ibudilast and 48 (39.0%) on placebo. Mean N/E T2 lesions over the study was 3.1 ± 9.6 for those on ibudilast and 2.1 ± 6.5 for those on placebo (figure 2B). The OR of 1 or more N/E T2 lesions from baseline to end of study for ibudilast vs placebo was 0.94 (95% CI 0.56–1.59; p = 0.83). The rate ratio of N/E T2 lesions over 96 weeks was 1.24 (95% CI 0.64–2.39; p = 0.53).
Figure 2. New or Enlarging T2 by Category [0, 1, 2, 3+] Over 96 Weeks and Means at 24, 48, 72, and 96 Weeks.

(A) Most study participants had a median 0 new or enlarging T2 lesions over 96 weeks, with no observed difference between treatment assignments. (B) For mean new or enlarging lesions, no differences were observed for each 24-week interval and summed intervals over 96 weeks.
T2-Hyperintense Lesion Volumes
Baseline T2 lesion volume for ibudilast was 10.56 ± 11.27 cm3 and 10.37 ± 11.33 for placebo. At 96 weeks, T2 lesion volume was 10.98 ± 11.59 for ibudilast and 11.02 ± 11.68 for placebo. Adjusting for disease subtype and use of injectable disease-modifying therapy, no difference was noted for the change in T2 lesion volume with ibudilast (0.37 cm3, 95% CI 0.08–0.65) vs placebo (0.45, 95% CI 0.17–0.73). The estimated mean difference in T2 lesion volume with ibudilast vs placebo from week 96 compared to baseline was −0.08 cm3 (95% CI −0.48 to 0.32, p = 0.62).
T1 Hypointense Lesions
N/E T1 hypointense lesions on the week 96 brain MRI, compared to baseline, were present in 33.3% (36/108) on ibudilast and 23.5% (27/115) on placebo (p = 0.10) (figure 3A). The median number of new T1 hypointensities at 96 weeks was 0 for ibudilast (mean 1.46 ± 3.3, maximum 23) and 0 for placebo (mean 0.72 ± 2.03, maximum 16). The OR for 1 for more N/E T1 hypointense lesions for ibudilast vs placebo was 1.62 (95% CI 0.90–2.93, p = 0.11). The rate ratio of N/E T1 hypointense lesions based upon regression model was 1.57 (95% CI 0.77–3.21, p = 0.21).
Figure 3. T1 Hypointense Lesion Counts and Volume Changes Over 96 Weeks.
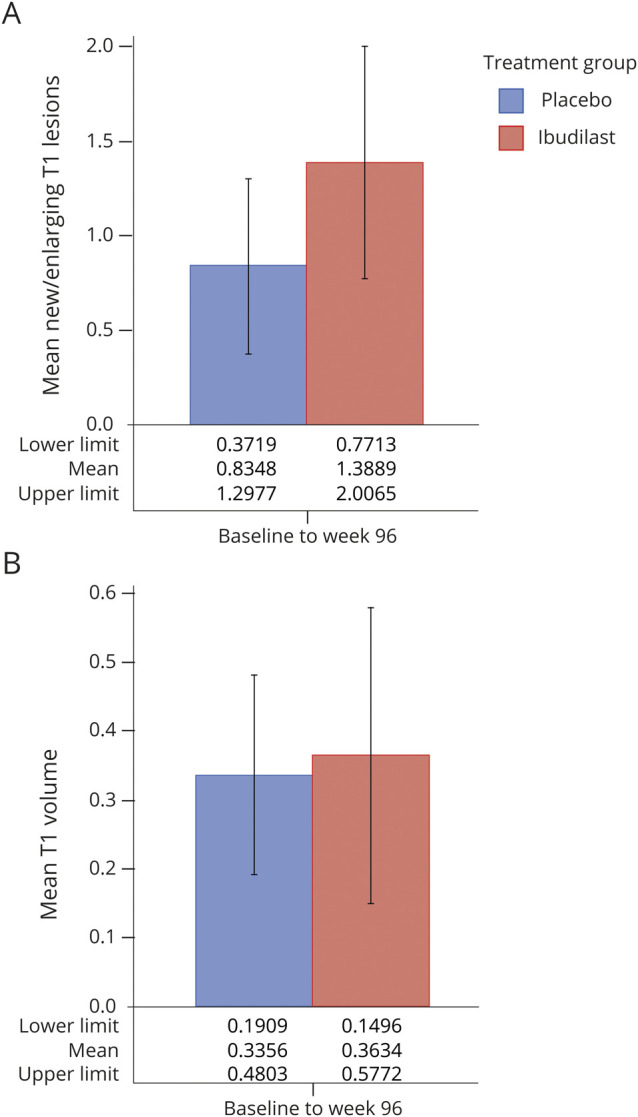
Ibudilast was not associated with (A) fewer T1 lesion counts or (B) an improvement in T1 lesion volume over the 96-week study.
Baseline T1 hypointense lesion volume for ibudilast was 3.66 ± 5.23 cm3 and 3.26 ± 4.56 for placebo. At 96 weeks, T1 lesion volume was 4.52 ± cm3 7.49 for ibudilast and 3.38 ± 3.50 for placebo (figure 3B). Adjusting for disease subtype and use of injectable disease-modifying therapy, no difference was observed for the increase in T1 lesion volume with ibudilast (0.36, 95% CI 0.18–0.54) or placebo (0.34, 95% CI 0.16–0.51, p = 0.22). The estimated mean difference in new T1 hypointense lesion volume with ibudilast vs placebo from week 96 compared to baseline was 0.03 (95% CI −0.23 to 0.28).
Brain Volume Changes
Gray Matter Atrophy
GMF was determined using the entire mITT population of 244. Number of participants with a 96-week MRI was 221 (91%), including 103 of 108 on ibudilast and 111 of 113 on placebo. Based upon a fitted model, the estimated difference in mean rate of GMF change over the study period for ibudilast was −0.09% (95% CI −0.13% to −0.06%), compared to −0.14% (95% CI −0.18% to −0.11%) for placebo, reflecting a 35% treatment effect (p = 0.038, figure 4A).
Figure 4. Gray Matter Fraction (GMF) and Percent Brain Volume Change (PBVC) by Treatment at 24, 48, 72, and 96 Weeks.

(A) GMF atrophy was reduced for the ibudilast-assigned group over the 96 weeks. (B) Brain atrophy by SIENA was lower with ibudilast (p = 0.08). Brain MRI was obtained at baseline and every 6 months through week 96. SIENA was determined from week 24 to baseline, week 48 to week 24, week 72 to week 48, and week 96 to week 72. Slope with 95% confidence intervals (CIs) was determined using linear mixed models with disease subtype and concurrent use of disease-modifying therapy. The SIENA model also adjusted for baseline BPF.
Whole Brain Atrophy by SIENA
Whole brain atrophy by SIENA was also determined on the entire mITT population. MRI scans that met quality control for determining whole brain atrophy by the SIENA method at 96 weeks included 82 of the 108 on ibudilast at 96 weeks (76%) and 80 of the 113 on placebo (71%). The estimated difference in change in PBVC over the study period for ibudilast was −1.1054 (95% CI −1.3454 to −0.8654), compared to −1.3809 (95% CI −1.6237 to −1.1382) for placebo, a 20% reduction (p = 0.08, figure 4B, table 2, figure 5).
Table 2.
Descriptive Statistics for Structural Image Evaluation, Using Normalization, of Atrophy (SIENA) by Time Points
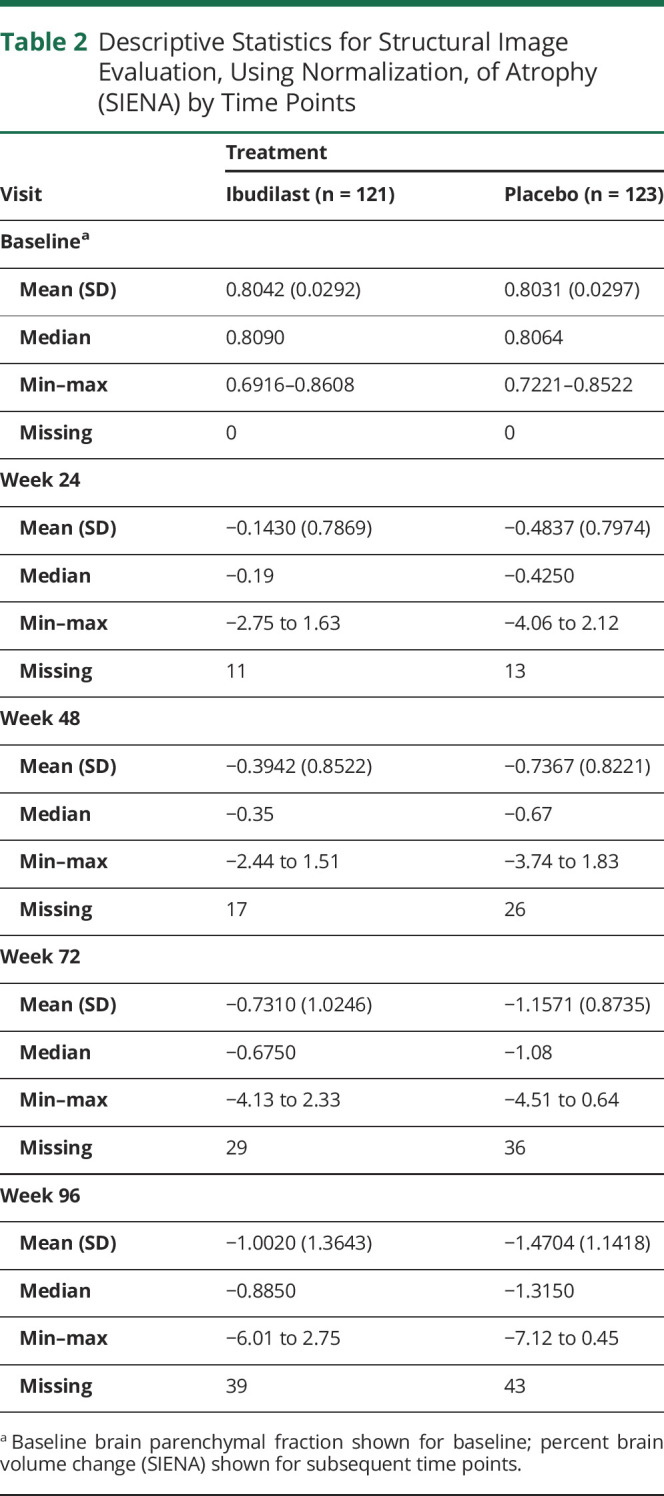
Figure 5. Participant Change in Percent Brain Volume Change (PBVC) by Treatment Arm.

Discussion
In the present analysis, ibudilast treatment, compared to placebo, was associated with a 35% relative slowing of gray matter atrophy over 96 weeks. Similarly, PBVC by SIENA demonstrated a 20% reduction in whole brain atrophy. These reductions in GMF and PBVC supplement and corroborate the previously reported data demonstrating a 48% slowing in whole brain atrophy measured by BPF and an 82% reduction in progression of cortical atrophy.5 As demonstrated in a previous phase 2 trial of ibudilast in relapsing MS, the present study observed no benefit on reducing N/E T2 lesions. In contrast to the relapsing phase 2 study, SPRINT-MS found no treatment effect on T1 hypointensities at 96 weeks.
Gray matter atrophy has been identified as a potential biomarker of neurodegeneration.11–13 Deep gray matter has been shown to be the region with the highest rate of volume loss in MS, with rates exceeding those observed for whole brain. A recent report by the MAGNIMS Study Group found the decline in deep gray matter volume was −1.66%/year for PPMS and −1.45%/year for SPMS, whereas whole brain was −0.46%/year for PPMS and −0.38%/year for SPMS.14 Gray matter volume loss is not just an important marker for neurodegenerative processes in MS, but one with established clinical implications. Gray matter atrophy has been associated with worsening EDSS scores, ambulation, and cognition.14,15 Lower deep gray matter volume at baseline has been demonstrated to predict EDSS progression and cognitive decline.14,16
Reduced whole brain atrophy has been associated with a relative reduction in disability progression, highlighting its importance as an imaging marker in phase 2 progressive MS trials.17 Several methodologies are available for determining brain volume change. Thus, the protocol included a sensitivity analysis using SIENA to supplement the robustness of a treatment effect for the primary outcome using BPF. Indeed, ibudilast was associated with a favorable rate of longitudinal brain volume changes using 2 different methodologies, when compared to placebo. The present article reports the SIENA longitudinal registration technique, which aligns 2 serial scans to determine the PBVC.6 BPF is a segmentation technique that segments brain parenchyma and brain's outer contour and is determined from each scan as the ratio of brain parenchymal volume to the volume contained within the outer contour of the brain.18 Studies have suggested that a registration technique such as SIENA or Jacobian integration may have better performance characteristics compared to segmentation-based techniques, but these comparisons have not included the original version of BPF.9,19 The original version of BPF, which has demonstrated a treatment effect among many MS medications, was applied in the SPRINT-MS study.20–23 A separate study (168 scans from 24 patients with MS) using the original BPF showed similar short-term rate of atrophy compared to SIENA with a correlation coefficient of 0.857.24 Both BPF and SIENA have been used successfully in MS clinical trials and both appear to be robust, so clear conclusions regarding superior methods for preference are challenging to invoke.20,21,25–31
The relative reduction in brain atrophy progression between the 2 measures appeared different in SPRINT-MS. The protocol-defined primary endpoint of BPF demonstrated a 48% reduction in brain atrophy (p = 0.04). The 20% reduction of PBVC by SIENA, done as a sensitivity analysis, was numerically lower than that measured by BPF, along with a slightly larger p value (p = 0.08). In the present analysis, over the course of the study, 166 SIENA data points were dropped because of quality control problems, but only 25 BPF datapoints did not meet quality control. To determine relative sensitivities, BPF was reanalyzed using the same MRI scans available for the SIENA analysis, and this post hoc analysis demonstrated a decrease in BPF at 48 weeks of −0.0011 compared to −0.0016 (p = 0.26). SIENA exclusions were because of scanner upgrades (across which SIENA calculations are deemed invalid) and higher-quality control requirements (e.g., geometric distortions, for which BPF may have greater resilience). Related to this, while BPF was calculated on 2D turbo spin-echo fluid-attenuated inversion recovery and T2 images (for which the BPF method was optimized), the SIENA measurements were performed on T1-weighted images, the image contrast for which the SIENA method was developed and optimized.32 The T1-weighed images available in this study were acquired using a 3D gradient-recalled echo sequence, which may be more susceptible to geometric distortions on some scanners.33–35 The loss of some SIENA datapoints to these issues may have led to a loss of study power and potentially a decrease in the relative percent reduction. For the prior relapsing MS phase 2 trial, PBVC by SIENA over 1 year was reduced by 34% for those assigned to ibudilast compared to placebo, a result that is similar to the percent reduction observed in the present study.4 In addition, the present study found that both gray matter atrophy and cortical thickness (86% slowing, p = 0.0036) appeared as 2 particularly robust measures in a 2-year progressive MS study.
Similar to its counterpart phase 2 study in relapsing MS, ibudilast demonstrated no effect in reducing N/E T2 lesion count or volume in the current progressive MS study. This suggests the mechanisms of action of the drug exert neuroprotective effects aside from overt anti-inflammatory effects. This also suggests that the reduction in whole brain and gray matter atrophy does not simply reflect a subsequent effect of reducing white matter lesion formation.
The present study has limitations. As a phase 2 study, power and sample size were not determined for these additional endpoints. Results are reported without correction for multiple statistical tests and should be interpreted within that context. Further exploration of these endpoints should be considered in a larger study. A number of brain MRIs did not meet SIENA quality control and had to be excluded from analysis. As gadolinium contrast and frequent MRI scans were included in the protocol, conversion of new gadolinium-enhancing lesions into chronic black holes was not able to be performed. Exclusion of nonenhancing or re-enhancing T1 hypointensities was not able to be determined. While the slight increased odds and rates of 96-week T1 hypointensities was not consistent with the data in relapsing MS, only a study with the appropriate design could address gadolinium to persistent T1 hypointensity conversions.
The SPRINT-MS trial has demonstrated a consistent beneficial effect of ibudilast on brain tissue volume in progressive MS, as evidenced by GMF and PBVC using SIENA, in addition to previously reported benefits on whole brain atrophy as measured by BPF and cortical thickness. Effective treatment for progressive MS remains a major unmet need. MRI effects in this 96-week, phase 2 study provides support to investigate possible clinical benefits in a larger phase 3 study. In addition, our results are a reminder that active inflammation as measured by N/E T2 lesions continues in progressive MS and trials of putative neuroprotective therapies may benefit from concomitant use with effective anti-inflammatory therapies.
Acknowledgment
The authors thank the persons with multiple sclerosis and their families for participation in the trial.
Glossary
- AIC
Akaike information criterion
- BPF
brain parenchymal fraction
- CI
confidence interval
- EDSS
Expanded Disability Status Scale
- GMF
gray matter fraction
- LMM
linear mixed model
- mITT
modified intention-to-treat
- MS
multiple sclerosis
- N/E
new or enlarging
- NN102/SPRINT-MS
NeuroNEXT 102/Secondary and Primary Progressive Ibudilast NeuroNEXT Trial in Multiple Sclerosis
- OR
odds ratio
- PBVC
percent brain volume change
- PDE
phosphodiesterase
- PP
primary progressive
- SIENA
structural image evaluation, using normalization, of atrophy
- SP
secondary progressive
- SPRINT-MS
Safety, Tolerability and Activity Study of Ibudilast in Subjects With Progressive Multiple Sclerosis
Appendix 1. Authors

Appendix 2. Coinvestigators

Footnotes
Editorial, page 141
Class of Evidence: NPub.org/coe
Study Funding
Supported by grants from the National Institute of Neurologic Disorders and Stroke (NINDS) (U01NS082329) and the National Multiple Sclerosis Society (RG 4778-A-6) and by MediciNova through a contract with the NIH. The NeuroNEXT Network is supported by the NINDS (Central Coordinating Center, U01NS077179; Data Coordinating Center, U01NS077352; and individual grants to each trial site). The content of this article is solely the responsibility of the authors and does not necessarily represent the official views of the NIH.
Disclosure
R.T. Naismith has consulted for Alexion, Alkermes, Bayer AG, Biogen, Celgene, EMD Serono, Genentech, Genzyme, NervGen, Novartis, TG Therapeutics, Third Rock Ventures, and Viela Bio. R.A. Bermel has served as a consultant for Biogen, Genzyme, Genentech, and Novartis. He receives research support from Biogen, Genentech, and Novartis, and shares rights to intellectual property underlying the Multiple Sclerosis Performance Test, currently licensed to Qr8 Health and Biogen. C.S. Coffey reports no disclosures relevant to this manuscript. A.D. Goodman has received personal compensation for consulting from Adamas, EMD-Serono, MedDay, Greenwich Bioscience, Celgene, Teva, Sun Pharma, Novartis, Sanofi Genzyme, Genentech-Roche, Biogen, Atara, and Acorda Therapeutics and received research support from Teva, Sun Pharma, Novartis, Sanofi Genzyme, Genentech-Roche, Biogen, Atara, and Acorda Therapeutics. J. Fedler and M. Kearney report no disclosures relevant to this manuscript. E.C. Klawiter has received consulting fees from Alexion, Biogen, EMD Serono, Genentech, and MedDay and research funding from AbbVie, Biogen, EMD Serono, Genzyme, and Roche. K. Nakamura has received personal licensing fee from Biogen, consulting fee from NeuroRx, and speaking fee from Sanofi Genzyme and research grant funding from Sanofi Genzyme and Biogen. S. Narayanan is a part-time employee of NeuroRx Research, has served on an advisory board for Genentech, has received travel funding from MedDay, and research funding from Immunotec. C. Goebel, J. Yankey, and E. Klingner report no disclosures relevant to this manuscript. R. Fox has received personal consulting fees from Actelion, Biogen, Celgene, EMD Serono, Genentech, Immunic, Novartis, and Teva; served on advisory committees for Actelion, Biogen, Immunic, and Novartis; and received clinical trial contract and research grant funding from Biogen and Novartis. Go to Neurology.org/N for full disclosures.
References
- 1.Cho Y, Crichlow GV, Vermeire JJ, et al. Allosteric inhibition of macrophage migration inhibitory factor revealed by ibudilast. Proc Natl Acad Sci USA 2010;107:11313–11318. [DOI] [PMC free article] [PubMed] [Google Scholar]
- 2.Ruiz-Pérez D, Benito J, Polo G, et al. The effects of the toll-like receptor 4 antagonist, ibudilast, on sevoflurane's minimum alveolar concentration and the delayed remifentanil-induced increase in the minimum alveolar concentration in rats. Anesth Analgesia 2016;122:1370–1376. [DOI] [PubMed] [Google Scholar]
- 3.Gibson LCD, Hastings SF, McPhee I, et al. The inhibitory profile of Ibudilast against the human phosphodiesterase enzyme family. Eur J Pharmacol 2006;538:39–42. [DOI] [PubMed] [Google Scholar]
- 4.Barkhof F, Hulst HE, Drulović J, Uitdehaag BMJ, Matsuda K, Landin R. Ibudilast in relapsing-remitting multiple sclerosis a neuroprotectant? Neurology 2010;74:1033–1040. [DOI] [PubMed] [Google Scholar]
- 5.Fox RJ, Coffey CS, Conwit R, et al. Phase 2 trial of ibudilast in progressive multiple sclerosis. New Engl J Med 2018;379:846–855. [DOI] [PMC free article] [PubMed] [Google Scholar]
- 6.Smith SM, Zhang Y, Jenkinson M, et al. Accurate, robust, and automated longitudinal and cross-sectional brain change analysis. Neuroimage 2002;17:479–489. [DOI] [PubMed] [Google Scholar]
- 7.Francis SJ. Automatic Lesion Identification in MRI of Multiple Sclerosis Patients [Master's Thesis]. Montreal: McGill University; 2005. [Google Scholar]
- 8.Elliott C, Arnold DL, Collins DL, Arbel T. Temporally consistent probabilistic detection of new multiple sclerosis lesions in brain MRI. IEEE Trans Med Imaging 2013;32:1490–1503. [DOI] [PubMed] [Google Scholar]
- 9.Nakamura K, Guizard N, Fonov VS, Narayanan S, Collins DL, Arnold DL. Jacobian integration method increases the statistical power to measure gray matter atrophy in multiple sclerosis. Neuroimage Clin 2013;4:10–17. [DOI] [PMC free article] [PubMed] [Google Scholar]
- 10.Nakamura K, Fisher E. Segmentation of brain magnetic resonance images for measurement of gray matter atrophy in multiple sclerosis patients. Neuroimage 2009;44:769–776. [DOI] [PMC free article] [PubMed] [Google Scholar]
- 11.Cifelli A, Arridge M, Jezzard P, Esiri MM, Palace J, Matthews PM. Thalamic neurodegeneration in multiple sclerosis. Ann Neurol 2002;52:650–653. [DOI] [PubMed] [Google Scholar]
- 12.Fisniku LK, Chard DT, Jackson JS, et al. Gray matter atrophy is related to long-term disability in multiple sclerosis. Ann Neurol 2008;64:247–254. [DOI] [PubMed] [Google Scholar]
- 13.Pirko I, Lucchinetti CF, Sriram S, Bakshi R. Gray matter involvement in multiple sclerosis. Neurology 2007;68:634–642. [DOI] [PubMed] [Google Scholar]
- 14.Eshaghi A, Prados F, Brownlee WJ, et al. Deep gray matter volume loss drives disability worsening in multiple sclerosis. Ann Neurol 2018;83:210–222. [DOI] [PMC free article] [PubMed] [Google Scholar]
- 15.Fisher E, Lee JC, Nakamura K, Rudick RA. Gray matter atrophy in multiple sclerosis: a longitudinal study. Ann Neurol 2008;64:255–265. [DOI] [PubMed] [Google Scholar]
- 16.Eijlers AJC, van Geest Q, Dekker I, et al. Predicting cognitive decline in multiple sclerosis: a 5-year follow-up study. Brain 2018;141:2605–2618. [DOI] [PubMed] [Google Scholar]
- 17.Sormani MP, Arnold DL, De Stefano N. Treatment effect on brain atrophy correlates with treatment effect on disability in multiple sclerosis. Ann Neurol 2014;75:43–49. [DOI] [PubMed] [Google Scholar]
- 18.Fisher E, Cothren JRM, Tkach JA, Masaryk TJ, Cornhill JF. Knowledge-based 3D segmentation of the brain in MR images for quantitative multiple sclerosis lesion tracking. SPIE 1997;3034:19–25. [Google Scholar]
- 19.Durand-Dubief F, Belaroussi B, Armspach JP, et al. Reliability of longitudinal brain volume loss measurements between 2 sites in patients with multiple sclerosis: comparison of 7 quantification techniques. Am J Neuroradiol 2012;33:1918–1924. [DOI] [PMC free article] [PubMed] [Google Scholar]
- 20.Miller DH, Soon D, Fernando KT, et al. MRI outcomes in a placebo-controlled trial of natalizumab in relapsing MS. Neurology 2007;68:1390–1401. [DOI] [PubMed] [Google Scholar]
- 21.Arnold DL, Fisher E, Brinar VV, et al. Superior MRI outcomes with alemtuzumab compared with subcutaneous interferon β-1a in MS. Neurology 2016;87:1464–1472. [DOI] [PMC free article] [PubMed] [Google Scholar]
- 22.Nakamura K, Mokliatchouk O, Arnold DL, et al. Effects of dimethyl fumarate on brain volume change in relapsing-remitting multiple sclerosis: a pooled analysis of the phase 3 DEFINE and CONFIRM Studies (P3. 2-064). Neurology 2019;92 (15 suppl). [DOI] [PMC free article] [PubMed] [Google Scholar]
- 23.Fisher E, Cothren R, Tkach J, Masaryk T, Cornhill JF. Knowledge-based 3D segmentation of the brain in MR images for quantitative multiple sclerosis lesion tracking. SPIE 1997;3034:19–25. [Google Scholar]
- 24.Nakamura K, Jones S, Van Hecke W, et al. Comparison of brain atrophy measurement techniques in a longitudinal study of multiple sclerosis patients with frequent MRIs (P4. 376). Neurology 2017;88 (16 suppl). [Google Scholar]
- 25.Miller DH, Barkhof F, Frank JA, Parker GJM, Thompson AJ. Measurement of atrophy in multiple sclerosis: pathological basis, methodological aspects and clinical relevance. Brain 2002;125:1676–1695. [DOI] [PubMed] [Google Scholar]
- 26.Favaretto A, Lazzarotto A, Margoni M, Poggiali D, Gallo P. Effects of disease modifying therapies on brain and grey matter atrophy in relapsing remitting multiple sclerosis. Mult Scler Demyel Disord 2018;3:1. [Google Scholar]
- 27.Rudick R, Fisher E, Lee JC, Simon J, Jacobs L; Group MSCR. Use of the brain parenchymal fraction to measure whole brain atrophy in relapsing-remitting MS. Neurology 1999;53:1698. [DOI] [PubMed] [Google Scholar]
- 28.Hardmeier M, Wagenpfeil S, Freitag P, et al. Rate of brain atrophy in relapsing MS decreases during treatment with IFNβ-1a. Neurology 2005;64:236–240. [DOI] [PubMed] [Google Scholar]
- 29.Cohen JA, Coles AJ, Arnold DL, et al. Alemtuzumab versus interferon beta 1a as first-line treatment for patients with relapsing-remitting multiple sclerosis: a randomised controlled phase 3 trial. Lancet 2012;380:1819–1828. [DOI] [PubMed] [Google Scholar]
- 30.O'Connor P, Wolinsky JS, Confavreux C, et al. Randomized trial of oral teriflunomide for relapsing multiple sclerosis. N Engl J Med 2011;365:1293–1303. [DOI] [PubMed] [Google Scholar]
- 31.Radue EW, Sprenger T, Gaetano L, et al. Teriflunomide slows BVL in relapsing MS: a reanalysis of the TEMSO MRI data set using SIENA. Neurol Neuroimmunol Neuroinflamm 2017;4:e390. [DOI] [PMC free article] [PubMed] [Google Scholar]
- 32.Smith SM, De Stefano N, Jenkinson M, Matthews PM. Normalized accurate measurement of longitudinal brain change. J Comput Assist Tomograph 2001;25:466–475. [DOI] [PubMed] [Google Scholar]
- 33.Caramanos Z, Fonov VS, Francis SJ, et al. Gradient distortions in MRI: characterizing and correcting for their effects on SIENA-generated measures of brain volume change. Neuroimage 2010;49:1601–1611. [DOI] [PubMed] [Google Scholar]
- 34.Storelli L, Rocca MA, Pantano P, et al. MRI quality control for the Italian Neuroimaging Network Initiative: moving towards big data in multiple sclerosis. J Neurol 2019;266:2848–2858. [DOI] [PubMed] [Google Scholar]
- 35.Vrenken H, Jenkinson M, Horsfield MA, et al. Recommendations to improve imaging and analysis of brain lesion load and atrophy in longitudinal studies of multiple sclerosis. J Neurol 2013;260:2458–2471. [DOI] [PMC free article] [PubMed] [Google Scholar]
Associated Data
This section collects any data citations, data availability statements, or supplementary materials included in this article.
Data Availability Statement
Any data not published within the article are available in a public repository and include digital object identifiers (doi) or accession numbers to the datasets or where stated that anonymized data will be shared by request from any qualified investigator.