

Abstract

This study is focused on the preparation of the CuS/RGO nanocomposite via the hydrothermal method using GO and Cu–DTO complex as precursors. X-ray diffraction, Fourier-transform infrared spectroscopy, and Raman and X-ray photoelectron spectroscopy study revealed the formation of the CuS/RGO nanocomposite with improved crystallinity, defective nanostructure, and the presence of the residual functional group in the RGO sheet. The morphological study displayed the transformation of CuS from nanowire to quantum dots with the incorporation of RGO. The galvanostatic charge/discharge curve showed that the CuS/RGO nanocomposite (12 wt % Cu–DTO complex) has tremendous and outperforming specific capacitance of 3058 F g–1 at 1 A g–1 current density with moderate cycling stability (∼60.3% after 1000 cycles at 10 A g–1). The as-prepared nanocomposite revealed excellent improvement in specific capacitance, cycling stability, Warburg impedance, and interfacial charge transfer resistance compared to neat CuS. The fabricated nanocomposites were also investigated for their bulk DC electrical conductivity and EMI shielding ability. It was observed that the CuS/RGO nanocomposite (9 wt % Cu–DTO) exhibited a total electromagnetic shielding efficiency of 64 dB at 2.3 GHz following absorption as a dominant shielding mechanism. Such a performance is ascribed to the presence of interconnected networks and synergistic effects.
Introduction
In recent years, supercapacitors (SCs) have been receiving considerable attention as promising alternative energy. The choice is guided by lightweight, high performance (power densities, fast charge–discharge (CD), and prolonged cycle stability), stability, safer operation, environmental benignity, and lower maintenance cost.1 SCs are classified into two categories based on the charge-storage mechanism, that is, electrochemical double-layer capacitors (EDLCs) and pseudocapacitors. EDLCs include carbon aerogels, carbon foams, carbide-derived carbon, carbon black, and so forth.2 Although EDLCs have certain advantages in terms of excellent cycling stability, superior chemical stability, and electrical conductivity, the low specific capacitance of the carbon-based materials remains a major constraint in their commercial applications. In the case of pseudocapacitors, such as conducting polymer, transition-metal oxides, and metal-doped carbon, a fast redox reaction takes place at the electrode surface or inside electrode materials and exhibits much higher energy density and specific capacitance than EDLCs. However, their poor electrical conductivity, inferior rate capability, shorter cycle life, and power density are few major drawbacks. Therefore, efforts are continuing in developing hybrid electrode materials for their application in SCs to overcome these drawbacks.3
Recently, nanostructured transition-metal sulfides, such as MoS2, MnS, CoS, NiS, ZnS, SnS, CuS, and so forth, have been reported as novel alternative electrode materials in SC applications.4,5 This is mainly ascribed to their diversity in morphology, rich valence states, and varied compositions.6−8 Among these, p-type semiconducting copper sulfide (CuS) is intensively studied for its promising applications in the fields of solar cells, optical filters, electrode material in energy-storage devices, and superionic materials.8 This has been attributed to its excellent electrical, optical, physical, and chemical properties. Its other remarkable features include natural abundance, low-cost morphology, availability of valence states, high redox reaction reversibility, superior chemical durability, and variable morphology.9 According to the available literature, a considerable amount of work has been reported on CuS and CuS-derived hybrid as an electrode material in SCs. It is inferred that the electrochemical performance of CuS strongly depends on its morphologies. Xu et al. fabricated spherical clusters composed of CuS nanosheets and found its specific capacitance of ∼276 F g–1 (at a scan rate of 5 mV s–1) and ∼713 F g–1 (at a CD current of 1.0 A g–1).10 They explained pseudocapacitive performance based on high specific surface area and the absence of volume change in the nanosheets as the pseudocapacitor materials. Nanostructured CuS networks composed of interconnected nanoparticles exhibited a high specific capacity of 49.8 mA h g–1 (at 1 A g–1) and good rate capability and cycle stability in asymmetric SCs.11 CuS double-shell hollow nanocages as a pseudocapacitive electrode for SCs delivered high specific capacitance (843 F g–1 at 1 A g–1), good rate performance (500 F g–1 at 5 A g–1), and excellent cycling stability (4000 cycles).12 In addition, CuS exhibiting morphology of hierarchical type,13 nanosheets,14,15 CuS nanowire arrays fabricated on Cu foil,16 microflower,17 hierarchical CuS microspheres,18 CuS nanoplatelet arrays grown on graphene nanosheets,19 and interconnected nanoparticles11 have also been investigated.
Poor electrical conductivity, low specific capacitance, poor rate capability, cyclic stability, and low energy density were significant challenges in the development of CuS-based SCs.20 To overcome this, current research is focused on developing nanocomposites of CuS.19,21−26 According to Zhu et al.,22 CuS microspheres coated with thermally reduced graphene oxide (TRGO) exhibited a high specific capacitance of 1222.5 F g–1 with excellent cycling stability. Li et al.19 observed a specific capacitance of 497.8 F g–1 at a current density of 0.2 A g–1 in CuS nanoplate arrays/graphene and concluded strong dependence of the electrochemical performance on morphologies and nanostructural properties of the electrode material. The hexagonal-shaped CuS/RGO composite electrode showed a maximum capacity of 1604 Fg–1 (current density: 2 Ag–1), excellent cyclic stability, capacitance retention (97%) after 5000 cycles.23 In another work, Kuila et al.20 achieved excellent specific capacitance of 920 F g–1 (at 1 A g–1) in a carbon dot-stabilized CuS nanoparticle-decorated graphene oxide hydrogel. The RGO/CuS composite prepared by solvothermal methods exhibited a maximum specific capacitance of 906 F g–1 at 1 A g–1, excellent cycling stability (89% retention after 5000 cycles at 5 A g–1), and a high energy density of 105.6 W h kg–1 (at 2.5 kW kg–1).24 Flower-like copper sulfide/reduced graphene oxide (31.7 wt %) delivered a maximum specific capacitance of 368.3 F g–1 at a current density of 1 A g–1.25 Chen et al.26 also reported specific capacitance of GN/CuS microspheres corresponding to 379 F g–1at 1 A g–1.
In recent years, electromagnetic (EM) pollution generated due to massive usage of electronic equipments/communication technologies has been receiving considerable attention. The excessive EM waves generated from these electronic devices result in EM interference and slow down their performance and adversely affect human health, even in some cases, death.27−30 Therefore, high-performing microwave absorbers are needed to eliminate incident EM waves by converting them into thermal energy.31 Recently, EM absorption performances of CuS attracted considerable attention due to its excellent optical, electrical, and physical/chemical properties and special morphologies.9,32−40 The EM interference shielding effectiveness (EMI SE) of the CuS coating was achieved up to 27–31 dB for the CuS (28.6 wt %)/waterborne polyurethane-polyacrylate emulsion in the frequency range of 300 kHz to 3 GHz.32 Zhao et al.33 reported the synthesis of flower-like hollow CuS microspheres and the minimum refection loss (RLmin) rose to −31.5 dB at 16.7 GHz with a thickness of only 1.8 mm. However, the weight of CuS is too heavy to be used in microwave absorption applications. Therefore, several research works have been reported in developing lightweight nanocomposites as shielding materials. The PANI/CuS (flower-like) composite showed an EMI SE value of −45.2 dB at 2.78 GHz.35 The CuS (symmetrical nanosheets)/PVDF36 and CuS (hexagonal platelets)/PVDF nanocomposite37 showed substantial enhancement of wave absorption (−102 dB at 7.7 GHz) and reflection loss (−29.66 dB at 10.90 GHz), respectively. Sun et al.38 prepared the PANI/flower-like CuS composite with an EMI SE value of −45.2 dB at 2.78 GHz. RGO/CuS microspheres (15 wt %) in PVDF exhibited high reflection loss values and the maximum loss of 32.7 dB at 10.7 GHz.39 Sharma et al. showed total EMI shielding effectiveness of PVDF/RGO/CuS from −20 to −18 dB in the frequency range of 12–18 GHz.40 The microwave absorption performance has also been studied for hierarchical nanostructured CuS,41 CuS nanoplatelets/PVDF,37 MoS2/RGO,42 “wool-ball”-like hollow CuS (30 wt %)/PVDF,43 CuS nanoflakes (20 wt %) (on magnetically decorated graphene),44 CuS nanoneedles supported on a CNT backbone,45 CuS/MWCNT,46 carbon dot-decorated CuS/CNT,47 core–shell CuS@C quantum dots@C (hollow),48 hierarchical porous CuS microspheres integrated with carbon nanotubes,49 and CuS nanostructures.50−52 Therefore, further scope of improvement is recommended to apply CuS for its application in EMI shielding in view of current developments.
The reported literature clearly demonstrated limited work on applying the CuS/RGO nanocomposite both as an SC and EMI shield. Motivated by this, the present work is focused on the fabrication of the CuS/RGO nanocomposite through the hydrothermal method using copper(II) dithiooxamide (Cu–DTO) complex and GO as precursors. It is anticipated that the as-prepared CuS/RGO nanocomposite has several scientific advantages, for example, synergistic enhancement in electrochemical performance and microwave absorption property of the CuS/RGO nanocomposite due to CuS (pseudocapacitor) and highly conducting RGO (EDLC). In addition, high surface area, good chemical stability, superior electrical conductivity, high dielectric constant, lightweight, and good mechanical flexibility of RGO are most likely to make significant impact on both SC and EMI shielding. Furthermore, in situ reduction of GO could be achieved without adding an external reducing agent in the presence of a Cu–DTO complex under hydrothermal conditions. As expected, a significantly enhanced specific capacitance of 3058 F g–1 at 1 A g–1 current density and EM interference shielding efficiency corresponding to 64 dB (2.3 GHz) with absorption as a dominant shielding mechanism was achieved by the reported CuS/RGO nanocomposites (12 and 9 wt % Cu–DTO complex). It is believed that the as-synthesized nanostructure could be a potential candidate as a next-generation SC and microwave absorber.
Results and Discussion
XRD and Raman Analysis
X-ray diffraction (XRD) patterns of CuS, RGO, and CuS/RGO nanocomposites are displayed in Figure 1a. The characteristic diffraction peaks of CuS appeared at the 2θ: 28°, 29°, 32°, 33°, 48°, 52.5°, and 59° corresponding to (101), (102), (103), (006), (110), (108), and (116) lattice planes, respectively. These findings are in good agreement with standard values corresponding to the hexagonal covellite CuS phase (JCPDS no. 06-0464). The absence of any additional peaks in the diffractogram indicated its high purity of the as-prepared CuS.7 The appearance of the most intense diffraction peak (110) suggested the possibility of the preferential growth of CuS nanoparticles along this lattice plane.7 In the case of RGO, the presence of broad peaks centered at ∼24° (d002 = 0.37 nm) and 43° (d100 = 0.21 nm) matched well with lattice spacing (d) reported in earlier work (JCPDS no. 75-1621).56 XRD patterns of CuS/RGO nanocomposites showed diffraction peaks for both CuS and RGO. The respective peak positions were also found to be shifted compared to neat RGO and CuS. It is noted that low-intensity peaks of CuS appeared in RGCS9. However, its intensity increased with an increasing amount of CuS in RGCS12 and RGCS17 nanocomposites. These findings clearly established the successful incorporation of CuS nanoparticles into the RGO sheet.57 It is anticipated that the observed increase in the crystallinity could also account for the observed improvement in electrochemical performance and EMI shielding property of CuS/RGO nanocomposites.58,59 XRD patterns of RGCS12 and RGCS17 also showed the presence of an additional intense peak at ∼21° in all probability due to the formation of residual intercalation compounds in the RGO sheet.60
Figure 1.
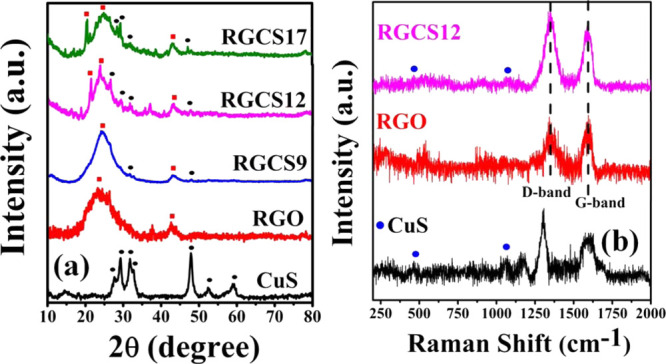
(a) XRD pattern of CuS, RGO, and CuS/RGO nanocomposites and (b) Raman spectra of CuS, RGO, and RGCS12 nanocomposites.
Raman spectra of CuS, RGO, and RGCS12 are displayed in Figure 1b in the frequency range of 200–2000 cm–1. The appearance of small intensity peaks for CuS at ∼467 cm–1 and 1060 cm–1 corresponds to the S–S stretching mode of A1g symmetry and A1g coupling, respectively.61,62 It may be further added that a peak at 467 cm–1 represents the periodicity of lattice atoms aligned in a certain direction with its intensity related to the size of lattice in this direction.63 The intense peaks in the spectra of CuS also appeared at 1300 and 1594 cm–1 similar to that reported without any assignment.63 RGO and RGCS12 showed the presence of two intense peaks at ∼1345 and 1590 cm–1 corresponding to D (sp3-hybridized disorder) and G bands (sp2-hybridized), respectively.61,62 Notably, the intensity of characteristic peaks of CuS at 467 and 1060 cm–1 significantly lowered in RGCS12, indicating the formation of CuS nanoparticles with very low size.64 This has also been supported by our high-resolution transmission electron microscopy analysis of RGCS12, indicating the formation of copper sulfide quantum dots (CSQDs). The intensity ratio of D to G band (ID/IG) was also calculated for both RGO and RGCS12 and found to be 1.26 and 1.59, respectively. This indicated an increased degree of graphitization in RGCS12 compared to RGO due to its relatively higher crystallinity, a fact established by XRD and SAED later.61,62,65
FTIR Analysis
Fourier-transform infrared (FTIR) spectra for RGO, CuS, and CuS/RGO nanocomposites in the frequency range of 4000–400 cm–1 are displayed in Figure S1. RGO showed the presence of a broad peak centered at ∼3300 cm–1 along with a small sharp peak at 1432 cm–1. These respective peaks referred the stretching and bending mode of the O–H bond originating from different sources, for example, adsorbed moisture, −COOH group, −OH group, and so forth.66 The small intensity peaks that appeared at 1721, 1571, 1182, and 1021 cm–1 in RGO are associated with the stretching mode of the C=O bond in the −COOH/quinine ring structure, aromatic C=C bond, and C–O bond present in different chemical environments, respectively.67,68 Furthermore, the presence of peaks below ∼900 cm–1 could be ascribed to the deformation and bending type of C–H bond vibration.69 FTIR spectra of CuS show the presence of a broad peak centered at ∼3130 cm–1 due to the adsorbed moisture trapped during sample preparation.70 In addition, two sharp peaks also appeared at 1062 and 602 cm–1 due to the Cu–S bond stretching.7,50,71 Interestingly, no such characteristic peak of O–H bond stretching appeared prominently in CuS/RGO nanocomposites at ∼3000 cm–1 in all probability due to the in situ formation of RGO under hydrothermal conditions.72 The characteristic Cu–S stretching modes (1062 and 602 cm–1) are slightly blue-shifted due to the chemical interaction between RGO and CuS.73 Interestingly, the intensity of peaks present in RGO and CuS is somewhat more in RGCS12 and RGCS17 as compared to RGCS9. This could be in all probability due to the presence of the residual functional group and successive increase in the amount of CuS in RGO. It is anticipated that the presence of the residual functional group in RGO could play an important role in enhancing the capacitance of RGO/CuS nanocomposites.20 Moreover, the presence of functional groups could create defects in RGO and account for higher EMI shielding of RGCS nanocomposites.74
XPS Analysis
The determination of chemical and electronic state in the RGCS12 nanocomposite was carried out using X-ray photoelectron spectroscopy (XPS) analysis and the corresponding findings are displayed in Figure 2a. It clearly demonstrated the coexistence of C, O, S, and Cu. The appearance of a characteristic peak at 555 eV is due to the presence of Cu in the bivalent state in CuS.75 The deconvoluted spectra of the C 1s spectrum in Figure 2b showed the appearance of three peaks at 284.2, 285.6, and 288.7 eV corresponding to C–C sp3 carbon/C=C sp2 carbon, C–O, and O=C–O functionalities present in RGO, respectively.76,77 The presence of these functionalities in RGCS12 further reaffirmed our earlier contention based on FTIR. The deconvoluted peaks for the Cu 2p spectrum in Figure 2c at 932.6 and 952.1 eV with a spin-energy separation of 19.5 eV correspond to Cu 2p3/2 and Cu 2p1/2, respectively.78 The presence of a peak at 932.6 eV revealed the formation of CuS (covellite) in accordance with the earlier reported literature.78 In addition, the deconvoluted S 2p spectrum in Figure 2d consists of peaks at 163.5 and 168.1 eV corresponding to S 2p3/2 and S 2p1/2, respectively.79 The spin-energy separation of 4.6 eV between these peaks clearly suggested the presence of sulfur in the sulfide state in CuS.79 The presence of a satellite peak of Cu2+ (942 eV) in Figure 2c and S 2p peaks in Figure 2d further reaffirmed the formation of CuS in the RGCS12 nanocomposite.80
Figure 2.

XPS spectra of the RGCS12 nanocomposite: (a) full survey spectrum, (b) C 1s, (c) Cu 2p, and (d) S 2p region.
FESEM Analysis
Field emission scanning electron microscopy (FESEM) images of CuS, RGO, and CuS/RGO nanocomposites are displayed in Figure 3. It is noted that pristine CuS (Figure 3a) exhibited nanowire-type morphology with a width in the range of ∼45 to 67 nm and length extending to several micrometers. It is anticipated that the as-synthesized ultrasmall size nanoparticles with high surface energy induce their aggregation and growth of nanowires through an oriented attachment mechanism. Moreover, strong interaction between the uncapped surfaces of CuS nanoparticles and solvent molecules plays an important role in the growth of nanowires in a preferred orientation along the (110) plane.81 The formation of a rough surface in CuS/RGO nanocomposites (Figure 3c–f) compared to RGO (Figure 3b) is in all probability due to the growth of uniformly dispersed CuS nanoparticles. However, peeling of the nanowires of CuS to individual nanoparticles (average size ∼80 nm) due to the higher surface energy of the RGO sheet cannot be ruled out.82
Figure 3.

FESEM images of (a) CuS, (b) RGO, (c) RGCS9, and (d) low-magnified and (e) high-magnified RGCS12 and RGCS17.
HRTEM Analysis
Morphology of the RGCS12 nanocomposite has also been studied by HRTEM and the corresponding high-magnification image of RGCS12 is displayed in Figure 4a,b. This study further confirmed almost uniform dispersion of CuS nanoparticles followed by their aggregation in a few places in RGO sheets. However, HRTEM of RGCS12 established the formation of randomly dispersed quantum dots (size: ∼3 nm) on a transparent and wrinkled RGO sheet. It is anticipated that the presence of quantum dots could play an important role in enhancing specific capacitance83 and EMI shielding efficiency.84Figure 4c clearly identifies two separate regions for the lattice fringes in the HRTEM image of RGCS12, namely, RGO layers (d002 = 0.36 nm) and CuS (d110 = ∼0.20 nm). The SAED pattern in Figure 4d revealed the appearance of bright spots validating the formation of the highly crystalline nature of RGCS12 in agreement with our earlier contention based on XRD. The diffraction rings are indexed on the basis of (002), (100), and (110) planes corresponding to RGO and CuS. An energy-dispersive X-ray (EDX) spectrum of RGCS12 in Figure S2 represents the presence of C, O, Cu, and S. The atomic ratio between Cu and S is higher (Cu/S ∼ 3:1) than the theoretical value (Cu/S = 1:1), which might be attributed to the carbon-coated copper grid used during HRTEM analysis.
Figure 4.

HRTEM image of RGCS12: (a) low magnification, (b) high magnification, (c) image with a lattice fringe, and (d) SAED pattern.
Growth Mechanism
According to Abboudi et al.,54,55 Cu2+ions are generated from the dissociation of CuCl2·2H2O to form a 1:1 complex with DTO in the form of a polymeric chain with a molecular formula of Cu(C2S2N2H2) (H2O). The DTO ligand has a quasi-planar structure and a H2O molecule remains attached to one of the two available coaxial positions.7,85 The Cu–DTO complex on subjecting to hydrothermal condition involves breaking Cu–N and C–S bonds to generate [Cu2S].7 It is also well-established that oxygen-containing functionalities (e.g., −COOH, −OH, etc.) present on the GO sheets act as heterogeneous nucleation centers for the growth of nanomaterials. Therefore, it is anticipated that the other coaxial position in Cu(C2S2N2H2) (H2O) (referred to as Cu–DTO) is held by negatively charged functional groups of GO-forming GO–Cu(C2S2N2H2) (H2O) through coordination.85 The superheated water under hydrothermal condition catalyzes the reduction of GO to RGO through cleavage of C–O bonds to form RGO–[Cu2S].86 On cooling down the reaction mixture, metastable [Cu2S] is transformed into stable CuS at room temperature to form CuS/RGO nanocomposites.7 A possible reaction scheme (Figure 5) and the corresponding reactions for the formation of CuS/RGO nanocomposites could be described below
| 1 |
| 2 |
| 3 |
| 4 |
Figure 5.
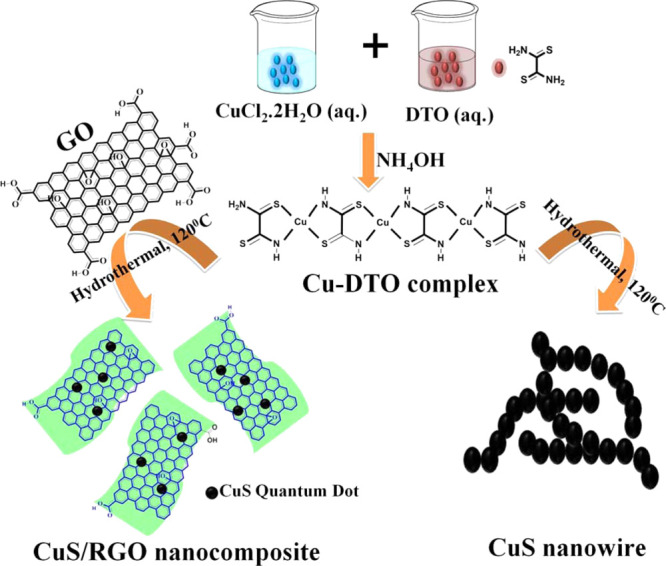
Schematic presentation of the formation of CuS nanowires and CuS/RGO nanocomposites.
DC Conductivity
Percolation theory describes the formation of an interconnected network structure imparting an abrupt increase in conductivity.87 According to classical percolation theory88
| 5 |
| 6 |
where σDC, σf, f, fc, and t represent DC conductivity of a composite, DC conductivity of the conducting material, the weight fraction of the conducting material, the weight fraction of the conducting material at percolation threshold, and critical exponent, respectively.
DC conductivity of CuS, RGO, and CuS/RGO nanocomposites was measured at room temperature and used to evaluate the weight fraction of GO at percolation threshold (fc) in CuS/RGO nanocomposites based on least square fit, as shown in Figure S3. It is inferred that the conductivity of neat CuS is higher than the neat RGO. This is in all probability due to the formation of CuS quantum dots and interconnecting networks in CuS nanowires.89 The conductivity increases sluggishly up to 83% (w/w) of GO-filled CuS. This is due to the formation of an interconnected network as a result of interaction between CuS and RGO through covalent bonding established earlier by FTIR.90 Thereafter, conductivity increased abruptly upto 91% (w/w) GO in CuS (sample RGCS12) due to the formation of the percolation threshold level. Further incorporation of GO in CuS resulted in a sharp decrease in conductivity due to the percolation network breakdown. The magnitude of fc was evaluated using eq 2 and found to be 0.85. Furthermore, t has also been calculated from the slope of the linear-fitted curve and found to be −4.37. It may be noted that the formation of the percolation level is related to the enhancement of electrochemical capacitance and EMI shielding behavior.87,91 Our findings also established the highest average EMI shielding efficiency and specific capacitance due to the percolation threshold observed in RGCS12.
Electrochemical Response
Figure 6a represents cyclic voltammetry (CV) curves of CuS, RGO, and CuS/RGO nanocomposites at a scan rate of 5 mV s–1 in the potential range of 0 to −1 V in 2 M aqueous KOH. It is clearly observed that the area under CV curves and specific capacitance increases with the incorporation of CuS in RGO. This suggested that the CuS/RGO nanocomposite acts as a promising electrode material in SC in all probability due to the combination of pseudocapacitor (CuS) and EDLC (RGO).22 Furthermore, the appearance of redox peaks at ∼−0.45 V (oxidation) and −0.33 V (reduction) in CV curves indicated the pseudocapacitive behavior of CuS/RGO nanocomposites according to the following reversible processess19
| 7 |
| 8 |
Figure 6.

(a) CV curve of CuS/RGO nanocomposites, RGO and CuS at 5 mV s–1 and (b) discharge curve of CuS/RGO nanocomposites, RGO and CuS at 1 A g–1 current density.
The larger contact area of the CuS/RGO nanocomposite electrode, as well as the synergistic effect, could account for a shorter ion diffusion path and rapid redox behavior compared to the RGO and CuS electrode.20 Furthermore, the interaction between the RGO sheet and CuS could also facilitate rapid electronic transport through the formation of interconnected conducting networks.20,22 Moreover, several small redox peaks were found in CV curves of RGCS12 and RGCS17 nanocomposites ascribed to the reduction of the −COOH group and oxidation of the −OH group present in RGO (as shown in FTIR spectra) as described below92
| 9 |
| 10 |
The variations of potential versus time of CuS, RGO, RGCS9, RGCS12, and RGCS17 at a current density of 1 A g–1 are displayed in Figure 6b. The corresponding discharge curves were subsequently used to calculate the respective specific capacitance (Cs) values according to the following relationship23
| 11 |
where I, Δt, ΔV, and m refer to current, discharge time, relevant voltage drop, and mass of the active materials drop-cast on a glassy carbon electrode, respectively. It is noted that specific capacitance of RGO, CuS, and CuS/RGO nanocomposites follows the order: RGO (472 F g–1) < RGCS9 (559 F g–1) <CuS (760 F g–1) < RGCS17 (1348 F g–1) < RGCS12 (3058 F g–1). The specific capacitance of the CuS nanowire in our case is similar to that reported earlier by Boopathi Raja et al.23 Our studies also clearly revealed maximum enhancement of specific capacitance at 1 A g–1 in the RGCS12 nanocomposite (3058 F g–1) compared to neat RGO (472 F g–1) and CuS (760 F g–1), respectively. Such a significant improvement in the specific capacitance of the RGCS12 could be ascribed to the synergistic effect and improved surface morphology, thereby facilitating faster ion and electron transfer during CD processes.93 In addition, hydrophilic CuS on the surface of RGO can be easily wetted by aqueous KOH, and the resulting thin layer can greatly reduce the diffusion and migration length of electrolyte ions. Also, the formation of CSQD can shorten the charge transfer distance, ensuring high utilization of CuS and RGO.19Table 1 highlights significantly enhanced specific capacitance performance of RGCS12 compared to other reported CuS-based nanocomposites.
Table 1. Specific Capacitance Data of Some CuS-Based Electrodes Available in the Literature.
| electrode material | rlectrolyte | specific capacitance | stability |
|---|---|---|---|
| CuS nanoparticle50 | 2 M KOH | 298 F g–1 (at 2 A g–1) | 100% (after 2000 cycles) |
| CuS nanoarray16 | 1 M NaOH | 305 F g–1 (at 0.6 mA cm–2) | 87% (after 5000 cycles) |
| CuS nanosheets15 | 6 M KOH | 833.3 F g–1 (at 5 A g–1) | 75.4% (after 500 cycles) |
| hollow nanocages CuS12 | 2 M KOH | 500 F g–1 (at 1 A g–1) | 89.2% (after 4000 cycles) |
| CuS nanoplatelets/graphene19 | 6 M KOH | 497.8 F g–1 (at 0.2 A g–1) | 91.2% (after 2000 cycles) |
| RGO/CuS nanoparticles24 | 6 M KOH | 906 F g–1 (at 1 A g–1) | 89% (after 5000 cycles) |
| flower-like CuS/RGO25 | 2 M KOH | 368.3 F g–1 (at 1 A g–1) | 88.4% (after 1000 cycles) |
| CuS/TRGO microsphere22 | 2 M KOH | 1222.5 F g–1 (at 1 A g–1) | 91.2% (after 2000 cycles) |
| N-doped graphene/CuS26 | 0.1 M Li2SO4 | 379 F g–1 (at 1 A g–1) | 72.46% (after 500 cycles) |
| nanoneedles CNT@CuS45 | 2 M KOH | 110 F g–1 (at 2.9 A g–1) | 100% (after 1000 cycles) |
| layered CuS-MWCNT46 | 6 M KOH | 2831 F g–1 (at 1 A g–1) | 90% (after 600 cycles) |
| 3D CuS@CD-CNTs grape string-like structure47 | 3 M KOH | 736.1 F g–1 (at1 A g–1) | 92% (after 5000 cycles) |
| porous CD/CuS nanoparticle-decorated graphene oxide hydrogel20 | 6 M KOH | 920 F g–1 (at 1 A g–1) | 90% (after 5000 cycles) |
| core–shell CuS@CDs@C hollow nanospheres48 | 6 M KOH | 618 F g–1 (at 1 A g–1) | 95% (after 4000 cycles) |
| CuS/RGO nanocomposite, our work | 2 M KOH | 3058 F g–1 (at 1 A g–1) | ∼60.3% (after 1000 cycles) |
To further understand the rate capability behavior and specific capacitance of CuS, RGO, and RGCS12, CV and CD measurements of all three samples were carried out. Figure S4 shows CV curves of CuS, RGO, and RGCS12 nanocomposite measured at a scan rate ranging from 5 to 100 mV s–1. The presence of a pair of redox peaks in Figure S4a suggests the pseudocapacitive behavior of CuS, whereas the RGO rectangular CV curve in Figure S4b is associated with electrochemical double-layer capacitance.94 RGCS12 represents a combined CV curve of EDLC and pseudocapacitive character (Figure S4c). For all three CV curves, the current density increases with an increase in the scan rate. Moreover, the anodic and cathodic peaks in CV curves for CuS and RGCS12 shift toward more positive and negative potential with an increase in the scan rate. This phenomenon might be attributed to the slow kinetics of interfacial reaction and the sluggish rate of electronic and ionic transport.93 It is noted that the overall shape of CV curves for RGCS12 remains more or less unaltered with varying scan rates. This clearly demonstrated excellent reversibility of the RGCS12 nanocomposite and could be beneficial for fast redox reactions in power devices.95 The specific capacitance values of CuS, RGO, and RGCS12 have also been calculated from their CV curves recorded at 5, 10, 20, 30, 40, 50, and 100 mV s–1 scan rates (v) using the following equation94
| 12 |
The specific capacitance values versus scan rates for each sample were plotted for RGO, CuS, and RGCS12, as displayed in Figure 7a. Our findings also demonstrated an inverse relationship between specific capacitance and scan rate. It is also noted that specific capacitance at any given scan rate follows the order: RGCS12 > RGO > CuS. Furthermore, enhanced specific capacitance of RGCS12 at a lower scan rate could be attributed to the high susceptibility of inner/outer active sites for the penetration of electrolyte ions and charge storage.94 The capacitance retention for CuS, RGO, and RGCS12 was found to be 42.7%, 28.2%, and 43.3%, respectively, when the scan rate increases from 5 to 100 mV s–1. This observation suggests that both CuS and RGCS12 have comparable rate capability, which is better than the as-prepared RGO.
Figure 7.

(a) Plot of specific capacitance vs scan rate, (b) plot of specific capacitance vs current density, and (c) plot of specific capacitance vs number of cycle for CuS, RGO, and RGCS12. (d) Nyquist plot of CuS, RGO, and RGCS12 over the frequency range of 0.1 Hz to 100 kHz.
Furthermore, CD studies of CuS, RGO, and RGCS12 have also been carried out at current density in the range of 1–10 A g–1 and the corresponding findings are displayed in Figure S5a–c. It is inferred that the discharge segment of CuS consists of three stages, that is, short discharge time in the first stage and longest discharge time in the second stage ascribed to pure electrical double-layer capacitance and pseudocapacitance, respectively, and the third discharge segment is ascribed to the combination of EDLC/pseudocapacitance.19 The linear CD curve of RGO represented its characteristic EDLC behavior, whereas some curvy edges have been observed in the discharge curve of RGCS12, ascribed to combined EDLC and pseudocapacitive behavior. The specific capacitance value of RGCS12 was calculated from the discharge curve and found to be 3058, 1112, 969, 876, 790, and 590 F g–1 at 1, 2, 3, 4, 5, and 10 A g–1 current density, respectively. Similarly, the specific capacitance for RGO and CuS was found to be 472, 318, 276, 256, 245, and 210 F g–1and 760, 316, 162, 124, 100, and 40 F g–1, respectively. According to Figure S5c, the ohmic drop in the RGCS12 nanocomposite increases as the current density increases. It may be noted that iR drop (ohmic drop) is proportional to current density and arises due to the resistance offered by an electrochemical system comprising the combination of internal resistance of the electrode, bulk solution resistance, resistance during ion migration into the electrode, and electrical connection resistance. At lower current density, the ion diffuses on the electrode surface to form a stable double layer. However, the diffusion rate of the ions is not able to match with the increasing current density forming thereby a stacked unstable layer and leading to enhanced iR drop.96−98Figure 7b indicates a gradual decrease in discharge time with an increase in current density. This is most likely due to internal resistances and kinetically slow reactions of redox couples.93 It has also been found that specific capacitance of RGCS12 and CuS decreases sharply with an increase in current density from 1 to 2 A g–1 in comparison with RGO. This might be attributed to the relatively higher surface area and pore volume, allowing maximum charge accumulation at the surface and facilitating the electrical double-layer capacitance in the nanopores. However, when current density becomes higher (2–10 A g–1), the charge transport process becomes the key factor overriding the total charge accumulation.99 Moreover, it has been observed that the specific capacitance of RGCS12 is higher than both RGO and CuS at all current densities, a fact already correlated with increased contact area and synergistic effect. Specific capacitance retention for RGCS12 and CuS was found to be 53.1% and 12.7%, respectively, in 2–10 A g–1 current density. This suggests an improvement in rate capability on the incorporation of RGO onto CuS.
The variation of potential (−1 to 0 V) versus time plot at 10 A g–1 of CuS, RGO, and RGCS12 is displayed in Figure S6a–c. These plots were subsequently used to draw variation of specific capacitance with the number of cycles (up to 1000 cycles) and the corresponding findings are presented in Figure 7c. It is noted that specific capacitance of CuS, RGO, and RGCS12 throughout the cycles corresponds to 48–1 F g–1, 210–200 F g–1, and 580–350 F g–1. The specific capacitance retention of CuS, RGO, and RGCS12 is 2.1%, 95.2%, and 60.3%, respectively, after 1000 cycles. Overall cycling stability of RGCS12 is improved with the incorporation of RGO into CuS. The decrease in cycling stability for both CuS and RGCS12 could be attributed to the formation of Cu(OH)2 during the CD cycle in an alkaline medium, as reported by Yang et al.100
Figure 7d shows electrochemical impedance spectra (EIS) of CuS, RGO, and RGCS12 at open-circuit potential in the frequency range of 0.01 Hz to 100 kHz. The overall shape of all the samples consists of a semicircle followed by an inclined line in a low-frequency region. The equivalent circuit corresponding to RGCS12 was obtained through the fitting of its Nyquist plot using ZSimpWin (version 3.21) software, as shown in Figure S7. The corresponding chi-square (χ2) was ∼10–4. χ2 is the function defined as the sum of the squares of the residuals. An electrical equivalent circuit model, R(C(R(Q(RW)))) (CR), was used in the simulation of the impedance behavior of RGCS12. The term Rs in the circuit corresponds to the intersection point at the real axis representing equivalent series resistance (Rs). It is a combination of internal resistance of the electrode material, ionic resistance of electrolyte solution, and contact resistance between electrode/collector of each sample. Rct refers to the interfacial charge-transfer resistance measured from the diameter of the semicircle in the high-frequency region. The Rct measured from the semicircle diameter in the high-frequency region arose from electron hopping at the interfacial contacts of CuS/RGO and associated CuS during the CD process.101 It has been found that Rct values follow the order: RGO (18 Ω) <RGCS12 (25 Ω) <CuS (62.5 Ω). The relatively lower value of Rct of RGCS12 compared to CuS suggested that incorporating RGO facilitated the fastest electron transport and shortened ion diffusion path.101 In addition, improvement in the slope of the inclined portion in the impedance curve (Warburg impedance, W) is also noted in RGCS12 compared to CuS. This suggested that RGCS12 exhibited faster ion transport and lesser diffusive resistance.102 In addition, R1, R2, and Cdl represent electrolyte resistance, electrode resistance, and double-layer capacitance, respectively.103 A constant phase element, CPE (Q), must be introduced to fit the impedance result accurately. CPE arises from some internal factors, for example, intercalation/deintercalation, active diffusion, homogeneity disorder in the electrode–electrolyte interface, relaxation time distribution, and nature and porosity of the as-synthesized electrode.101
Electromagnetic Interference Shielding Studies
Total EM shielding effectiveness (EMI SE or SET) of the material represents the degree of attenuation of propagating EM radiation.28 It is expressed as a ratio of power (intensity) of transmitted radiation (PT) to incident radiation (PI)29,30
| 13 |
The attenuation of EM waves through a material is associated with three basic mechanisms: reflection absorption and multiple reflections. Therefore, SET can be expressed as follows
| 14 |
If SET is greater than 10 dB, then the contribution of SEM can be neglected.30 Thus, eq 14 is reduced to
| 15 |
The magnitudes of SE values mentioned above can be calculated using scattering parameters, S11 (forward reflection coefficient), S12 (forward transmission coefficient), S21 (backward transmission coefficient), and S22 (reverse reflection coefficient) obtained from the vector network analyzer.
| 16 |
| 17 |
| 18 |
where the magnitude of transmittance (T) and reflectance (R) of the material are expressed as
| 19 |
| 20 |
Figure 8a shows frequency-dependent EMI SEA for CuS, RGO, and CuS/RGO nanocomposites. It has been found that the EMI SEA value of CuS (25–27 dB) is higher than RGO (19–22 dB) in the tested frequency region. This might be attributed to higher ε′ (real part of complex permittivity) and ε″ (imaginary part of complex permittivity) values of CuS as compared to RGO that result in enhanced dielectric polarization/loss and hence higher SEA.57Figure 8a also shows the following SEA values for CuS/RGO nanocomposites: RGCS9 (46–29 dB), RGCS12 (37–42 dB), and RGCS17 (38–41 dB). In all possibilities, higher anisotropic energy along with the contribution of dielectric loss from CuS results in enhanced SEA of CuS/RGO nanocomposites compared to neat RGO and CuS.57 It is also anticipated that the incorporation of CuS quantum dots dispersed on RGO sheets could act as defect polarization centers assisting multiple reflections in absorbing EM waves.104Figure 8b shows the variation of SER with frequency for CuS, RGO, and CuS/RGO nanocomposites. It is noted that RGO showed poor impedance matching as compared to CuS leading to a higher SER value of RGO (6–4 dB) as compared to CuS (1–2 dB) in the entire frequency region.57 In contrast, SER of CuS/RGO nanocomposites exhibited relatively higher SER compared to both CuS and RGO and observed the following values of SER: RGCS9 (16–2 dB), RGCS12 (8–12 dB), and RGCS17 (9–10 dB). Figure 8c shows the variation of SET with frequency (2–8 GHz) for CuS, RGO, and CuS/RGO nanocomposites. It clearly showed the maximum enhanced value of SET in CuS/RGO nanocomposites (RGCS9: 62–31 dB, RGCS12: 45–54 dB, and RGCS17: 47–51 dB) as compared to both CuS (26–28 dB) and RGO (25–26 dB).The observed microwave absorption properties of CuS and RGO could be attributed to an appropriate impedance match and dielectric loss. In contrast, interfacial polarization/Maxwell–Wagner–Sillars polarization and multiple reflection/scattering from interfaces generated between CuS–CuS, RGO–RGO, and CuS–RGO are favorable to account for outstanding microwave absorption of RGCS nanocomposites.29 Alternatively, the crystallinity of RGO sheets, presence of residual functional group in the RGO surface, and defects generated on RGO sheets could introduce multiple polarization centers and thereby enhanced relaxation loss in CuS/RGO nanocomposites.29Figure 8c also clearly demonstrates absorption playing as a dominant mechanism in the overall shielding behavior of CuS/RGO nanocomposites. Thus, the present work provides an alternative RGCS12 as a lightweight microwave absorber of a thin thickness (1 mm) exhibiting the highest average EMI SE (47 dB). Figure 8d represents a 3-D representation of average EMI SE values. Average EMI SE for RGCS12 is the highest among all nanocomposites, referring to the formation of an interconnected network at percolation threshold and enhanced electrical conductivity in accordance with our earlier contention based on electrical conductivity measurement.87Table 2 highlights the comparison of EMI SE performance of the CuS/RGO nanocomposite compared to other reported CuS-based nanocomposites.
Figure 8.

Plots of (a) SEA vs frequency, (b) SER vs frequency, and (c) SET vs frequency for CuS, RGO, and CuS/RGO nanocomposites and (d) 3-D representation of average EMI SE of CuS, RGO, and CuS/RGO nanocomposites.
Table 2. Comparison of the EM Shielding Performance of CuS/RGO Nanocomposites with Other Reported CuS Electrode Materials.
| materials | thickness (mm) | frequency range | EMI SE/RL performance |
|---|---|---|---|
| CuS-PAN34 | 247 | 30–1500 MHz | EMI SE: 25–27 dB |
| PANI-CuS35 | 3 | 300 kHz to 3 GHz | EMI SE: −45.2 dB at 2.78 GHz |
| “wool-ball”-like hollow CuS (30 wt %)/PVDF43 | 3 | 2–18 GHz | EMI SE: 44 dB at 18 GHz |
| flower-like CuS (28.6% wt) in waterborne polyacrylate32 | 0.5 | 300 kHz to 3 GHz | EMI SE: 27–31 dB |
| CuS (30 wt %)/paraffin33 | 1.8 | 2–18 GHz | RLmin : –31.5 dB (16.7 GHz) |
| CuS (5 wt %)/PVDF36 | 3.5 | 2–18 GHz | RLmin : –102 dB (7.7 GHz) |
| RGO/CuS/PVDF39 | 2.0 | 2–18 GHz | RLmin : −34.5 dB (12.0 GHz) |
| RGO + MWCNT + CuS40 | 1 | 12–18 GHz | EMI SE: ∼−25 dB |
| hierarchical nanostructured CuS41 | 3.5 | 2–18 GHz | RLmin : –76.4 dB (12.64 GHz) |
| CuS nanoplatelets/PVDF37 | 2.5 | 2–18 GHz | RLmin : –29.66 dB (10.90 GHz). |
| CuS nanoflakes (20 wt %) on magnetically decorated graphene44 | 2.5 | 2–18 GHz | RLmin : –54.5 dB (11.4 GHz) |
| CuS/RGO nanocomposite, our work | 1 | 2–8 GHz | EMI SE: 64 dB at 2.3 GHz |
The microwave absorption properties of an absorber can be expressed in terms of ε′ and ε″, representing the storage and loss capability of electric energy, respectively. According to Debye theory,57 ε′ and ε″ can be described as
| 21 |
| 22 |
where εs is the static permittivity, ε∞ is the relative dielectric permittivity at the high-frequency limit, ω is the angular frequency, τ is the polarization relaxation time, and σac is the alternative conductivity. Figure S8a,b shows the frequency dependence of real and imaginary parts of complex permittivity of CuS, RGO, and CuS/RGO nanocomposites. The typical frequency-dependent variation of ε′ and ε″ observed in all samples also agreed well with those reported in the literature.42 The magnitudes of ε′ and ε″ of CuS, RGO, and RGCS nanocomposites vary with frequency (2–8 GHz) in the following manner:
ε′: RGCS17 (159–40) > RGCS9 (150–37) > RGCS12 (133–33) > CuS (99–25) > RGO (76–19).
ε″: RGCS17 (168–44) > RGCS9 (164–42) > RGCS12 (137–35) >CuS (95–26) > RGO (69–17).
CuS exhibited higher ε′ (100–32) as compared to RGO (69–20) due to its higher conductivity, as shown previously.57 The higher electrical conductivity, as well as induced electric polarization, originated due to the incorporation of CuS into the RGO sheet validates higher ε′ values of CuS/RGO nanocomposites compared to neat RGO and CuS.57 Alternatively, higher ε′ and ε″ values in CuS/RGO nanocomposites indicated higher storage capability and storage loss due to increase in the dipolar polarization.42 It is noted that ε′ showed a decreasing tendency with increasing frequency, as evident from Figure S8a. This is ascribed to the inability of dielectric polarization to catch up with the alternating EM field in the higher GHz frequency region. Our findings also indicated higher ε′ (100–32) of CuS compared to RGO (69–20) due to its higher conductivity, as discussed earlier.57 It is also most likely that a higher specific surface area of RGO could accelerate interfacial polarization with the increasing loading of RGO in CuS/RGO nanocomposites through the accumulation of free electrons in the interfaces. In addition, the vibration of free electrons present in both RGO and CuS assisted by alternating electric field results in electronic polarization. In addition, the high electrical conductivity of CuS could contribute toward electronic polarization and account for observed higher ε′ values in RGCS9, RGCS12, and RGCS17 nanocomposites.105 The imaginary part of complex permittivity provides an understanding of the energy stored in a material and its higher value could be beneficial in achieving higher EMI SE performance. Our findings also showed a higher magnitude of the imaginary permittivity in RGCS nanocomposites compared to both RGO and CuS.
According to free-electron theory,106 ε″ can be expressed as
| 23 |
where σ, ε0, and f represent electrical conductivity, the permittivity of free space, and frequency, respectively. The relationship clearly demonstrated ε″ to be proportional to σ, that is, an increased conductivity of RGCS nanocomposites could result in stronger dielectric loss. Our earlier findings already established considerable enhancement in the conductivity of the RGCS nanocomposites due to conductive network formation. This results in strong dielectric loss and favors the enhancement of the microwave absorption properties of CuS/RGO nanocomposites.106 Furthermore, eq 23 reveals that ε″ is a combination of conductance loss (corresponding to σ/2πfε0) and relaxation loss (εrelax″). It is also anticipated that interfacial as well as electronic polarization induces relaxation loss in the RGCS nanocomposites.107,108 In addition, the difference in the electronegativity of atoms, presence of intrinsic dipoles, and defect dipoles in the CuS undergoing dipole polarization relaxation result in improved dielectric loss capability of CuS/RGO nanocomposites. In view of this, microwave absorption performance of the CuS/RGO nanocomposite could be related to its dielectric properties, for example, interfacial/electronic polarization and associated relaxation loss, conductance loss, and dipole relaxation as the effective mechanism. Alternatively, the role of the synergistic effect between the CuS and RGO in enhancing the wave absorption properties of RGCS nanocomposites also cannot be ruled out. According to Meng et al.,109 very high permittivity of an absorber could result in strong reflection and weak absorption. As a consequence, RGCS12 showed excellent wave absorption properties compared to the other composites.
The tangent of dielectric loss angle (tan δε) of a material is related as tan δε = ε″/ε′ and the corresponding variation of tan δε with the frequency of CuS, RGO, and CuS/RGO nanocomposites is displayed in Figure S8c. This clearly indicated that the increase in tan δε with the filler loading is most likely due to defect polarization of CuS, imperfect carbon structures, and defects due to oxygen-containing functionalities in RGO and multiple interfacial polarization in CuS/RGO nanocomposites.42
Conclusions
CuS/RGO nanocomposites were successfully synthesized by hydrothermal treatment of the Cu–DTO complex and GO at 120 °C for 24 h. XRD, Raman, and FTIR study revealed the formation of CuS, RGO, and CuS/RGO nanocomposites with improved crystallinity, highly defective nanostructure, and presence of the residual functional group in the RGO sheet in the CuS/RGO nanocomposite prepared by taking 12 wt % Cu–DTO complex, respectively. The XPS study exhibited the presence of CuS in the covellite phase in the CuS/RGO nanocomposite (12 wt % Cu–DTO). FESEM images revealed that the morphology of CuS transformed from nanowire to quantum dots with the incorporation of the RGO sheet. The HRTEM image of the CuS/RGO nanocomposite (12 wt % Cu–DTO) represented the formation of highly crystalline CuS quantum dots (average size ∼3 nm) more or less evenly distributed on the RGO sheet. Conductivity measurement displayed higher conductivity of CuS nanowires as compared to RGO with the percolation level achieved at 85 wt % loading of GO. The charge/discharge curve showed the RGCS12 nanocomposite has an excellent Cs of 3058 F g–1 at a current density of 1 A g–1. The calculated specific capacitance value of the RGCS12 nanocomposite is far better than CuS (760 F g–1) and RGO (472 F g–1) at a similar current density. The specific capacitance retention of the RGCS12 nanocomposite electrode was ∼60.3% after 1000 cycles. The stability of the as-prepared nanocomposite showed excellent improvement in cycling stability as compared to neat CuS (∼2.1% after 1000 cycles). Impedance measurement revealed improved Warburg impedance and interfacial charge-transfer resistance of the CuS/RGO nanocomposite (12 wt % Cu–DTO) as compared to neat CuS. The average EMI SET of the CuS/RGO nanocomposite (12 wt % Cu–DTO) was found to be 45–54 dB in the frequency range of 2–8 GHz and absorption dominant. Dielectric studies displayed improved dielectric permittivity and tangent loss of the as-prepared nanocomposites as compared to both neat RGO and CuS. It is anticipated that the CuS/RGO nanocomposite (12 wt % Cu–DTO) could act as a promising anode material for developing high-performance SCs as well as an effective microwave shield.
Experimental Section
Materials
Graphite Micro-850 was procured from Asbury Graphite Mills, INC, Asbury Warren County, NJ. Potassium permanganate (KMnO4), hydrogen peroxide (H2O2) (30%), concentrated sulfuric acid (H2SO4) (98%), cupric chloride dihydrate (CuCl2·2H2O), and dithiooxamide (DTO) were procured from Merck, India. In addition, sodium nitrate (NaNO3) was purchased from S. D. Fine Chemicals India.
Preparation of GO
Graphite oxide (GO) used in this work was prepared according to Hummers’ method as reported earlier.53
Preparation of Cu–DTO Complex and CuS
Copper dithiooxamide (Cu–DTO) complex and CuS were prepared according to the reported procedure by Abboudi et al.54,55 and Roy et al.7 with some minor modifications. Accordingly, 500 mg of CuCl2·2H2O and 300 mg of DTO were dissolved separately in 25 mL of ethanol by subjecting it to continuous stirring for 2 h at room temperature to form a homogeneous solution. After that, the ethanolic cupric chloride solution was added to the earlier prepared homogeneous DTO solution. Following this, 25 mL of NH4OH solution was added under stirring conditions for another 2 h. The black-colored Cu–DTO complex so formed was filtered, washed repeatedly with distilled water and ethanol, and dried at 60 °C for 6 h in the air.
A total of 300 mg of the as-obtained Cu–DTO complex was dispersed in 25 mL of distilled water through ultrasonication for 30 min. After that, the entire content was transferred into a Teflon-lined stainless-steel autoclave and heated at 120 °C for 24 h. The black precipitate of CuS formed in this manner was filtered, washed repeatedly with distilled water and ethanol, and dried at 60 °C for 6 h.
Preparation of the CuS/RGO Nanocomposite
Typically, 300 mg of GO and 30 mg of the Cu–DTO complex (9 wt %) were dispersed in 25 mL of distilled water for 30 min. Subsequently, the entire content was transferred into a Teflon-lined stainless-steel autoclave and heated at 120 °C for 24 h. The black-colored product so formed was filtered, washed repeatedly with distilled water and ethanol, and dried at 60 °C for 6 h. The sample code for this nanocomposite was assigned as RGCS9. Accordingly, RGCS12 and RGCS17 nanocomposites were prepared under a similar reaction by taking 12 and 17 wt % of the Cu–DTO complex, respectively. RGO was also prepared in a similar manner by subjecting dispersion of 300 mg of GO into 25 mL of distilled water under identical hydrothermal conditions.
Characterization Techniques
XRD analysis of the CuS, RGO, RGCS9, RGCS12, and RGCS17 nanocomposites were carried out at room temperature in the range 10–80° on a Bruker AXS D2 PHASER instrument coupled with Cu Kα radiation (0.1541 nm) with a normal scan rate. FTIR spectra of the compressed powdered samples dispersed in KBr were recorded in the range of 400–4000 cm–1 on a PerkinElmer FTIR spectrometer RXI. FESEM images of the samples were recorded on a Nova Nano SEM 450 at an accelerating voltage of 10 kV. HRTEM images were obtained from the JEM-210 instrument operating with an accelerating voltage of 200 kV with a resolution of 0.2 nm using a carbon-coated copper grid. EDX images for the samples were recorded from a JEOL energy-dispersive X-ray spectrometer with a probe size of 100 mm2. A JobinYvon Horiba T64000 Raman spectrometer was used to record Raman spectra of the samples in the range of 200–2000 cm–1. XPS was performed on a PHI 5000 Versa Probe II (ULVAC-PHI, INC, Japan) using a microfocused (100 μm, 25 W, 15 kV) monochromatic Al Kα source (hν = 1486.6 eV), hemispherical analyzer, and multichannel detector. The DC conductivity of the samples was measured using the Kiteley 6514 system electrometer. EMI shielding efficiency data of the samples in the form of a compressed pellet (Diameter: 1.4 cm, Thickness: 1 mm) were recorded on an Agilent E5071C vector network analyzer in the frequency range of 100 kHz to 8.5 GHz. The Agilent E5071C vector network analyzer was calibrated using the standard open, short, and 50 Ω load components. The intermediate frequency bandwidth was set as 1 kHz during the measurement, and 201 points were collected for each sample.
Electrochemical Measurements
CHI 7086E electrochemical workstation (CH Instruments Inc.) was used to perform CV, galvanostatic CD, and EIS measurements of samples in the presence of 2 M KOH aqueous solution. This involved the use of a conventional three-electrode glass cell consisting assembly of the CuS/RGO/RGCS9/RGCS12/RGCS17-modified glassy carbon electrode (working electrode), reference electrode (saturated calomel electrode, SCE), and counter electrode (platinum wire). The working electrode was fabricated by mixing 2 mg of each sample, 10 μL of 0.1 wt % ethanolic solution of Nafion, and 190 μL of ethanol followed by ultrasonication. The resulting slurry (4 μL) was drop-cast on a glassy carbon electrode (GCE) and left overnight for drying at room temperature. A potential window ranging from −1 to 0 V was chosen in all the CV experiments at multiple scan rates of 5, 10, 20, 30, 40, 50, and 100 mV s–1 and galvanostatic CD tests at different current densities of 1, 2, 3, 4, 5, and 10 A g–1. In addition, EIS of the prepared samples were studied at −0.835 V in the frequency range of 0.01 Hz to 100 kHz with an AC amplitude of 5 mV.
Acknowledgments
K.G. gratefully acknowledges Indian Institute of Technology, Kharagpur, for providing financial support. S.K.S. thankfully acknowledges Professor Sanjeev Kumar Srivastava, Department of Physics, Indian Institute of Technology, Kharagpur, for XPS facilities.
Supporting Information Available
The Supporting Information is available free of charge at https://pubs.acs.org/doi/10.1021/acsomega.0c05034.
FTIR spectra, energy-dispersive X-ray spectra, elemental composition table, conductivity measurement, CV curves, CD curves, cycling stability curves of CuS, RGO, and RGCS12, Nyquist plot with matched and equivalent circuit, and curves related to dielectric properties (PDF)
Author Contributions
The proposed work has been done by K. G. under the supervision of Prof. S.K.S. and equal contribution has been made by K. G. and Prof. S. K. S. in writing and reviewing this manuscript.
The authors declare no competing financial interest.
Supplementary Material
References
- Panda P. K.; Grigoriev A.; Mishra Y. K.; Ahuja R. Progress in supercapacitors: roles of two dimensional nanotubular materials. Nanoscale Adv. 2020, 2, 70–108. 10.1039/c9na00307j. [DOI] [PMC free article] [PubMed] [Google Scholar]
- Balasubramaniam S.; Mohanty A.; Balasingam S. K.; Kim S. J.; Ramadoss A. Insight into the mechanism,material selection and performance evaluation of super capatteries. Nano-Micro Lett. 2020, 12, 85. 10.1007/s40820-020-0413-7. [DOI] [PMC free article] [PubMed] [Google Scholar]
- Yuksel R.; Buyukcakir O.; Panda P. K.; Lee S. H.; Jiang Y.; Singh D.; Hansen S.; Adelung R.; Mishra Y. K.; Ahuja R.; Ruoff R. S. Necklace like nitrogen doped tubular carbon 3D frameworks for electrochemical energy storage. Adv. Funct. Mater. 2020, 30, 1909725. 10.1002/adfm.201909725. [DOI] [Google Scholar]
- Wang Y.; Xia Y. Recent progress in supercapacitors: from materials design to system construction. Adv. Mater. 2013, 25, 5336–5342. 10.1002/adma.201301932. [DOI] [PubMed] [Google Scholar]
- Zhang Y.; Li L.; Su H.; Huang W.; Dong X. Binary metal oxide: advanced energy storage materials in supercapacitors. J. Mater. Chem. A 2015, 3, 43–59. 10.1039/c4ta04996a. [DOI] [Google Scholar]
- Roy P.; Srivastava S. K. Low-temperature synthesis of CuSnanorods by simple wet chemical method. Mater. Lett. 2007, 61, 1693–1697. 10.1016/j.matlet.2006.07.101. [DOI] [Google Scholar]
- Roy P.; Srivastava S. K. Hydrothermal growth of CuS nanowires from Cu-dithiooxamide, a novel single-source precursor. Cryst. Growth Des. 2006, 6, 1921–1926. 10.1021/cg060134+. [DOI] [Google Scholar]
- Roy P.; Srivastava S. K. Solvothermal growth of flower-like morphology from nanorods of copper sulfides. J. Nanosci. Nanotechnol. 2008, 8, 1523–1527. 10.1166/jnn.2008.036. [DOI] [PubMed] [Google Scholar]
- Roy P.; Srivastava S. K. Nanostructured copper sulfides: synthesis, properties and applications. CrystEngComm 2015, 17, 7801–7815. 10.1039/c5ce01304f. [DOI] [Google Scholar]
- Xu W.; Liang Y.; Su Y.; Zhu S.; Cui Z.; Yang X.; Inoue A.; Wei Q.; Liang C. Synthesis and properties of morphology controllable copper sulphide nanosheets for supercapacitor application. Electrochim. Acta 2016, 211, 891–899. 10.1016/j.electacta.2016.06.118. [DOI] [Google Scholar]
- Fu W.; Han W.; Zha H.; Mei J.; Li Y.; Zhang Z.; Xie E. Nanostructured CuS networks composed of interconnected nanoparticles for asymmetric supercapacitors. Phys. Chem. Chem. Phys. 2016, 18, 24471–24476. 10.1039/c6cp02228f. [DOI] [PubMed] [Google Scholar]
- Guo J.; Zhang X.; Sun Y.; Zhang X.; Tang L.; Zhang X. Double-shell CuS nanocages as advanced supercapacitor electrode materials. J. Power Sources 2017, 355, 31–35. 10.1016/j.jpowsour.2017.04.052. [DOI] [Google Scholar]
- Peng H.; Ma G.; Mu J.; Sun K.; Lei Z. Controllable synthesis of CuS with hierarchical structures via a surfactant-free method for high-performance supercapacitors. Mater. Lett. 2014, 122, 25–28. 10.1016/j.matlet.2014.01.173. [DOI] [Google Scholar]
- Jin K.; Zhou M.; Zhao H.; Zhai S.; Ge F.; Zhao Y.; Cai Z. Electrodeposited CuSnanosheets on carbonized cotton fabric as flexible supercapacitor electrode for high energy storage. Electrochim. Acta 2019, 295, 668–676. 10.1016/j.electacta.2018.10.182. [DOI] [Google Scholar]
- Huang K.-J.; Zhang J.-Z.; Fan Y. One-step solvothermal synthesis of different morphologies CuSnanosheets compared as supercapacitor electrode materials. J. Alloys Compd. 2015, 625, 158–163. 10.1016/j.jallcom.2014.11.137. [DOI] [Google Scholar]
- Hsu Y.-K.; Chen Y.-C.; Lin Y.-G. Synthesis of copper sulfide nanowire arrays for high-performance supercapacitors. Electrochim. Acta 2014, 139, 401–407. 10.1016/j.electacta.2014.06.138. [DOI] [Google Scholar]
- Radhakrishnan S.; Kim H.-Y.; Kim B.-S. Expeditious and eco-friendly fabrication of highly uniform microflower superstructures and their applications in highly durable methanol oxidation and high-performance supercapacitors. J. Mater. Chem. A 2016, 4, 12253–12262. 10.1039/c6ta04888a. [DOI] [Google Scholar]
- Zhang J.; Feng H.; Yang J.; Qin Q.; Fan H.; Wei C.; Zheng W. Solvothermal synthesis of three-dimensional hierarchical CuS microspheres from a Cu-based ionic liquid precursor for high performance asymmetric supercapacitors. ACS Appl. Mater. Interfaces 2015, 7, 21735–21744. 10.1021/acsami.5b04452. [DOI] [PubMed] [Google Scholar]
- Li X.; Zhou K.; Zhou J.; Shen J.; Ye M. CuS nanoplatelets arrays grown on graphene nanosheets as advanced electrode materials for supercapacitor applications. J. Mater. Sci. Technol. 2018, 34, 2342–2349. 10.1016/j.jmst.2018.06.013. [DOI] [Google Scholar]
- De B.; Kuila T.; Kim N. H.; Lee J. H. Carbon dot stabilized copper sulphide nanoparticles decorated graphene oxide hydrogel for high performance asymmetric supercapacitor. Carbon 2017, 122, 247–257. 10.1016/j.carbon.2017.06.076. [DOI] [Google Scholar]
- Himasree P.; Durga I. K.; Krishna T. N. V.; Rao S. S.; Muralee Gopi C. V. V.; Revathi S.; Prabakar K.; Kim H.-J. One-step hydrothermal synthesis ofCuS@MnS on Ni foam for high performance supercapacitor electrode material. Electrochim. Acta 2019, 305, 467–473. 10.1016/j.electacta.2019.03.041. [DOI] [Google Scholar]
- Zhu W.; Ou X.; Lu Z.; Chen K.; Ling Y.; Zhang H. Enhanced performance of hierarchical CuS clusters applying TRGO as conductive carrier for supercapacitors. J. Mater. Sci.: Mater. Electron. 2019, 30, 5760–5770. 10.1007/s10854-019-00872-6. [DOI] [Google Scholar]
- BoopathiRaja R.; Parthibavarman M.; Prabhu S.; Ramesh R. A facile one step hydrothermal induced hexagonal shaped CuS/rGO nanocomposites for asymmetric supercapacitors. Mater. Today: Proc. 2019, 26, 3507–3513. 10.1016/j.matpr.2019.06.006. [DOI] [Google Scholar]
- Zhao T.; Yang W.; Zhao X.; Peng X.; Hu J.; Tang C.; Li T. Facile preparation of reduced graphene oxide/copper sulfide composite as electrode materials for supercapacitors with high energy density. Composites, Part B 2018, 150, 60–67. 10.1016/j.compositesb.2018.05.058. [DOI] [Google Scholar]
- Xiao W.; Wenjie Z.; Tong F.; Yanhua Z.; Hongdong L.; Hong Y.; Liangliang T.; Yong P. One-pot solvothermal synthesis of flower-like copper sulfide/reduced graphene oxide composite superstructures as high-performance supercapacitor electrode materials. J. Mater. Sci.: Mater. Electron. 2017, 28, 5931–5940. 10.1007/s10854-016-6267-6. [DOI] [Google Scholar]
- Chen C.; Zhang Q.; Ma T.; Fan W. Synthesis and electrochemical properties of nitrogen-doped graphene/copper sulphide nanocomposite for supercapacitor. J. Nanosci. Nanotechnol. 2017, 17, 2811–2816. 10.1166/jnn.2017.12668. [DOI] [PubMed] [Google Scholar]
- Nanostructured metal oxide, hydroxide, and chalcogenide for supercapacitor applications. In nanomaterials for electrochemical energy storage devices; Roy P., Raj S., Srivastava S. K., Eds.; Wiley & Sons: New York, 2019; pp 521–571. [Google Scholar]
- Panigrahi R.; Srivastava S. K. Trapping of microwave radiation in hollow polypyrrole microsphere through enhanced internal reflection: a novel approach. Sci. Rep. 2015, 5, 7638. 10.1038/srep07638. [DOI] [PMC free article] [PubMed] [Google Scholar]
- Manna K.; Srivastava S. K. Fe3O4@carbon@polyaniline trilaminar Core-Shell composites as superior microwave absorber in shielding of electromagnetic pollution. ACS Sustainable Chem. Eng. 2017, 5, 10710–10721. 10.1021/acssuschemeng.7b02682. [DOI] [Google Scholar]
- Manna K.; Srivastava S. K.; Mittal V. Role of enhanced hydrogen bonding of selectively reduced graphite oxide in fabrication of poly (vinyl alcohol) nanocomposites in water as EMI shielding material. J. Phys. Chem. C 2016, 120, 17011–17023. 10.1021/acs.jpcc.6b03356. [DOI] [Google Scholar]
- Yin P.; Deng Y.; Zhang L.; Li N.; Feng X.; Wang J.; Zhang Y. Facile synthesis and microwave absorption investigation of activated carbon@Fe3O4 composites in the low frequency band. RSC Adv. 2018, 8, 23048–23057. 10.1039/c8ra04141e. [DOI] [PMC free article] [PubMed] [Google Scholar]
- Hu X.-S.; Shen Y.; Xu L.-H.; Wang L.-M.; Lu L.-s.; Zhang Y.-t. Preparation of flower-like CuS by solvothermal method for photocatalytic, UV protection and EMI shielding applications. Appl. Surf. Sci. 2016, 385, 162–170. 10.1016/j.apsusc.2016.05.089. [DOI] [Google Scholar]
- Zhao B.; Shao G.; Fan B.; Zhao W.; Xie Y.; Zhang R. Synthesis of flower-like CuS hollow microspheres based on nanoflakes self-assembly and their microwave absorption properties. J. Mater. Chem. A 2015, 3, 10345–10352. 10.1039/c5ta00086f. [DOI] [Google Scholar]
- Chen Y.-H.; Huang C.-Y.; Lai F.-D.; Roan M.-L.; Chen K.-N.; Yeh J.-T. Electroless deposition of the copper sulfide coating on polyacrylonitrile with a chelating agent of triethanolamine and its EMI Shielding effectiveness. Thin Solid Films 2009, 517, 4984–4988. 10.1016/j.tsf.2009.03.137. [DOI] [Google Scholar]
- Hu X.-S.; Shen Y. Fabrication of novel polyaniline/flower-like copper monosulfide composites with enhanced electromagnetic interference shielding effectiveness. J. Appl. Polym. Sci. 2017, 134, 45232. 10.1002/app.45232. [DOI] [Google Scholar]
- He S.; Wang G.-S.; Lu C.; Liu J.; Wen B.; Liu H.; Guo L.; Cao M.-S. Enhanced wave absorption of nanocomposites based on the synthesized complex symmetrical CuS nanostructure and poly(vinylidene fluoride). J. Mater. Chem. A 2013, 1, 4685. 10.1039/c3ta00072a. [DOI] [Google Scholar]
- Wei Y.-Z.; Wang G.-S.; Wu Y.; Yue Y.-H.; Wu J.-T.; Lu C.; Guo L. Bioinspired design and assembly of platelet reinforced polymer films with enhanced absorption properties. J. Mater. Chem. A 2014, 2, 5516–5524. 10.1039/c4ta00010b. [DOI] [Google Scholar]
- Sun J.; Shen Y.; Hu X.-S. Polyaniline/flower-like CuS composites with improved electromagnetic interference shielding effectiveness. Polym. Bull. 2018, 75, 653–667. 10.1007/s00289-017-2060-9. [DOI] [Google Scholar]
- Zhang X.-J.; Wang G.-S.; Wei Y.-Z.; Guo L.; Cao M.-S. Polymer-composite with high dielectric constant and enhanced absorption properties based on graphene–CuS nanocomposites and polyvinylidene fluoride. J. Mater. Chem. A 2013, 1, 12115–12122. 10.1039/c3ta12451g. [DOI] [Google Scholar]
- Sharma D.; Menon A. V.; Bose S. Graphene templated growth of copper sulphide “flowers” can suppress electromagnetic interference. Nanoscale Adv. 2020, 2, 3292–3303. 10.1039/d0na00368a. [DOI] [PMC free article] [PubMed] [Google Scholar]
- He S.; Wang G.-S.; Lu C.; Luo X.; Wen B.; Guo L.; Cao M.-S. Controllable fabrication of CuS hierarchical nanostructures and their optical, photocatalytic, and wave absorption properties. ChemPlusChem 2013, 78, 250–258. 10.1002/cplu.201200287. [DOI] [Google Scholar]
- Wang Y.; Chen D.; Yin X.; Xu P.; Wu F.; He M. Hybrid of MoS2 and reduced graphene oxide: a lightweight and broadband electromagnetic wave absorber. ACS Appl. Mater. Interfaces 2015, 7, 26226–26234. 10.1021/acsami.5b08410. [DOI] [PubMed] [Google Scholar]
- Biswas S.; Dutta S.; Panja S. S.; Bose S. Template-free synthesis of “wool-ball” like hollow CuS structures can effectively suppress electromagnetic radiation: a mechanistic insight. J. Phys. Chem. C 2019, 123, 17136–17147. 10.1021/acs.jpcc.9b03753. [DOI] [Google Scholar]
- Liu P.; Huang Y.; Yan J.; Yang Y.; Zhao Y. Construction of CuS nanoflakes vertically aligned on magnetically decorated graphene and their enhanced microwave absorption properties. ACS Appl. Mater. Interfaces 2016, 8, 5536–5546. 10.1021/acsami.5b10511. [DOI] [PubMed] [Google Scholar]
- Zhu T.; Xia B.; Zhou L. Arrays of ultrafine CuS nanoneedles supported on a CNT backbone for application in supercapacitors. J. Mater. Chem. 2012, 22, 7851–7855. 10.1039/c2jm30437f. [DOI] [Google Scholar]
- Huang K.-J.; Zhang J.-Z.; Xing K. One-step synthesis of layered CuS/multi-walled carbon nanotube nanocomposites for supercapacitor electrode material with ultrahigh specific capacitance. Electrochim. Acta 2014, 149, 28–33. 10.1016/j.electacta.2014.10.079. [DOI] [Google Scholar]
- Zhao T.; Peng X.; Zhao X.; Hu J.; Jiang T.; Lu X.; Zhang H.; Li T.; Ahmad I. Preparation and performance of carbon dot decorated copper sulphide/carbon nanotubes hybrid composite as supercapacitor electrode materials. J. Alloys Compd. 2020, 817, 153057. 10.1016/j.jallcom.2019.153057. [DOI] [Google Scholar]
- De B.; Balamurugan J.; Kim N. H.; Lee J. H. Enhanced electrochemical and photocatalytic performance of core–shell CuS@carbon quantum dots@carbon hollow nanospheres. ACS Appl. Mater. Interfaces 2017, 9, 2459–2468. 10.1021/acsami.6b13496. [DOI] [PubMed] [Google Scholar]
- Lu Y.; Liu X.; Wang W.; Cheng J.; Yan H.; Tang C.; Kim J. −K.; Luo Y. Hierarchical, porous CuS microspheres integrated with carbon nanotubes for high-performance supercapacitors. Sci. Rep. 2015, 5, 16584. 10.1038/srep16584. [DOI] [PMC free article] [PubMed] [Google Scholar]
- Muthu N. S.; Samikannu S. D.; Gopalan M. Influence of thiourea concentration on the CuS nanostructures and identification of the most suited electrolyte for high energy density supercapacitor. Ionics 2019, 25, 4409–4423. 10.1007/s11581-019-03002-8. [DOI] [Google Scholar]
- Podili S.; Geetha D.; Ramesh P. S. A report on CTAB stabilized CuS nanostructures with enhanced structural, morphological and electrochemical properties. Int. J. Res. Appl. Sci. Eng. Technol. 2018, 6, 2313–2319. [Google Scholar]
- Singhal R.; Thorne D.; LeMaire P. K.; Martinez X.; Zhao C.; Gupta R. K.; Uhl D.; Scanley E.; Broadbridge C. C.; Sharma R. K. Synthesis and characterization of CuS, CuS/graphene oxide nanocomposite for supercapacitor applications. AIP Adv. 2020, 10, 035307. 10.1063/1.5132713. [DOI] [Google Scholar]
- Marcano D. C.; Kosynkin D. V.; Berlin J. M.; Sinitskii A.; Sun Z.; Slesarev A.; Alemany L. B.; Lu W.; Tour J. M. Improved synthesis of graphene oxide. ACS Nano 2010, 4, 4806–4814. 10.1021/nn1006368. [DOI] [PubMed] [Google Scholar]
- Abboudi M.; Mosset A. Synthesis of d transition metal sulfides from amorphous dithiooxamide complexes. J. Solid State Chem. 1994, 109, 70–73. 10.1006/jssc.1994.1073. [DOI] [Google Scholar]
- Abboudi M.; Mosset A.; Galy J. Metal complexes of rubeanic acid. 3. large-angle x-ray scattering studies of amorphous copper(II) and nickel(II) complexes. Inorg. Chem. 1985, 24, 2091–2094. 10.1021/ic00207a026. [DOI] [Google Scholar]
- Kartick B.; Srivastava S. K.; Srivastava a. I. Green synthesis of graphene. J. Nanosci. Nanotechnol. 2013, 13, 4320–4324. 10.1166/jnn.2013.7461. [DOI] [PubMed] [Google Scholar]
- Singh A. K.; Kumar A.; Haldar K. K.; Gupta V.; Singh K. Lightweight reduced graphene oxide-Fe3O4 nanoparticle composite in the quest for an excellent electromagnetic interference shielding material. Nanotechnology 2018, 29, 245203. 10.1088/1361-6528/aab87a. [DOI] [PubMed] [Google Scholar]
- Zhu Y.; Pan Y.; Xu H.; Guo J. Investigation of the devitrification and microwave penetrating properties of fused silica. J. Non-Cryst. Solids 2009, 355, 785–790. 10.1016/j.jnoncrysol.2009.03.002. [DOI] [Google Scholar]
- Tiruneh S. N.; Kang B. K.; Ngoc Q. T.; Yoon D. H. Enhanced electrochemical performance of lamellar structured Co–Ni(OH)2/reduced graphene oxide(rGO) via hydrothermal synthesis. RSC Adv. 2016, 6, 4764–4769. 10.1039/c5ra23724f. [DOI] [Google Scholar]
- Lu L.; Xu S.; An J.; Yan S. Electrochemical performance of CNTs/RGO/MnO2 composite material for supercapacitor. Nanomater. Nanotechnol. 2016, 6, 1847980416663687. 10.1177/1847980416663687. [DOI] [Google Scholar]
- Liu H.; Zhang L.; Ruan H. Flower-like CuS/reduced graphene oxide composite as anode materials for lithium ion batteries. Int. J. Electrochem. Sci. 2018, 13, 4775–4781. 10.20964/2018.05.60. [DOI] [Google Scholar]
- Song W.; Nie G.; Ji W.; Jiang Y.; Lu X.; Zhao B.; Ozaki Y. Synthesis of bifunctional reduced graphene oxide/CuS/Au composite nanosheets for in situ monitoring of a peroxidase-like catalytic reaction by surface-enhanced raman spectroscopy. RSC Adv. 2016, 6, 54456–54462. 10.1039/c6ra09471f. [DOI] [Google Scholar]
- Fu W.; Liu M.; Xue F.; Wang X.; Diao Z.; Guo L. Facile polyol synthesis of CuS nanocrystals with a hierarchical nanoplate structure and their application for electrocatalysis and photocatalysis. RSC Adv. 2016, 6, 80361–80367. 10.1039/c6ra17221k. [DOI] [Google Scholar]
- Hurma T.; Kose S. XRD Raman analysis and optical properties of CuS nanostructured film. Optik 2016, 127, 6000–6006. 10.1016/j.ijleo.2016.04.019. [DOI] [Google Scholar]
- Maitra T.; Sharma S.; Srivastava A.; Cho Y.-K.; Madou M.; Sharma A. Improved graphitization and electrical conductivity of suspended carbon nanofibers derived from carbon nanotube/polyacrylonitrile composites by directed electrospinning. Carbon 2012, 50, 1753–1761. 10.1016/j.carbon.2011.12.021. [DOI] [Google Scholar]
- Chen C.; Liu B.; Ru Q.; Ma S.; An B.; Hou X.; Hu S. Fabrication of cubic spinel MnCo2O4 nanoparticles embedded in graphene sheets with their improved lithium-ion and sodium-ion storage properties. J. Power Sources 2016, 326, 252–263. 10.1016/j.jpowsour.2016.06.131. [DOI] [Google Scholar]
- Yan X.; Gu Y.; Li C.; Zheng B.; Li Y.; Zhang T.; Zhang Z.; Yang M. Morphology-controlled synthesis of Bi2S3 nanorods-reduced graphene oxide composites with high-performance for electrochemical detection of dopamine. Sens. Actuators, B 2018, 257, 936–943. 10.1016/j.snb.2017.11.037. [DOI] [Google Scholar]
- Ossonon B. D.; Bélanger D. Synthesis and characterization of sulfophenyl-functionalized reduced graphene oxide sheets. RSC Adv. 2017, 7, 27224–27234. 10.1039/c6ra28311j. [DOI] [Google Scholar]
- Fayazfar H.; Afshar A.; Dolati A. Controlled growth of well-aligned carbon nanotubes, electrochemical modification and electrodeposition of multiple shapes of gold nanostructures. Mater. Sci. Appl. 2013, 04, 667–678. 10.4236/msa.2013.411083. [DOI] [Google Scholar]
- Riyaz S.; Parveen A.; Azam A. Microstructural and optical properties of CuS nanoparticles prepared by sol gel route. Perspect. Sci. 2016, 8, 632–635. 10.1016/j.pisc.2016.06.041. [DOI] [Google Scholar]
- Christy R. S.; Kumaran J. T. T. Phase transition in CuS nanoparticles. J. Nonoxide Glasses 2014, 6, 13–22. [Google Scholar]
- Thiruppathi A. R.; Sidhureddy B.; Boateng E.; Soldatov D. V.; Chen A. Synthesis and electrochemical study of three-dimensional graphene-based nanomaterials for energy applications. Nanomaterials 2020, 10, 1295. 10.3390/nano10071295. [DOI] [PMC free article] [PubMed] [Google Scholar]
- Kim T.; Parale V.; Jung H.-N.-R.; Kim Y.; Driss Z.; Driss D.; Bouabidi A.; Euchy S.; Park H.-H. Facile Synthesis of SnO2 aerogel/reduced graphene oxide nanocomposites via in situ annealing for the photocatalytic degradation of methyl orange. Nanomaterials 2019, 9, 358. 10.3390/nano9030358. [DOI] [PMC free article] [PubMed] [Google Scholar]
- Agarwal P. R.; Kumar R.; Kumari S.; Dhakate S. R. Three-dimensional and highly ordered porous carbon–MnO2 composite foam for excellent electromagnetic interference shielding efficiency. RSC Adv. 2016, 6, 100713–100722. 10.1039/c6ra23127f. [DOI] [Google Scholar]
- Li W.; Song W.; Wang H.; Kang Y.-M. In situ self-assembly of Ni3S2/MnS/CuS/reduced graphene composite on nickel foam for high power supercapacitors. RSC Adv. 2019, 9, 31532–31542. 10.1039/c9ra05435a. [DOI] [PMC free article] [PubMed] [Google Scholar]
- Nie G.; Lu X.; Lei J.; Yang L.; Wang C. Facile and controlled synthesis of bismuth sulfide nanorods-reduced graphene oxide composites with enhanced supercapacitor performance. Electrochim. Acta 2015, 154, 24–30. 10.1016/j.electacta.2014.12.090. [DOI] [Google Scholar]
- Lu H.; Guo Q.; Zan F.; Xia H. Bi2S3 nanoparticles anchored on graphene nanosheets with superior electrochemical performance for supercapacitors. Mater. Res. Bull. 2017, 96, 471–477. 10.1016/j.materresbull.2017.05.047. [DOI] [Google Scholar]
- Karikalan N.; Karthik R.; Chen S. −M.; Karuppiah C.; Elangovan A. Sonochemical synthesis of sulfur doped reduced graphene oxide supported CuS nanoparticles for the non-enzymatic glucose sensor applications. Sci. Rep. 2017, 7, 2494. 10.1038/s41598-017-02479-5. [DOI] [PMC free article] [PubMed] [Google Scholar]
- Rao S. S.; Durga I. K.; Kang T.-S.; Kim S.-K.; Punnoose D.; Gopi C. V.; Eswar Reddy A.; Krishna T. N.; Kim H. J. Enhancing the photovoltaic performance and stability of QDSSCs using surface reinforced Pt nanostructures with controllable morphology and superior electrocatalysis via cost-effective chemical bath deposition. Dalton Trans. 2016, 45, 3450–3463. 10.1039/c5dt04887g. [DOI] [PubMed] [Google Scholar]
- Zhao C.; Wu X.; Zhang X.; Li P.; Qian X. Facile synthesis of layered CuS/RGO/CuS nanocomposite on Cu foam for ultrasensitive nonenzymatic detection of glucose. J. Electroanal. Chem. 2017, 785, 172–179. 10.1016/j.jelechem.2016.12.039. [DOI] [Google Scholar]
- Liu J.; Liang C.; Zhu X.; Lin Y.; Zhang H.; Wu S. Understanding the solvent molecules induced spontaneous growth of uncapped tellurium nanoparticles. Sci. Rep. 2016, 6, 32631. 10.1038/srep32631. [DOI] [PMC free article] [PubMed] [Google Scholar]
- Xie L.-J.; Chen C.-M.; Zhang C.-M.; Wan L.; Wang J.-L.; Kong Q.-Q.; Lv C.-X.; Li K.-X.; Sun G.-H. A novel asymmetric supercapacitor with an activated carbon cathode and a reduced graphene oxide-cobalt oxide nanocomposite anode. J. Power Sources 2013, 242, 148–156. 10.1016/j.jpowsour.2013.05.081. [DOI] [Google Scholar]
- Chuai M.; Yang T.; Zhang M. Quantum capacitance of CuS:Ce3+quantum dots as high-performing supercapacitor electrodes. J. Mater. Chem. A 2018, 6, 6534–6541. 10.1039/c8ta01388h. [DOI] [Google Scholar]
- Singh A. K.; Yadav A. N.; Srivastava A.; Haldar K. K.; Tomar M.; Alaferdov A. V.; Moshkalev S. A.; Gupta V.; Singh K. CdSe/V2O5 core/shell quantum dots decorated reduced graphene oxide nanocomposite for high-performance electromagnetic interference shielding application. Nanotechnology 2019, 30, 505704. 10.1088/1361-6528/ab4290. [DOI] [PubMed] [Google Scholar]
- Gong Y.-T.; Won M.-S.; Shim Y.-B.; Park S.-M. CuII-poly(dithiooxamide) film coated anion selective electrode. Electroanalysis 1996, 8, 356–361. 10.1002/elan.1140080411. [DOI] [Google Scholar]
- Gómez-Urbano J. L.; Gómez-Cámer J. L.; Botas C.; Díez N.; López del Amo J. M.; Rodríguez-Martinez L. M.; Carriazo D.; Rojo T. Hydrothermally reduced graphene oxide for the effective wrapping of sulfur particles showing long term stability as electrodes for Li-S batteries. Carbon 2018, 139, 226–233. 10.1016/j.carbon.2018.06.053. [DOI] [Google Scholar]
- Shi S.-L.; Liang J. The effect of multi-wall carbon nanotubes on electromagnetic interference shielding of ceramic composites. Nanotechnology 2008, 19, 255707. 10.1088/0957-4484/19/25/255707. [DOI] [PubMed] [Google Scholar]
- Shi S.-L.; Liang J. Effect of multiwall carbon nanotubes on electrical and dielectric properties of yttria-stabilized zirconia ceramic. J. Am. Ceram. Soc. 2006, 89, 3533–3535. 10.1111/j.1551-2916.2006.01232.x. [DOI] [Google Scholar]
- Du F.-P.; Cao N.-N.; Zhang Y.-F.; Fu P.; Wu Y.-G.; Lin Z.-D.; Shi R.; Amini A.; Cheng C. PEDOT:PSS/graphene quantum dots films with enhanced thermoelectric properties via strong interfacial interaction and phase separation. Sci. Rep. 2018, 8, 6441. 10.1038/s41598-018-24632-4. [DOI] [PMC free article] [PubMed] [Google Scholar]
- Amollo T. A.; Mola G. T.; Nyamori V. O. Reduced graphene oxide-germanium quantum dot nanocomposite: Electronic, optical and magnetic properties. Nanotechnology 2017, 28, 495703. 10.1088/1361-6528/aa9299. [DOI] [PubMed] [Google Scholar]
- Higgins T. M.; McAteer D.; Coelho J. C. M.; Sanchez B. M.; Gholamvand Z.; Moriarty G.; McEvoy N.; Berner N. C.; Duesberg G. S.; Nicolosi V.; Coleman J. N. Effect of percolation on the capacitance of supercapacitor electrodes prepared from composites of manganese dioxide nanoplatelets and carbon nanotubes. ACS Nano 2014, 8, 9567–9579. 10.1021/nn5038543. [DOI] [PubMed] [Google Scholar]
- Oh Y. J.; Yoo J. J.; Kim Y. I.; Yoon J. K.; Yoon H. N.; Kim J.-H.; Park S. B. Oxygen functional groups and electrochemical capacitive behavior of incompletely reduced graphene oxides as a thin-film electrode of supercapacitor. Electrochim. Acta 2014, 116, 118–128. 10.1016/j.electacta.2013.11.040. [DOI] [Google Scholar]
- Durga I. K.; Rao S. S.; Ahn J.-W.; Park T.-Y.; Soo B. J.; Ho C.-I.; Prabakar K.; Kim H.-J. Dice-like nanostructure of a CuS@PbS composite for high-performance supercapacitor electrode applications. Energies 2018, 11, 1624. 10.3390/en11071624. [DOI] [Google Scholar]
- Krishnamoorthy K.; Kumar Veerasubramani G.; Rao A. N.; Jae Kim S. One-pot hydrothermal synthesis, characterization and electrochemical properties of CuS nanoparticles towards supercapacitor applications. Mater. Res. Express 2014, 1, 035006. 10.1088/2053-1591/1/3/035006. [DOI] [Google Scholar]
- Quan H.; Cheng B.; Chen D.; Su X.; Xiao Y.; Lei S. One-pot synthesis of α-MnS/nitrogen-doped reduced graphene oxide hybrid for high-performance asymmetric supercapacitors. Electrochim. Acta 2016, 210, 557–566. 10.1016/j.electacta.2016.05.031. [DOI] [Google Scholar]
- Zhang Q.; Rong J.; Ma D.; Wei B. The governing self-discharge processes in activated carbon fabric-based supercapacitors with different organic electrolytes. Energy Environ. Sci. 2011, 4, 2152–2159. 10.1039/c0ee00773k. [DOI] [Google Scholar]
- Zhang Y.; Cui X.; Zu L.; Cai X.; Liu Y.; Wang X.; Lian H. New supercapacitors based on the synergetic redox effect between electrode and electrolyte. Materials 2016, 9, 734. 10.3390/ma9090734. [DOI] [PMC free article] [PubMed] [Google Scholar]
- Wang P.-H.; Wang T.-L.; Lin W.-C.; Lin H.-Y.; Lee M.-H.; Yang C.-H. Crosslinked polymer ionic liquid/ionic liquid blends prepared by photopolymerization as solid-state electrolytes in supercapacitors. Nanomaterials 2018, 8, 225. 10.3390/nano8040225. [DOI] [PMC free article] [PubMed] [Google Scholar]
- Chakravarty A.; Maiti S.; Mahanty S.; De G. Green synthesis of electrospun porous carbon nanofibers from sucrose and doping of Ag nanoparticle with improved electrical and electrochemical properties. ChemistrySelect 2017, 2, 2265–2276. 10.1002/slct.201601920. [DOI] [Google Scholar]
- Yang Y. J. Facile preparation of CuS-coated multiwalled carbon nanotubes for supercapacitor application: a study on the effect of electrolyte. Fullerenes, Nanotubes, Carbon Nanostruct. 2017, 25, 497–503. 10.1080/1536383x.2017.1344836. [DOI] [Google Scholar]
- Pandit B.; Pande S. A.; Sankapal B. R. Facile SILAR processed Bi2S3:PbS solid solution on MWCNTs for high performance electrochemical supercapacitor. Chin. J. Chem. 2019, 37, 1279–1286. 10.1002/cjoc.201900222. [DOI] [Google Scholar]
- Ma Y.; Jia Y.; Wang L.; Yang M.; Bi Y.; Qi Y. One-pot synthesis of hierarchical Bi2S3-MoS2nanosheet array with high electrochemical performance. J. Power Sources 2017, 342, 921–928. 10.1016/j.jpowsour.2017.01.020. [DOI] [Google Scholar]
- Ates M.; Sarac A. S. Capacitive behavior of polycarbazole- and poly(N-vinylcarbazole)-coated carbon fiber microelectrodes in various solutions. J. Appl. Electrochem. 2009, 39, 2043–2048. 10.1007/s10800-009-9882-6. [DOI] [Google Scholar]
- Gupta T. K.; Singh B. P.; Singh V. N.; Teotia S.; Singh A. P.; Elizabeth I.; Dhakate S. R.; Dhawan S. K.; Mathur R. B. MnO2 decorated graphene nanoribbons with superior permittivity and excellent microwave shielding properties. J. Mater. Chem. A 2014, 2, 4256–4263. 10.1039/c3ta14854h. [DOI] [Google Scholar]
- Zhou L.; Huang J.; Wang X.; Wang H.; Wang Z.; Li Z.; Zheng H.; Mu W. Dielectric properties and electromagnetic interference shielding effectiveness of Al2O3-based composites filled with FeSiAl and flaky graphite. J. Alloys Compd. 2020, 829, 154556. 10.1016/j.jallcom.2020.154556. [DOI] [Google Scholar]
- Xu W.; Wang G.-S.; Yin P.-G. Designed fabrication of reduced graphene oxides/Ni hybrids for effective electromagnetic absorption and shielding. Carbon 2018, 139, 759–767. 10.1016/j.carbon.2018.07.044. [DOI] [Google Scholar]
- Zhang X.-J.; Zhu J.-Q.; Yin P.-G.; Guo A.-P.; Huang A.-P.; Guo L.; Wang G.-S. Tunable high-performance microwave absorption of Co1–xShollow spheres constructed by nanosheets within ultralow filler loading. Adv. Funct. Mater. 2018, 28, 1800761. 10.1002/adfm.201800761. [DOI] [Google Scholar]
- Gao S.; Wang G. S.; Guo L.; Yu S. H. Tunable and ultraefficient microwave absorption properties of trace N-doped two-dimensional carbon-based nanocomposites loaded with multi-rare earth oxides. Small 2020, 16, 1906668. 10.1002/smll.201906668. [DOI] [PubMed] [Google Scholar]
- Meng X.-M.; Zhang X.-J.; Lu C.; Pan Y.-F.; Wang G.-S. Enhanced absorbing properties of three-phase composites based on a thermoplastic-ceramic matrix (BaTiO3 + PVDF) and carbon black nanoparticles. J. Mater. Chem. A 2014, 2, 18725–18730. 10.1039/c4ta04493b. [DOI] [Google Scholar]
Associated Data
This section collects any data citations, data availability statements, or supplementary materials included in this article.