Abstract
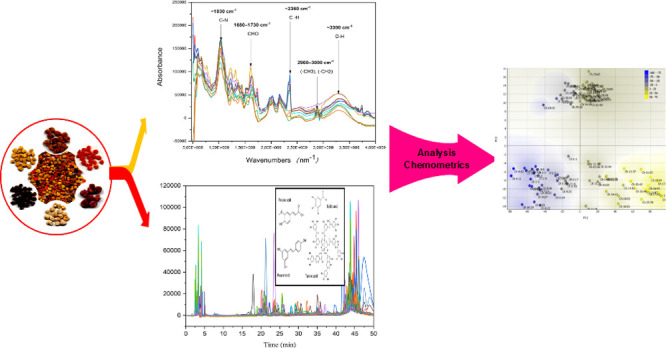
Bee pollen collected by honeybees (Apis mellifera) is one of the bee products, and it is as valuable as honey, propolis, royal jelly, or beebread. Its quality varies according to its geographic location or plant sources. This study aimed to apply rapid, simple, and accurate analytical methods such as attenuated total reflectance Fourier transform infrared spectroscopy (ATR–FTIR) and high-performance liquid chromatography (HPLC) along with chemometrics analysis to construct a model aimed at discriminating between different pollen samples. In total, 33 samples were collected and analyzed using principal component analysis (PCA), hierarchical clustering analysis (HCA), and partial least squares regression (PLS) to assess the differences and similarities between them. The PCA score plot based on both HPLC and ATR–FTIR revealed the same discriminatory pattern, and the samples were divided into four major classes depending on their total content of polyphenols. The results revealed that spectral data obtained from ATR–FTIR acquired in the region (4000–500 cm–1) were further subjected to a standard normal variable (SNV) method that removes scattering effects from spectra. However, PCA, HCA, and PLS showed that the best PLS model was obtained with a regression coefficient (R2) of 0.9001, root-mean-square estimation error (RMSEE) of 0.0304, and root-mean-squared error cross-validation (RMSEcv) of 0.036. Discrimination between the three species has also been possible by combining the pre-processed ATR–FTIR spectra with PCA and PLS. Additionally, the HPLC chromatograms after pre-treatment (SNV) were subjected to unsupervised analysis (PCA–HCA) and supervised analysis (PLS). The PLS model confers good results by factors (R2 = 0.98, RMSEE = 8.22, and RMSEcv = 27.86). Prospects for devising bee pollen quality assessment methods include utilizing ATR–FTIR and HPLC in combination with multivariate methods for rapid authentication of the geographic location or plant sources of bee pollen.
Introduction
Food diversity plays a significant role in health care systems in the world. Standardization and control quality of food products are a major challenge that restricts their incorporation into medicine. Over the past few years, more steps have been taken not just to enhance and improve the food quality and safety but also to develop acceptable and efficient analysis techniques that validate their goodness. The applications of various chromatographic and spectroscopic fingerprints are nowadays the much more commonly known techniques in the evaluation and quality control of several food items in combination with chemometrics analysis.1
Bee pollen is one of the products that honeybee produces. By adding nectar and saliva, bee pollen differs from flower pollen, so that the flower pollen sticks to the bees. Because of its antioxidant properties, pollen is a highly valued food product with high biological potential,2,3 antimicrobial activities,4 antimutagenic and anti-inflammatory activities,5,6 and substantial nutritional value.7−9 Bee pollen also demonstrated bone deterioration due to diabetic-induced preventive effects.10 Phenolic compounds are responsible for the biological activity of bee pollen, the quantitative and qualitative composition of which is strongly linked to the botanical origin of bee pollen. These compounds (i.e., secondary metabolites of a plant) include phenolic acids, flavonoids, tannins, stilbenes, anthocyanins, and other classes of compounds. In the bee pollen of various botanical origins, rutin (RU), quercetin (QR), isoquercetin, myricetin, tricetin, luteolin, selagin, naringenin, kaempferol, hesperetin, isorhamnetin, p-coumaric acid (p-CA), ferulic acid, cinnamic acid, caffeic acid (CA), gallic acid (GA), and other phenolic compounds have also been found.2,9
Both quantitative and qualitative analyzes were recognized as an effective method in monitoring the quality of food products whether in their raw state or finished products. Different methods for the quality control of some consumer goods have been identified by quantifying the total polyphenol material including HPTLC (this analysis was carried out to provide information on the physicochemical characteristics of the individual curcuminoid pigments),11,12 high-performance liquid chromatography (HPLC),13,14 ultraperformance liquid chromatography,15 and capillary electrophoresis.16 Ultraviolet (UV), Fourier transform infrared (FTIR), and 1H NMR should be explored to evaluate the quality control of bee pollen since they are effective, easy, and require minimal sample preparations.
The aim of this study is therefore to evaluate the possibility of coupling different simple spectroscopic techniques, mainly FTIR and HPLC spectroscopy, with multivariate chemometrics analysis, to establish a model for discrimination of bee pollen provided from different regions of Algeria. Moreover, the quantification of phenolic compounds in pollen extracts in the identified samples was determined using a validated HPLC assay. FTIR and HPLC spectroscopy were used as powerful spectroscopic methods in this research since they were previously employed for quality control of various herbal medicines.17−23 Attenuated total reflectance FTIR spectroscopy (ATR–FTIR) spectra established complete metabolic profiles compared to the results obtained from HPLC. Sample classification was achieved using principal component analysis (PCA), hierarchal cluster analysis (HCA), and partial least squares regression (PLS) to evaluate and to discriminate the quality of bee pollen using data produced from different analytical profile techniques.
Results and Discussion
ATR–FTIR Spectra
Figure 1 shows the spectra of different samples used as data for this research work. Indeed, Figure 1 presents the ATR–FTIR spectra (4000–500 cm–1) for all the bee pollen for the entire spectrum with the corresponding band assignments.
Figure 1.
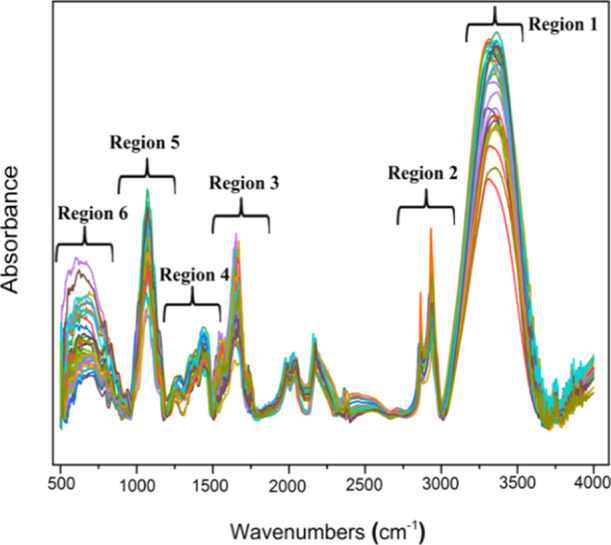
ATR–FTIR spectra of pollen samples.
All the spectra showed similar profiles but with different reading absorbance over the entire spectra. Furthermore, the assignment of each wavenumber to the respective functional groups is listed in Table 1.
Table 1. Important ATR–FTIR Peaks of Pollen Samples: Peak Wavenumber Location (cm–1), Vibration Mode, and Chemical Function.
| region | wavenumber | grouping | refs |
|---|---|---|---|
| 1 | 3400–3000 cm–1 | O–H stretching (water) | (24) and (25) |
| N–H stretching (polysaccharides, protein) | |||
| 2 | 3000–2800 cm–1 | C–H stretching (carbohydrates) | (26) |
| 3 | 1700–1600 cm–1 | C=O stretching (protein amide I, fatty acid) | (27 and 29) |
| C–O stretching (amides, ketones, quinines) | |||
| 4 | 1540–1175 cm–1 | C–O, C–C stretching vibrations, and the fingerprint region, rich in spectral details but difficult to run doubtless assignations | (28) and (29) |
| N–H deformation, C–N stretching (amide III) | |||
| C–H deformation (lipids and cellulose) | |||
| N–H deformation, C–N stretching (amide II) | |||
| 5 | 1175–900 cm–1 | C–O stretching (saccharides) | (30) |
| 6 | 900–750 cm–1 | C–H bending (the carbohydrate) anomeric region of carbohydrate | (31) and 32 |
Principal Component Analysis
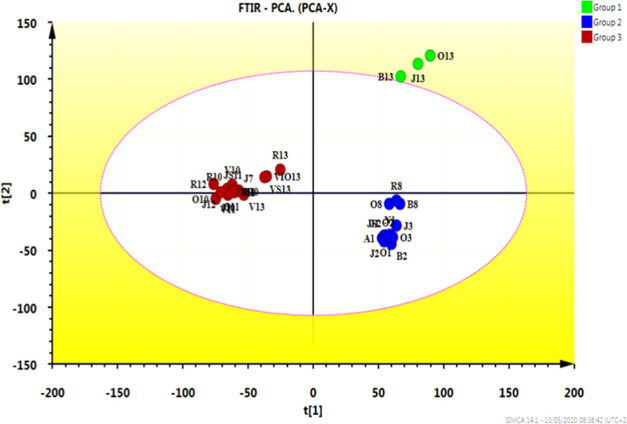
PCA of FTIR was conducted to obtain an overview of the data and to check for underlying patterns or relationships and outliers in the set of specimens. Preliminary PCA of IR spectra showed reliable and significant clustering of the analyzed samples based on chemical compounds, more precisely, polyphenols and flavonoids bioactive compounds (Figure 2). It can be affirmed that PCA is effective at discriminating against various pollens. The data from bee pollen seem rather properly clustered, where all the samples were divided into two groups with other groups scattered (B13, J13, and O13). For the models developed using the full IR spectra region of 4000–500 cm–1, the first two main components explained 98% spectral data variation.
Figure 2.
PCA scatter plot of FTIR spectra (500–4000 cm–1).
Hierarchical Cluster Analysis
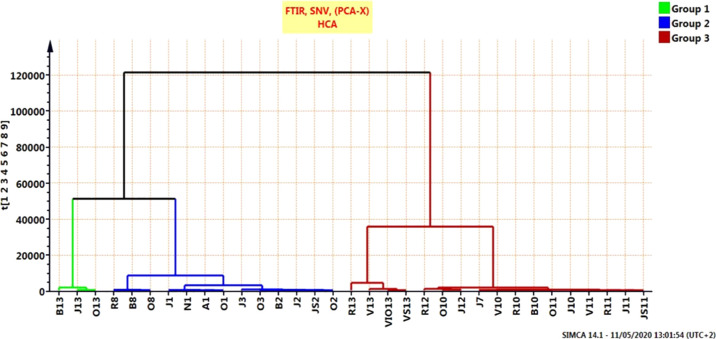
A multivariate analysis technique was used to base classification and possible identification of all of the bee pollen’s chemical information. To determine the overall variance between different pollens and gain an unbiased perspective on potential chemical differences, we aim for a classification method that does not require the preselection of chemical parameters or the weighting of input information. As a result, we opted to use an HCA as an unsupervised pattern. Using the FTIR spectrum, we applied HCA to a spectral data set, which contained 33 spectra from diverse pollen samples.
Concerning HCA, the complete method of linkage was used for cluster construction, and the distance between clusters was measured using the Euclidean method. The resulting dendrogram grouped the samples into four major clusters, but this differed comparatively from the PCA findings, providing more investigative results. The HCA results are shown in Figure 3.
Figure 3.
HCA–PCA score plot of the ATR–FTIR spectra region (400–4000 cm–1) for bee pollen.
Although the results obtained from the PCA revealed an obvious clustering of the samples based on their chemical composition, which indicated differences in the composition of the pollen samples and was largely consistent with the results of the HCA, a more precise demarcation between the pollen samples was still required. As a consequence, it was necessary to approach the problem with the PLS technique which utilized principal component per category to further confirm the classification obtained by the PCA and HCA.
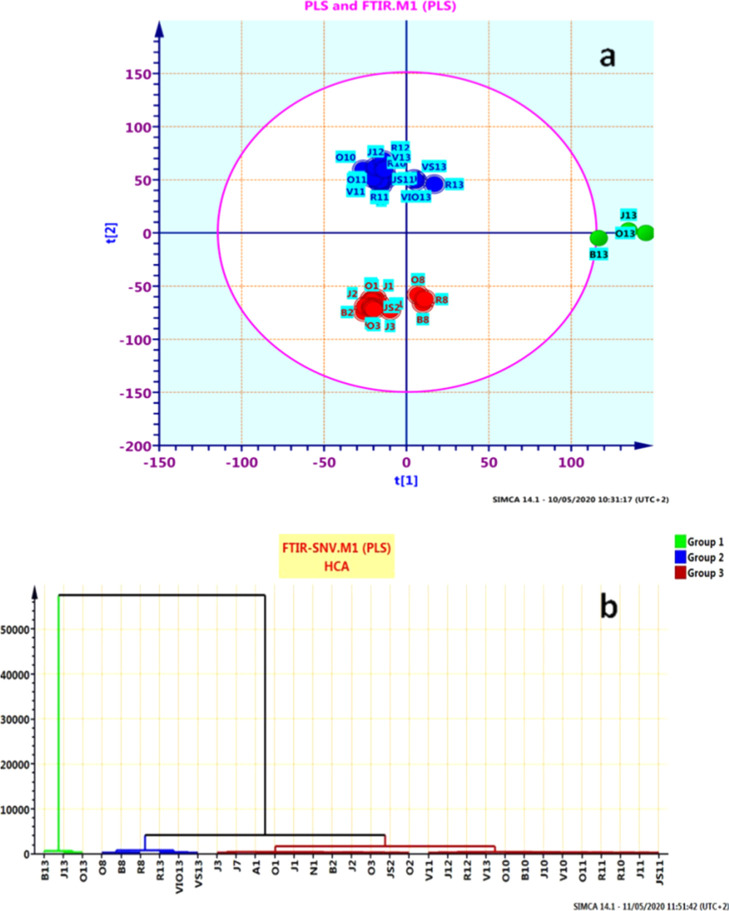
PLS was also carried out to enhance the separation between the bee pollen samples obtained from different localities. The PLS model showed that a good and clear separation was attained between the samples. For all the samples, the model showed the correct classification. This is in line with the findings obtained from PCA and HCA analyses.
The results of PLS, as illustrated in (Figure 4a,b), further supported those obtained from PCA as well as HCA models and revealed the resemblance of all the samples of pollen.
Figure 4.
(a) Scattered scores plot obtained from PLS, distribution, and separation of the set by the best model and (b) hierarchical cluster analysis (HCA–PLS) for the ATR–FTIR spectra of all pollen samples.
To determine the regression equation that gives a determination coefficient (R2) which was presented, R2 versus root-mean-square error of cross-validation (RMSEcv) values were investigated for each model, and R2 with the low root-mean-square estimation error (RMSEE) and highest R2 values were selected for the robustness of the model. Linear regression coefficients obtained for the best results of the PLS model were presented. The PLS model was calibrated using 33 spectra (R2 = 0.9001, RMSEE = 0.0304, and RMSEcv = 0.036), errors are close to each other with low values.
HPLC Chromatogram Analysis
Figure 5 presents the HPLC chromatograms for all the studied bee pollen. HPLC chromatograms offered an excellent tool for the effective profiling of most of the chemical constituents prevailing in the bee pollen samples. However, the presence of these compounds differed between the studied samples. Indeed, the results shown in Table 2 confirmed that all samples contain GA, p-CA, and QR. The sample P07 does not contain vanillin (VAN) and chlorogenic acid (CGA).
Figure 5.
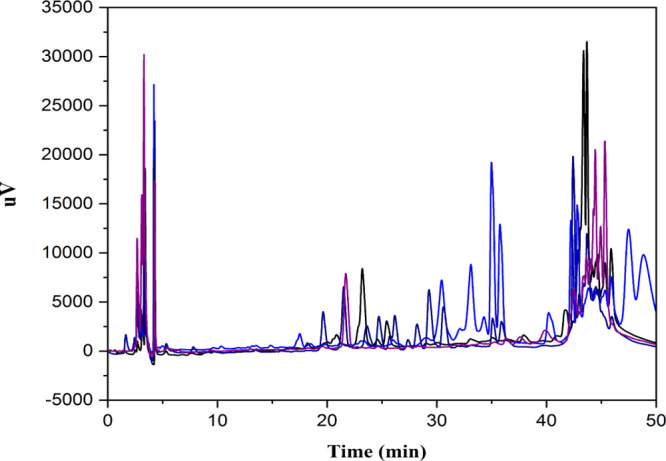
HPLC chromatograms of phenolic compounds.
Table 2. Concentration (μg/mg Ex) for Some Phenolic Compounds in the Different Extracts Pollena.
| GA (μg/mg Ex) | CGA (μg/mg Ex) | VA (μg/mg Ex) | CA (μg/mg Ex) | VAN (μg/mg Ex) | p-CA (μg/mg Ex) | RU (μg/mg Ex) | NAR (μg/mg Ex) | QR (μg/mg Ex) | total (mg/g Ex) | |
|---|---|---|---|---|---|---|---|---|---|---|
| A1 | 20.855 | ND | ND | 6.468 | 1004.065 | 315.571 | ND | 224.304 | 500.634 | 2.071 |
| B2 | 30.09 | 28.94 | 4.726 | ND | ND | 814.518 | 745.487 | 75.019 | 490.797 | 2.189 |
| B8 | 74.899 | 50.182 | 9.093 | 5.864 | 68.345 | 45.677 | ND | 69.198 | 4049.905 | 4.373 |
| B10 | 648.558 | 334.834 | 145.882 | ND | 10488.72 | 9312.071 | 6751.996 | 3087.187 | 20749.05 | 51.518 |
| B13 | 48.29 | ND | ND | ND | 29.217 | 1294.559 | ND | 321.017 | 231.248 | 1.924 |
| J1 | 7.274 | 27.251 | 41.384 | 247.857 | 109.862 | 1205.766 | 2120.501 | ND | 1033.663 | 4.793 |
| J2 | 10.574 | 25.201 | 3.841 | 44.943 | 1756.365 | 41.39 | ND | 373.724 | 2079.223 | 4.335 |
| J3 | 13.002 | 76.187 | 12.044 | ND | 6249.18 | 12.599 | 46.013 | 198.802 | 266.922 | 6.874 |
| J7 | 85.32 | ND | ND | ND | ND | 210.138 | ND | 939.656 | 534.395 | 1.769 |
| J10 | 29.458 | ND | 4.566 | ND | 2110.602 | 20.07 | ND | 231.425 | 852.166 | 3.248 |
| J13 | 130.418 | 28.977 | 4.778 | ND | 2035.299 | 28.33 | 41.614 | 37.638 | 845.876 | 3.152 |
| JS2 | 23.701 | 47.366 | 8.073 | 2.757 | 1596.775 | 267.59 | 356.736 | 164.538 | 1695.654 | 4.163 |
| JS11 | 243.225 | 324.689 | ND | ND | 163.906 | 1498.284 | ND | ND | 2019.295 | 4.249 |
| N1 | 285.857 | 22.977 | 47.374 | 12.547 | ND | 49.774 | ND | 524.247 | 1012.142 | 1.954 |
| O1 | 8.156 | ND | ND | ND | 970.751 | 176.728 | ND | 312.193 | 172.096 | 1.639 |
| O2 | 34.988 | 53.016 | ND | ND | 777.559 | 32.948 | 1443.106 | 2114.876 | 802.644 | 5.259 |
| O3 | 32.504 | 81.781 | 8.457 | 2.486 | 11304.69 | ND | 31.893 | ND | 200.969 | 11.662 |
| O8 | 118.724 | ND | ND | 3.506 | ND | 43.515 | ND | 260.312 | 3799.911 | 4.225 |
| O10 | 116.548 | 31.35 | ND | ND | 498.163 | 331.314 | 160.133 | 1343.299 | 186.31 | 2.667 |
| O11 | 67.072 | 53.81 | ND | ND | 30.246 | 52.211 | ND | 4485.019 | 625.289 | 5.313 |
| O13 | 100.627 | 15.213 | 5.602 | 7.339 | 29.336 | ND | ND | 38.165 | 472.815 | 0.669 |
| R8 | 20.515 | ND | ND | ND | 680.261 | 4.65 | ND | ND | 1210.269 | 1.915 |
| R10 | 69.135 | 45.898 | ND | ND | 540.067 | 328.303 | 481.758 | 660.023 | 524.104 | 2.649 |
| R11 | 61.882 | 13.773 | ND | ND | 16.466 | 866.62 | ND | 58.558 | 289.942 | 1.307 |
| R12 | 87.8 | 41.643 | 33.09 | ND | 102.389 | 235.842 | ND | 1564.084 | 613.187 | 2.678 |
| R13 | 81.15 | 102.174 | 151.442 | ND | 167.239 | 591.97 | ND | ND | ND | 1.093 |
| V10 | 50.847 | 30.048 | 3.783 | 3.977 | 339.232 | 8145.242 | 12.109 | ND | 1925.814 | 10.511 |
| V13 | 83.846 | 39.639 | ND | 10.215 | 33.938 | 1007.887 | ND | 92.471 | 1166.543 | 2.434 |
| VIO13 | ND | 61.823 | 8.54 | 8.852 | ND | 31.752 | ND | 281.232 | 211.93 | 0.604 |
ND: not detected.
Principal Component Analysis
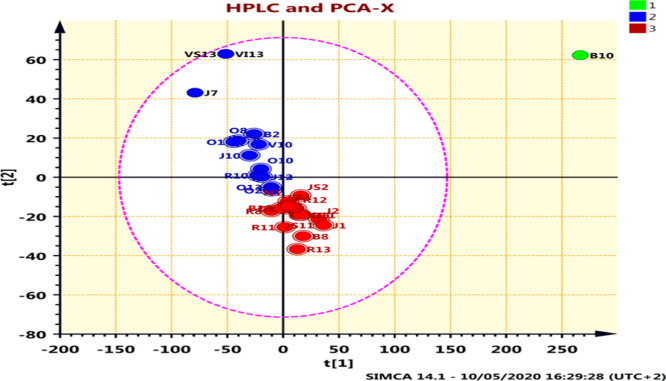
PCA was conducted to allow visualization of the variation between the samples collected of bee pollen, predicated on their peak areas. The results of the PCA score plot by HPLC are presented in Figure 6.
Figure 6.
PCA score plot using the HPLC data matrix for pollen samples.
The samples were mapped into the domain spanned by the first two main components PC1 versus PC2, they could explain the heterogeneity by more than 99%. For quick visualization and distinguishing, the very first two PCs (PC1 and PC2) were selected to provide the highest variety of data items (95 and 5% variance).
Hierarchical Cluster Analysis
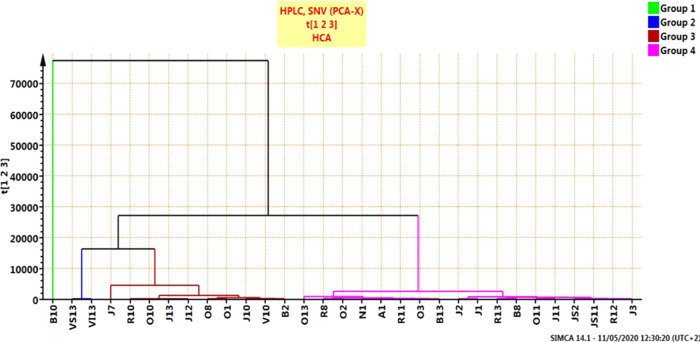
For HCA, the resulting dendrogram grouped the samples into four key clusters; however, this somewhat supports the findings of PCA, providing more investigative findings. The HCA results are shown in Figure 7.
Figure 7.
HCA–PCA score plot for the HPLC chromatograms of all pollen samples.
The obtained results from the unsupervised pattern recognition techniques (HCA and PCA) explained the sample differentiation into classified clusters according to their chemical compounds, which illustrate the notable variability in the components of bee pollen samples. As a result, more accurate segregation is demanded to be achieved between the bee pollen samples from different Algerian regions. Consequently, PLS was implemented as supervised deep learning techniques to further assess the findings obtained from the unsupervised techniques.
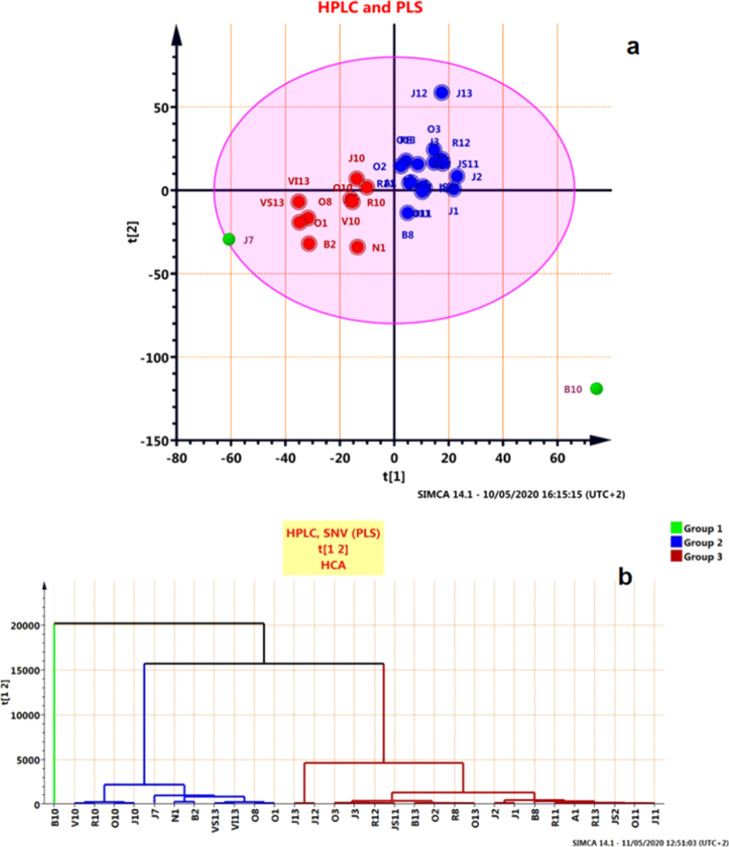
PLS was also carried out to enhance the separation between the bee pollen samples obtained from different localities. PLS model was developed, where the score plot (PLS–PCA) and dendrogram (PLS–HCA) depicted in (Figure 8a,b) proved that a good class separation was attained between samples, where three distinct clusters were observed. The results of PLS, HCA, and PCA model showed a different classification for all the pollen samples.
Figure 8.
(a) PLS (supervised) scores plots for the classification of pollen species and (b) HCA–PLS for the HPLC chromatograms of all pollen samples.
ATR–FTIR spectral data provided a powerful classification tool for pollen samples as all the samples either in the same group or indifferent ones are scattered. This is an exciting result concerning the PCA or HCA, where this classification confirmed the PLS model. Simultaneously, HPLC chromatogram data did not provide a robust classification tool for pollen samples, where a difference was observed between the main component grouping and cluster analysis, while the least-squares model showed different groups more clearly.
To determine the regression equation, a determination coefficient (R2) was presented. Indeed, R2 versus RMSEcv values were investigated for each model, and R2 were selected for the model robustness with low RMSEE and highest R2 values. Coefficients of linear regression obtained for the best PLS model outcomes were presented through the following results: R2 = 0.98, RMSEE = 8.22, and RMSEcv = 27.86.
Conclusions
In the present study, FTIR spectroscopy was applied to control bee pollen compared with HPLC combined with chemometrics analysis. HPLC revealed the presence of three prominent peaks for total polyphenol. A PCA scatter plot based on both HPLC and ATR–FTIR spectroscopy showed the same discriminant pattern as samples were divided into four main classes based on their total polyphenol content, which means that ATR–FTIR can be used as a simple tool to discriminate samples according to their quality. All types contain the same phytochemical components but in different concentrations. However, it can significantly differentiate between closely related species, as reported in the bee pollen’s discrimination. It was concluded from IR that the metabolic variation between samples in the essential oils/fatty acid area was more apparent.
This undoubtedly could offer a credible simple model for the quality control of food products based upon their predominant active constituents. The statistical results of the prediction are quite satisfactory since the correlation coefficient is close to unity, and the values of the RMSEE and RMSEcv are 0.0304, 8.22 and 0.036, 27.86%, respectively. Errors are low and close to each other. A high correlation coefficient R2 = 0.98 was obtained in PLS regression analysis, which could be used as effective multivariate techniques for bee pollen adulteration assessment. These techniques are reliable and inexpensive.
Materials and Methods
Bee Pollen Samples
In this study, 33 bee pollen samples were collected from different geographic regions and different botanical origins in Algeria. Specialists in beekeeping collected samples. The detailed information is presented in Table 3. The pollen was collected from the hives into small storage bottles and kept until the chemical study period.
Table 3. Bee Pollen Samples (Geographical Origins and Date of Collection).
| code | region | date of harvest | source | |
|---|---|---|---|---|
| P1 | A1 | Bouira | 2017 | Acer negundo |
| J1 | Moose maple | |||
| O1 | Anemonastrum canadense | |||
| N1 | creeping bugleweed | |||
| P2 | J2 | Mtija | 2017 | creeping bugleweed |
| O2 | soybean | |||
| Js2 | Lysimachia punctate L. | |||
| B2 | Spergularia rubra L. | |||
| P3 | J3 | Skikda | 2017 | Capnoides sempervirens L. |
| O3 | Anaphalis margaritacea L. | |||
| P7 | J7 | Tipaza | 2016 | Artemisia absinthium |
| P8 | B8 | Bouira-Boumerdès | 2016 | Aralia nudicaulis |
| O8 | tilia | |||
| R8 | Alpine Milk VetchAstragalus alpinus | |||
| P10 | J10 | Tizi-Ouzou | 2016 | bird’s-eyespeedwell |
| O10 | Agropyron caninum L | |||
| B10 | large flowered barrenwort | |||
| R10 | Benoîte du Canada White avens | |||
| V10 | Amélanchierserviceberry | |||
| P11 | J11 | Boumerdès | 2016 | Siberian peashrub |
| O11 | pearly everlasting | |||
| Js11 | dill | |||
| R11 | spotted jewelweed | |||
| V11 | purslane speedwell | |||
| P12 | J12 | Tizi-Ouzou | 2016 | bitter wintercress |
| R12 | creeping bugleweed | |||
| P13 | J13 | El Oued | 2017 | Mathiola livida DC |
| Phoenix dactylifera L | ||||
| O13 | Anacyclus valentinus L | |||
| B13 | Anacyclus valentinus L | |||
| Launaeare sedifolia O.K | ||||
| V13 | Brassica oleracea var.viridis L | |||
| Vs13 | Brassica oleracea var.viridis L | |||
| Mathiola livida DC | ||||
| VIO13 | Malcomia aegyptiaca spr | |||
| R13 | Retama raetam | |||
| Eucalyptus | ||||
| Genista saharae COSS& DUR | ||||
Reagents and Chemicals
All the solvents (i.e., methanol, acetonitrile, and acetic acid) were of HPLC grade and were purchased from Sigma (Sigma-Aldrich, Germany). All the reference compounds were purchased from Alfa Aesar (United States) such as GA, CGA, vanillic acid (VA), CA, VAN p-CA, RU, naringin (NAR), and QR. All other reagents used were of the analytical grade.
Equipment and Chromatographic Conditions
The chromatographic method for separating and analyzing phenolic acids and flavonoids was conducted with Shimadzu model prominence liquid chromatography, thermostatic column compartment, online degasser, and an SPD-20A UV detector model (operating at 268 nm). A Shim-pack VP-ODS C18 (4.6 mm × 250 mm, 5 μm, from Shimadzu Co., Japan) was used as an analytical column. A binary gradient linear system consisting of acetonitrile (A) and 0.2% acetic acid in water (B) was also used. The gradient method was generated by starting with 90% B (then, decreasing to 86% B in 6 min, to 83% B in 16 min, to 81% B in 23 min, to 77% B in 28 min, held at 77% B in 28–35 min, to 60% B in 38 min, and to 90% B in 50 min at a flow rate of 1 mL/min). Quantification of separated peaks was performed by calibration with standard GA, CGA, VA, CA, p-CA, V, RU, NAR, and QR. Quantifying the phenolic composition was performed by plotting a standard curve with the respective criteria.
Preparation of Crude Extract
According to Pinto et al.33 with slight modification, 2 mL of methanol is added to 200 mg of bee pollen samples. Then, mixtures were taken to ultrasound at room temperature for 30 min to obtain the extract. Each of the extracts was transferred to the centrifuge quickly at 3000 rpm/min and, then, evaporated with a rotary evaporator at 45 °C. Thus, the obtained extracts were weighed up and stored at 4 °C in a brown bottle before further use.
Preparation of Standard Solution for HPLC Analysis
A stock solution of polyphenol was prepared by dissolving 10 mg of pure polyphenol in a 50 mL volumetric bottle containing a sufficient amount of methanol (HPLC grade) to dissolve the polyphenol. It was sonicated for about 10 min and then brought to volume with the mobile phase. By proper dilution of the one with the mobile phase, daily working standard solutions of polyphenols were prepared. Each of these solutions (20 μL) was injected three times into the column; the peak area was registered with the retention times.
Preparation of Sample Solution for HPLC Analysis
The extracts of the samples (10 mg) were dissolved in HPLC grade methanol (10 mL). The sample solutions were filtered with a 0.45 μm Millipore nylon filter disk. Then, 20 μL of the sample was analyzed in the HPLC system.
Preparation of the Mobile Phase
The mobile phase was a mixture of acetonitrile and acetic acid (0.2%). The contents of the mobile phase were filtered before use through a Whatman RC55 membrane, sonicated, and pumped from the solvent reservoir to the column at a flow rate of 1 mL/min. The effluent was detected at 268 nm. The temperature of the column was kept at room temperature, and the injecting volume was set at 20 μL.
ATR–FTIR Spectroscopy Measurement
ATR–FTIR spectral analysis of samples were performed using a Nicolet iS5 FTIR Spectrometer (Thermo Fisher Scientific, United States). The infrared absorption spectra of all the samples were recorded in the region between 500 and 4000 cm–1 with 32 scans/min and 16 cm–1 resolution. Samples are ground and taken directly without treatment to obtain the ATR–FTIR spectra.
ATR–FTIR and HPLC Spectral Data
The ATR–FTIR data sets (7261 × 33 data sets) and HPLC data sets (6001 × 33 data sets) were saved in a file.CSV and copied manually to Microsoft Excel 2007 as two data sets (rows: samples; and columns: wavenumber) for extracting their numerical values from spectra files. Then, the data were aligned in rows for samples and columns for wavenumber.
The ATR–FTIR spectral data and HPLC data were subjected separately to various chemometric techniques namely PCA and HCA as unsupervised pattern recognition techniques, which considered PLS as a supervised pattern recognition technique obtained for the best results of the PLS model.
ATR–FTIR and HPLC Spectral Data Pre-treatment
PCA, HCA, and PLS were performed using MKS Umetrics AB SIMCA 14.1 Software (Human-Computer Interaction Laboratory, University of Maryland, College Park, MD, USA). However, before the study, by applying a default option in the SIMCA software, all spectral data matrices were subject to mean centering preprocessing. In addition, spectral data acquired from FTIR and HPLC were subjected to the SNV method, which reduces spectral scattering impacts by centering and measuring each spectrum.
Chemometrics Analysis
Principal Component Analysis
This method25 was used specifically to achieve a reduction in dimensionality (i.e., to fit a j-dimensional subspace to the original p-variate) (p ≫ j) space of the objects and allows for a primary assessment of the similarity between the categories. The data matrix corresponding to the physicochemical parameters was sent to PCA to demonstrate potential patterns in their values and to illustrate the similarities and differences in a score plot between the samples.34
Hierarchical Cluster Analysis
Cluster analysis, as one of the methods used in cluster analysis35 and one of the commonly used multivariate methods, has multiple objectives. The notion of degree of similarity (or dissimilarity) between the clustered objects is central to all of those objectives. The former continues to agglomerate the n objects into groups by a sequence of fusions, while the latter separates and divides the n objects successively into finer groups. More generally, agglomerative methods are practiced.36
PLS Regression Method
PLS are among multivariate methods that are the most commonly used.37 The PLS method is growing in importance in many fields of chemistry. Employing the method can support analytical, physical, clinical chemistry, and industrial process control.38
PLS predictions to latent structures are a moderately recent multivariate statistical method, allowing the evaluation of latent variables in multivariate space. This approach is similar to main component analysis (PCA) when detecting the main components which explain the maximum variance in a data set. PLS also maximizes covariance between the predictor (X-matrix) and the matrix (Y-matrix) for the reaction. PLS simultaneously projections the X- and Y-variables onto the same subspace in such a way that an ideal relationship exists between the observation location in the X space and the Y plane.39 The PLS method is well suited to sets of data with fewer correlations than variables and a greater degree of interrelation between the predictor variables, unlike many other regression models.40
Acknowledgments
This research has been funded by the Research Deanship of University of Ha’il, Saudi Arabia, through the Project RG-20 101.
Author Contributions
The manuscript was written through contributions of all authors. All authors have given approval to the final version of the manuscript.
The authors declare no competing financial interest.
References
- Gad H. A.; El-Ahmady S. H.; Abou-Shoer M. I.; Al-Azizi M. M. Application of chemometrics in authentication of herbal medicines: a review. Phytochem. Anal. 2013, 24, 1–24. 10.1002/pca.2378. [DOI] [PubMed] [Google Scholar]
- Kaškonienė V.; Kaškonas P.; Maruška A. Volatile compounds composition and antioxidant activity of bee pollen collected in Lithuania. Chem. Pap. 2015, 69, 291–299. 10.1515/chempap-2015-0033. [DOI] [Google Scholar]
- Kaškonienė V.; Ruočkuvienė G.; Kaškonas P.; Akuneca I.; Maruška A. Chemometric analysis of bee pollen based on volatile and phenolic compound compositions and antioxidant properties. Food Anal. Methods 2015, 8, 1150–1163. 10.1007/s12161-014-9996-2. [DOI] [Google Scholar]
- Morais M.; Moreira L.; Feás X.; Estevinho L. M. Honeybee-collected pollen from five Portuguese Natural Parks: Palynological origin, phenolic content, antioxidant properties and antimicrobial activity. Food Chem. Toxicol. 2011, 49, 1096–1101. 10.1016/j.fct.2011.01.020. [DOI] [PubMed] [Google Scholar]
- Denisow B.; Denisow-Pietrzyk M. Biological and therapeutic properties of bee pollen: a review. J. Sci. Food Agric. 2016, 96, 4303–4309. 10.1002/jsfa.7729. [DOI] [PubMed] [Google Scholar]
- Pascoal A.; Rodrigues S.; Teixeira A.; Feás X.; Estevinho L. M. Biological activities of commercial bee pollens: Antimicrobial, antimutagenic, antioxidant and anti-inflammatory. Food Chem. Toxicol. 2014, 63, 233–239. 10.1016/j.fct.2013.11.010. [DOI] [PubMed] [Google Scholar]
- Feás X.; Vázquez-Tato M. P.; Estevinho L.; Seijas J. A.; Iglesias A. Organic bee pollen: botanical origin, nutritional value, bioactive compounds, antioxidant activity and microbiological quality. Molecules 2012, 17, 8359–8377. 10.3390/molecules17078359. [DOI] [PMC free article] [PubMed] [Google Scholar]
- Ghosh S.; Jung C. Nutritional value of bee-collected pollens of hardy kiwi, Actinidia arguta (Actinidiaceae) and oak, Quercus sp.(Fagaceae). J. Asia-Pac. Entomol. 2017, 20, 245–251. 10.1016/j.aspen.2017.01.009. [DOI] [Google Scholar]
- Li Q.-Q.; Wang K.; Marcucci M. C.; Sawaya A. C. H. F.; Hu L.; Xue X.-F.; Wu L.-M.; Hu F.-L. Nutrient-rich bee pollen: A treasure trove of active natural metabolites. J. Funct. Foods 2018, 49, 472–484. 10.1016/j.jff.2018.09.008. [DOI] [Google Scholar]
- Yamaguchi M.; Hamamoto R.; Uchiyama S.; Ishiyama K.; Hashimoto K. Preventive effects of bee pollen Cistus ladaniferus extract on bone loss in streptozotocin-diabetic rats in vivo. J. Health Sci. 2007, 53, 190–195. 10.1248/jhs.53.190. [DOI] [Google Scholar]
- Paramasivam M.; Poi R.; Banerjee H.; Bandyopadhyay A. High-performance thin layer chromatographic method for quantitative determination of curcuminoids in Curcuma longa germplasm. Food Chem. 2009, 113, 640–644. 10.1016/j.foodchem.2008.07.051. [DOI] [Google Scholar]
- Zhang J. S.; Guan J.; Yang F. Q.; Liu H. G.; Cheng X. J.; Li S. P. Qualitative and quantitative analysis of four species of Curcuma rhizomes using twice development thin layer chromatography. J. Pharm. Biomed. Anal. 2008, 48, 1024–1028. 10.1016/j.jpba.2008.07.006. [DOI] [PubMed] [Google Scholar]
- Singh R. S. P.; Das U.; Dimmock J. R.; Alcorn J. A general HPLC–UV method for the quantitative determination of curcumin analogues containing the 1, 5-diaryl-3-oxo-1, 4-pentadienyl pharmacophore in rat biomatrices. J. Chromatogr. B: Anal. Technol. Biomed. Life Sci. 2010, 878, 2796–2802. 10.1016/j.jchromb.2010.08.034. [DOI] [PMC free article] [PubMed] [Google Scholar]
- Syed H. K.; Liew K. B.; Loh G. O. K.; Peh K. K. Stability indicating HPLC–UV method for detection of curcumin in Curcuma longa extract and emulsion formulation. Food Chem. 2015, 170, 321–326. 10.1016/j.foodchem.2014.08.066. [DOI] [PubMed] [Google Scholar]
- Cheng J.; Weijun K.; Yun L.; Jiabo W.; Haitao W.; Qingmiao L.; Xiaohe X. Development and validation of UPLC method for quality control of Curcuma longa Linn.: Fast simultaneous quantitation of three curcuminoids. J. Pharm. Biomed. Anal. 2010, 53, 43–49. 10.1016/j.jpba.2010.03.021. [DOI] [PubMed] [Google Scholar]
- Anubala S.; Sekar R.; Nagaiah K. Development and validation of an analytical method for the separation and determination of major bioactive curcuminoids in Curcuma longa rhizomes and herbal products using non-aqueous capillary electrophoresis. Talanta 2014, 123, 10–17. 10.1016/j.talanta.2014.01.017. [DOI] [PubMed] [Google Scholar]
- Gad H. A.; El-Ahmady S. H.; Abou-Shoer M. I.; Al-Azizi M. M. A modern approach to the authentication and quality assessment of thyme using UV spectroscopy and chemometric analysis. Phytochem. Anal. 2013, 24, 520–526. 10.1002/pca.2426. [DOI] [PubMed] [Google Scholar]
- Kuhnen S.; Bernardi Ogliari J.; Dias P. F.; da Silva Santos M.; Ferreira A. G.; Bonham C. C.; Wood K. V.; Maraschin M. Metabolic fingerprint of Brazilian maize landraces silk (stigma/styles) using NMR spectroscopy and chemometric methods. J. Agric. Food Chem. 2010, 58, 2194–2200. 10.1021/jf9037776. [DOI] [PubMed] [Google Scholar]
- Rohman A.; Man Y. B. C. Fourier transform infrared (FTIR) spectroscopy for analysis of extra virgin olive oil adulterated with palm oil. Int. Food Res. J. 2010, 43, 886–892. 10.1016/j.foodres.2009.12.006. [DOI] [Google Scholar]
- Roshan A.-R. A.; Gad H. A.; El-Ahmady S. H.; Khanbash M. S.; Abou-Shoer M. I.; Al-Azizi M. M. Authentication of monofloral yemeni sidr honey using ultraviolet spectroscopy and chemometric analysis. J. Agric. Food Chem. 2013, 61, 7722–7729. 10.1021/jf402280y. [DOI] [PubMed] [Google Scholar]
- Sârbu C.; Naşcu-Briciu R. D.; Kot-Wasik A.; Gorinstein S.; Wasik A.; Namieśnik J. Classification and fingerprinting of kiwi and pomelo fruits by multivariate analysis of chromatographic and spectroscopic data. Food Chem. 2012, 130, 994–1002. 10.1016/j.foodchem.2011.07.120. [DOI] [Google Scholar]
- Yang S.-O.; Shin Y.-S.; Hyun S.-H.; Cho S.; Bang K.-H.; Lee D.; Choi S. P.; Choi H.-K. NMR-based metabolic profiling and differentiation of ginseng roots according to cultivation ages. J. Pharm. Biomed. Anal. 2012, 58, 19–26. 10.1016/j.jpba.2011.09.016. [DOI] [PubMed] [Google Scholar]
- Yap K. Y.-L.; Chan S. Y.; Lim C. S. Infrared-based protocol for the identification and categorization of ginseng and its products. Int. Food Res. J. 2007, 40, 643–652. 10.1016/j.foodres.2006.11.009. [DOI] [Google Scholar]
- Cuibus L.; Maggio R.; Mureşan V.; Diaconeasa Z.; Pop O. L.; Socaciu C. Preliminary discrimination of butter adulteration by ATR-FTIR spectroscopy. Bull. UASVM Food Sci. Technol. 2015, 72, 70–76. 10.15835/buasvmcn-fst:11084. [DOI] [Google Scholar]
- Christou C.; Agapiou A.; Kokkinofta R. Use of FTIR spectroscopy and chemometrics for the classification of carobs origin. J. Adv. Res. 2018, 10, 1–8. 10.1016/j.jare.2017.12.001. [DOI] [PMC free article] [PubMed] [Google Scholar]
- Gok S.; Severcan M.; Goormaghtigh E.; Kandemir I.; Severcan F. Differentiation of Anatolian honey samples from different botanical origins by ATR-FTIR spectroscopy using multivariate analysis. Food Chem. 2015, 170, 234–240. 10.1016/j.foodchem.2014.08.040. [DOI] [PubMed] [Google Scholar]
- Fan Q.; Chen C.; Lin Y.; Zhang C.; Liu B.; Zhao S. Fourier Transform Infrared (FT-IR) Spectroscopy for discrimination of Rhizoma gastrodiae (Tianma) from different producing areas. J. Mol. Struct. 2013, 1051, 66–71. 10.1016/j.molstruc.2013.07.039. [DOI] [Google Scholar]
- Kasprzyk I.; Depciuch J.; Grabek-Lejko D.; Parlinska-Wojtan M. FTIR-ATR spectroscopy of pollen and honey as a tool for unifloral honey authentication. The case study of rape honey. Food Control 2018, 84, 33–40. 10.1016/j.foodcont.2017.07.015. [DOI] [Google Scholar]
- Isopescu R. D.; Spulber R.; Josceanu A. M.; Mihaiescu D. E.; Popa O. Romanian bee pollen classification and property modelling. J. Apic. Res. 2020, 59, 443–451. 10.1080/00218839.2019.1708594. [DOI] [Google Scholar]
- Petrakis E. A.; Polissiou M. G. Assessing saffron (Crocus sativus L.) adulteration with plant-derived adulterants by diffuse reflectance infrared Fourier transform spectroscopy coupled with chemometrics. Talanta 2017, 162, 558–566. 10.1016/j.talanta.2016.10.072. [DOI] [PubMed] [Google Scholar]
- Gallardo-Velázquez T.; Osorio-Revilla G.; Loa M. Z.-d.; Rivera-Espinoza Y. Application of FTIR-HATR spectroscopy and multivariate analysis to the quantification of adulterants in Mexican honeys. Int. Food Res. J. 2009, 42, 313–318. 10.1016/j.foodres.2008.11.010. [DOI] [Google Scholar]
- Subari N.; Mohamad Saleh J.; Md Shakaff A.; Zakaria A. A hybrid sensing approach for pure and adulterated honey classification. Sensors 2012, 12, 14022–14040. 10.3390/s121014022. [DOI] [PMC free article] [PubMed] [Google Scholar]
- Pinto B.; Caciagli F.; Riccio E.; Reali D.; Šarić A.; Balog T.; Likić S.; Scarpato R. Antiestrogenic and antigenotoxic activity of bee pollen from Cystus incanus and Salix alba as evaluated by the yeast estrogen screen and the micronucleus assay in human lymphocytes. Eur. J. Med. Chem. 2010, 45, 4122–4128. 10.1016/j.ejmech.2010.06.001. [DOI] [PubMed] [Google Scholar]
- Mardia K. V.Multivariate analysis, No. 04; QA278, M3, 1979.
- Roshan A.-R. A.; Gad H. A.; El-Ahmady S. H.; Abou-Shoer M. I.; Khanbash M. S.; Al-Azizi M. M. Characterization and Discrimination of the Floral Origin of Sidr Honey by Physicochemical Data Combined with Multivariate Analysis. Food Anal. Methods 2017, 10, 137–146. 10.1007/s12161-016-0563-x. [DOI] [Google Scholar]
- Rani Y.; Rohil H. A study of hierarchical clustering algorithm. ter S & on Te SIT 2013, 2, 113. [Google Scholar]
- Jiang F.; Lee F. S.-C.; Wang X.; Dai D. The application of excitation/emission matrix spectroscopy combined with multivariate analysis for the characterization and source identification of dissolved organic matter in seawater of Bohai Sea, China. Mar. Chem. 2008, 110, 109–119. 10.1016/j.marchem.2008.02.010. [DOI] [Google Scholar]
- Ouyang Q.; Zhao J.; Pan W.; Chen Q. Real-time monitoring of process parameters in rice wine fermentation by a portable spectral analytical system combined with multivariate analysis. Food Chem. 2016, 190, 135–141. 10.1016/j.foodchem.2015.05.074. [DOI] [PubMed] [Google Scholar]
- Geladi P.; Kowalski B. R. Partial least-squares regression: a tutorial. Anal. Chim. Acta 1986, 185, 1–17. 10.1016/0003-2670(86)80028-9. [DOI] [Google Scholar]
- Smolders R.; De Coen W.; Blust R. An ecologically relevant exposure assessment for a polluted river using an integrated multivariate PLS approach. Environ. Pollut. 2004, 132, 245–263. 10.1016/j.envpol.2004.04.024. [DOI] [PubMed] [Google Scholar]


