Abstract
To assist physicians identify COVID-19 and its manifestations through the automatic COVID-19 recognition and classification in chest CT images with deep transfer learning. In this retrospective study, the used chest CT image dataset covered 422 subjects, including 72 confirmed COVID-19 subjects (260 studies, 30,171 images), 252 other pneumonia subjects (252 studies, 26,534 images) that contained 158 viral pneumonia subjects and 94 pulmonary tuberculosis subjects, and 98 normal subjects (98 studies, 29,838 images). In the experiment, subjects were split into training (70%), validation (15%) and testing (15%) sets. We utilized the convolutional blocks of ResNets pretrained on the public social image collections and modified the top fully connected layer to suit our task (the COVID-19 recognition). In addition, we tested the proposed method on a finegrained classification task; that is, the images of COVID-19 were further split into 3 main manifestations (ground-glass opacity with 12,924 images, consolidation with 7418 images and fibrotic streaks with 7338 images). Similarly, the data partitioning strategy of 70%-15%-15% was adopted. The best performance obtained by the pretrained ResNet50 model is 94.87% sensitivity, 88.46% specificity, 91.21% accuracy for COVID-19 versus all other groups, and an overall accuracy of 89.01% for the three-category classification in the testing set. Consistent performance was observed from the COVID-19 manifestation classification task on images basis, where the best overall accuracy of 94.08% and AUC of 0.993 were obtained by the pretrained ResNet18 (P < 0.05). All the proposed models have achieved much satisfying performance and were thus very promising in both the practical application and statistics. Transfer learning is worth for exploring to be applied in recognition and classification of COVID-19 on CT images with limited training data. It not only achieved higher sensitivity (COVID-19 vs the rest) but also took far less time than radiologists, which is expected to give the auxiliary diagnosis and reduce the workload for the radiologists.
Keywords: COVID-19, Deep transfer learning, Artificial intelligence, Recognition, Classification
Introduction
The current Corona Virus Disease 2019 (COVID-19) broke out and has spread over the world, resulting in more than 900,000 confirmed studies [1] till the early April 2020. By January 30, 2020, WHO announced the outbreak to be an international health emergency and the Emergency Committee called on all countries to take measures to control this outbreak [2]. With the rapid spread of COVID-19, it is crucial to detect this disease early, which can speed up treatment and prompt early patient isolation. Chest CT plays a very important role in radiologic detection, diagnosis, and assessment of COVID-19 [3]. The common patterns on chest CT scan present ground-glass opacity, patchy shadowing, as well as consolidation [3]. Chung et al. reported that 57% of their research objects suffers ground-glass opacities, peripheral distribution in 33%, and opacities with a rounded morphology accounted in 33% [3]. Guan et al. showed that ground-glass opacity is the most common image finding, which occurred in 50% of research studies and bilateral patchy shadowing in 46% [4]. While, radiologic abnormality in chest CT is detected among all patients and 98% of them suffer bilateral involvement, which is verified by Huang et al. [5]. The consolidation in multiple lobular and subsegmental areas is the typical finding in ICU studies. The ground-glass opacity and consolidation in subsegmental areas are the representative findings in non-ICU studies. Chest CT imaging findings may emerge as feasible points for discernment in this patient population [3]. These imaging findings have been included in the clinical diagnosis of COVID-19 [6].
With these characteristic manifestations in chest CT images, this study proposes the use of deep learning for COVID-19 recognition and expects to assist radiologists with diagnosis. The confirmation of COVID-19 on chest CT requires a certain amount of professional skills and enough experience that are variable among radiologists. Hence, certain differences may occur due to inter- and intra-observer variation. It could be a potential factor to compromise the epidemic morbidity. Truthfully, timely, and accurate estimation will increase survival in patients with COVID-19.
In recent years, the advanced techniques of deep learning have emerged as promising auxiliary diagnosis for disease recognition, which can automatically capture discriminative patterns of images and manage to identify the semantic information. For example, Cicero et al. used the GoogLeNet convolutional neural network (CNN) to classify abnormalities, including cardiomegaly, effusion, consolidation, edema, and pneumothorax, and achieved clinically useful performance in detecting and excluding common pathology on chest radiographs [7]. Lakhani et al. conducted the classification for pulmonary tuberculosis with deep CNNs and obtained 0.99 Area Under Curve (AUC) on chest radiographs [8].
Nevertheless, deep convolutional neural networks require plenty of data to train. Directly training the existing deep learning models from scratch for this disease recognition task is quite hard due to the quantitative limitation of chest CT images of COVID-19. In this case, overfitting will be a tough nut. Therefore, the transfer learning method could be applied for a good performance with limited training data, where a well-trained model for one task is re-purposed on other related tasks with the public available image datasets [9]. Transfer learning has been extensively applied in the medical field in the past few years. Yuan et al. presented a transfer learning model based on AlexNet for prostate cancer classification and got accuracy of 86.92% [10]. Zhang et al. used transfer learning model based on LeNet-5 for classification of benign and malignant pulmonary nodules on chest CT images [11]. Many supporting researches have demonstrated that transfer learning can achieve a superior performance even with a very limited dataset [12–16].
In this study, we investigated the use of transfer learning for recognition of COVID-19 on chest CT images. A two-step classification is performed not only distinguishing the COVID-19 from the normal lung and other pneumonias but also taking different manifestations of COVID-19 on chest CT images into consideration. Multi-structural residual networks (ResNets) have been adopted for this purpose. Distinguishing from other models, the layers are reformulated as learning residual function with reference to the layer inputs in ResNet, which not only are easier to be optimized but also can sequentially gain useful contents with increasing depth. He et al. concluded that the depth of representations was significant for visual recognition [17]. This will also be investigated in the proposed COVID-19 recognition system.
Materials and Methods
Datasets
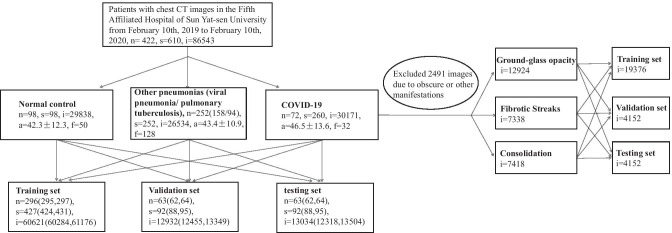
This retrospective study carried out on the modeling of imaging characteristics of studies at the Fifth Affiliated Hospital of Sun Yat-sen University. All datasets were deidentified and approved by the Fifth Affiliated Hospital of Sun Yat-sen University.1 Written informed consent was waived upon the urgent need to collect imaging data. All data were reviewed by 2 board-certified and experienced radiologists. The sufferers of COVID-19 were confirmed by laboratory with positive results of reverse transcription-polymerase chain reaction (RT-PCR). The other pneumonias were confirmed by clinical physicians through imaging findings, clinical indications, hemograms, and etiological detection. Moreover, the data of other pneumonias before the appearance of COVID-19 were collected to avoid confusion. All experimental subjects were chosen according to the clinical disease diagnosis report. The dataset consists of in total of 610 studies (86,543 weighted CT images) from 422 subjects, including COVID-19 (72 subjects, 260 studies, 30,171 images), other pneumonias (252 subjects, 252 studies, 26,534 images) that contain 158 viral pneumonia subjects and 94 pulmonary tuberculosis subjects, and 98 normal subjects (98 studies, 29,838 images). Particularly, the term of “subject” refers to the participant in the experiment and “study” refers to the CT scan of a participant (i.e., subject). It is worth noting that in our work different CT scans of the same COVID-19 subject at different points in time (over a 5-day interval) are counted as individual studies as the COVID-19 progresses rapidly on chest CT images within a very short time period [33]. For the data splitting, we set the ratio of training/validation/testing to 70%/15%15%. Figure 1 shows the framework of data splitting as well as the data statistics. Specifically, the experimental settings shown in the left part of the figure are for the COVID-19 recognition, including 3 categories, COVID-19, other pneumonias, and normal control, while the settings shown in the right part are for the manifestation classification of COVID-19, including 3 categories, ground-glass opacity, fibrotic streaks, and consolidation [6]. In the work, the training set is to train the model, the validation set is for picking out the best trained model and the testing set is used for assessment of the model which is chosen by validation set. It is notable that the data splitting is conducted on subjects so that studies and images in a subject will always be in the same experimental data set. As a result, this can enhance the model examination to be much convincing, because it avoids the impact of potentially almost identical images being distributed into different sets when evaluating model performance. Moreover, a fivefold cross-validation is adopted for the promising performance evaluation. In particular, there will be 10% overlap in subjects between two adjacent folds.
Fig. 1.
Datasets diagram. The data splitting is based on the subjects in the COVID-19 recognition experiment (left), while it is based on the images for the COVID-19’s manifestation classification experiment (right). {n, s, i, a, f} denote the numbers of {subjects, studies, images, mean age ± sd, number of females}, respectively. Values in parentheses are the floating bands
Data Preprocessing
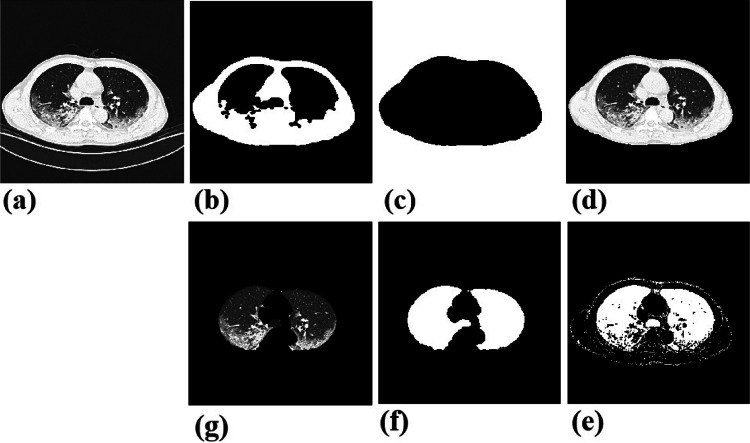
This study works on the findings of lung in CT slices. In order to eliminate the irrelevant content and make the algorithm model concentrate the area of lung, we isolate the lung region from the CT images. Specifically, we firstly convert images to the binary ones with a predetermined threshold of − 850 HU, and then execute a series of morphological erosion, opening and closing operations, remove_small_objects operation, and FloodFill operation [18]. After this processing, those contents outside the chest will be excluded. To further remove the bone and soft tissues out of lung, another threshold range of (− 850, 0) HU is set, similarly followed by erosion, closing operation, and remove_small_objects operation to correct small segmentation errors. Figure 2 shows some examples during the image processing. Moreover, to reduce variations among different images, normalization is performed on each image. The resulted images will be converted into JPG format and resized to 224 ∗ 224 to suit the deep model learning. Additionally, before loaded into the model, those images will be executed with random crop and horizontal flip to increase the noisy and robustness.
Fig. 2.
Examples in the image preprocessing. a Original chest CT image. b, c Segmented chest after binarization, a series of morphological erosion, opening and closing operations, remove_small_objects operation and FloodFill operation. d Mapping the original image to the area with pixel value of 1 in the binary image, and getting the original chest part. e, f Segmented lung with another binarization, followed erosion, opening and closing operation. g Mapping the original image to the area with pixel value 1 on binary image, and getting the lung region that we want
Methods
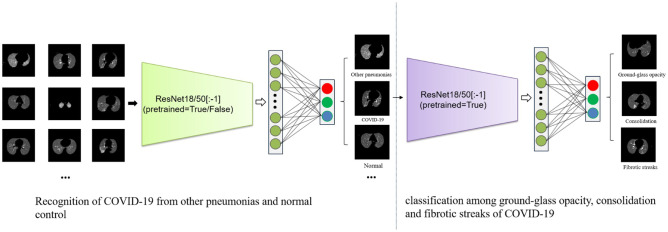
Owing to the limitation of the quantity of COVID-19 CT images, transfer leaning is a applicable way, which transfers the trained parameters from large-scale datasets of natural images to resolve the problem. There are many promising convolutional neural networks (CNNs), such as AlexNet [19], VGG [20], and ResNet [17], which have already been applied in various image related tasks and produced awesome results. For example, among these CNNs, ResNet or using it as the backbone has shown consistently state-of-the-art performance in ImageNet Large Scale Visual Recognition Challenges (ILSVRCs) [21] since the year of 2015, including the subtasks of image classification and localization, scene and place classification, and object detection in image and video [22–27]. Inspired by the above observations, we therefore explore the application of ResNet for the COVID-19 recognition based on CT images. The key idea of ResNet is the use of convolutional residual block. The layers in a traditional network are learning the true output, whereas the layers in a residual network are learning the residual. It has been observed that it is easier to learn residual of output and input, rather than only the input. The use of residual block truthfully alleviates some problems like gradient vanishing and dimensionality curse coming with increasing number of layers. Now, there are multiple layer settings of ResNet, for example, ResNet with 18, 34, 50, 101, or 152 layers. Considering the size of our dataset and the training time, we adopt ResNet18 and ResNet50 in this work, including pretrained and unpretrained models. Specifically, ResNet18 is composed of 8 identity mappings and a plain network which contains 17 convolutional layers and 1 fully connected layer. ResNet50 consists of 1 convolutional layer, 1 fully connected layer, 16 identify mappings, and 16 bottlenecks. Each bottleneck contains 3 convolutional layers. To satisfy the semantic classification in this study, the fully connected layer was modified with 3 channels output in both networks, as shown in Fig. 3. In the pretrained network, pretrained parameters are used as the initialization of training classifier of COVID-19, where the classifier will be retrained on the new dataset by finetuning the weights. In the unpretrained network, the initial parameters are randomly set without any previous knowledge.
Fig. 3.
Overall architecture of the proposed ResNet model
As the task is a classification fashion, we thus employ the commonly used cross entropy loss as the objective function. The model is implemented by using the deep learning framework Pytorch. Adam optimizer is used for model training, with a learning rate of 0.0001. However, to better train the model for classification of COVID-19 manifestation, two learning rates will be adopted simultaneously, 0.0005 for the fully connected layer and 0.00005 for the remainder of ResNet. The number of epochs is set to 50.
Results
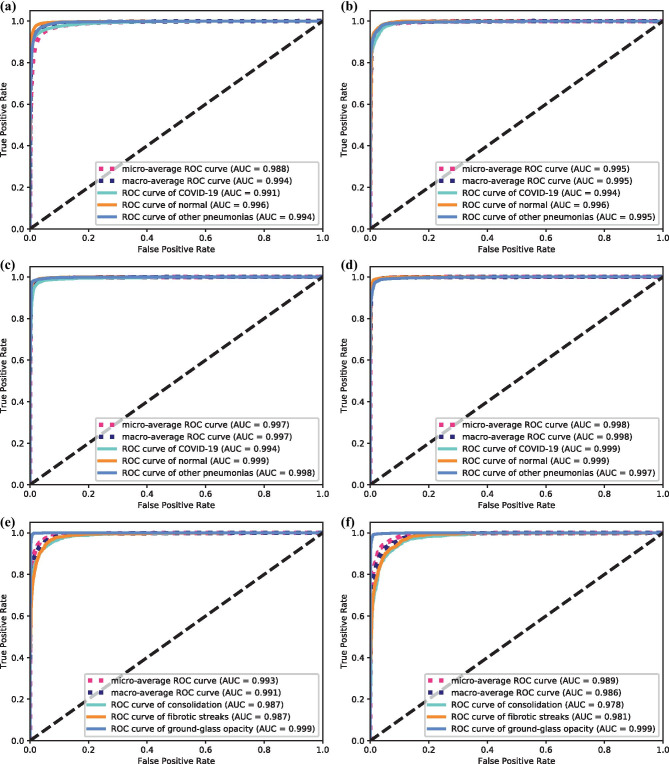
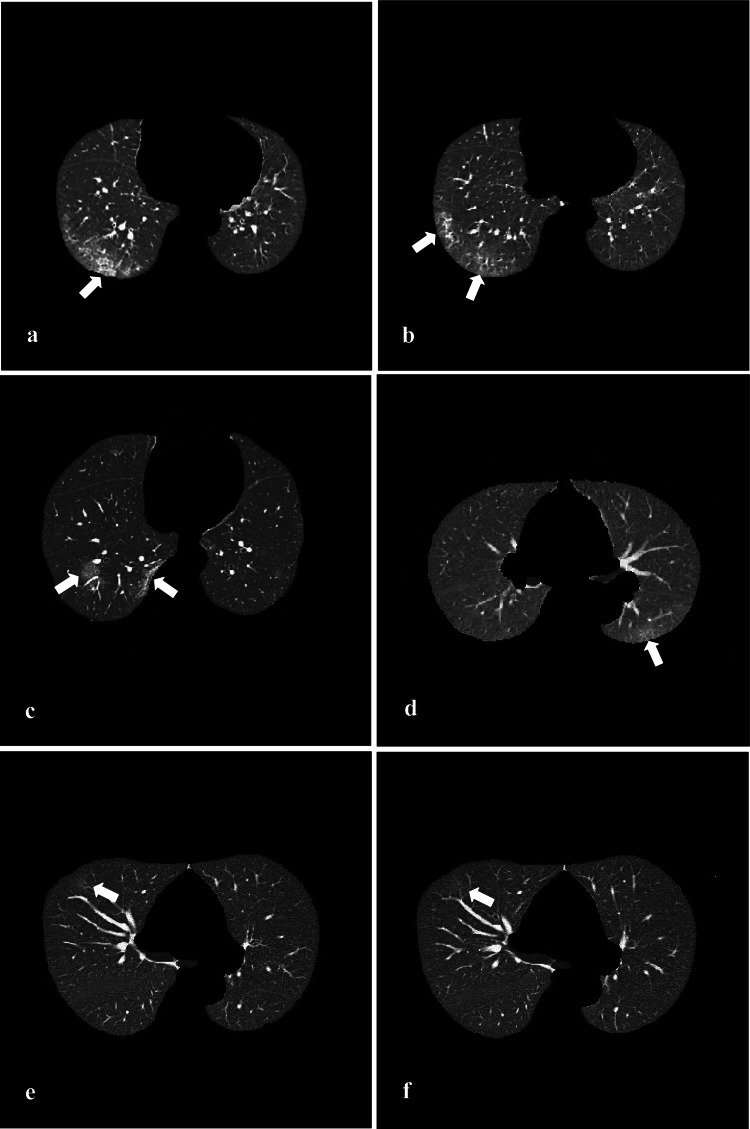
We examine the performance of these proposed models with various experimental settings. Specifically, 4 kinds of ResNets are for comparison. They are ResNet18 with unpretrained convolutional blocks, referred to as UP-ResNet18, and with pretrained convolutional blocks, referred to as P-ResNet18, and the similar settings for ResNet50, UP-ResNet50, and P-ResNet50. We adopt the commonly used evaluation metrics to report the performance on images basis, such as sensitivity, specificity, accuracy (one category vs the rest), and overall accuracy (the three-category classification). Tables 1 and 2 show the performance comparisons for the COVID-19 recognition task. Overall, all the four model versions achieve sufficiently good performances on the selected metrics, all of which reach over 90%. For the classification accuracy, all the 4 methods achieve over 92%, even up to 97% accuracy (COVID-19), and 96% overall overall accuracy when using P-ResNet50 (P < 0.05). The best performances are 97.11% sensitivity (COVID-19) using P-ResNet18, 98.53% specificity (COVID-19) using P-ResNet50, and 97.79% accuracy (COVID-19) and 96.43% overall accuracy both using P-ResNet50 (P < 0.05). This demonstrates the proposed methods are able to identify the actual positives and negatives of each category in very high probabilities, especially for the COVID-19 studies even reaching up to 98% on specificity. In comparison with the UP-ResNets (UP-ResNet18 and UP-ResNet50), the pretrained ones achieve an improvement of 2.84% and 3.61% in terms of the overall accuracy (P < 0.05), respectively. The P-ResNets (P-ResNet18 and P-ResNet50) consistently outperform their unpretrained ones in terms of the used performance. Tables 3 and 4 show the performance comparisons for the COVID-19 manifestation classification task. As the number of images in this used dataset is much limited, we only test the performance by using the P-ResNets (P-ResNet18 and P-ResNet50). Similarly, both the methods achieve over 90% performance. The P-ResNet18 is able to achieve over 99% sensitivity (Ground-glass opacity) given the specificity value up to 98%, and the two values for P-ResNet50 are 98% and 99% (P < 0.05), which are very promising in both practical application and statistics. All the classification accuracies and overall top-1 accuracies reach up to 93%, which are very encouraging results in the classification community. In addition, we draw the receiver operating characteristic (ROC) curves for each of methods, and also report their area under curve (AUC) values in parentheses. Figure 4 shows the comparison of the ROC curves and AUC values for the proposed methods in the two classification tasks. Results observed from the subfigures in Fig. 4 are consistent with the results in the above tables. We can find that their AUC values range from 0.988 to 0.999 in COVID-19 recognition task and from 0.978 to 0.999 in the COVID-19 manifestation classification task. Compared comprehensively, the P-ResNets perform better than the unpertrained ones, and P-ResNet50 outperforms P-ResNet18 in the COVID-19 recognition task, while the P-ResNet18 achieves better performance than P-ResNet50 in the COVID-19 manifestation classification task. To visually show the results, we further give the predicted results of the 4 methods on the selected 6 COVID-19 images in Fig. 5. For the image in Fig. 5c, both the UP-ResNet18 and UP-ResNet50 fail to identify it, while the pretrained ones succeed. In Fig. 5d, only P-ResNet50 predicts it as COVID-19, while other three models fail. The CT image in Fig. 5e shows grossly slight signal at lesion site that results in the prediction of normal from both unpretrained models, while the pretrained models can still tell the right results. In Fig. 5f), the lesion is almost invisible, where only P-ResNet50 distinguishes correctly. In brief, the pretrained models can capture the slight differences among close resemblances, especially P-ResNet50.
Table 1.
Comparison of sensitivity and specificity for different methods on the COVID-19 recognition task on image basis. The best performance is boldfaced, and “sd” denotes standard deviation
| Method | UP-ResNet18 | P-ResNet18 | UP-ResNet50 | P-ResNet50 | |
|---|---|---|---|---|---|
| Sensitivity, mean (sd) (%) | COVID-19 | 90.23 (9.62) | 97.11 (1.05) | 90.87 (8.00) | 96.72 (11.59) |
| Other pneumonias | 94.69 (5.65) | 95.87 (4.95) | 95.24 (4.05) | 95.46 (4.06) | |
| Normal | 93.3 (4.43) | 93.83 (4.60) | 92.81 (3.48) | 96.65 (2.66) | |
| Specificity, mean (sd) (%) | COVID-19 | 96.34 (3.55) | 97.50 (2.15) | 97.86 (1.40) | 98.53 (2.04) |
| Other pneumonias | 96.82 (1.80) | 96.64 (2.60) | 94.97 (2.19) | 97.44 (2.00) | |
| Normal | 96.00 (5.61) | 99.04 (0.75) | 96.64 (4.08) | 98.49 (0.79) | |
Sensitivity: . Specificity:
N the number of images, x the category, tp true positive, fp false positive, tn true negative, fn false negative
Table 2.
Comparison of accuracy of each classification and total accuracy for different methods on the COVID-19 recognition task on image basis
| Method | UP-ResNet18 | P-ResNet18 | UP-ResNet50 | P-ResNet50 | P value | P value | P value | |
|---|---|---|---|---|---|---|---|---|
| Accuracy, mean (sd) (%) | COVID-19 | 94.47 (5.09) | 97.32 (1.45) | 95.69 (2.67) | 97.79 (1.14) | 0.021 | 0.021 | 0.041 |
| Other pneumonias | 96.02 (1.62) | 96.15 (1.62) | 95.01 (1.20) | 96.75 (1.37) | 0.031 | 0.027 | 0.039 | |
| Normal | 94.79 (4.41) | 96.75 (1.96) | 94.93 (3.26) | 97.72 (1.41) | 0.024 | 0.022 | 0.034 | |
| Total accuracy, mean (sd) (%) | 92.64 (5.38) | 95.48 (1.68) | 92.82 (3.08) | 96.43 (1.36) | 0.026 | 0.012 | 0.034 | |
Accuracy:
Total accuracy:
P values for the comparison of accuracy of UP-ResNet18 vs P-ResNet50
P values for the comparison of accuracy of UP-ResNet50 vs P-ResNet50
P values for the comparison of accuracy of P-ResNet18 vs P-ResNet50. P < 0.05 indicates a significant difference
Table 3.
Comparison of sensitivity and specificity for different methods on the manifestation classification task on image basis
| Method | P-ResNet18 | P-ResNet50 | |
|---|---|---|---|
| Sensitivity, mean (sd) (%) | Con | 90.02 (1.97) | 86.93 (4.95) |
| Fib. Stre | 89.23 (2.39) | 90.98 (2.12) | |
| G.-G. Opa | 99.27 (0.28) | 98.37 (1.33) | |
| Specificity, mean (sd) (%) | Con | 96.13 (1.00) | 96.36 (1.22) |
| Fib. Stre | 96.69 (0.64) | 95.29 (1.56) | |
| G.-G. Opa | 98.74 (0.32) | 99.03 (0.48) | |
Con. consolidation, Fib. Stre. fibrotic streaks, G.-G. Opa ground-glass opacity
Table 4.
Comparison of accuracy of each classification and total accuracy for different methods on the COVID-19 manifestation classification task on image basis
| Method | P-ResNet18 | P-ResNet50 | P value | |
|---|---|---|---|---|
| Accuracy, mean (sd) (%) | Con | 94.48 (0.64) | 93.93 (0.53) | 0.050 |
| Fib. Stre | 94.70 (0.28) | 94.15 (0.66) | 0.042 | |
| G.-G. Opa | 99.00 (0.25) | 98.72 (0.41) | 0.031 | |
| Total accuracy, mean (sd) (%) | 94.08 (0.55) | 93.35 (0.61) | 0.034 | |
Fig. 4.
Comparison of ROC curves for different methods on image basis. a–d are for the COVID-19 recognition task, and e–f are for the COVID-19 manifestation classification task
Fig. 5.
Example images of COVID-19. Format: (method: predicted result). a (All models: COVID-19). b (UP-ResNet18: other pneumonias, other 3 models: COVID-19). c (UP-ResNet18 and UP-ResNet50: Other pneumonias, P-ResNet18 and R-ResNet50: COVID-19). d (UP-ResNet18, UP-ResNet50 and P-ResNet18: Other pneumonias, P-ResNet50: COVID-19). e (UP-ResNet18 and UP-ResNet50: Normal, P-ResNet18 and P-ResNet50: COVID-19). f (UP-ResNet18, UP-ResNet50 and P-ResNet18: Normal, P-ResNet50: COVID-19)
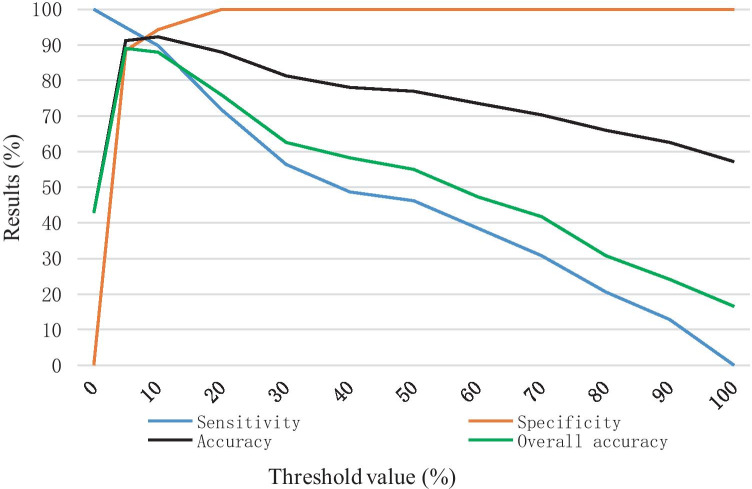
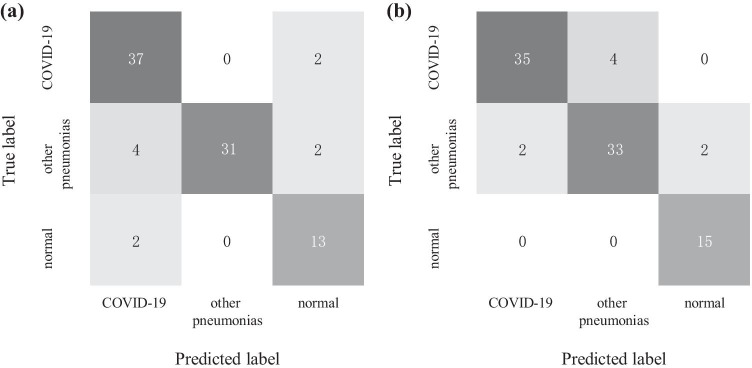
Moreover, the model P-ResNet50 that obtains best performance in image-based results is further evaluated on patient basis and compared with radiologists in testing set (39 studies of COVID-19, 37 studies of other pneumonias, 15 normal studies). Firstly, all images from a study are passed through this model one-by-one. Then, the classification result of the study is based on the proportion of the positives recognized by the model. Thereby, we set a proportion threshold for pneumonias. For example, if a certain proportion of images (larger than the threshold) in a specific study are recognized as COVID-19 positives, the study will be classified as a positive of COVID-19. Here, as we expect a high sensitivity for COVID-19, the threshold value is set to 5%. Figure 6 shows the results changes in the recognition of COVID-19 when setting different thresholds. Finally, the P-ResNet50 achieves 94.87% sensitivity, 88.46% specificity, 91.21% accuracy for COVID-19 versus all other groups, and an overall accuracy of 89.01% for the three-category classification, as shown in Fig. 7 and Table 5. Similarly, the diagnostic performance of two board-certified and experienced radiologists is 89.74% sensitivity, 93.41% specificity, 93.41% accuracy, and 91.21% overall accuracy. By comparing with the radiologist who needs 5–8 min to finish a CT diagnosis, the P-ResNet50 model takes only around 20 s to make it in our used implementation platform.
Fig. 6.
The sensitivity, specificity, accuracy (COVID-19 vs the rest) and overall accuracy on patient basis along with the change of threshold value (testing set)
Fig. 7.
Confusion matrices of P-ResNet50 predictions with the threshold of 5% (a) and radiologists diagnosis (b) on the testing studies
Table 5.
Comparison of COVID-19 diagnosis performances of P-ResNet50 (5% threshold) and radiologists on patient basis
| Sensitivity (%) | Specificity (%) | Accuracy (%) | Overall accuracy (%) | |
|---|---|---|---|---|
| P-ResNet50 | 94.87 | 88.46 | 91.21 | 89.01 |
| Radiologists | 89.74 | 93.41 | 93.46 | 91.21 |
Conclusion and Discussion
This study focuses on auxiliary diagnosis for COVID-19 with deep transfer learning, including distinguishing the COVID-19 from other pneumonias and normal control and classifying main manifestations (i.e., ground-glass opacity, consolidation, fibrotic streaks) of COVID-19 based on chest CT images. It is challenging to obtain adequate quality labeled dataset to training the virgin model, especially that COVID-19 just broke out. Transfer learning is therefore an appropriate method, which can benefit the model learning by some existing public available datasets in computer vision fields. The P-ResNet18 and P-ResNet50 are employed for this purpose, which demonstrate good performance in this study as analyzed in the Results section. Moreover, the pretrained ResNet versions outperform the unpretrained versions. The number of neural network layers should be set by considering the dataset volume; a shallower model is much appropriate for a smaller dataset. The P-ResNet50 not only achieves higher sensitivity (COVID-19 vs the rest) but also takes far less time than radiologists, which is expected to give the auxiliary diagnosis and reduce the workload for the radiologists. Based on above, we can conclude that transfer learning is worth for exploring to be applied in recognition and classification of COVID-19 on CT images with limited training data.
As an initial step, lung segmentation is performed by using a series of heuristic operations. This process can potentially low the impact of lung surroundings, although some information may be lost due to the variable threshold which depends on parameters from a certain CT machine. Afterwards, we conduct classification for the introduced tasks by using the proposed models. Experimental results reported above show and verify that the proposed P-ResNets (P-ResNet18 and P-ResNet50) achieve very convincing performance. Specifically, for the COVID-19 recognition, both the P-ResNets perform better than the UP-ResNets, and the model ResNet50 that has deeper layers successfully outperforms the shallow ResNet18. While for the other COVID-19 manifestation classification task, there is a different observation, that is, the shallow P-ResNet18 obtains better classification performance than P-ResNet50. This is mainly because that the data volume is more suitable for training a shallow neural network. Overfitting may easily come with the increasement of layers.
It is the most significant finding that transfer learning has tremendous potential in classification of medical images with its ability of capturing fine details despite limited dataset for training. In the future, we will explore to design a classifier chain, consisting of multiple independent classifiers, which is expected to further improve the performance with amplified advantages.
In addition, our work in a sense explores the application of CT scans in the diagnosis of COVID-19. Compared with the RT-PCR test (the practicable gold standard for COVID-19 diagnosis [5]) which is considered to have high specificity but low sensitivity (only 59–71%), CT is more sensitive than the initial RT-PCR (98% vs. 71%, and 88% vs. 59%) as reported in previous studies [28, 29]. In our work, the sensitivity performance of the deep learning system also reaches up to 94.8%. In a sense, CT can decrease the probability of false-negative results in the RT-PCR assay. Furthermore, the RT-PCR process is time-consuming. Differently, since CT equipment is widespread in such as China, the CT scan process is relatively simple and quick. As a result, CT can be used as a rapid screening tool for suspected patients in the severe epidemic area when RT-PCR tests are unavailable. There is another important application of CT in COVID-19; that is, it can benefit the assessment of disease scope and the follow-up assessment [30]. In summary, although presently the application of the chest CT scans in COVID-19 has some limitations, such as false-positives, low specificity, and cross-infection [31, 32], CT still plays a crucial auxiliary role in both diagnosis and follow up in this novel coronavirus.
Declarations
Ethics Approval
This research study was conducted retrospectively from data obtained for clinical purposes. We consulted extensively with the IRB of the Fifth Affiliated Hospital of Sun Yat-sen University who determined that our study did not need ethical approval. An IRB official waiver of ethical approval was granted from the IRB of the Fifth Affiliated Hospital of Sun Yat-sen University.
Informed Consent
It is not necessary to obtain consent because of CT images without identifying information in this study.
Conflict of Interest
The authors declare that they have no conflict of interest.
Footnotes
The Institutional Ethics Committee of The Fifth Affiliated Hospital of Sun Yat-sen University has approved the commencement of the study. All procedures performed in studies involving human participants were in accordance with the ethical standards of the institutional and national research committee and with the 1964 Helsinki declaration and its later amendments or comparable ethical standards.
Publisher’s Note
Springer Nature remains neutral with regard to jurisdictional claims in published maps and institutional affiliations.
Contributor Information
Yanbin Hao, Email: haoyanbin@hotmail.com.
Shaolin Li, Email: LISHLIN5@mail.sysu.edu.cn.
References
- 1.Novel Coronavirus (COVID-19) Situation. World Health Organization. Available at https://experience.arcgis.com/experience/685d0ace521648f8a5beeeee1b9125cd. Accessed 3 April 2020.
- 2.Situation report-11. World Health Organization. Available at https://www.who.int/docs/default-source/coronaviruse/situation-reports/20200131-sitrep-11-ncov.pdf?sfvrsn=de7c0f7_4. Accessed 31 Jan 2020.
- 3.Chung, M; Bernheim, A; Mei, X; et al. CT Imaging Features of 2019 Novel Coronavirus (2019-nCoV). J Radiology 200230,2020 [DOI] [PMC free article] [PubMed]
- 4.Guan WJ, Ni ZY, Hu Y, Liang WH, Ou CQ, He JX, Du B, et al: Clinical characteristics of 2019 novel coronavirus infection in China. medRxiv, 2020
- 5.Huang C, Wang Y, Li X, et al. Clinical features of patients infected with 2019 novel coronavirus in Wuhan, China. The Lancet. 2020;395(10223):497–506. doi: 10.1016/S0140-6736(20)30183-5. [DOI] [PMC free article] [PubMed] [Google Scholar]
- 6.新型冠状病毒感染的肺炎诊疗方案 (试行第五版) . Available at http://www.nhc.gov.cn/yzygj/s7652m/202002/e84bd30142ab4d8982326326e4db22ea.shtml. Accessed 5 Feb 2020.
- 7.Cicero M, Bilbily A, Colak E, et al: Training and validating a deep convolutional neural network for computer-aided detection and classification of abnormalities on frontal chest radiographs J Investig Radiol 52,2017 [DOI] [PubMed]
- 8.Lakhani P, Sundaram B. Deep learning at chest radiography: Automated classification of pulmonary tuberculosis by using convolutional neural networks. J Radiology 162326,2017 [DOI] [PubMed]
- 9.Ueda D, Shimazaki A, Miki Y. Technical and clinical overview of deep learning in radiology. Jpn J Radiol. 2019;37(1):15–33. doi: 10.1007/s11604-018-0795-3. [DOI] [PubMed] [Google Scholar]
- 10.Yuan Y, Qin W, Buyyounouski M, et al. Prostate cancer classification with multiparametric MRI transfer learning model. J. Med Phys. 2019;46(2):756–765. doi: 10.1002/mp.13367. [DOI] [PubMed] [Google Scholar]
- 11.Zhang S, Sun F, Wang N, et al. Computer-aided diagnosis (CAD) of pulmonary nodule of thoracic CT image using transfer learning. J Digit Imaging. 2019;32(6):995–1007. doi: 10.1007/s10278-019-00204-4. [DOI] [PMC free article] [PubMed] [Google Scholar]
- 12.Tan T, Li Z, Liu H, et al. Optimize transfer learning for lung diseases in bronchoscopy using a new concept: sequential fine-tuning. IEEE J Transl Eng Health Med. 2018;6:1800808. doi: 10.1109/JTEHM.2018.2865787. [DOI] [PMC free article] [PubMed] [Google Scholar]
- 13.Xu Y, Hosny A, Zeleznik R, et al. Deep learning predicts lung cancer treatment response from serial medical imaging. Clin Cancer Res. 2019;25(11):3266–3275. doi: 10.1158/1078-0432.CCR-18-2495. [DOI] [PMC free article] [PubMed] [Google Scholar]
- 14.Caravagna G, Giarratano Y, Ramazzotti D, et al. Detecting repeated cancer evolution from multi-region tumor sequencing data. J Nat Methods. 2018;15(9):707–714. doi: 10.1038/s41592-018-0108-x. [DOI] [PMC free article] [PubMed] [Google Scholar]
- 15.Cheplygina V, Pena IP, Pedersen JH, et al. Transfer learning for multicenter classification of chronic obstructive pulmonary disease. IEEE J Biomed Health Inform. 2018;22(5):1486–1496. doi: 10.1109/JBHI.2017.2769800. [DOI] [PMC free article] [PubMed] [Google Scholar]
- 16.Christodoulidis S, Anthimopoulos M, Ebner L, et al. Multisource transfer learning with convolutional neural networks for lung pattern analysis. IEEE J Biomed Health Inform. 2017;21(1):76–84. doi: 10.1109/JBHI.2016.2636929. [DOI] [PubMed] [Google Scholar]
- 17.He K, Zhang X, Ren S, et al: Deep Residual Learning for Image Recognition[C]// 2016 IEEE Conference on Computer Vision and Pattern Recognition (CVPR). IEEE Computer Society 2016
- 18.Scikit-image Documentation. scikit-image. Available at https://scikit-image.org/docs/dev/index.html#. Accessed 9 February 2020.
- 19.Krizhevsky A, Sutskever I, Hinton G. ImageNet Classification with deep convolutional neural networks[C]// NIPS. Curran Associates Inc. 2012.
- 20.Simonyan K, Zisserman A. Very Deep Convolutional networks for large-scale image recognition. J Comp Sci 2014
- 21.Olga Russakovsky*, Jia Deng*, Hao Su, Jonathan Krause, Sanjeev Satheesh, Sean Ma, Zhiheng Huang, Andrej Karpathy, Aditya Khosla, Michael Bernstein, Alexander C. Berg and Li Fei-Fei. (* = equal contribution) ImageNet Large Scale Visual Recognition Challenge. IJCV, 2015
- 22.Yang L, Song Q, Wu Y, et al. Attention inspiring receptive-fields network for learning invariant representations. J IEEE Trans Neural Netw Learn Syst. 2019;30(6):1744–1755. doi: 10.1109/TNNLS.2018.2873722. [DOI] [PubMed] [Google Scholar]
- 23.Xu BY, Chiang M, Chaudhary S, et al. Deep learning classifiers for automated detection of gonioscopic angle closure based on anterior segment OCT images. Am J Ophthalmol. 2019;208:273–280. doi: 10.1016/j.ajo.2019.08.004. [DOI] [PMC free article] [PubMed] [Google Scholar]
- 24.Baltruschat IM, Nickisch H, Grass M, et al. Comparison of deep learning approaches for multi-label chest X-ray classification. J Sci Rep. 2019;9(1):6381. doi: 10.1038/s41598-019-42294-8. [DOI] [PMC free article] [PubMed] [Google Scholar]
- 25.Wang J, Deng G, Li W, et al. Deep learning for quality assessment of retinal OCT images. J Biomed Opt Express. 2019;10(12):6057–6072. doi: 10.1364/BOE.10.006057. [DOI] [PMC free article] [PubMed] [Google Scholar]
- 26.Talo M. Automated classification of histopathology images using transfer learning. J Artif Intell Med. 2019;101:101743. doi: 10.1016/j.artmed.2019.101743. [DOI] [PubMed] [Google Scholar]
- 27.Lee JH, Kim YJ, Kim YW, et al. Spotting malignancies from gastric endoscopic images using deep learning. J Surg Endosc. 2019;33(11):3790–3797. doi: 10.1007/s00464-019-06677-2. [DOI] [PubMed] [Google Scholar]
- 28.Fang Y, Zhang H, Xie J, Lin M, Ying L, Pang P, et al: Sensitivity of chest CT for COVID-19 Comparison to RT-PCR. Radiology 200432,2020 [DOI] [PMC free article] [PubMed]
- 29.Ai T, Yang Z, Hou H, Zhan C, Chen C, Lv W, et al: Correlation of chest CT and RT-PCR testing in coronavirus disease 2019 (COVID-19) in China: A report of 1014 cases. Radiology 200642,2020 [DOI] [PMC free article] [PubMed]
- 30.Li Meng: "Chest CT features and their role in COVID-19. Radiology of infectious diseases 2020 [DOI] [PMC free article] [PubMed]
- 31.Hope Michael D, et al: "A role for CT in COVID-19? What data really tell us so far. http://www.thelancet.com/article/S0140673620307285/pdf2020 [DOI] [PMC free article] [PubMed]
- 32.Simpson S, et al: Radiological Society of North America Expert Consensus Statement on Reporting Chest CT Findings Related to COVID-19. Endorsed by the Society of Thoracic Radiology, the American College of Radiology, and RSNA. Radiology: Cardiothoracic Imaging 2.2 e200152,2020 [DOI] [PMC free article] [PubMed]
- 33.Wang S, Zha Y, Li W, et al: A fully automatic deep learning system for COVID-19 diagnostic and prognostic analysis. Eur Respir J 2020 [DOI] [PMC free article] [PubMed]


