

Abstract
Background:
Unique amongst brain stimulation tools, transcranial direct current stimulation (tDCS) currently lacks an easy or widely implemented method for individualizing dosage.
Objective:
We developed a method of reverse-calculating electric-field (E-field) models based on Magnetic Resonance Imaging (MRI) scans that can estimate individualized tDCS dose. We also evaluated an MRI-free method of individualizing tDCS dose by measuring transcranial magnetic stimulation (TMS) motor threshold (MT) and single pulse, suprathreshold transcranial electrical stimulation (TES) MT and regressing it against E-field modeling. Key assumptions of reverse-calculation E-field modeling, including the size of region of interest (ROI) analysis and the linearity of multiple E-field models were also tested.
Methods:
In 29 healthy adults, we acquired TMS MT, TES MT, and anatomical T1-weighted MPRAGE MRI scans with a fiducial marking the motor hotspot. We then computed a “reverse-calculated tDCS dose” of tDCS applied at the scalp needed to cause a 1.00 V/m E-field at the cortex. Finally, we examined whether the predicted E-field values correlated with each participant’s measured TMS MT or TES MT.
Results:
We were able to determine a reverse-calculated tDCS dose for each participant using a 5 × 5 x 5 voxel grid region of interest (ROI) approach (average = 6.03 mA, SD = 1.44 mA, range = 3.75–9.74 mA). The Transcranial Electrical Stimulation MT, but not the Transcranial Magnetic Stimulation MT, significantly correlated with the ROI-based reverse-calculated tDCS dose determined by E-field modeling (R2 = 0.45, p < 0.001).
Conclusions:
Reverse-calculation E-field modeling, alone or regressed against TES MT, shows promise as a method to individualize tDCS dose. The large range of the reverse-calculated tDCS doses between subjects underscores the likely need to individualize tDCS dose. Future research should further examine the use of TES MT to individually dose tDCS as an MRI-free method of dosing tDCS.
Keywords: tDCS, Individualized dosing, tDCS dosing, Electric field modeling, Transcranial direct current stimulation, Transcranial electrical stimulation, Transcranial magnetic stimulation
Introduction
Transcranial direct current stimulation (tDCS) is an appealing brain stimulation method due to its efficacy in treating multiple neurological and psychiatric conditions [1-4], relatively cheap cost [5,6], excellent safety profile [7], and ease of use that could potentially lead to self-administration outside of a clinic or laboratory setting [7-10]. A typical tDCS experiment or treatment applies a weak uniform electrical current to the scalp to stimulate the underlying cortex (typically 1–2 mA for 20 min) [11]. While this uniform dose is effective in some individuals, tDCS currently does not have an easy or inexpensive method or biomarker to confirm that the stimulation dosage is sufficient to induce physiological effects in the cortex. This lack of simple method to individualize dose could result in some individuals receiving subtherapeutic doses that may contribute to mixed findings in the field [12-27]. Determining a method of individualizing tDCS dosage is important as it would likely inform the experimental design and interpretation of tDCS studies, probably improve the effect size, and allow for more rigorous clinical and investigational use. Therefore, there is great interest in developing novel methods of individualizing tDCS dose as it may allow for more consistent responses to stimulation.
To date, researchers have investigated only a handful of methods that could possibly be used to dose tDCS. Some have used electroencephalography (EEG) or functional magnetic resonance imaging (fMRI) as a biomarker of tDCS current reaching the cortex [28] and to target biologically active areas with stimulation [29-31]. However, EEG may be limited to non-concurrent use with tDCS due to stimulation artifacts [32] and it would be difficult to use either EEG or fMRI for dosing tDCS as they are monitoring techniques and would likely need to occur in a laboratory setting. Another potential method could be to use electric-field (E-field) modeling to dose tDCS [33-37], which operates based on how electric current spreads based on the physical properties of different tissue such as skin, bone, cerebrospinal fluid (CSF), grey matter, and white matter. While potentially a fruitful area of research, using image-based dosing methods alone has the drawback of requiring MRI scans and could be cost- or resource-prohibitive. One interesting line of research has used a neurophysiological measurement such as transcranial magnetic stimulation (TMS) motor threshold (MT) to dose tDCS, which has the appeal of being an MRI-free approach that could lead to easier dissemination and implementation if effective [38,39]. In one study, the TMS intensity required to induce a motor evoked potential (MEP) of 1 mV correlated with the modeled E-field produced by 1 mA of tDCS [39]. This finding suggests that TMS could be a potential physiological measurement that is sensitive to the theoretical tDCS dose. However, the next step toward using TMS for individualized dosing would be to evaluate how to use a neurophysiological measure such as TMS MT to prospectively and individually estimate tDCS dosage based on E-field modeling.
The goal of this study was to investigate the utility of TMS MT as well as transcranial electrical stimulation (TES) MT to estimate theoretical E-field doses. In parallel to a similar approach [33], we developed a theoretical method of individualizing dose based on reverse-calculating the amount of tDCS dose at the scalp to produce a uniform E-field of 1.00 V/m at the cortex for each participant, hypothesizing that TMS or TES MTs would correlate with the reverse-calculated tDCS dose that would be required to produce a 1.00 V/m E-field and that TMS or TES MTs could potentially be used in the future to individually titrate tDCS dosage to any desired threshold.
Methods
Study overview
We enrolled 30 healthy participants (15 women, mean age = 26.9, SD = 9.1) in this two visit IRB-approved study. In Visit 1, we acquired each participant’s TMS MT and TES MT. In Visit 2, we acquired a T1-weighted anatomical MRI scan. One participant dropped out prior to Visit 2, making the final sample size 29 participants. Each participant gave written, informed consent before starting the experimental protocol. For detailed Visit 1 procedures, please see the Supplemental Video.
In Visit 1, we secured a plastic cap to each participant’s head and marked anatomical landmarks (outline of ears, vertex, and distance between the front, center edge of the cap to the nasion). Next, we acquired a resting TMS MT for each participant by stimulating the left motor cortex and recording motor evoked potentials (MEPs) in a standard, closed-loop TMS MT acquisition protocol [40,41]. Using the methods detailed in(41), we placed three electromyography (EMG) electrodes on the contralateral right hand to record MEPs from the anterior pollicis brevis (APB) muscle that were connected to the Cambridge Electronic Design Limited EMG system (CED 1401 and CED 1902, Cambridge, England, UK) [41] and desktop computer. We used a Magstim BiStim TMS machine with a figure-of-eight D70 Remote Coil (Magstim Company Limited, Whitland, Wales, UK) to stimulate the left motor cortex. The EMG system output was processed in Spike2 software to record MEPs [41]. We defined an MEP as having a peak-to-peak amplitude in the Spike2 software of greater than or equal to 0.05 mV [40]. After locating the motor hotspot through a standard motor hotspot hunting procedure [41], we used Parametric Estimation via Sequential Testing (PEST) software (https://www.clinicalresearcher.org/software.htm) to optimally determine the TMS MT in 5 pulses [42]. We marked the front edge of the TMS coil using a permanent marker on the cap before removing the TMS coil from the head.
We then acquired an active TES MT for each participant. We chose to perform TES MTs as we believed that the more similar mechanism to tDCS (i.e. electrical rather than electromagnetic stimulation) could potentially make TES MT a better candidate stimulation technique that could be used to individually dose tDCS. However, TES has traditionally been a prohibitively painful form of brain stimulation in comparison to TMS [43,44]. Thus, we extensively piloted different unconventional electrode montages and stimulation parameters to reduce the pain and discomfort experienced while still being able to acquire a TES MT. The most tolerable electrode montage was to place the anodal electrode (Natus Neurology, Inc., Pleasanton, CA, USA; rectangular tab electrode with dimensions of 35 × 20 mm) over the previously determined TMS motor hotspot by measuring 40 mm posterior from the front center edge of the coil to locate the center of the TMS coil, and a cathodal electrode (Natus Neurology, Inc., Pleasanton, CA, USA; rectangular ground plate electrode with area = 55 × 42mm) over the left deltoid. We cut a hole in the plastic cap and placed the anodal electrode directly on the scalp over the motor hotspot (Fig. 1A, Supplemental Video).
Fig. 1. TES MT Materials and Methods.

1A: Experimental set-up with labeled devices and electrodes. 1B: Image of the constant current stimulator (Digitimer DS7A) and settings that were used to acquire TES MTs. 1C: Modified PEST program window showing an example in which 5 pulses of TES determined a TES MT of 50 mA.
Immediately prior to each TES pulse, participants were instructed to make a “thumbs-up” sign with their contralateral right hands to activate the motor circuit, which Merton and colleagues (1982) have previously shown lowers the TES MT by approximately 20% [43]. Single, suprathreshold TES pulses were delivered using a constant current stimulator (Digitimer DS7A, Letchworth Garden City, England, UK). Stimulation parameters were a pulse width of 200 μs, a maximum voltage of 400 V, monophasic waveform, and an initial stimulation intensity of 58.0 mA. Using this approach and a modified PEST algorithm that was optimized for TES MT acquisition, we were able to acquire a TES MT for each participant (Fig.1B-C, Supplemental Materials S1).
In Visit 2, each participant underwent a high resolution T1-weighted MPRAGE anatomical magnetic resonance imaging (MRI) scan in a Siemens 3T TIM Trio, with the head positioned in a 12 channel head coil with 1 × 1 × 1mmvoxels (TE: 4.18 ms, TR: 1.75s). To visualize the motor hotspot used to acquire the TMS MT and TES MT in Visit 1, participants wore the same plastic cap that was used in Visit 1 and matched up the previous anatomical landmarks (outline of ears, vertex, and distance between the front center edge of the cap to the nasion) to ensure that the cap was in the same position. Using the cap, we fixed a vitamin E capsule to each participant’s head as a fiducial to mark each participant’s previously determined motor hotspot for the TMS/TES MT. This allowed the motor hotspot location to later be visualized for E-field modeling as detailed below.
ROAST E-Field modeling methodology
Step 1: Determining the E-field threshold to dose at
To prospectively individualize tDCS dosage using E-field modeling, a first step is to decide upon a desired E-field threshold at the cortex to dose at. However, there is no current consensus about the amount of stimulation it takes to affect cortical tissue using tDCS, in part to different neuronal and non-neuronal cell types at varying thresholds [45-50] and the difficulty with assessing such a threshold in vivo that typically rely on animal models [51-54]. Studies have used E-field estimates in vitro as well as implanted electrodes in rats in vivo and human cadavers to estimate that the E-field necessary to affect neuronal spiking rate is likely somewhere between the relatively large range of 0.10–1.00 V/m [55-58]; thus, tDCS applied at lower intensities such as 1–2 mA that produce E-fields on the order of 0.10–0.40 V/m likely indirectly, rather than directly, elicits changes in neuronal spiking activity(58).
It is additionally unclear whether behavioral results scale with E-field magnitude. There is some evidence that there is no dose-response relationship in the motor system [59-62], for tinnitus [63,64], or for working memory [65]. Yet, other studies have shown that more days of stimulation or higher stimulation current/current density correlate with greater sensitivity of vibrotactile detection [66], bigger motor responses/greater motor recovery from stroke [67,68], and greater working memory performance [69] and cognition in schizophrenia [70].Some studies have even shown dose-response relationships for single session protocols in MEP size and cerebral blood flow [71], motor learning improvements from 1.5 mA but not 1.0 mA or sham tDCS [72], signal, and working memory enhancement in Parkinson’s disease patients from 2.0 mA but not 1.0 or sham tDCS [73].
Due to these varied findings, we remained agnostic in this study to the amount of stimulation required to affect neural tissue and reverse-calculated the dose to produce a 1.00 V/m threshold at the cortex in each individual since it is easily scalable to the desired E-field. The linearity of electric field with current intensity depends only on the insensitivity of tissue resistivities to local current density (for the specific low-intensity DC conditions considered), and is supported by experimental recordings of tDCS/tACS [74]. Thus, reverse-calculating a tDCS dose that would produce a 1.00 V/m E-field could easily be adjusted using multiplication or division. For example, if 0.50 V/m were the desired threshold to individualize tDCS dosage to, the calculated tDCS dose to produce 1.00 V/m would be halved. Because this scaling factor is preserved across subjects, the calculated, individualized dose at 1.00 V/m was a reasonable candidate threshold that could easily be adjusted based on forthcoming research.
Step 2: ROAST E-field modeling overview
We used Realistic vOlumetric-Approach to Simulate Transcranial Electric Stimulation (ROAST) Version 2.7 (https://www.parralab.org/roast/) to perform our E-field modeling for tDCS. ROAST is a MATLAB-based software that uses individual structural MRI volumes with 1 mm3 voxels to produce a 3D-rendering of E-field based on user-defined electrode locations and current intensities [75]. We chose to use ROAST as it has been validated against human intracranial recordings, although the fidelity of intracranial recordings is contended by some [76]. ROAST has additionally been validated against other tDCS modeling software such as SimNIBS [75] and allows for non-surgical estimation of E-field intensities at the cortical level.
To perform our reverse-calculation method, we first converted the raw DICOM files to NIfTI in MRICroGL (https://www.nitrc.org/projects/mricrogl). ROAST then called SPM12 (https://www.fil.ion/ucl.ac.uk/spm/) to segment the MRI into grey and white matter, cerebrospinal fluid (CSF), bone, skin, and air cavities (Fig. 2A). ROAST then automatically removed holes in the segmented images as detailed in Refs. [77,78]. Next, ROAST placed electrodes on the scalp at custom locations that we specified. We placed the electrodes at custom locations to approximate the electrode locations used in the TES MT protocol. We used MRICro (https://www.mccauslandcenter.sc.edu/crnl/mricro) to visualize the fiducial marking the motor hotspot location in each participant’s MRI scan and noted the X, Y, and Z coordinates of the center of the fiducial (Fig. 2B). We further used MRICro to approximate the cathodal electrode location over the left deltoid by finding the lowest location on the left shoulder visible on the MRI scan, with the bottom edge of the cathodal electrode placed 20 voxels (20 mm) above the bottom edge of the scan (Fig. 2C). We acknowledge that this method of placing the cathodal electrode was inexact and limited by ROAST not segmenting muscle tissue in the neck. However, in lieu of capturing MRI scans down to each participant’s left deltoid, we sought to have a reproducible and standardized method across participants. We additionally used ROAST to emulate the same electrode sizes and orientations used to determine TES MT (anode 35 × 20 mm oriented with the longer axis anterior/posterior over the TMS motor hotspot; cathode 55 × 42 mm with the longer axis oriented anterior/posterior over the left neck and 20 mm above the bottom edge of the scan)(Fig. 2C).
Fig. 2. ROAST E-Field Modeling Pipeline Overview.

2A: MRI segmentation in SPM12 run by ROAST. 2B: Anatomical MRI Scan with an arrow pointing at the fiducial on the scalp indicating the motor hotspot coordinates (visualized in MRICroGL). 2C: Using ROAST, an anodal electrode was placed at the left motor hotspot and the cathode was placed on the left neck to approximate the TES electrode montage. 2D: ROAST E-field model output after the FEM was solved. 2E: Our 5 × 5 x 5 voxel grid ROI analysis measured the E-field average in a cuboidal volume that was immediately underneath the center of the anodal electrode in each participant. See Fig. 3 for detailed description.
Next, ROAST used iso2mesh to create a volumetric mesh from 3D multi-domain images to generate the finite element model (FEM) [79]. ROAST then solved the FEM model for E-field distribution using getDP [80](Fig. 2D) and the following conductivity values: Grey matter: 0.276 S/m; white matter: 0.126 S/m; CSF: 1.65 S/m; bone: 0.01 S/m; skin: 0.465 S/m; air: 2.5 × 10⁻¹⁴ S/m; gel: 0.3 S/m; electrodes: 5.9 × 10⁷ S/m. For each model, we visually confirmed that ROAST correctly segmented the anatomical MRI scan by examining the borders between different types of tissues and ensuring that they were properly delineated (See Supplemental Materials S2 for tissue segmentation examples in three randomly selected participants). In addition, we used Mango (http://ric.uthscsa.edu/mango/mango.html), a software package that can load NIFTI files of different segmented components in each ROAST. Here we measured the tissue volume of grey matter, white matter, and CSF for each person. We used a Z-score analysis with criteria for an outlier set at ± 3SD to determine if there were any outliers that might be indicative of inadequate segmentation. There were no outliers for the segmentation of any tissue type, further suggesting that the segmentation was adequately performed (Supplemental Materials S3).
Step 3: Reverse-calculation ROAST E-Field modeling
Most tDCS E-field modeling studies use modeling to retrospectively estimate the E-field produced by a uniform tDCS current placed on the scalp (e.g. What is the E-field produced by 2 mA of stimulation?). In this study, we asked the opposite question: To produce an E-field of a 1.00 V/m at a certain spot in the cortex, what would be the individualized, reverse-calculated tDCS dose for the electrode on the scalp?
To determine the E-field produced in each model, we measured the E-field magnitude using a region of interest (ROI) analysis that calculated an E-field average from voxels in a 5× 5×5 voxel cuboidal grid (Fig. 2E). To standardize the ROI location across participants, we first centered the ROI on the X (left/right axis) and Y (anterior/posterior axis) values of the center of the anodal electrode, We then lowered the Z value (superior/inferior axis) until we reached the first coordinate with a grey matter voxel and recorded this X, Y, Z value (Fig. 3). Next, we created a 5×5 voxel grid in the XY plane by moving 2 voxels left, 2 voxels right, 2 voxels anterior, and 2 voxels posterior of the center X, Y, Z coordinate voxel. We recorded the E-field values of each grey matter voxel and did not count any voxel without grey matter tissue. We repeated this method five times per participant, moving down one axial plane at a time by keeping the same X and Y values and subtracting 1 from the Z plane (Fig. 3). After measuring all the grey matter voxels with E-field values, we computed the E-field average for the ROI and used this to calculate the reverse-calculation dose for a 1.00 V/m E-field at the cortex.
Fig. 3. Detailed Visual Representation of the 5 × 5 × 5 Voxel Grid ROI Analysis.

In order to standardize the exact location for the 5 × 5 x 5 voxel grid ROI analysis across participants, we centered the ROI at the cortex on the same XY plane as the center of the anodal electrode on the scalp. We then lowered the Z plane value until we reached the first coordinate with a grey matter voxel. This location served as the center of the 5 × 5 voxel grid in the XY plane. We created the 5 × 5 voxel grid by moving 2 voxels left, 2 voxels right, 2 voxels anterior, and 2 voxels posterior of this center voxel. We recorded the E-field values of each grey matter voxel in this grid and did not count any voxel without grey matter tissue. We repeated this method a total of 5 times, moving down one axial plane at a time by keeping the same X and Y coordinates and subtracting 1 from the Z plane for each level. In this example, the X and Y coordinates stay at 58 and 96 respectively, while the Z value changes with each grey matter tissue level from 206 through 202. After measuring all the grey matter voxels with E-field values, we computed the average and used this to calculate the reverse-calculation dose for a 1.00 V/m E-field at the cortex (Fig. 4).
Since E-field models are dependent only on tissue segmentation, conductivities of each tissue type, and magnitude of electrical input, it is possible to use a single electric field model, combined with simple cross-multiplication, to compute the current input that would be required to reach any electric field threshold desired. Therefore, to reverse-calculate the E-field for a 1.00 V/m threshold, we used ROAST to model the E-field produced from 3 mA of current for each individual before using cross-multiplication to “reverse-calculate” the amount of stimulation required at the scalp for that person to produce a 1.00 V/m E-field at the cortex (Fig. 4A-B) [33].
Fig. 4. Reverse-Calculation Modeling Formula.
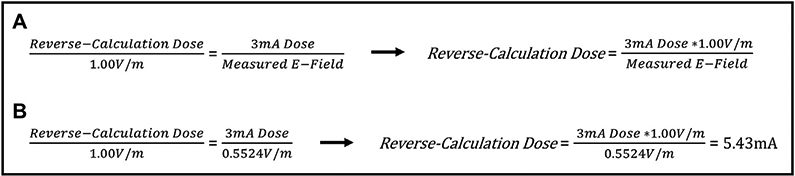
4A: Since E-field modeling relies only upon the proper segmentation of tissue and different tissue conductivities, a single E-field model can be used to estimate the tDCS dose at the scalp that would be required to produce any threshold of E-field at the cortex(33). 4B: Example of how one E-field model produced by a 3 mA input can be used to reverse-calculate the required dose to produce a 1.00 V/m E-field. In this example, a 3 mA dose produced an ROI average E-field of 0.5542 V/m and the reverse-calculation dose was 5.43 mA.
An initial analysis on this dataset using reverse-calculation modeling utilized a 5 electric field model approach (1 mA, 3 mA, 5 mA, and 7 mA to converge on the reverse-calculation dose, and a 5th model using the reverse-calculated E-field dose to confirm that it produced a 1.00 V/m) for a single voxel that confirmed the linearity of E-field modeling (Supplemental Materials S4). However, we chose to adopt this simplified, one-model ROI-based approach here as the ROI values highly correlated with the single voxel approach (Supplemental Materials S5). Since our assumption of the linearity of models held, this one model ROI method was therefore able to estimate a reverse-calculation dose to produce a 1.00 V/m E-field for each participant. We have included the previous E-field modeling data in Supplemental Materials S4 and S5 as a reference for future E-field modeling experiments and reverse-calculation E-field modeling considerations.
Step 4: Reverse-calculation ROAST E-Field modeling x TMS MT and TES MT- statistical analysis
Following the ROI-based E-field modeling, we plotted each individual’s reverse-calculated tDCS dose for 1.00 V/m against their measured TMS MT and used a group level linear regression to determine the relationship between TMS MT and reverse-calculated tDCS dose (Fig. 6). We used this same method to then assess the relationship between TES MT and the reverse-calculated tDCS dose in a group level E-Field Model x TES MT regression (Fig. 7). All statistical analyses were conducted in SPSS 25.0 (Armonk, NY: IBM Corp).
Fig. 6.
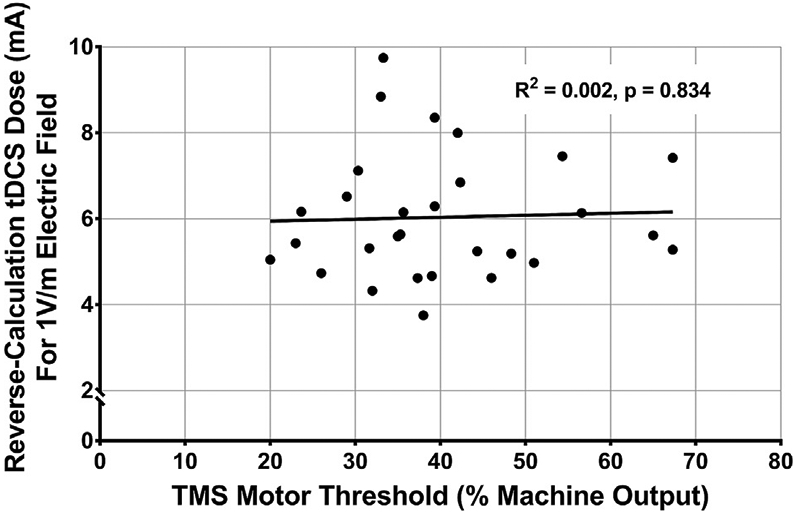
TMS MT Does Not Correlate with Reverse-Calculated tDCS Dose, F(1,27) = F(1,27) = 0.045, R2 = 0.002, p = 0.834.
Fig. 7.
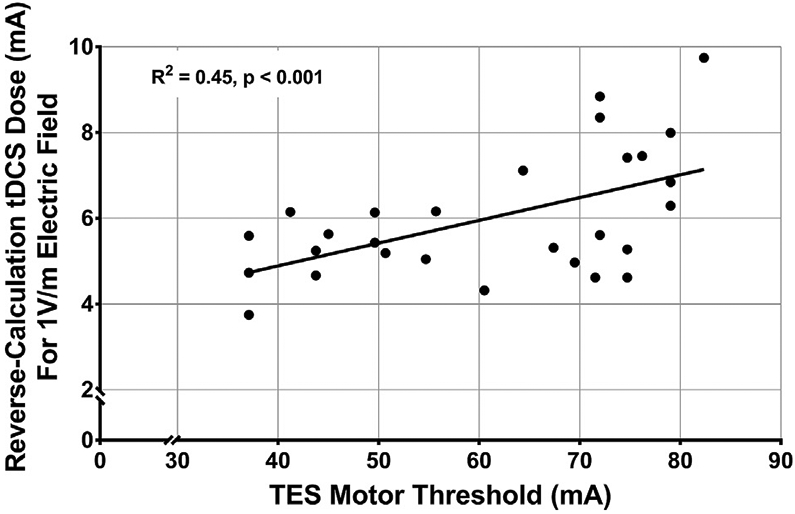
TES MT Significantly Correlates with Reverse-Calculated tDCS Dose, F(1,27) = 21.88, R2 = 0.45, p < 0.001.
Results
TMS and TES motor threshold (MT) descriptive statistics
The mean TMS MT was 40.19% of maximum stimulator output (MSO)(SD = 12.7%, range = 20–67.3%)(Fig. 5A). We were able to acquire a TES MT for each participant and the mean TES MT was 61.35 mA (SD = 14.91 mA, range = 37.1–82.35 mA)(Fig. 5B).
Fig. 5.
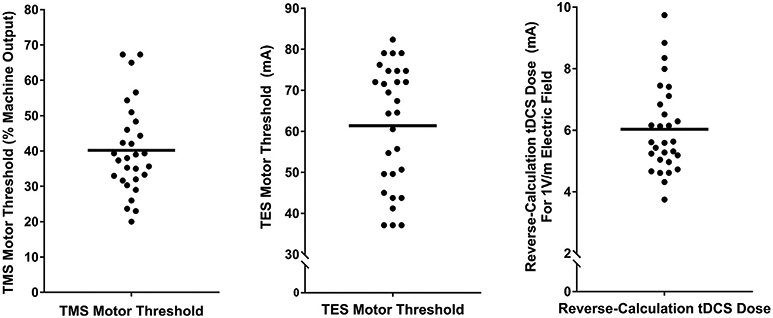
A–C: Descriptive data for TMS MT, TES MT, and reverse-calculation doses for 1.00 V/m.
Reverse-calculated tDCS dose from E-Field modeling
The mean reverse-calculated tDCS dose to produce a 1.00 V/m E-field in the motor cortex using actual electrode placements was 6.03 mA (SD = 1.44 mA, range = 3.75–9.74 mA)(Fig. 5C).
TMS MT x reverse-calculated tDCS dose linear regression
This linear regression evaluated the relationship between TMS MT and reverse-calculated tDCS dose determined from the same electrode placement and sizes as were used for acquiring the TES MT. TMS MT did not statistically predict tDCS dose variance, F(1,27) = 0.045, R2 = 0.002, p = 0.834 (Fig. 6).
TES MT x reverse-calculated tDCS dose linear regression
This regression model used the same reverse-calculation tDCS modeling electrode placement and sizes as in Fig. 6. In this regression, TES MT significantly estimated 45% of the reverse-calculated tDCS dose variance required to produce a 1.00 V/m E-field, F(1,27) = 21.88, R2 = 0.45, p < 0.001 (Fig. 7).
The equation for the linear regression is: Reverse-calculated tDCS Dose = 0.0647 * TES MT + 2.068. Using this formula, it could be possible to measure TES MT and estimate an individual’s reverse-calculated tDCS dose. For example, if an individual had a TES MT of 60 mA, the reverse-calculated tDCS dose to produce a 1.00 V/m E-field at their motor cortex would be estimated as 5.95 mA. Notably, we chose to compute the reverse-calculated tDCS dose for a 1.00 V/m E-field at the cortex due to its scalability. For example, if one wanted to estimate the reverse-calculated tDCS dose for a 0.50 V/m E-field in the same individual with a TES MT of 60 mA, the reverse-calculated-dose would be: 5.95 mA * 0.5 = 2.975 mA.
TMS MT x TES MT linear regression
We examined the relationship between TMS MT and TES MT by comparing the measured values for each individual in a linear regression. These values trended toward significance, F(1,27) = 3.84, R2 = 0.125, p = 0.06 (Supplemental Materials S6).
Discussion
In this study we tested whether TMS and TES motor thresholds (MTs) can be used to estimate individualized tDCS doses determined by reverse-calculation E-field modeling. We developed an E-field modeling paradigm in parallel with a similar approach(33) that can determine an individual’s theoretical reverse-calculated tDCS dose to produce an E-field of 1.00 V/m and found that the measured transcranial electrical stimulation (TES) MT could be used to estimate the reverse-calculated tDCS dose using a linear regression model. In these participants, an average dose of 6.03 mA of input at the scalp would be required to produce a 1.00 V/m E-field at the cortex. We chose this 1.00 V/m threshold as it is easily scalable to the desired E-field by multiplying or dividing the tDCS dose by the desired E-field (e.g. for someone with a reverse-calculated dose of 6.03 mA at 1.00 V/m, the individual dose for 0.50 V/m would be 2.975 mA). With further assessment and refinement, our reverse-calculation E-field modeling method, TES MT, or both, could be used as ways to individualize tDCS dosage in order to standardize the experienced E-field at the cortex between participants. A particular advantage of using TES MT is that it is MRI-free and could thus potentially become a cheaper and potentially more accessible method of individually titrating tDCS dose at a desired E-field at the cortical level.
In contrast, we found that a person’s transcranial magnetic stimulation (TMS) MT did not significantly correlate with the theoretical reverse-calculated tDCS dose to produce a 1.00 V/m E-field at the cortex. TES MT is likely a better predictor of reverse-calculated tDCS dose than TMS MT because TES, which applies electricity to the scalp and not magnetic fields, has a more similar mechanism to tDCS (electrical rather than electromagnetic stimulation, with similar electric field tissue resistances with TES and tDCS). Our finding that TMS MT did not correlate with TES MT corroborates the idea that TMS MT may not predict reverse-calculated tDCS dose as well as TES MT due to it having a different mechanism.
There are several takeaway points from this study. First, the wide variability between individualized reverse-calculated tDCS doses at the scalp of 3.75–9.74mA, to produce a 1.00 V/m E-field at the cortex, underscores the possible need to individually dose tDCS to normalize the amount of stimulation that reaches the cortex across individuals. To illustrate the large range of doses, the individual needing the highest reverse-calculated tDCS dose (9.74 mA) in our actual electrode position and size model would need a reverse-calculated tDCS dose that is 260% higher than the individual who needed the lowest reverse-calculated tDCS dose (3.75 mA). Notably, this range of reverse-calculated tDCS dose would affect studies regardless of the E-field threshold used. For instance, if the range of reverse-calculation tDCS doses were instead centered around an average dose of 2.0 mA at the scalp, the needed individualized tDCS dose range would be 1.24–3.23 mA across this sample. With this range, if the average dose of 2.0 mA were applied uniformly (similarly to how a uniform dose is applied in every extant tDCS study), it would underdose individuals needing above 2.0 mA, particularly the person requiring 3.23 mA. Taken in sum, our E-field modeling corroborates the idea that individualized tDCS dose is perhaps needed for more consistent dosing across individuals and studies.
Second, though preliminary and in need of more refinement, our reverse-calculation E-field modeling method can calculate a theoretical dose for each individual to produce a normalized 1.00 V/m E-field at the cortex using ROAST E-field modeling. Measured TES MT was able to estimate 45% of the theoretical reverse-calculated tDCS dose variance across a relatively young and healthy cohort of participants. With further investigation with prospective application and perhaps evaluation of TES MT over the motor cortex compared to other electrode locations and montages, TES MT has the potential to become a possible new, MRI-free method of individually dosing tDCS.
There were some limitations of this study that could be improved with further research. It is still unclear what E-field threshold at the cortex to dose at. While we present reverse-calculation tDCS modeling and TES MT as potential methods of reducing E-field variance at the cortex, further research is needed to refine the E-field magnitude to dose at. In addition, the electrode that was placed on the left deltoid for the TES MT paradigm, was only approximated in the ROAST E-field modeling with the electrode placed on the left neck. This potentially introduced some variance, particularly as muscle tissue was not accounted for in the ROAST tDCS E-field simulations and since placing the cathodal electrode 20 mm above the edge of the scan could have resulted in slightly different relative electrode positions between participants. However, TES MT estimating 45% of the reverse-calculated tDCS dose with a slightly different electrode montage may suggest a potential generalizability of TES MT over the motor cortex to estimate a reverse-calculated tDCS dose with various electrode locations. Perhaps with further evaluation, TES MT could also develop into a method of individually dosing tDCS in other common electrode montages (e.g. F3–F4 for left DLPFC stimulation). Finally, it remains to be seen how these theoretical findings would apply prospectively and further research must be conducted to test the behavioral effects from individualizing dose based on reverse-calculation E-field modeling and/or TES MT.
Conclusions
TES MT and reverse-calculation tDCS electric-field modeling are promising candidate techniques for individually dosing tDCS. In this study, we demonstrated that TES MT can be used to estimate a theoretical reverse-calculated tDCS dose for stimulation to reach the cortex of each individual at 1.00 V/m. Our statistical model comparing TES MT to reverse-calculated tDCS dose was able to individually dose tDCS, estimating 45% of the dose variance in tDCS studies. Moreover, these reverse-calculation models revealed the wide range (i.e. 3.75–9.74 mA) between participants, underscoring the likely need to further develop and evaluate the utility of reverse-calculation E-field modeling and TES MT for dosing tDCS. With further investigation and refinement, reverse-calculation E-field modeling, TES MT, or both could become methods for reducing dose variance at the cortex.
Supplementary Material
Acknowledgments
Financial Support
This study was funded by the National Center of Neuromodulation for Rehabilitation (NC NM4R). The National Center of Neuromodulation for Rehabilitation (NC NM4R) is supported by the Eunice Kennedy Shriver National Institute of Child Health & Human Development of the National Institutes of Health under award number P2CHD086844. This study was partially funded by grants to MB from NIH (NIH-NINDS 1R01NS101362, NIH-NIMH 1R01MH 111896, NIH-NCI U54CA137788/U54CA132378, and NIHNIMH 1R01MH109289).
Footnotes
Declaration of competing interest
Marom Bikson has equity in Soterix Medical. The City University of New York has patents on brain stimulation with Marom Bikson as consultant. Marom Bikson consults for Halo Neuroscience, Boston Scientific, and GSK. We confirm that there are no additional known conflicts of interest associated with this publication and there was no financial support for this work that could have influenced its outcome.
Appendix A. Supplementary data
Supplementary data to this article can be found online at https://doi.org/10.1016/j.brs.2020.04.007.
References
- [1].Meron D, Hedger N, Garner M, Baldwin DS. Transcranial direct current stimulation (tDCS) in the treatment of depression: systematic review and metaanalysis of efficacy and tolerability. Neurosci Biobehav Rev 2015;57:46–62. [DOI] [PubMed] [Google Scholar]
- [2].Fröhlich F, Burrello TN, Mellin JM, Cordle AL, Lustenberger CM, Gilmore JH, et al. Exploratory study of once-daily transcranial direct current stimulation (tDCS) as a treatment for auditory hallucinations in schizophrenia. Eur Psychiatr 2016;33:54–60. [DOI] [PubMed] [Google Scholar]
- [3].Yuan T, Yadollahpour A, Salgado-Ramírez J, Robles-Camarillo D, Ortega-Palacios R. Transcranial direct current stimulation for the treatment of tinnitus: a review of clinical trials and mechanisms of action. BMC Neurosci 2018;19(1):66. [DOI] [PMC free article] [PubMed] [Google Scholar]
- [4].Nitsche MA, Boggio PS, Fregni F, Pascual-Leone A. Treatment of depression with transcranial direct current stimulation (tDCS): a review. Exp Neurol 2009;219(1):14–9. [DOI] [PubMed] [Google Scholar]
- [5].Zaghi S, Heine N, Fregni F. Brain stimulation for the treatment of pain: a review of costs, clinical effects, and mechanisms of treatment for three different central neuromodulatory approaches. J Pain Manag 2009;2(3):339–52. [PMC free article] [PubMed] [Google Scholar]
- [6].Sauvaget A, Tostivint A, Etcheverrigaray F, Pichot A, Dert C, Schirr-Bonnais S, et al. Hospital production cost of transcranial direct current stimulation (tDCS) in the treatment of depression. Neurophysiol Clin Clin Neurophysiol 2019;49(1):11–8. [DOI] [PubMed] [Google Scholar]
- [7].Bikson M, Grossman P, Thomas C, Zannou AL, Jiang J, Adnan T, et al. Safety of transcranial direct current stimulation: evidence based update 2016. Brain Stimul 2016;9(5):641–61. [DOI] [PMC free article] [PubMed] [Google Scholar]
- [8].Dobbs B, Pawlak N, Biagioni M, Agarwal S, Shaw M, Pilloni G, et al. Generalizing remotely supervised transcranial direct current stimulation (tDCS): feasibility and benefit in Parkinson’s disease. J NeuroEng Rehabil 2018;15(1):114. [DOI] [PMC free article] [PubMed] [Google Scholar]
- [9].Kasschau M, Reisner J, Sherman K, Bikson M, Datta A, Charvet LE. Transcranial direct current stimulation is feasible for remotely supervised home delivery in multiple sclerosis. Neuromodulation : J Int Neuromodulation Soc 2016;19(8):824–31. [DOI] [PubMed] [Google Scholar]
- [10].Riggs A, Patel V, Paneri B, Portenoy RK, Bikson M, Knotkova H. At-home transcranial direct current stimulation (tDCS) with telehealth support for symptom control in chronically-ill patients with multiple symptoms. Front Behav Neurosci 2018;12:93. [DOI] [PMC free article] [PubMed] [Google Scholar]
- [11].Nitsche MA, Paulus W. Excitability changes induced in the human motor cortex by weak transcranial direct current stimulation. J Physiol 2000;527(3):633–9. [DOI] [PMC free article] [PubMed] [Google Scholar]
- [12].Horvath JC, Forte JD, Carter O. Evidence that transcranial direct current stimulation (tDCS) generates little-to-no reliable neurophysiologic effect beyond MEP amplitude modulation in healthy human subjects: a systematic review. Neuropsychologia 2015;66:213–36. [DOI] [PubMed] [Google Scholar]
- [13].Horvath JC, Forte JD, Carter O. Quantitative review finds No evidence of cognitive effects in healthy populations from single-session transcranial direct current stimulation (tDCS). Brain Stimul 2015;8(3):535–50. [DOI] [PubMed] [Google Scholar]
- [14].Horvath JC, Carter O, Forte JD. No significant effect of transcranial direct current stimulation (tDCS) found on simple motor reaction time comparing 15 different simulation protocols. Neuropsychologia 2016;91:544–52. [DOI] [PubMed] [Google Scholar]
- [15].Horvath JC, Vogrin SJ, Carter O, Cook MJ, Forte JD. Effects of a common transcranial direct current stimulation (tDCS) protocol on motor evoked potentials found to be highly variable within individuals over 9 testing sessions. Exp Brain Res 2016;234(9):2629–42. [DOI] [PubMed] [Google Scholar]
- [16].Héroux ME, Loo CK, Taylor JL, Gandevia SC. Questionable science and reproducibility in electrical brain stimulation research. PloS One 2017;12(4):e0175635. [DOI] [PMC free article] [PubMed] [Google Scholar]
- [17].Vannorsdall TD, van Steenburgh JJ, Schretlen DJ, Jayatillake R, Skolasky RL, Gordon B. Reproducibility of tDCS results in a randomized trial: failure to replicate findings of tDCS-induced enhancement of verbal fluency. Cognit Behav Neurol Off J Soc Behav Cognit Neurol 2016;29(1):11–7. [DOI] [PubMed] [Google Scholar]
- [18].Koenigs M, Ukueberuwa D, Campion P, Grafman J, Wassermann E. Bilateral frontal transcranial direct current stimulation: failure to replicate classic findings in healthy subjects. Clin Neurophysiol 2009;120(1):80–4. [DOI] [PMC free article] [PubMed] [Google Scholar]
- [19].López-Alonso V, Cheeran B, Río-Rodríguez D, Fernández-del-Olmo M. Inter-individual variability in response to non-invasive brain stimulation paradigms. Brain Stimul 2014;7(3):372–80. [DOI] [PubMed] [Google Scholar]
- [20].López-Alonso V, Fernández-del-Olmo M, Costantini A, Gonzalez-Henriquez JJ, Cheeran B. Intra-individual variability in the response to anodal transcranial direct current stimulation. Clin Neurophysiol 2015;126(12):2342–7. [DOI] [PubMed] [Google Scholar]
- [21].Wiethoff S, Hamada M, Rothwell JC. Variability in response to transcranial direct current stimulation of the motor cortex. Brain Stimul 2014;7(3):468–75. [DOI] [PubMed] [Google Scholar]
- [22].Chew T, Ho K-A, Loo CK. Inter-and intra-individual variability in response to transcranial direct current stimulation (tDCS) at varying current intensities. Brain Stimul 2015;8(6):1130–7. [DOI] [PubMed] [Google Scholar]
- [23].Falcone M, Bernardo L, Wileyto EP, Allenby C, Burke AM, Hamilton R, et al. Lack of effect of transcranial direct current stimulation (tDCS) on short-term smoking cessation: results of a randomized, sham-controlled clinical trial. Drug Alcohol Depend 2019;194:244–51. [DOI] [PMC free article] [PubMed] [Google Scholar]
- [24].Loo CK, Sachdev P, Martin D, Pigot M, Alonzo A, Malhi GS, et al. A double-blind, sham-controlled trial of transcranial direct current stimulation for the treatment of depression. Int J Neuropsychopharmacol 2010;13(1):61–9. [DOI] [PubMed] [Google Scholar]
- [25].Loo CK, Husain MM, McDonald WM, Aaronson S, O’Reardon JP, Alonzo A, et al. International randomized-controlled trial of transcranial Direct Current Stimulation in depression. Brain Stimul 2018;11(1):125–33. [DOI] [PubMed] [Google Scholar]
- [26].Blumberger DM, Tran LC, Fitzgerald PB, Hoy KE, Daskalakis ZJ. A randomized double-blind sham-controlled study of transcranial direct current stimulation for treatment-resistant major depression. Front Psychiatr 2012;3:74. [DOI] [PMC free article] [PubMed] [Google Scholar]
- [27].Rassovsky Y, Dunn W, Wynn JK, Wu AD, Iacoboni M, Hellemann G, et al. Single transcranial direct current stimulation in schizophrenia: randomized, cross-over study of neurocognition, social cognition, ERPs, and side effects. PloS One 2018;13(5):e0197023. [DOI] [PMC free article] [PubMed] [Google Scholar]
- [28].Saleem GT, Ewen JB, Crasta JE, Slomine BS, Cantarero GL, Suskauer SJ. Single-arm, open-label, dose escalation phase I study to evaluate the safety and feasibility of transcranial direct current stimulation with electroencephalography biomarkers in paediatric disorders of consciousness: a study protocol. BMJ open 2019;9(8):e029967. [DOI] [PMC free article] [PubMed] [Google Scholar]
- [29].Dmochowski JP, Datta A, Huang Y, Richardson JD, Bikson M, Fridriksson J, et al. Targeted transcranial direct current stimulation for rehabilitation after stroke. Neuroimage 2013;75:12–9. [DOI] [PMC free article] [PubMed] [Google Scholar]
- [30].Dmochowski JP, Koessler L, Norcia AM, Bikson M, Parra LC. Optimal use of EEG recordings to target active brain areas with transcranial electrical stimulation. Neuroimage 2017;157:69–80. [DOI] [PMC free article] [PubMed] [Google Scholar]
- [31].Cancelli A, Cottone C, Tecchio F, Truong DQ, Dmochowski J, Bikson M. A simple method for EEG guided transcranial electrical stimulation without models. J Neural Eng 2016;13(3):036022. [DOI] [PubMed] [Google Scholar]
- [32].Gebodh N, Esmaeilpour Z, Adair D, Chelette K, Dmochowski J, Woods AJ, et al. Inherent physiological artifacts in EEG during tDCS. Neuroimage 2019;185:408–24. [DOI] [PMC free article] [PubMed] [Google Scholar]
- [33].Evans C, Bachmann C, Lee JS, Gregoriou E, Ward N, Bestmann S. Dose-controlled tDCS reduces electric field intensity variability at a cortical target site. Brain Stimul 2020;13(1):125–36. [DOI] [PubMed] [Google Scholar]
- [34].Dmochowski JP, Datta A, Bikson M, Su Y, Parra LC. Optimized multi-electrode stimulation increases focality and intensity at target. J Neural Eng 2011;8(4):046011. [DOI] [PubMed] [Google Scholar]
- [35].Datta A, Truong D, Minhas P, Parra LC, Bikson M. Inter-individual variation during transcranial direct current stimulation and normalization of dose using MRI-derived computational models. Front Psychiatr 2012;3:91. [DOI] [PMC free article] [PubMed] [Google Scholar]
- [36].Bikson M, Rahman A, Datta A. Computational models of transcranial direct current stimulation. Clin EEG Neurosci 2012;43(3):176–83. [DOI] [PubMed] [Google Scholar]
- [37].Bikson M, Rahman A, Datta A, Fregni F, Merabet L. High-resolution modeling assisted design of customized and individualized transcranial direct current stimulation protocols. Neuromodulation 2012;15(4):306–15. [DOI] [PMC free article] [PubMed] [Google Scholar]
- [38].Labruna L, Jamil A, Fresnoza S, Batsikadze G, Kuo MF, Vanderschelden B, et al. Efficacy of anodal transcranial direct current stimulation is related to sensitivity to transcranial magnetic stimulation. Brain Stimul 2016;9(1):8–15. [DOI] [PMC free article] [PubMed] [Google Scholar]
- [39].Mikkonen M, Laakso I, Sumiya M, Koyama S, Hirata A, Tanaka S. TMS motor thresholds correlate with TDCS electric field strengths in hand motor area. Front Neurosci 2018;12(426). [DOI] [PMC free article] [PubMed] [Google Scholar]
- [40].Badran BW, Ly M, DeVries WH, Glusman CE, Willis A, Pridmore S, et al. Are EMG and visual observation comparable in determining resting motor threshold? A reexamination after twenty years. Brain Stimul Basic Trans Clin Res Neuromodulation 2019;12(2):364–6. [DOI] [PMC free article] [PubMed] [Google Scholar]
- [41].Badran BW, Caulfield KA, Lopez JW, Cox C, Stomberg-Firestein S, DeVries WH, et al. Personalized TMS helmets for quick and reliable TMS administration outside of a laboratory setting. Brain Stimulation: Basic, Translational, and Clinical Research in Neuromodulation; 2020. [DOI] [PMC free article] [PubMed] [Google Scholar]
- [42].Mishory A, Molnar C, Koola J, Li X, Kozel FA, Myrick H, et al. The maximum-likelihood strategy for determining transcranial magnetic stimulation motor threshold, using parameter estimation by sequential testing is faster than conventional methods with similar precision. J ECT 2004;20(3):160–5. [DOI] [PubMed] [Google Scholar]
- [43].Merton PA, Hill DK, Morton HB, Marsden CD. Scope of a technique for electrical stimulation of human brain, spinal cord, and muscle. Lancet 1982;2(8298):597–600. [DOI] [PubMed] [Google Scholar]
- [44].Merton PA, Morton HB. Stimulation of the cerebral cortex in the intact human subject. Nature 1980;285:227. [DOI] [PubMed] [Google Scholar]
- [45].Radman T, Ramos RL, Brumberg JC, Bikson M. Role of cortical cell type and morphology in subthreshold and suprathreshold uniform electric field stimulation in vitro. Brain Stimul 2009;2(4):215–28. e2283. [DOI] [PMC free article] [PubMed] [Google Scholar]
- [46].Seo H, Jun SC. Relation between the electric field and activation of cortical neurons in transcranial electrical stimulation. Brain Stimul 2019;12(2):275–89. [DOI] [PubMed] [Google Scholar]
- [47].Reato D, Rahman A, Bikson M, Parra LC. Low-intensity electrical stimulation affects network dynamics by modulating population rate and spike timing. J Neurosci 2010;30(45):15067–79. [DOI] [PMC free article] [PubMed] [Google Scholar]
- [48].Chakraborty D, Truong DQ, Bikson M, Kaphzan H. Neuromodulation of axon terminals. Cerebr Cortex 2018;28(8):2786–94. [DOI] [PMC free article] [PubMed] [Google Scholar]
- [49].Monai H, Hirase H. Astrocytes as a target of transcranial direct current stimulation (tDCS) to treat depression. Neurosci Res 2018;126:15–21. [DOI] [PubMed] [Google Scholar]
- [50].Cancel LM, Arias K, Bikson M, Tarbell JM. Direct current stimulation of endothelial monolayers induces a transient and reversible increase in transport due to the electroosmotic effect. Sci Rep 2018;8(1):9265. [DOI] [PMC free article] [PubMed] [Google Scholar]
- [51].Krause MR, Vieira PG, Csorba BA, Pilly PK, Pack CC. Transcranial alternating current stimulation entrains single-neuron activity in the primate brain. Proc Natl Acad Sci U S A 2019;116(12):5747–55. [DOI] [PMC free article] [PubMed] [Google Scholar]
- [52].Datta A, Krause MR, Pilly PK, Choe J, Zanos TP, Thomas C, et al. On comparing in vivo intracranial recordings in non-human primates to predictions of optimized transcranial electrical stimulation. Conf Proc IEEE Eng Med Biol Soc 2016;2016:1774–7. [DOI] [PubMed] [Google Scholar]
- [53].Mishima T, Nagai T, Yahagi K, Akther S, Oe Y, Monai H, et al. Transcranial direct current stimulation (tDCS) induces adrenergic receptor-dependent microglial morphological changes in mice. eNeuro 2019;6(5). [DOI] [PMC free article] [PubMed] [Google Scholar]
- [54].Yu TH, Wu YJ, Chien ME, Hsu KS. Transcranial direct current stimulation induces hippocampal metaplasticity mediated by brain-derived neurotrophic factor. Neuropharmacology 2019;144:358–67. [DOI] [PubMed] [Google Scholar]
- [55].Liu A, Voroslakos M, Kronberg G, Henin S, Krause MR, Huang Y, et al. Immediate neurophysiological effects of transcranial electrical stimulation. Nat Commun 2018;9(1):5092. [DOI] [PMC free article] [PubMed] [Google Scholar]
- [56].Francis JT, Gluckman BJ, Schiff SJ. Sensitivity of neurons to weak electric fields. J Neurosci 2003;23(19):7255–61. [DOI] [PMC free article] [PubMed] [Google Scholar]
- [57].Vöröslakos M, Takeuchi Y, Brinyiczki K, Zombori T, Oliva A, Fernández-Ruiz A, et al. Direct effects of transcranial electric stimulation on brain circuits in rats and humans. Nat Commun 2018;9(1):483. [DOI] [PMC free article] [PubMed] [Google Scholar]
- [58].Esmaeilpour Z, Marangolo P, Hampstead BM, Bestmann S, Galletta E, Knotkova H, et al. Incomplete evidence that increasing current intensity of tDCS boosts outcomes. Brain Stimul 2018;11(2):310–21. [DOI] [PMC free article] [PubMed] [Google Scholar]
- [59].Jamil A, Batsikadze G, Kuo HI, Labruna L, Hasan A, Paulus W, et al. Systematic evaluation of the impact of stimulation intensity on neuroplastic after-effects induced by transcranial direct current stimulation. J Physiol 2017;595(4):1273–88. [DOI] [PMC free article] [PubMed] [Google Scholar]
- [60].Kidgell DJ, Daly RM, Young K, Lum J, Tooley G, Jaberzadeh S, et al. Different current intensities of anodal transcranial direct current stimulation do not differentially modulate motor cortex plasticity. Neural Plast 2013;2013. [DOI] [PMC free article] [PubMed] [Google Scholar]
- [61].Batsikadze G, Moliadze V, Paulus W, Kuo MF, Nitsche M. Partially non-linear stimulation intensity-dependent effects of direct current stimulation on motor cortex excitability in humans. J Physiol 2013;591(7):1987–2000. [DOI] [PMC free article] [PubMed] [Google Scholar]
- [62].Fresnoza S, Paulus W, Nitsche MA, Kuo MF. Nonlinear dose-dependent impact of D1 receptor activation on motor cortex plasticity in humans. J Neurosci 2014;34(7):2744–53. [DOI] [PMC free article] [PubMed] [Google Scholar]
- [63].Shekhawat GS, Vanneste S. Optimization of transcranial direct current stimulation of dorsolateral prefrontal cortex for tinnitus: a non-linear dose-response effect. Sci Rep 2018;8(1):8311. [DOI] [PMC free article] [PubMed] [Google Scholar]
- [64].Shekhawat GS, Stinear CM, Searchfield GD. Transcranial direct current stimulation intensity and duration effects on tinnitus suppression. Neurorehabilitation Neural Repair 2013;27(2):164–72. [DOI] [PubMed] [Google Scholar]
- [65].Hoy KE, Emonson MR, Arnold SL, Thomson RH, Daskalakis ZJ, Fitzgerald PB. Testing the limits: investigating the effect of tDCS dose on working memory enhancement in healthy controls. Neuropsychologia 2013;51(9):1777–84. [DOI] [PubMed] [Google Scholar]
- [66].Folmli B, Turman B, Johnson P, Abbott A. Dose response of somatosensory cortex repeated anodal transcranial direct current stimulation on vibrotactile detection: a randomized sham-controlled trial. J Neurophysiol 2018;120(2):610–6. [DOI] [PubMed] [Google Scholar]
- [67].Alonzo A, Brassil J, Taylor JL, Martin D, Loo CK. Daily transcranial direct current stimulation (tDCS) leads to greater increases in cortical excitability than second daily transcranial direct current stimulation. Brain Stimul 2012;5(3):208–13. [DOI] [PubMed] [Google Scholar]
- [68].Chhatbar PY, Ramakrishnan V, Kautz S, George MS, Adams RJ, Feng W. Transcranial direct current stimulation post-stroke upper extremity motor recovery studies exhibit a dose-response relationship. Brain Stimul 2016;9(1):16–26. [DOI] [PMC free article] [PubMed] [Google Scholar]
- [69].Nikolin S, Martin D, Loo CK, Boonstra TW. Effects of TDCS dosage on working memory in healthy participants. Brain Stimul 2018;11(3):518–27. [DOI] [PubMed] [Google Scholar]
- [70].Hoy KE, Arnold SL, Emonson MR, Daskalakis ZJ, Fitzgerald PB. An investigation into the effects of tDCS dose on cognitive performance over time in patients with schizophrenia. Schizophr Res 2014;155(1–3):96–100. [DOI] [PubMed] [Google Scholar]
- [71].Jamil A, Batsikadze G, Kuo HI, Meesen R, Dechent P, Paulus W, et al. Current intensity- and polarity-specific online and aftereffects of transcranial direct current stimulation: an fMRI study. Hum Brain Mapp 2019;41(6):1644–66. [DOI] [PMC free article] [PubMed] [Google Scholar]
- [72].Cuypers K, Leenus DJF, van den Berg FE, Nitsche MA, Thijs H, Wenderoth N, et al. Is motor learning mediated by tDCS intensity? PloS One 2013;8(6). e67344–e. [DOI] [PMC free article] [PubMed] [Google Scholar]
- [73].Boggio PS, Ferrucci R, Rigonatti SP, Covre P, Nitsche M, Pascual-Leone A, et al. Effects of transcranial direct current stimulation on working memory in patients with Parkinson’s disease. J Neurol Sci 2006;249(1):31–8. [DOI] [PubMed] [Google Scholar]
- [74].Huang Y, Liu AA, Lafon B, Friedman D, Dayan M, Wang X, et al. Measurements and models of electric fields in the in vivo human brain during transcranial electric stimulation. eLife 2017;6. [DOI] [PMC free article] [PubMed] [Google Scholar]
- [75].Huang Y, Datta A, Bikson M, Parra LC. ROAST: an open-source, fully-automated, realistic volumetric-approach-based simulator for TES. Conf Proc IEEE Eng Med Biol Soc 2018;2018:3072–5. [DOI] [PubMed] [Google Scholar]
- [76].Puonti O, Saturnino GB, Madsen KH, Thielscher A. Value and limitations of intracranial recordings for validating electric field modeling for transcranial brain stimulation. Neuroimage 2019;208:116431. [DOI] [PubMed] [Google Scholar]
- [77].Huang Y, Dmochowski JP, Su Y, Datta A, Rorden C, Parra LC. Automated MRI segmentation for individualized modeling of current flow in the human head. J Neural Eng 2013;10(6):066004. [DOI] [PMC free article] [PubMed] [Google Scholar]
- [78].Huang Y, Datta A, Bikson M, Parra LC. Realistic volumetric-approach to simulate transcranial electric stimulation—ROAST—a fully automated open-source pipeline. J Neural Eng 2019;16(5):056006. [DOI] [PMC free article] [PubMed] [Google Scholar]
- [79].Tetrahedral mesh generation from volumetric binary and grayscale images. In: Fang Q, Boas DA, editors. 2009 IEEE international symposium on biomedical imaging: from nano to macro. Ieee; 2009. [Google Scholar]
- [80].Dular P, Geuzaine C, Henrotte F, Legros W. A general environment for the treatment of discrete problems and its application to the finite element method. IEEE Trans Magn 1998;34(5):3395–8. [Google Scholar]
Associated Data
This section collects any data citations, data availability statements, or supplementary materials included in this article.