Abstract
Real-time quantitative PCR (RT-qPCR) has been widely applied in uncovering disease mechanisms and screening potential biomarkers. Internal reference gene selection determines the accuracy and reproducibility of data analyses. The aim of this study was to identify the optimal reference genes for the relative quantitative analysis of RT-qPCR in fourteen NF1 related cell lines, including non-tumor, benign and malignant Schwann cell lines. The expression characteristics of eleven candidate reference genes (RPS18, ACTB, B2M, GAPDH, PPIA, HPRT1, TBP, UBC, RPLP0, TFRC and RPL32) were screened and analyzed by four software programs: geNorm, NormFinder, BestKeeper and RefFinder. Results showed that GAPDH, the most frequently used internal reference gene, was significantly unstable between various cell lines. The combinational use of two reference genes (PPIA and TBP) was optimal in malignant Schwann cell lines and the use of single reference genes (PPIA or PRLP0) alone or in combination was optimal in benign Schwann cell lines. These recommended internal reference gene selections may improve the accuracy and reproducibility of RT-qPCR in gene expression analyses of NF1 related tumors.
Introduction
Neurofibromatosis type 1 (NF1) is an autosomal dominant tumor predisposition syndrome that affects multiple organ systems and has a wide range of variable clinical manifestations, such as pigmentary lesions, skeletal abnormalities [1–3]. The major defining features in NF1 patients are peripheral nerve sheath tumors, including plexiform neurofibromas (pNF) and malignant peripheral nerve sheath tumors (MPNST) [4]. Therefore, the majority of NF1 related tumor researches could be categorized into benign tumor studies or malignant tumor studies.
Currently, Omics studies play an increasingly important role in uncovering disease mechanisms and screening potential therapeutic biomarkers. Among different omics studies, transcriptomics is the bridge between genomics and proteomics, which could provide deep and precise measurements of transcriptional levels. Several studies have been conducted to figure out the molecular mechanisms of NF1 and to advance the development of targeted drugs [5–7]. These high-throughput results need further validation by RT-qPCR, which is considered as the gold standard for gene expression studies. However, the accuracy and reproducibility of RT-qPCR results may be affected by several factors at multiple stages. In the term of data analysis, the stability of reference genes is critical for appropriate standardization and obtaining accurate gene expression data. The Minimum Information for Publication of Quantitative Real-Time PCR experiments (MIQE) guidelines highlight the importance of experimental validation of reference genes for particular tissues or cell types [8–11]. Previously, Maertens et al [12] identified TBP, HPRT1 and HMBS as reliable reference genes for nerve and neurofibroma derived Schwann cells by geNorm analysis. However, there is no comprehensive and systematic validation of suitable reference genes for the relative quantification analysis of target gene expression in NF1 related peripheral nerve sheath tumor-derived cell lines.
In the present study, eleven candidate reference genes were selected, including 18S Ribosomal RNA (RPS18), β-actin (ACTB), β-2-microglobulin (B2M), Glyceraldehyde-3-phosphate dehydrogenase (GAPDH), Peptidylprolyl isomerase A (PPIA), Hypoxanthine phosphoribosyltransferase 1 (HPRT1), TATA binding protein (TBP), Ubiquitin C (UBC), Ribosomal protein large P0 (RPLP0), Transferrin receptor (P90, CD71) (TFRC), and Ribosomal protein 32 (RPL32). These genes were the most frequently used for relative quantification analysis in other neoplastic diseases [13–17].
We investigated the stability of these eleven reference genes in fourteen different NF1 related cell lines, including two non-tumor NF1+/- Schwann cell lines, five benign pNF cell lines and seven malignant MPNST cell lines. We analyzed the data obtained as two separate groups: (1) benign NF1 tumor study including Schwann cell (SC) + pNF cell lines and (2) malignant NF1 tumor study including SC + pNF + MPNST cell lines, aiming to identify the most qualified reference genes for gene expression analysis in benign and malignant NF1 tumor study respectively.
Materials and methods
Neurofibromatosis type 1 (NF1) related cell lines
Five MPNST cell lines (ST-8814, STS26T, S462, S462TY, T265) were generous gifts from Dr.Vincent W Keng (Department of Applied Biology and Chemical Technology, The Hong Kong Polytechnic University, Kowloon, Hong Kong) and Jilong Yang (International Medical School, Tianjin Medical University, Tianjin). pNF cell line A68 was derived from a surgically excised pNF specimen of a 51-year-old female with NF1. pNF cell line WZJ was derived from a surgically excised pNF specimen of a 12-year-old boy with NF1. These two pNF cell lines were immortalized as described previously [18]. Ethics Committee of Shanghai Ninth People’s Hospital, Shanghai Jiao Tong University School of Medicine approved this study. Informed consent was achieved from patients under institutional reviewer board protocols. hTERT NF1 ipNF05.5 (ATCC® CRL3388™), hTERT NF1 ipNF95.6 (ATCC® CRL3389™), hTERT NF1 ipNF95.11b (ATCC® CRL3390™), hTERT NF1 ipnNF95.11c (ATCC® CRL3391™), hTERT NF1 ipn02.3 2λ (ATCC® CRL3392 ™), sNF96.2 (ATCC® CRL2884 ™) and sNF02.2 (ATCC® CRL2885 ™) were obtained from the American Type Culture Collection (ATCC). All the cell lines used in this study were cultivated in Dulbecco’s Modified Eagle Medium (DMEM) supplemented with 10% fetal bovine serum (FBS) and 1% penicillin/streptomycin at 37°C in a humidified incubator at 5% CO2 and were confirmed negative for mycoplasma prior to use. Verification of cell lines was performed by Short Tandem Repeat (STR) DNA profiling (Applied Biological Materials Inc, Canada).
Total RNA extraction and cDNA synthesis
Total RNA was extracted from all NF1 related cell lines using AxyPrep Multisource RNA Miniprep Kit (Axygen, USA) according to the manufacturer’s instructions. The quality and quantity of RNA were measured using a NanoDrop 2000 Spectrophotometer (Thermo Scientific, Waltham, MA, USA) through OD260/280 and OD260/230 ratios. 500 ng of total RNA was used for the cDNA synthesis reaction using PrimeScript™ RT Master Mix kit (TaKaRa RR036A) according to the manufacturer’s instructions. After the reaction, the cDNA was diluted to 20 ng/ml. All RT-qPCR experiments were performed with the same batch of cDNA.
RT-qPCR
Reference gene primers were designed and synthesized by Sangon Biotech (Shanghai, China). The efficiency, dynamic range and specificity of all primers were tested by Sangon Biotech (Shanghai, China). RT-qPCR was performed using TB Green® Premix Ex Taq™ Kit (TaKaRa RR420A) on an Applied Biosystems 7500 Real-Time PCR System, as described previously [19]. Each sample was measured in three technical replicates. The relative quantification of RT-qPCR data were calculated using the 2−ΔΔCT method, as described previously [8].
Statistical analysis
The stability of the eleven candidate reference genes was examined by four frequently used software programs, geNorm [20], NormFinder [21] BestKeeper [22] and RefFinder [23], as described previously [24–27].
Results
The expression characteristics of eleven internal reference gene candidates
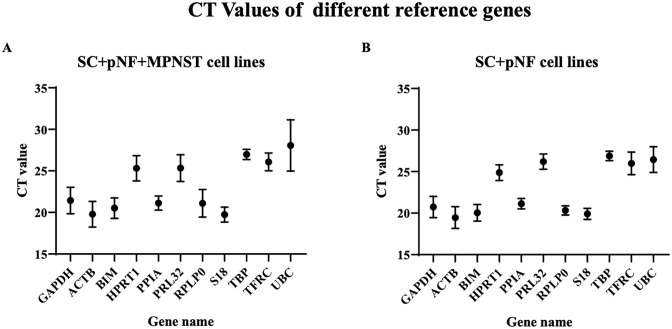
The threshold cycle (Ct) value was used to assess the expression characteristics of the internal reference gene candidates. Higher Ct values indicate lower expression levels. The distribution of the Ct values of eleven reference genes in fourteen samples, including two NF1+/- Schwann cell lines, five plexiform neurofibroma cell lines and seven MPNST cell lines was displayed in Fig 1. The Ct values represented in this research from all samples ranged from 18.09 to 43.65. It is worth noting that UBC showed significantly higher Ct values in MPNST samples compared to other samples, suggesting lower mRNA expression level.
Fig 1. Ct values of the candidate internal reference genes.
Dots represent the mean Ct value; bars represent the mean ± standard deviation. (A) Ct values of each candidate internal reference gene in NF1+/- SC, NF1-/- pNF and MPNST cell lines (n = 14). (B) Ct values of each candidate internal reference gene in SC and pNF cell lines (n = 7). SC, Schwann cell; pNF, plexiform neurofibroma; MPNST, malignant peripheral nerve sheath tumor.
Genorm analysis
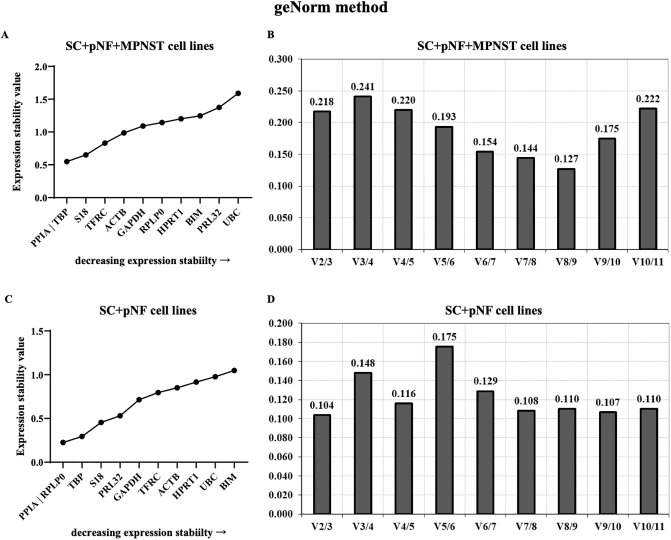
In order to identify the best reference genes for benign and malignant NF1 tumor study, we applied four statistical approaches including geNorm, NormFinder, BestKeeper and ΔCt method. The M value of eleven reference genes were calculated and ranked by genorm. The genorm system identifies those genes with the lowest M values as the most stably expressed genes and an M value under 0.5 represents relatively stable gene expression. GeNorm analysis showed that PPIA and TBP, sharing an M value of 0.549, were the most stable reference genes in SC + pNF + MPNST cell lines (Fig 2). However, when only considering SC + pNF cell lines, the most stable genes were PPIA and PRLP, with an M value of 0.225, followed by TBP and S18 (M value, 0.295 and 0.454, respectively). The optimal number of reference genes to obtain a stable normalization index was demonstrated by V-values. When SC + pNF + MPNST cell lines were considered, the V8/9 value was 0.127, indicating that eight reference genes combination is optimal for RT-qPCR normalization. In SC + pNF cell lines, the V2/3 value was 0.104, suggesting that merely two reference genes were necessary. And the V8/9 value was lower than 0.110 in this group, of which the V values kept stable in different subsets.
Fig 2. Analysis results of geNorm program.
The expression stability of eleven candidate genes in SC + pNF + MPNST subset (A) and SC + pNF subset (C) was calculated and ranked separately. The x-axis represents various candidate reference genes, and the y-axis represents stability value (M value). Lower M value suggests higher expression stability. B and D show the optimal number of reference genes in different subsets. The x-axis represents the number of genes selected for comprehensive analysis V (n/n+1), and the y-axis means the pairwise variation value (V value). When V value is under 0.15, the corresponding combination is esteemed stable and n is the best number of internal reference genes. SC, Schwann cell; pNF, plexiform neurofibroma; MPNST, malignant peripheral nerve sheath tumor.
NormFinder analysis
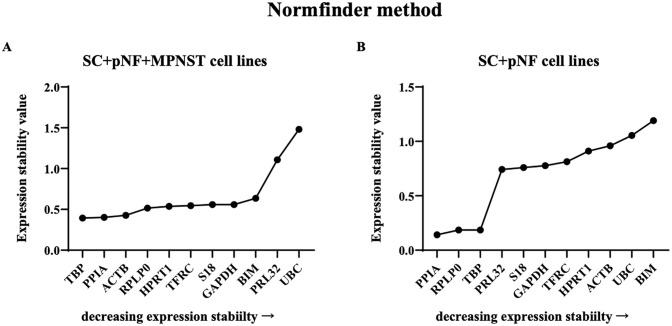
Eleven reference genes underwent normalization factor calculation and were ranked by NormFinder according to their minimal combined SC, pNF and MPNST gene expression variation. According to the result, TBP was the optimal reference gene (stability value, 0.394), followed by PPIA, ACTB and GAPDH (stability values, 0.403, 0.427 and 0559 respectively) (Fig 3). The best combination of two genes are GAPDH and S18 with a combination stability value of 0.150. For SC + pNF cell lines, PPIA, RPLP and TBP were the most stably expressed genes (stability values, 0.142, 0.185 and 0.186 respectively), while the rest ones were extremely unstable amongst those cell lines.
Fig 3. Analysis results of NormFinder program.
The x-axis represents various candidate reference genes, and the y-axis represents stability value. (A) The stability value of each candidate internal reference gene in SC + pNF + MPNST subset (n = 14). (B) The stability value of each candidate internal reference gene in SC + pNF subset (n = 7). SC, Schwann cell; pNF, plexiform neurofibroma; MPNST, malignant peripheral nerve sheath tumor.
Best keeper analysis
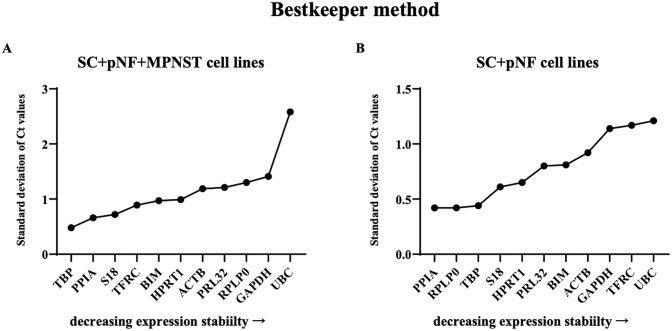
In best keeper algorithm, the Ct values, SD (standard deviation) and CV (coefficient of variance) of each gene were calculated and analyzed to identify stable reference gene candidates. Under general conditions, genes with a SD greater than 1.0 are determined to be unstable. Among SC + pNF + MPNST cell lines, TBP turned out to be the best choice with a standard deviation [+/- CP] (which is the stability value in best keeper algorithm) of 0.48 (Fig 4). The stability value of TBP kept stable (0.44) when it came to SC + pNF cell lines. However, RPLP and PPIA were esteemed as more stable genes, sharing a stability value of 0.42.
Fig 4. Analysis results of BestKeeper program.
The x-axis represents various candidate reference genes, and the y-axis represents stability value. (A) The stability value of each candidate internal reference gene in SC + pNF + MPNST subset (n = 14). (B) The stability value of each candidate internal reference gene in SC + pNF subset (n = 7). SC, Schwann cell; pNF, plexiform neurofibroma; MPNST, malignant peripheral nerve sheath tumor.
ΔCt analysis
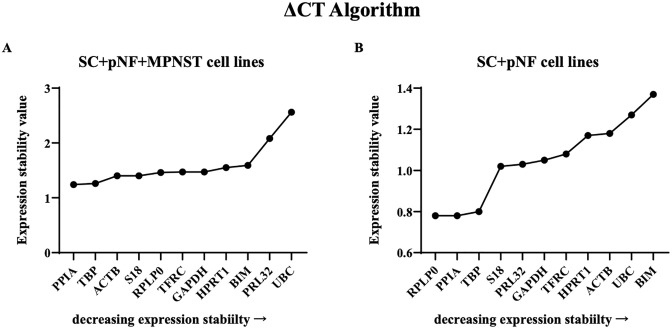
In ΔCt method, the differential expression of “gene pairs” were analyzed to determine the optimal reference genes. According to the results, PPIA (1.24) and TBP (1.26) were the most stably expressed reference genes in SC + pNF + MPNST cell lines (Fig 5). While RPLP (0.78) was far more stable in SC + pNF cell lines.
Fig 5. Analysis results of ΔCt algorithm.
The x-axis represents various candidate reference genes, and the y-axis represents stability value. (A) The stability value of each candidate internal reference gene in SC + pNF + MPNST subset (n = 14). (B) The stability value of each candidate internal reference gene in SC + pNF subset (n = 7). SC, Schwann cell; pNF, plexiform neurofibroma; MPNST, malignant peripheral nerve sheath tumor.
Comprehensive ranking order
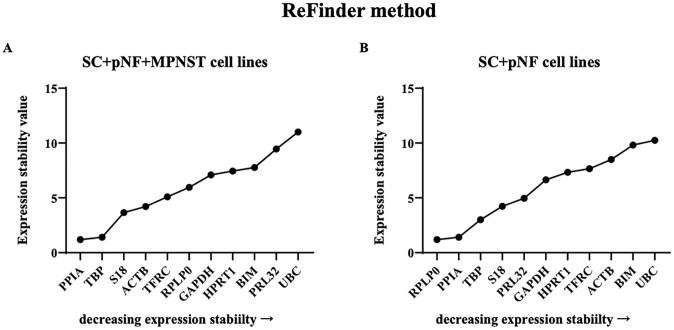
Using RefFinder, we integrated four analysis approaches mentioned above to comprehensively evaluate the expression stability of these candidate genes. PPIA turned out to be the optimal reference gene in SC + pNF + MPNST cell lines with a ranking value of 1.19, followed by TBP and S18 (ranking value, 1.41 and 3.66, respectively) (Fig 6). And PRLP (1.19) was the most stably expressed in SC + pNF cell lines.
Fig 6. Analysis results of ReFinder program.
The x-axis represents various candidate reference genes, and the y-axis represents stability value. (A) The stability value of each candidate internal reference gene in SC + pNF + MPNST subset (n = 14). (B) The stability value of each candidate internal reference gene in SC + pNF subset (n = 7). SC, Schwann cell; pNF, plexiform neurofibroma; MPNST, malignant peripheral nerve sheath tumor.
Discussion
RT-qPCR was extensively applied in identifying key pathogenic genes in various diseases, for RT-qPCR is considered as the golden standard for gene expression analysis due to its accuracy and sensitivity [28]. It is also a robust and specific method for the validation of the pathogenic genes that aberrantly expressed in neurofibroma.
The ease to generate RT-qPCR data is in sharp contrast to the challenges to guarantee that the results obtained are reliable. In the absence of proper reference genes, data obtained are possibly inaccurate and irreproducible, as it has been shown that the use of a single reference gene without validation results in a significant bias (ranging from 3-fold in 25% of the results up to 6-fold in 10% of the results) [20].
Prior to this study, there is no comprehensive and systematic validation of suitable reference genes for the relative quantification analysis of target gene expression in NF1 related peripheral nerve sheath tumor-derived cell lines. In previous studies, GAPDH and ACTB have been most frequently used in gene expression analysis of NF1 without solid validation [29–31]. However, the expression characteristics of reference genes fluctuate remarkably, influenced by different experimental conditions and samples. The use of GAPDH and ACTB as internal controls has been proven to be unsuitable in other samples, such as lymphoblastoid cell lines and human mesenchymal stem cells [32–34]. Therefore, it is crucial to confirm reliable and qualified reference genes for particular tissues or cell types and specific experimental designs.
In our study, in order to find the internal reference genes stably expressed in different NF1 samples, we investigated fourteen different NF1 related cell lines, which include two non-tumor NF1+/- Schwann cell lines, five pNF cell lines and seven MPNST cell lines. The expression stability of eleven frequently used reference genes, including RPS18, ACTB, B2M, GAPDH, PPIA, HPRT1, TBP, UBC, RPLP0, TFRC, and RPL32 were investigated and analyzed separately in these cell lines.
Four different mathematical and statistical models were utilized to analyze the data obtained, including geNorm, NormFinder, BestKeeper and ΔCt. Different algorithms were applied to estimate both the intra- and the intergroup expression variations and rank candidate genes based on the instability score. GeNorm and NormFinder calculate the stability (actually instability) value, ΔCt uses the average of S.D. and BestKeeper uses the S.D. of the crossing points [20–22]. In addition, A web-based tool RefFinder was used to evaluate the stability of candidate reference genes and identify the most stable gene by calculating the geometric mean of ranking values obtained from the above-mentioned four methods [23].
Due to the fact that the software applied are based on different mathematical models, the ranking orders of reference gene stabilities varied slightly among these tools. However, the top two positions of reference genes in SC + pNF group and SC + pNF + MPNST group determined by geNorm were identical to those determined by NormFinder, BestKeeper and ΔCt, indicating the consistency of these statistical models and the reliability of the results. According to the results of RefFinder, the same conclusion can be drawn that PPIA and PRLP0 are the best reference genes for normalization in benign NF1 tumor study, while PPIA and TBP are as well in malignant NF1 tumor study.
PPIA is a gene encoding for a cyclosporin binding-protein, TBP is a gene encoding for a TATA-binding protein, and PRLP0 encodes a ribosomal protein that is a component of the 60S subunit. In NF1 related Schwann cell lines, they were stably expressed irrespective of tumor pathology and severity. In a previous study, TBP was also proven to be a stable reference gene in Schwann cells derived from neurofibromas [12]. However, the most frequently used reference gene GAPDH was proved to be an inappropriate option in two groups (M values > 0.5). As a multifunctional gene, the use of GAPDH as a reference gene has been also questioned and challenged in other cancers including lung cancer [35], breast cancer [36] and bladder cancer [37]. Accumulated evidences indicate that GAPDH is deregulated in various cancers under certain conditions and potentially participates in tumorigenesis and tumor progression [35–39].
In addition, considering the difference of opinion on the minimal number of reference genes required for RT-qPCR, we explored the necessity of selecting multiple reference genes for data normalization in our samples. In previous studies, some investigators showed that the combination of more than one reference gene improved the accuracy of results [15,20,40–42] while other investigators proved that normalization with a single gene is sufficient for most research applications [13,37,43,44]. In the present study, according to the analyses of geNorm, combination of eight reference genes is the most precise plan for normalization in SC + pNF + MPNST group. However, considering the stability and precision of using two reference genes in combination is sufficient for data normalization, we suggest using a normalization factor calculated by the geometrical mean of the most stable reference genes (PPIA and TBP) for normalization of target gene expression in SC + pNF + MPNST group [45]. What’s more, it is worth noting that the use of single reference gene, with a M-value over 0.5, should be avoided in these samples. In SC + pNF group, although the combination of two reference genes significantly improved precision over normalization with PPIA or PRLP0 alone, the use of single reference genes (PPIA or PRLP0), sharing an M value of 0.225, is acceptable for data normalization. In contrast, Maertens et al suggested that the combination of three reference genes (TBP, HPRT1, and HMBS) was the optimal choice for normalization by using the geNorm software [12]. The discrepancy between our results was possibly caused by the difference of the cell models analyzed. In their study, three patient-derived Schwann cell lines were included. Therefore, it is necessary to verify the reference genes recommended in specific experimental conditions, as the stability of reference genes can be influenced by many factors.
Limitations existed in this study that only SC, pNF and MPNST cells were used to identify the most stable reference genes. whether these reference genes are also applicative to normalize RT-qPCR experiments using tumors containing a more complex cellular composition, such as cutaneous, plexiform and atypical neurofibromas, or MPNST tumors still needs experimental verification.
Conclusions
In this study, we systematically explored the suitability of fourteen candidate reference genes for normalization of gene expression in different NF1 related cell lines, including non-tumor NF1+/- Schwann cell lines, pNF cell lines and MPNST cell lines. According to the results, we recommend using two reference genes (PPIA and TBP) in combination for gene expression analyses in MPNST cell line-based researches and using single reference genes (PPIA or PRLP0) alone or in combination in pNF cell line-based studies.
Supporting information
(XLS)
Agarose gel electrophoresis of RT-qPCR amplification products for each of the internal reference genes provided by Sangon (M: Sangon DNA Marker {B600335}).
(TIFF)
The expression levels of eleven candidate reference genes (RPS18, ACTB, B2M, GAPDH, PPIA, HPRT1, TBP, UBC, RPLP0, TFRC and RPL32) in fourteen NF1 related cell lines.
(XLSX)
(XLS)
(PDF)
(XLSX)
Acknowledgments
Grateful acknowledgment is made to Prof. Jilong Yang and Prof. Vincent Keng, who kindly granted MPNST cell lines.
Data Availability
All relevant data are within the paper and its Supporting information files.
Funding Statement
ZC W, QC201803, Shanghai Ninth People’s Hospital, Shanghai Jiao Tong University School of Medicine, http://www.9hospital.com.cn/djy_web/html/djy/portal/index/index.htm; QF L, YBKA201901, Shanghai Ninth People’s Hospital, Shanghai Jiao Tong University School of Medicine, http://www.9hospital.com.cn/djy_web/html/djy/portal/index/index.htm; ZC W, 201809004, Shanghai Municipal People’s Government, http://english.shanghai.gov.cn/nw46669/index.html; ZC W, 19CG18, Shanghai Education Development Foundation and Shanghai Municipal Education Commission, http://www.shedf.org.cn/, http://edu.sh.gov.cn/; QF L, 19JC1413, Science and Technology Commission of Shanghai Municipality, http://stcsm.sh.gov.cn/; ZC W, 20QA1405600, Science and Technology Commission of Shanghai Municipality, http://stcsm.sh.gov.cn/; The funders had no role in study design, data collection and analysis, decision to publish, or preparation of the manuscript.
References
- 1.Gutmann DH, Ferner RE, Listernick RH, Korf BR, Wolters PL, Johnson KJ. Neurofibromatosis type 1. Nature Reviews Disease Primers. 2017;3(1). 10.1038/nrdp.2017.4 [DOI] [PubMed] [Google Scholar]
- 2.Stevenson DA, Zhou H, Ashrafi S, Messiaen LM, Carey JC, D’Astous JL, et al. Double inactivation of NF1 in tibial pseudarthrosis. Am J Hum Genet. 2006;79(1):143–8. Epub 2006/06/15. 10.1086/504441 [DOI] [PMC free article] [PubMed] [Google Scholar]
- 3.De Schepper S, Maertens O, Callens T, Naeyaert JM, Lambert J, Messiaen L. Somatic mutation analysis in NF1 cafe au lait spots reveals two NF1 hits in the melanocytes. J Invest Dermatol. 2008;128(4):1050–3. Epub 2007/10/05. 10.1038/sj.jid.5701095 . [DOI] [PubMed] [Google Scholar]
- 4.Ariel IM. Tumors of the peripheral nervous system. Semin Surg Oncol. 1988;4(1):7–12. Epub 1988/01/01. 10.1002/ssu.2980040104 . [DOI] [PubMed] [Google Scholar]
- 5.Solga AC, Pong WW, Kim KY, Cimino PJ, Toonen JA, Walker J, et al. RNA Sequencing of Tumor-Associated Microglia Reveals Ccl5 as a Stromal Chemokine Critical for Neurofibromatosis-1 Glioma Growth. Neoplasia. 2015;17(10):776–88. Epub 2015/11/21. 10.1016/j.neo.2015.10.002 [DOI] [PMC free article] [PubMed] [Google Scholar]
- 6.Kohlmeyer JL, Kaemmer CA, Pulliam C, Maharjan CK, Samayoa AM, Major HJ, et al. RABL6A Is an Essential Driver of MPNSTs that Negatively Regulates the RB1 Pathway and Sensitizes Tumor Cells to CDK4/6 Inhibitors. Clin Cancer Res. 2020;26(12):2997–3011. Epub 2020/02/23. 10.1158/1078-0432.CCR-19-2706 [DOI] [PMC free article] [PubMed] [Google Scholar]
- 7.Cui Z, Shen Y, Chen KH, Mittal SK, Yang JY, Zhang G. KANK1 inhibits cell growth by inducing apoptosis through regulating CXXC5 in human malignant peripheral nerve sheath tumors. Sci Rep. 2017;7:40325. Epub 2017/01/10. 10.1038/srep40325 [DOI] [PMC free article] [PubMed] [Google Scholar]
- 8.Livak KJ, Schmittgen TD. Analysis of relative gene expression data using real-time quantitative PCR and the 2(-Delta Delta C(T)) Method. Methods. 2001;25(4):402–8. Epub 2002/02/16. 10.1006/meth.2001.1262 . [DOI] [PubMed] [Google Scholar]
- 9.Huggett J, Dheda K, Bustin S, Zumla A. Real-time RT-PCR normalisation; strategies and considerations. Genes Immun. 2005;6(4):279–84. Epub 2005/04/09. 10.1038/sj.gene.6364190 . [DOI] [PubMed] [Google Scholar]
- 10.Bustin SA, Benes V, Garson JA, Hellemans J, Huggett J, Kubista M, et al. The MIQE guidelines: minimum information for publication of quantitative real-time PCR experiments. Clin Chem. 2009;55(4):611–22. Epub 2009/02/28. 10.1373/clinchem.2008.112797 . [DOI] [PubMed] [Google Scholar]
- 11.Kozera B, Rapacz M. Reference genes in real-time PCR. J Appl Genet. 2013;54(4):391–406. Epub 2013/10/01. 10.1007/s13353-013-0173-x [DOI] [PMC free article] [PubMed] [Google Scholar]
- 12.Maertens O, Brems H, Vandesompele J, De Raedt T, Heyns I, Rosenbaum T, et al. Comprehensive NF1 screening on cultured Schwann cells from neurofibromas. Hum Mutat. 2006;27(10):1030–40. Epub 2006/08/31. 10.1002/humu.20389 . [DOI] [PubMed] [Google Scholar]
- 13.Kriegova E, Arakelyan A, Fillerova R, Zatloukal J, Mrazek F, Navratilova Z, et al. PSMB2 and RPL32 are suitable denominators to normalize gene expression profiles in bronchoalveolar cells. BMC Mol Biol. 2008;9:69. Epub 2008/08/02. 10.1186/1471-2199-9-69 [DOI] [PMC free article] [PubMed] [Google Scholar]
- 14.Liu DW, Chen ST, Liu HP. Choice of endogenous control for gene expression in nonsmall cell lung cancer. Eur Respir J. 2005;26(6):1002–8. Epub 2005/12/02. 10.1183/09031936.05.00050205 . [DOI] [PubMed] [Google Scholar]
- 15.Normann KR, Oystese KAB, Berg JP, Lekva T, Berg-Johnsen J, Bollerslev J, et al. Selection and validation of reliable reference genes for RT-qPCR analysis in a large cohort of pituitary adenomas. Mol Cell Endocrinol. 2016;437:183–9. Epub 2016/08/27. 10.1016/j.mce.2016.08.030 . [DOI] [PubMed] [Google Scholar]
- 16.Wang X, He J, Wang W, Ren M, Gao S, Zhao G, et al. Validation of internal reference genes for relative quantitation studies of gene expression in human laryngeal cancer. PeerJ. 2016;4:e2763. Epub 2016/12/14. 10.7717/peerj.2763 [DOI] [PMC free article] [PubMed] [Google Scholar]
- 17.Rho HW, Lee BC, Choi ES, Choi IJ, Lee YS, Goh SH. Identification of valid reference genes for gene expression studies of human stomach cancer by reverse transcription-qPCR. BMC Cancer. 2010;10:240. Epub 2010/05/29. 10.1186/1471-2407-10-240 [DOI] [PMC free article] [PubMed] [Google Scholar]
- 18.Li H, Chang LJ, Neubauer DR, Muir DF, Wallace MR. Immortalization of human normal and NF1 neurofibroma Schwann cells. Lab Invest. 2016;96(10):1105–15. Epub 2016/09/13. 10.1038/labinvest.2016.88 . [DOI] [PubMed] [Google Scholar]
- 19.Liu Y, Qin Z, Cai L, Zou L, Zhao J, Zhong F. Selection of internal references for qRT-PCR assays of human hepatocellular carcinoma cell lines. Biosci Rep. 2017;37(6). Epub 2017/11/29. 10.1042/BSR20171281 [DOI] [PMC free article] [PubMed] [Google Scholar]
- 20.Vandesompele J, De Preter K, Pattyn F, Poppe B, Van Roy N, De Paepe A, et al. Accurate normalization of real-time quantitative RT-PCR data by geometric averaging of multiple internal control genes. Genome Biol. 2002;3(7):RESEARCH0034. Epub 2002/08/20. 10.1186/gb-2002-3-7-research0034 [DOI] [PMC free article] [PubMed] [Google Scholar]
- 21.Andersen CL, Jensen JL, Orntoft TF. Normalization of real-time quantitative reverse transcription-PCR data: a model-based variance estimation approach to identify genes suited for normalization, applied to bladder and colon cancer data sets. Cancer Res. 2004;64(15):5245–50. Epub 2004/08/04. 10.1158/0008-5472.CAN-04-0496 . [DOI] [PubMed] [Google Scholar]
- 22.Pfaffl MW, Tichopad A, Prgomet C, Neuvians TP. Determination of stable housekeeping genes, differentially regulated target genes and sample integrity: BestKeeper—Excel-based tool using pair-wise correlations. Biotechnol Lett. 2004;26(6):509–15. Epub 2004/05/07. 10.1023/b:bile.0000019559.84305.47 . [DOI] [PubMed] [Google Scholar]
- 23.Xie F, Xiao P, Chen D, Xu L, Zhang B. miRDeepFinder: a miRNA analysis tool for deep sequencing of plant small RNAs. Plant Mol Biol. 2012. Epub 2012/02/01. 10.1007/s11103-012-9885-2 . [DOI] [PubMed] [Google Scholar]
- 24.Hellemans J, Vandesompele J. Selection of reliable reference genes for RT-qPCR analysis. Methods Mol Biol. 2014;1160:19–26. Epub 2014/04/18. 10.1007/978-1-4939-0733-5_3 . [DOI] [PubMed] [Google Scholar]
- 25.Ali H, Du Z, Li X, Yang Q, Zhang YC, Wu M, et al. Identification of suitable reference genes for gene expression studies using quantitative polymerase chain reaction in lung cancer in vitro. Mol Med Rep. 2015;11(5):3767–73. Epub 2015/01/13. 10.3892/mmr.2015.3159 . [DOI] [PubMed] [Google Scholar]
- 26.Yu S, Yang Q, Yang JH, Du Z, Zhang G. Identification of suitable reference genes for investigating gene expression in human gallbladder carcinoma using reverse transcription quantitative polymerase chain reaction. Mol Med Rep. 2015;11(4):2967–74. Epub 2014/12/02. 10.3892/mmr.2014.3008 . [DOI] [PubMed] [Google Scholar]
- 27.Ma H, Yang Q, Li D, Liu J. Validation of suitable reference genes for quantitative polymerase chain reaction analysis in rabbit bone marrow mesenchymal stem cell differentiation. Mol Med Rep. 2015;12(2):2961–8. Epub 2015/05/16. 10.3892/mmr.2015.3776 . [DOI] [PubMed] [Google Scholar]
- 28.Derveaux S, Vandesompele J, Hellemans J. How to do successful gene expression analysis using real-time PCR. Methods. 2010;50(4):227–30. Epub 2009/12/09. 10.1016/j.ymeth.2009.11.001 . [DOI] [PubMed] [Google Scholar]
- 29.Hummel TR, Jessen WJ, Miller SJ, Kluwe L, Mautner VF, Wallace MR, et al. Gene expression analysis identifies potential biomarkers of neurofibromatosis type 1 including adrenomedullin. Clin Cancer Res. 2010;16(20):5048–57. Epub 2010/08/27. 10.1158/1078-0432.CCR-10-0613 [DOI] [PMC free article] [PubMed] [Google Scholar]
- 30.Karaosmanoglu B, Kocaefe CY, Soylemezoglu F, Anlar B, Varan A, Vargel I, et al. Heightened CXCR4 and CXCL12 expression in NF1-associated neurofibromas. Childs Nerv Syst. 2018;34(5):877–82. Epub 2018/02/20. 10.1007/s00381-018-3745-6 . [DOI] [PubMed] [Google Scholar]
- 31.Longo JF, Brosius SN, Black L, Worley SH, Wilson RC, Roth KA, et al. ErbB4 promotes malignant peripheral nerve sheath tumor pathogenesis via Ras-independent mechanisms. Cell Commun Signal. 2019;17(1):74. Epub 2019/07/12. 10.1186/s12964-019-0388-5 [DOI] [PMC free article] [PubMed] [Google Scholar]
- 32.Li X, Yang Q, Bai J, Yang Y, Zhong L, Wang Y. Identification of optimal reference genes for quantitative PCR studies on human mesenchymal stem cells. Mol Med Rep. 2015;11(2):1304–11. Epub 2014/11/06. 10.3892/mmr.2014.2841 . [DOI] [PubMed] [Google Scholar]
- 33.Oturai DB, Sondergaard HB, Bornsen L, Sellebjerg F, Christensen JR. Identification of Suitable Reference Genes for Peripheral Blood Mononuclear Cell Subset Studies in Multiple Sclerosis. Scand J Immunol. 2016;83(1):72–80. Epub 2015/09/24. 10.1111/sji.12391 . [DOI] [PubMed] [Google Scholar]
- 34.Toritsuka M, Makinodan M, Yamauchi T, Yamashita Y, Ikawa D, Komori T, et al. Altered gene expression in lymphoblastoid cell lines after subculture. In Vitro Cell Dev Biol Anim. 2018;54(7):523–7. Epub 2018/06/28. 10.1007/s11626-018-0267-1 . [DOI] [PubMed] [Google Scholar]
- 35.Tokunaga K, Nakamura Y, Sakata K, Fujimori K, Ohkubo M, Sawada K, et al. Enhanced expression of a glyceraldehyde-3-phosphate dehydrogenase gene in human lung cancers. Cancer Res. 1987;47(21):5616–9. Epub 1987/11/01. . [PubMed] [Google Scholar]
- 36.Revillion F, Pawlowski V, Hornez L, Peyrat JP. Glyceraldehyde-3-phosphate dehydrogenase gene expression in human breast cancer. Eur J Cancer. 2000;36(8):1038–42. Epub 2000/07/08. 10.1016/s0959-8049(00)00051-4 . [DOI] [PubMed] [Google Scholar]
- 37.Ohl F, Jung M, Radonic A, Sachs M, Loening SA, Jung K. Identification and validation of suitable endogenous reference genes for gene expression studies of human bladder cancer. J Urol. 2006;175(5):1915–20. Epub 2006/04/08. 10.1016/S0022-5347(05)00919-5 . [DOI] [PubMed] [Google Scholar]
- 38.Colell A, Green DR, Ricci JE. Novel roles for GAPDH in cell death and carcinogenesis. Cell Death Differ. 2009;16(12):1573–81. Epub 2009/09/26. 10.1038/cdd.2009.137 . [DOI] [PubMed] [Google Scholar]
- 39.Guo C, Liu S, Sun MZ. Novel insight into the role of GAPDH playing in tumor. Clin Transl Oncol. 2013;15(3):167–72. Epub 2012/08/23. 10.1007/s12094-012-0924-x . [DOI] [PubMed] [Google Scholar]
- 40.Coulson DT, Brockbank S, Quinn JG, Murphy S, Ravid R, Irvine GB, et al. Identification of valid reference genes for the normalization of RT qPCR gene expression data in human brain tissue. BMC Mol Biol. 2008;9:46. Epub 2008/05/08. 10.1186/1471-2199-9-46 [DOI] [PMC free article] [PubMed] [Google Scholar]
- 41.Pombo-Suarez M, Calaza M, Gomez-Reino JJ, Gonzalez A. Reference genes for normalization of gene expression studies in human osteoarthritic articular cartilage. BMC Mol Biol. 2008;9:17. Epub 2008/01/30. 10.1186/1471-2199-9-17 [DOI] [PMC free article] [PubMed] [Google Scholar]
- 42.Abruzzo LV, Lee KY, Fuller A, Silverman A, Keating MJ, Medeiros LJ, et al. Validation of oligonucleotide microarray data using microfluidic low-density arrays: a new statistical method to normalize real-time RT-PCR data. Biotechniques. 2005;38(5):785–92. Epub 2005/06/11. 10.2144/05385MT01 . [DOI] [PubMed] [Google Scholar]
- 43.Dydensborg AB, Herring E, Auclair J, Tremblay E, Beaulieu JF. Normalizing genes for quantitative RT-PCR in differentiating human intestinal epithelial cells and adenocarcinomas of the colon. Am J Physiol Gastrointest Liver Physiol. 2006;290(5):G1067–74. Epub 2006/01/10. 10.1152/ajpgi.00234.2005 . [DOI] [PubMed] [Google Scholar]
- 44.Lyng MB, Laenkholm AV, Pallisgaard N, Ditzel HJ. Identification of genes for normalization of real-time RT-PCR data in breast carcinomas. BMC Cancer. 2008;8:20. Epub 2008/01/24. 10.1186/1471-2407-8-20 [DOI] [PMC free article] [PubMed] [Google Scholar]
- 45.Urbatzka R, Galante-Oliveira S, Rocha E, Castro LF, Cunha I. Normalization strategies for gene expression studies by real-time PCR in a marine fish species, Scophthalmus maximus. Mar Genomics. 2013;10:17–25. Epub 2013/03/23. 10.1016/j.margen.2013.02.001 . [DOI] [PubMed] [Google Scholar]
Associated Data
This section collects any data citations, data availability statements, or supplementary materials included in this article.
Supplementary Materials
(XLS)
Agarose gel electrophoresis of RT-qPCR amplification products for each of the internal reference genes provided by Sangon (M: Sangon DNA Marker {B600335}).
(TIFF)
The expression levels of eleven candidate reference genes (RPS18, ACTB, B2M, GAPDH, PPIA, HPRT1, TBP, UBC, RPLP0, TFRC and RPL32) in fourteen NF1 related cell lines.
(XLSX)
(XLS)
(PDF)
(XLSX)
Data Availability Statement
All relevant data are within the paper and its Supporting information files.


