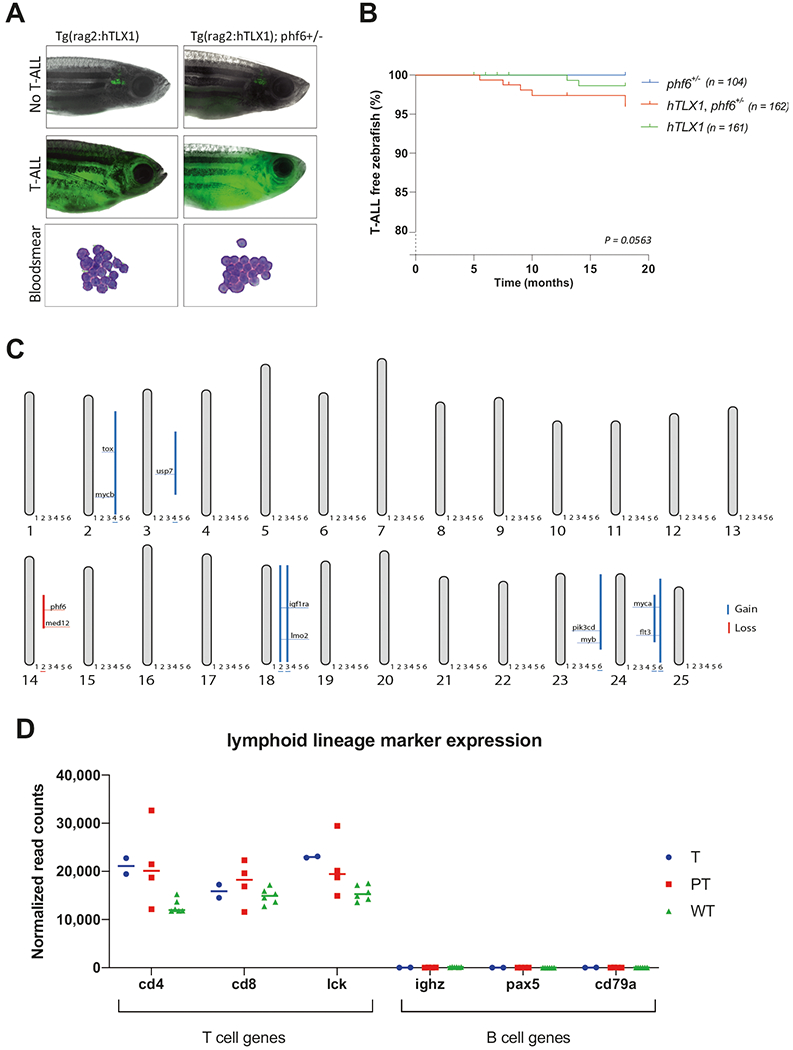
Fig. 1. Phenotypic and molecular analysis of TLX1-driven zebrafish T-ALL.

a Representative images of EGFP positive T-ALL bearing fish for both hTLX1 (left) as hTLX1; phf6+/− (right) transgenic zebrafish lines. The hematoxylin–eosin stained blood smears from leukemic fish show a high presence of malignant lymphoblasts (bottom panels). b Kaplan–Meier incidence curves depicting the percentage of leukemia-free animals over time (months), log-rank comparison for the three groups: p = 0.0563. c Schematic overview representing all the chromosomes and the detected copy number variations of six analyzed T-ALLs, with gains indicated by blue lines and losses by red lines. Sample annotation: 1 = T1, 2 = T2, 3 = PT1, 4 = PT2, 5 = PT3, 6 = PT4. d Normalized RNA-seq read counts showing high expression of T-cell marker (cd4, cd8, and lck) and low expression of B-cell marker (ighz, pax5, and cd79a) in leukemic and thymocyte samples. Horizontal lines indicate the median of each group. “T” refers to samples from hTLX1 fish, “PT” refers to samples from hTLX1;phf6+/− fish, and “WT” refers to normal wild-type thymocytes.
