Abstract
Wettability alteration (from oil-wet to mixed- or water-wet condition) is the most prominent mechanism in low-salinity water flooding (LSWF) for enhanced oil recovery (EOR) in sandstone reservoirs. Although several factors influence the wettability alteration, many efforts have been made to find the main controlling factor. In this study, the influence of interface properties of sandstone/brine and thermodynamic equilibrium of sandstone minerals were evaluated to understand the wettability alteration during LSWF. A triple-layer surface complexation model built-in PHREEQC was applied to a quartz/brine interface, and the modeling results were verified with zeta potential experimental data. This model was combined with that of kaolinite/brine to predict sandstone/brine interface properties. The measured and predicted sandstone zeta potentials were between those obtained for quartz and kaolinite in the diluted seawater. The predicted surface potential of sandstone together with that of crude oil was used in extended Derjaguin–Landau–Verwey–Overbeek theory to estimate the attractive or repulsive force. Consideration of thermodynamic equilibrium between minerals and solution significantly increased the pH and hence resulted in an increase in negative surface potential in the surface complexation. This provided a strong repulsive force between crude oil and sandstone, thus resulting in a more water-wet condition.
Introduction
Low-salinity water flooding (LSWF), which is the injection of brine with low salinity of seawater or formation water into the reservoir, has been considered as the most promising enhanced oil recovery (EOR) technique because of its low cost and it is environmentally friendly.1−3 Some studies have confirmed improved oil recovery by LSWF in sandstone and carbonate reservoirs, while others have reported unaffected oil recovery.4−7 More than 15 mechanisms have been proposed in the literature to predict the outcomes of LSWF in EOR.6−13 Among the proposed mechanisms, the wettability alteration toward a more water-wet condition is the primary mechanism with a favorable effect of LSWF in EOR,13−15 but other researchers argued that fine migration is a mobility controlled mechanism in EOR during LSWF in sandstone reservoirs.12 The contact angle measurement and core flooding experiments with low-salinity water have demonstrated the alteration of rock wettability from oil-wet to mixed-wet or water-wet state.16−18
The characteristics of crude oil/brine and rock/brine interfaces and rock dissolution significantly affect the wettability alteration. The zeta potentials of crude oil emulsion and rock suspension in various solutions were used to explain wettability alteration.13,19,20 The injection of low-salinity water changes the surface charge of crude oil and rock to the same polarity and results in repulsive force between the crude oil and rock. Moreover, the low-salinity water causes expansion of the double layer at both crude oil/brine and rock/brine interfaces. These induce a more water-wet state at the rock surface. Extended Derjaguin–Landau–Verwey–Overbeek (DLVO) theory has been used to evaluate the stability of water film on the rock surface for wettability alteration,7,19,21−23 where surface charge and the double-layer thickness play a significant role in determining the total disjoining pressure (attractive or repulsive) and consequently water film stability. LSWF shifts the total disjoining pressure from negative (attractive) to positive (repulsive) and results in the release of more oil from the rock surface. Indeed, the type of ions and their composition affect the disjoining pressure, thereby causing wettability alteration. The mineral dissolution changes the pH and solution composition, which could affect the interaction between crude oil and rock and finally have an impact on wettability alteration.
Numerous experimental and geochemical modeling studies have been reported on the effect of electrokinetics and dissolution of carbonate rocks on wettability alteration,3,7,15,19−25 but there are only limited reports for sandstone rock because of the complexity in sandstone mineralogical characteristics.26−29 The amount of clay in sandstone would influence the wettability alteration and oil recovery during LSWF thorough clay swelling, fine migration, and dissolution.27,28 The proposed geochemical models to describe the interface properties were based on the double-layer model. Moreover, only a few studies have considered the combination of double-layer surface complexation with the thermodynamic equilibrium of minerals.28 The prediction of electrokinetics by the double-layer model or ignoring of minerals equilibrium would result in underestimation of attractive or repulsive forces in the crude oil-brine-rock system. Authors have applied a triple-layer surface complexation model for crude oil/brine, calcite/brine, and kaolinite/brine interfaces to predict the surface potential.30−32 Furthermore, the importance of surface potential rather than zeta potential in the calculation of attractive or repulsive force was analyzed.32
To the best of authors’ knowledge, there is no quantitative study on estimating the interface properties of sandstone/brine and combining the properties with phase equilibrium to evaluate the wettability alteration. In the present study, the triple-layer surface complexation model built-in PHREEQC was applied for a quartz/brine interface and integrated with the model of kaolinite/brine to predict the electrokinetic properties of a sandstone/brine interface. The triple-layer surface complexation models were combined with the thermodynamic equilibrium model to evaluate the impact of mineral dissolution on the electrokinetics of the crude oil-brine-sandstone system. Furthermore, the attractive or repulsive forces between crude oil and sandstone were estimated by the extended DLVO theory and used to assess the wettability alteration during LSWF.
Results and Discussion
Surface Complexation Model for the Quartz/Brine Interface
To propose the triple-layer surface complexation model for the quartz/brine interface, the parameters were determined by fitting the experimental zeta potential with modeling results. The surface of quartz consists of >SiOH surface sites, and its site density was assumed to be 4.6 sites/nm2.33 Inner capacitance of the triple-layer model was calculated from the size of water molecule (for protonation and deprotonation) or the ions directly attached to quartz surface (for calcium or magnesium adsorption), while the outer capacitance was set to 0.2 F/m2 as adopted for the kaolinite/brine interface.34 Therefore, the calculated inner capacitance values for the interaction of H+, Ca2+, and Mg2+ were 2.253, 3.098, and 4.302 F/m2, respectively. The protonation reactions of the 2-pK model for surface sites of quartz are33
| 1 |
| 2 |
where >SiOH is the surface site of quartz and >SiO– and >SiOH2+ are the surface species.
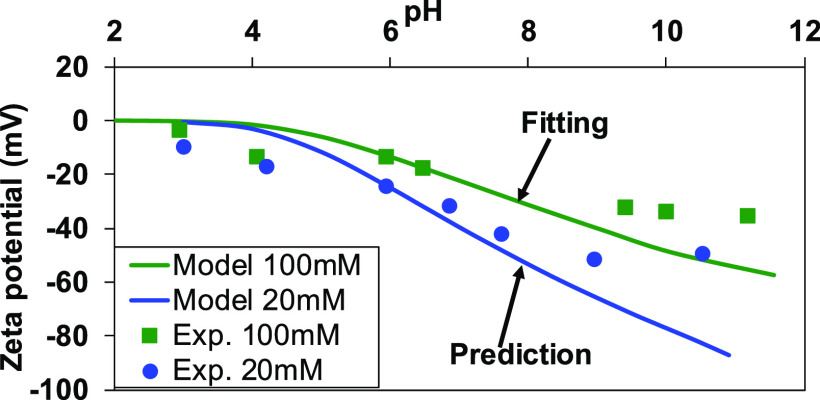
Figure 1 shows the fitting and prediction of zeta potential for quartz in varying pH solutions for the ionic strengths of 100 and 20 mM, where an ionic strength of 100 mM was used in fitting the model to estimate the equilibrium constants for eqs 1 and 2 while 20 mM was used to validate the estimated equilibrium constants. The measured and predicted zeta potentials were negative for pH > 2.0, and a positive value was not observed. Therefore, the isoelectric point for quartz lies approximately at pH of 2.0, which is consistent with a previous study.34 The zeta potential showed a tendency to increase its absolute value with increasing pH and decreasing ionic strength. The estimated equilibrium constant values for eqs 1 and 2 were −1.75 and 6.75, respectively (Table 1). The equilibrium constant values obtained in this study are consistent with the reported data using the basic Stern model33 or triple-layer models,35,36 which reported −1.57 to −1.87 for eq 1 and 6.37–7.5 for eq 2. The modeling results agree with experimental data at pH < 9, and a notable discrepancy was observed between model prediction and experimental results at pH > 9. In this study, the proposed triple-layer surface complexation model did not consider sodium adsorption, which might affect the zeta potential particularly at high concentrations or high pH values. However, divalent cations have high affinity toward the quartz surface as compared to sodium. Therefore, the surface charge development due to sodium adsorption can be negligible in seawater or its dilution.
Figure 1.
Measured and predicted zeta potential of quartz as a function of pH at ionic strengths of 100 and 20 mM. The ionic strength was adjusted with a NaCl solution.
Table 1. Surface Complexation Modeling Parameters for Sandstone.
| quartz/brine interface | kaolinite/brine interface32 | |
|---|---|---|
| quartz edge (X = Si) | kaolinite edges (X = Si, Al) | |
| >XOH site density (sites/nm2) | 4.6a | 5.5 |
| specific surface area of quartz (m2/g) | 0.92 | 11.47 |
| log_K at 25 °C | ||
| >XOH + H+ ↔ >XOH2+ | –1.75 | 0.80 |
| >XO– + H+ ↔ >XOH | 6.75 | 7.00 |
| >XOH + Ca2+ ↔ >XOCa+ + H+ | –5.70 | –6.00 |
| >XOH + Mg2+ ↔ >XOMg+ + H+ | –5.70 | –5.55 |
| C1 (F/m2) | 2.253 (H+ interaction) | |
| 3.098 (Ca2+ interaction) | ||
| 4.302 (Mg2+ interaction) | ||
| C2 (F/m2) | 0.2 | |
Reference (33).
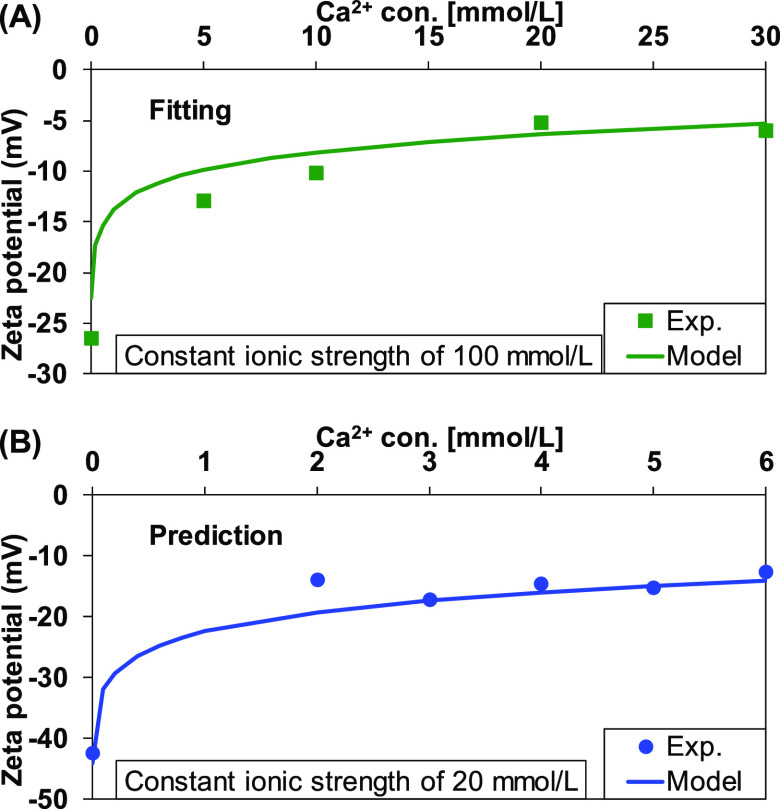
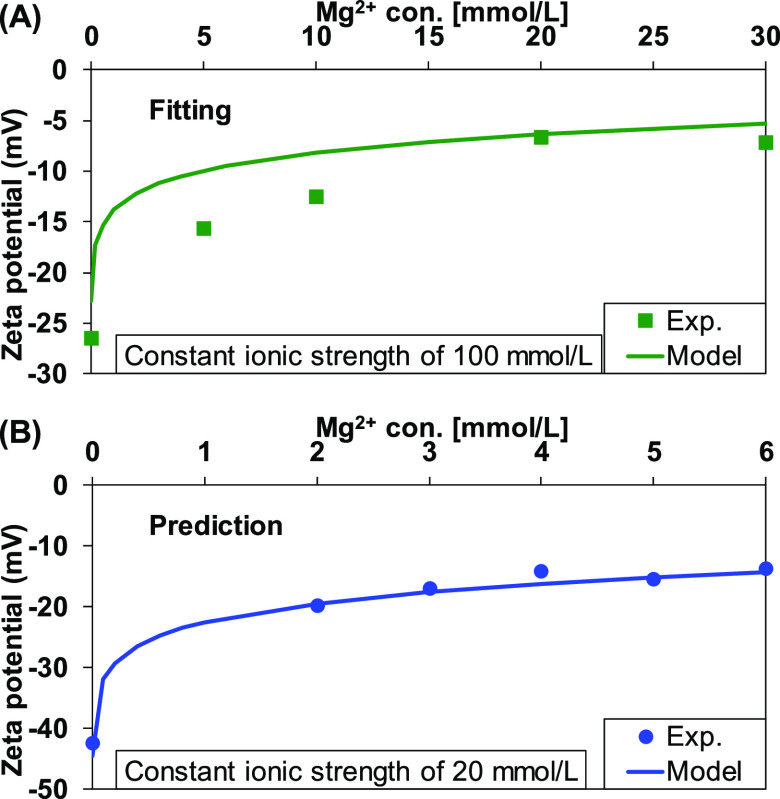
The interaction of calcium and magnesium with the quartz surface was investigated by measuring the zeta potential as a function of calcium/magnesium concentration at a constant pH 8. The measured zeta potential at an ionic strength of 100 mM was used for fitting the modeling results to estimate the equilibrium constant, while the data obtained at a 20 mM ionic strength was used for validation of the estimated equilibrium constant. The results are shown in Figure 2 and Figure 3 for calcium and magnesium, respectively. As obtained in kaolinite,32 the adsorption of calcium or magnesium compensated the negative quartz surface, and the measured and predicted zeta potential increased toward a positive value. The estimated equilibrium constant for calcium and magnesium adsorption was −5.70 (Table 1). The estimated equilibrium constants satisfactorily predicted the zeta potential at low ionic strengths.
Figure 2.
Measured and predicted zeta potential of quartz as a function of CaCl2 concentration at ionic strengths of (A) 100 mM and (B) 20 mM. The ionic strength was adjusted with a NaCl solution.
Figure 3.
Measured and predicted zeta potential of quartz as a function of MgCl2 concentration at ionic strengths of (A) 100 mM and (B) 20 mM. The ionic strength was adjusted with a NaCl solution.
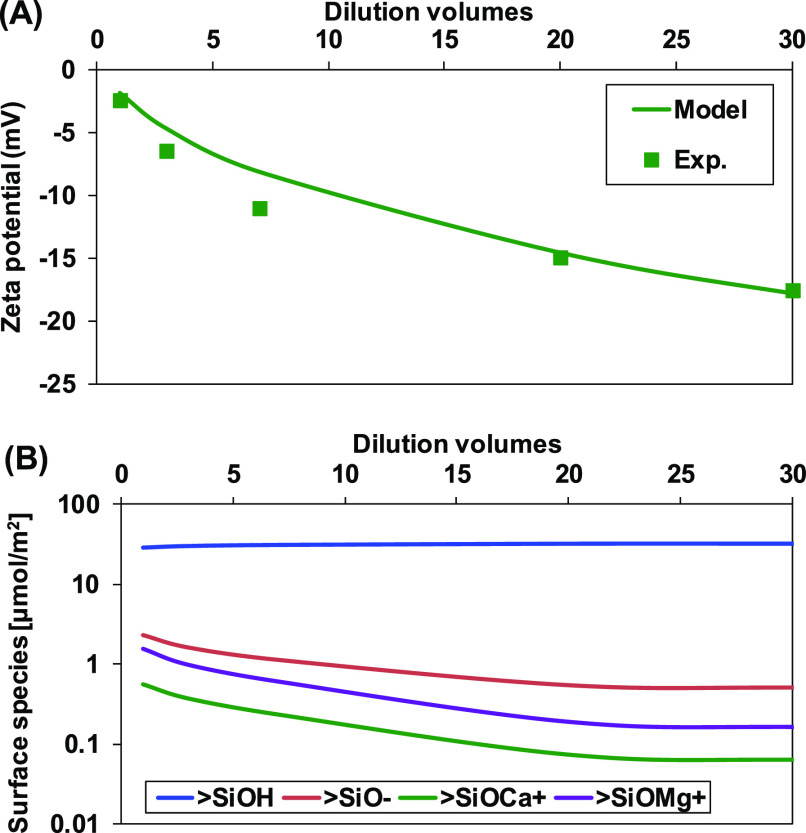
The determined surface complexation modeling parameters (Table 1) were applied to predict the zeta potential of quartz in SW and its dilution. As SW comprises multi-ions, the large size of calcium ion was considered to determine the inner capacitance. The model prediction was compared with experimental data in Figure 4A. The reduction of salinity increased the absolute value of zeta potential. Model prediction agrees well with experimental data, suggesting the application of the model in sandstone. Figure 4B shows the distribution of predicted concentration of surface species. The concentration of >SiOH2+ was excluded due to its exceptionally low concentration. The concentration of un-ionized surface species (>SiOH) increased with dilution, while the concentration of deprotonated (>SiO–), calcium (>SiOCa+), and magnesium (>SiOMg+) adsorbed surface species decreased with dilution. Higher concentrations of deprotonated surface sites than the summation of calcium and magnesium adsorbed sites contributed to the negative zeta potential in SW or its dilution.
Figure 4.
(A) Comparison between measured and predicted zeta potential of quartz. (B) Surface speciation of the quartz/brine interface in seawater and its dilution.
Prediction of Electrokinetic Properties of the Sandstone/Brine Interface
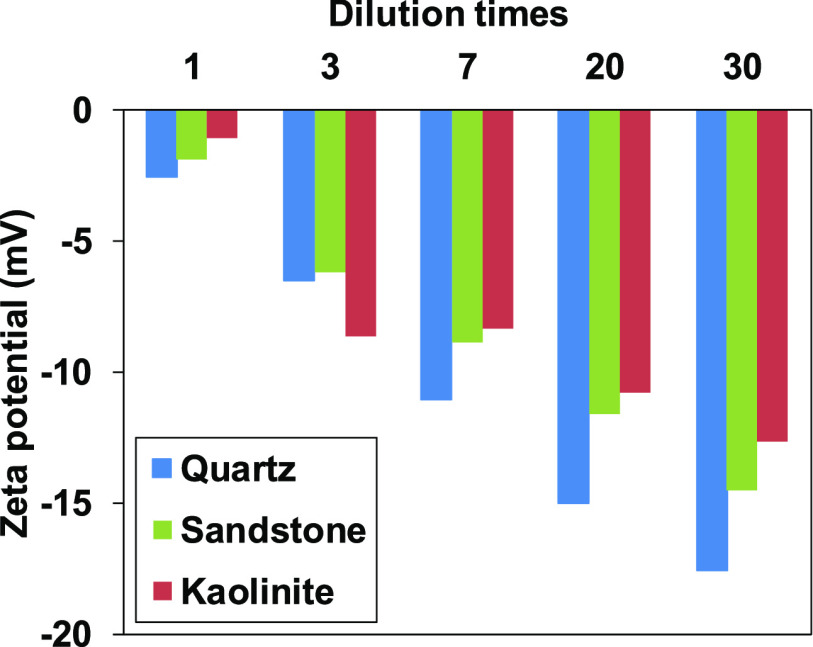
The quartz and clay minerals in sandstone contribute to electrokinetics of sandstone. The zeta potential of sandstone was measured, and the values were compared with quartz and kaolinite in Figure 5 for the suspension in SW and its dilution. The negative sign of zeta potential was associated with a higher fraction of deprotonated surface sites than the concentration of divalent cation adsorbed sites. As observed in quartz and kaolinite,32 sandstone zeta potential decreased with salinity reduction. Furthermore, the sandstone zeta potential in the diluted SW existed in between quartz and kaolinite, suggesting that the surface functional groups of both quartz and kaolinite influence the electrokinetic properties of sandstone. The measured Berea sandstone zeta potential in SW or diluted SW was from −2 to −12 mV, which is comparable and consistent with the results reported in the literature.37 The pH of the solution and divalent cation concentration in SW significantly affect the zeta potential of sandstone in addition to the type and amount of clay in sandstone.
Figure 5.
Measured zeta potential of quartz, kaolinite, and sandstone as a function of dilution in SW (kaolinite data were reprinted from Takeya et al.32).
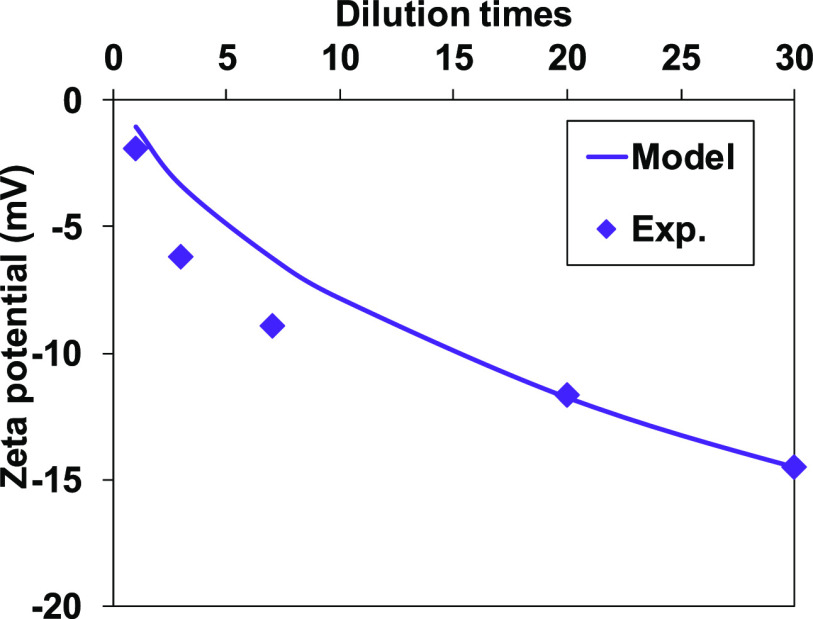
The surface complexation modeling parameters of quartz and kaolinite32 were combined to predict the zeta potential of sandstone. It should be noted that the triple-layer model was integrated with the thermodynamic equilibrium in the simulation (see the Supporting Information). The results are shown in Figure 6 for sandstone in SW and its dilution. A good agreement between model prediction and experimental data was obtained, indicating the significance and contribution of quartz and kaolinite electrokinetics on sandstone.
Figure 6.
Comparison between measured and predicted zeta potential of sandstone as a function of dilution in SW.
Impact of Surface Electrical Properties and Thermodynamic Equilibrium on the LSWF Effect
The total disjoining pressure between the crude oil and sandstone controls the stability of the water layer between the interfaces and influences the attraction or repulsion between them. A higher disjoining pressure expands the water layer and causes repulsion between the surfaces (water-wet), whereas the low disjoining pressure attracts the surfaces (oil-wet). Therefore, total disjoining pressure is a good indicator to evaluate the wettability alteration during LSWF. To understand the contribution of van der Waals, electrical, and structural forces on total disjoining pressure, calculations were performed for crude oil and sandstone in 30 times diluted SW. The triple-layer surface complexation model proposed previously30 for the crude oil/brine interface was used together with the model for sandstone/brine. Therefore, both the crude oil and sandstone (kaolinite and quartz) surfaces compete for the ionization and adsorption of ions in the solution. The calculated disjoining pressure results are shown in Figure 7 where crude oil of AN 1.06 32 was selected with the sandstone, which provides −47.68 mV of surface potential at the crude oil/brine interface. The van der Waals force was attractive, whereas structural and electrical forces were repulsive. The negative surface of both crude oil and sandstone predicted a positive electrical force, which dominated the total disjoining pressure. Therefore, the composition of solution and the surface potential control the attractive/repulsive force between crude oil and sandstone and hence the wettability change.
Figure 7.
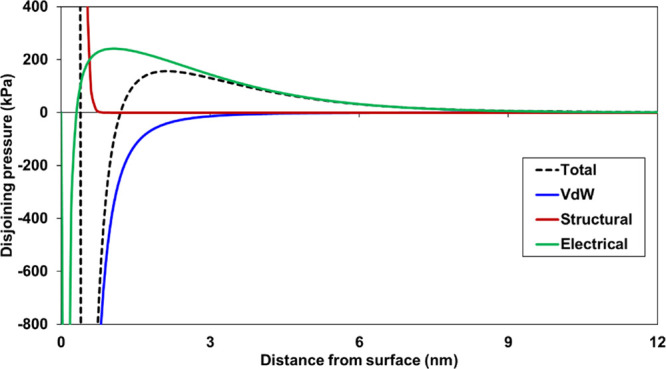
Calculated total and individual component of disjoining pressure for the crude oil-30*SW-sandstone system.
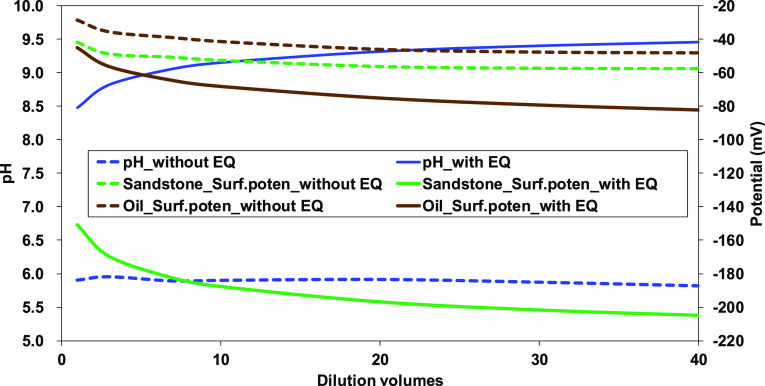
Since the sandstone consists of several minerals, the thermodynamic equilibrium between the minerals and formation water or injecting low-salinity water would affect the concentration of potential determining ions. As shown in Figure 5, the solution pH causes the negative potential of sandstone minerals. Therefore, pH change in solution significantly influences oil-brine-sandstone interactions in wettability alteration. The effect of thermodynamic equilibrium between minerals and solution on pH change and thus surface potential was evaluated for the oil-brine-sandstone system in SW and its dilution. The thermodynamic equilibrium induced pH increase 2.5–3.6 units during the dilution of SW (Figure 8), and it increased the deprotonation of surface sites, thus notably increasing the surface potential of both crude oil and sandstone. Therefore, the equilibrium of minerals should be considered in the reservoir simulation to correctly predict the wettability alteration and oil recovery.
Figure 8.
Effect of thermodynamic equilibrium on pH and surface potential of crude oil/brine and sandstone/brine.
We assessed the effect of AN of crude oil on the electrokinetics of the crude oil/brine interface31 as well as the crude oil-brine-calcite system.32 Furthermore, the calculated total disjoining pressure for the crude oil-brine-kaolinite system showed a positive value (in other words, repulsive) in low-salinity water due to the negative surface of both oil and kaolinite. Herein, we have analyzed the impact of integrating phase equilibrium model with the surface complexation model to understand wettability alteration via total disjoining pressure. The interaction between crude oils (AN 1.06 and 0.07) and sandstone was evaluated as total disjoining pressure, where a constant salinity of 30 times diluted SW was considered in both crude oils to neglect the effect of double-layer thickness (Figure 9). The negative surface of the crude oil and sandstone resulted in a positive disjoining pressure. More importantly, consideration of mineral equilibrium together with the surface complexation reactions showed a strong repulsive force between crude oil and sandstone, which was significant in a high AN of crude oil.
Figure 9.
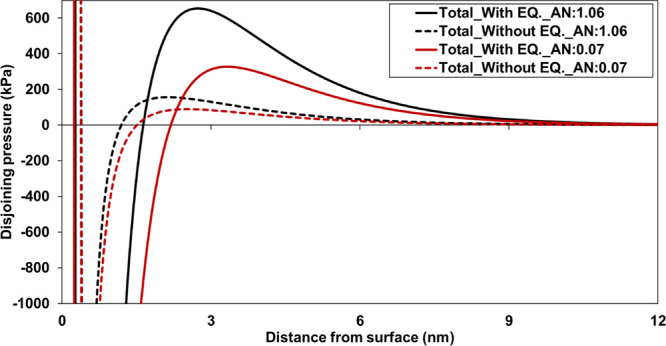
Effect of thermodynamic equilibrium and acid number on total disjoining pressure for the crude oil-30*SW-sandstone system.
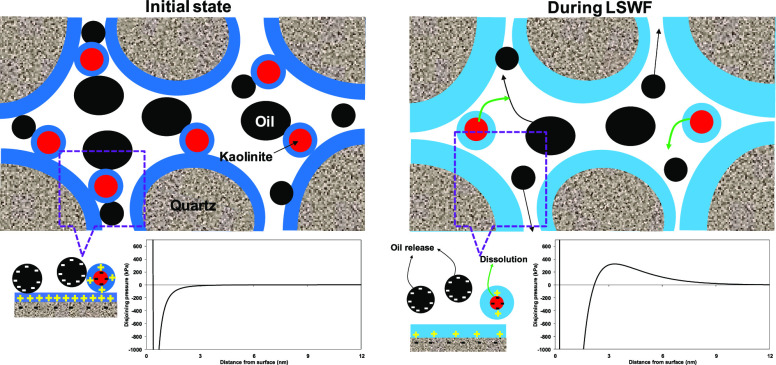
The pH increase and consequent increase in negative surface potential show a high impact on the interaction between the crude oil and sandstone and resulting in wettability alteration during LSWF. The proposed mechanism for wettability alteration due to electrokinetics between crude oil and sandstone and thermodynamic equilibrium is illustrated in Figure 10. Initially, the high concentration of formation water leads the crude oil to be attached to sandstone via cation bridging and forms a very thin water film between the crude oil and sandstone minerals (oil-wet state). The calculated total disjoining pressure shows a very strong attraction (initial state in Figure 10); the chemical composition of the formation water given in ref (32) and the crude oil of AN 0.07 were used for the calculation of total disjoining pressure. As a result of low-salinity water flooding, the sandstone minerals start to dissolve and increase the pH, which develops a high negative surface charge on both crude oil and sandstone minerals. In here, the electrical force between the crude oil and sandstone becomes weak, and it reverses to repulsive force (during LSWF in Figure 10); this, in turn, expands the water film (water-wet state) and leads to the release of more oil.
Figure 10.
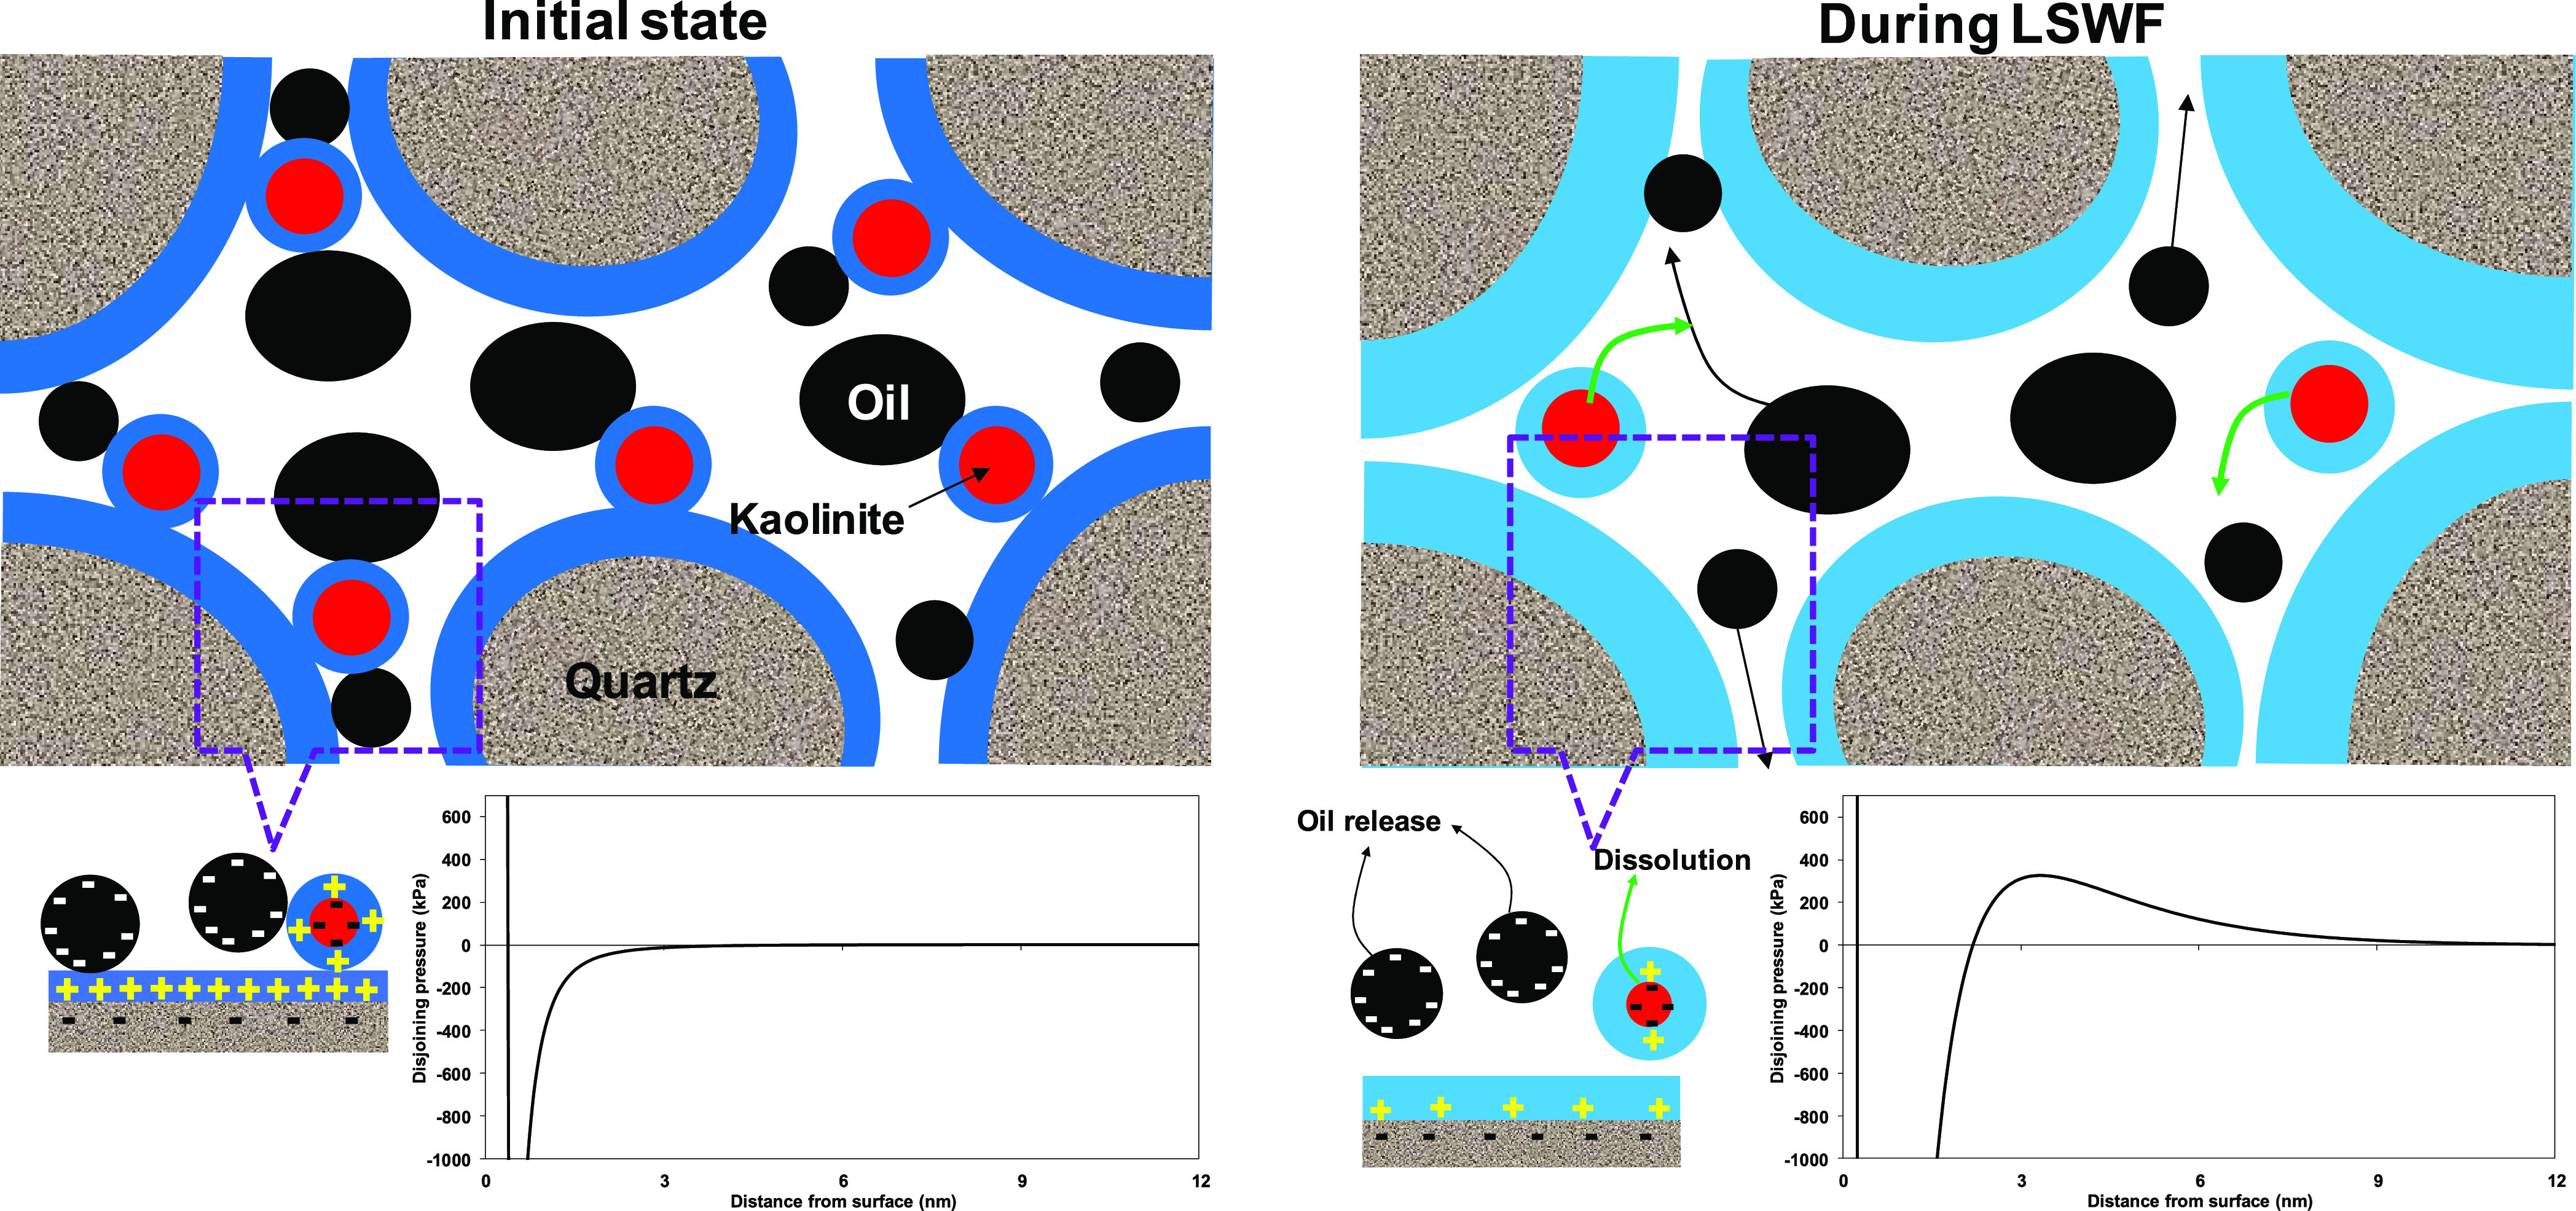
Illustration of electrokinetics and thermodynamic equilibrium effect on wettability alteration. The associated phenomena are shown in total disjoining pressure.
Conclusions
The electrokinetics of the quartz/brine interface was studied by a zeta potential experiment and triple-layer surface complexation model. The surface complexation modeling parameters were derived by fitting the experimental data and modeling results and validated against different sets of experimental results. The triple-layer model of quartz/brine was integrated with that of kaolinite/brine to predict the electrokinetics of the sandstone/brine interface. The model successfully predicted the zeta potential of sandstone in SW and its dilution. The negative zeta potential of sandstone was lower than that of quartz but higher than that of kaolinite in the diluted solution. The significance of electrokinetics of the sandstone/brine interface in evaluating LSWF for EOR was examined by the extended DLVO theory wherein electrical force dominates the total disjoining pressure for repulsion between the crude oil and sandstone. The pH of the solution controlled the surface potential of sandstone, and the thermodynamic equilibrium between sandstone minerals and solution affected the pH change. The calculated total disjoining pressure proved that consideration of thermodynamic equilibrium together with the surface complexation is necessary to correctly evaluate wettability alteration during LSWF.
Experimental Methods and Modeling Approach
Experimental Methods
In this study, natural quartz from Toyoura and Berea sandstone were used for experiments. Table 2 shows the chemical composition of quartz and Berea sandstone measured by X-ray fluorescence (XRF) analysis, and the mineralogical composition of sandstone is tabulated in Table 3. The measured BET specific surface areas of quartz and sandstone by N2 adsorption were 0.92 and 2.34 m2/g, respectively. The electrolyte solutions for the experiments were prepared by mixing the chemical reagents of NaOH, HCl, NaCl, CaCl2, Na2SO4, and MgCl2·6H2O with deionized water. For the quartz/brine interface model development and validation, 20 and 100 mM ionic strengths of NaCl, CaCl2, or MgCl2 solutions were used. The pH was kept at 8 using NaOH for the measurements in calcium or magnesium solution. The ionic composition of prepared seawater (SW) is given in Table 4, and it was diluted to 3, 7, 20, and 30 times for the zeta potential measurement.
Table 2. Chemical Composition of Quartz and Berea Sandstone.
| oxide (%) | quartz | sandstone |
|---|---|---|
| SiO2 | 93.21 | 91.22 |
| Al2O3 | 4.14 | 5.39 |
| K2O | 2.28 | 1.25 |
| Fe2O3 | 0.09 | 0.88 |
| CaO | 0.02 | 0.48 |
| MgO | 0.02 | 0.37 |
| TiO2 | 0.07 | 0.24 |
| Na2O | 0.17 | 0.17 |
Table 3. Mineralogy of Sandstone.
| mineral | wt. (%) |
|---|---|
| quartz | 91.4 |
| kaolinite | 1.4 |
| dolomite | 1.5 |
| muscovite | 0.7 |
| albite | 1.2 |
| orthoclase | 3.7 |
Table 4. Composition of Seawater.
| Na+ | Ca2+ | Mg2 | Cl– | SO42– | Ionic strength | |
|---|---|---|---|---|---|---|
| SW (mg/L) | 13,900 | 600 | 1560 | 24300 | 3420 | 0.816 [mol/L] |
A zeta potential and particle size analyzer ELSZ-1000 manufactured by Otsuka Electronics was used for zeta potential measurement of quartz and sandstone suspension. The suspension was made by adding 0.01 g of quartz or sandstone into 20 mL of electrolyte solution as adopted in our previous study.32 The suspension was kept for 24 h until equilibrium and dispersed with a vortex mixer for 1 min and ultrasonic cleaner for 2 min before zeta potential measurement. The suspension was extracted with a syringe and injected into a standard cell for measurement. The zeta potential measurement was conducted at 25 °C.
Modeling Approach
The geochemical code PHREEQC was employed here for speciation, thermodynamic equilibrium between minerals and solution, and surface complexation calculations.38 The attractive and repulsive forces between crude oil and sandstone were calculated by the extended DLVO theory. The governing equations are described in detail in refs (21−23, 30, 32), and (38)and briefly given in Appendix A and Appendix B. For the speciation calculation in PHREEQC, the chemical reaction for mole-balance and mass-action equations, equilibrium constant and its temperature dependence, and activity coefficients are defined in SOLUTION_SPECIES data block, while the solution composition is input using the SOLUTION data block. The sandstone minerals can react with brine to achieve thermodynamic equilibrium, and the reactions are expressed by the mass-action equation. The equilibrium between the aqueous phase and minerals is modeled with PHASES and EQUILIBRIUM_PHASES data blocks. The mass action equation, equilibrium constant, and its temperature-dependent constant are defined in the PHASES data block, while the EQUILIBRIUM_PHASES data block is used to input the initial composition of the phase and target saturation indices (which has a value of zero for equilibrium). Table 5 lists the dissolution reactions of minerals and their equilibrium constant under standard conditions used in this study. The PHREEQC default thermodynamic database (Phreeqc.dat)38 was used for the calculations.
Table 5. Thermodynamic Properties of Minerals Used in the Simulation.
| phase | reaction | Log Kp at 25 °C |
|---|---|---|
| quartz | SiO2 + 2H2O ↔ H4SiO4 | –3.98 |
| kaolinite | Al2Si2O5(OH)4 + 6H+ ↔ H2O + 2H4SiO4 + 2Al3+ | 7.44 |
| dolomite | CaMg(CO3)2 ↔ Ca2+ + Mg2+ + 2CO32– | –17.09 |
| albite | NaAlSi3O8 + 8H2O ↔ Na+ + Al(OH)4– + 3H4SiO4 | –18.00 |
| orthoclase | KAlSi3O8 + 8H2O ↔ K+ + Al(OH)4– + 3H4SiO4 | –20.57 |
The electrokinetic interaction between surface and aqueous species is modeled with surface complexation reactions. The charge distribution-multi-site complexation model (CD-MUSIC) built-in PHREEQC was used as a triple-layer surface complexation model. Authors have developed the surface complexation model for the crude oil/brine (given in Appendix A), calcite/brine, and kaolinite/brine interfaces, and the model is applied herein for the quartz/brine interface.30−32 Hydroxyl/hydrogen, calcium, and magnesium are considered as potential-determining ions for the quartz surface as they form inner-sphere complexation reaction with surface functional groups, while sodium and chloride are indifferent ions and exist in the diffuse layer. The specific reaction of aqueous species with the surface species is defined in the SURFACE_SPECIES data block and the site density of each surface and its surface area are input in the SURFACE data block. An example PHREEQC input file for coupling of the triple-layer surface complexation model with the phase-equilibrium model is given in the Supporting Information.
The DLVO theory was used to estimate the forces acting between crude oil and sandstone. The total disjoining pressure in the extended DLVO theory consists of van der Waals, structural, and electrical forces. The van der Waals force, controlled by dielectric constants and refractive indices of the materials, is a long-range force. On the other hand, structural force is a short-range force and acts at a distance of <1 nm. The electrical force can be calculated from the surface potential of crude oil/brine and sandstone/brine interfaces, and it can be attractive or repulsive depending of the surface charge of both oil/brine and sandstone/brine. The surface potential calculated from the triple-layer surface complexation model was used to calculate the electrical forces for the crude oil-brine-sandstone system. Therefore, the electrical force strongly depends on the solution composition and electrokinetics of crude oil/brine and sandstone/brine interfaces. The extended DLVO theory and the associated equations are described in refs (21, 23), and (32) and given in Appendix B.
Acknowledgments
We would like to express our gratitude to Mr. Tatsuya Hattori from JOGMEC for the chemical composition analysis of quartz and sandstone.
Appendix
A. Triple-Layer Surface Complexation Model
A detailed description of the model is given in ref (30). In the triple-layer (0-, 1-, and 2-plane) model, the surface and zeta potentials are the potential at the 0- and 2-plane. The capacitance of the first (0-to1-plane) and second (1- to 2-plane) Stern layers can be calculated by the following expression:30
| A1 |
Here, ε0 and εr are the absolute (8.85 × 10⁻¹² CV–1 m–1) and relative dielectric constants, respectively, and d is the distance between the planes. The diameters of a calcium ion and a water molecule are considered to be distances d1 and d2, respectively. The dissociation of the surface carboxyl groups and the adsorption of divalent cations on the groups can be represented as
| A2 |
| A3 |
| A4 |
where KCOO–, KCOOCa+, and KCOOMg+ are the intrinsic equilibrium constants for dissociation, calcium, and magnesium adsorption, respectively, (−COO–), (−COOH), (−COOCa+), and (−COOMg+) are the concentrations (mol/m2) of the surface species of carboxyl group, ai is the activity of ionic species i, ψ0 and ψ1 are the potentials at the 0- and 1-plane, respectively (V), R is the universal gas constant equal to 8.31451 J/(mol·K), and T is the absolute temperature (K).
B. Extended DLVO Theory and Disjoining Pressure Calculation
A detailed description of the calculation is given in ref (32). The attractive and repulsive forces acting between charged surfaces were calculated using the extended DLVO theory. In the reservoir system, these forces can be used to understand the interaction of oil to the rock surface. The total disjoining pressure is composed of van der Waals, electrical, and structural forces7,21,22,39
| B1 |
where Πtotal(h) is the total disjoining pressure, Πvan(h) is the van der Waals force, Πele(h) is the electrical force, and Πstr(h) is the structural force. A positive disjoining pressure in the oil-brine-rock system indicates the repulsion between the oil/brine and brine/rock interface, and a negative disjoining pressure corresponds to attraction between the surfaces.
The van der Waals force is generated between two approaching surfaces, which is an attractive force controlled by dielectric constants and refractive indices of the materials. The van der Waals force can be calculated as follows:39
| B2 |
where A is the Hamaker constant of the oil/brine/rock interface, λ is the London wavelength, and h is the distance separating the two surfaces. The London wavelength was assumed to be 100 nm. The Hamaker constant depends on the material properties of dielectric constants and refractive indices.40,41 Therefore, it should be calculated from the experiments and agreed with calculation. Based on calculation, it is given as22
| B3 |
where subscripts rock, water, and oil indicate Hamaker constant for individual media in vacuum, and the values for Arock, Awater, and Aoil are 1.01 × 10⁻¹⁹, 3.7 × 10⁻²⁰, and 6.0 × 10⁻²⁰ J, respectively. Equation B3 provides the Hamaker constant for the rock-brine-oil system, which is assumed to be 0.66 × 10⁻²⁰ J.22
Electrostatic forces develop between charged surfaces due to their surface potentials. The electrostatic forces can be attractive or repulsive depending on the sign of the surface charge and are developed through dissociation and adsorption of ions. The electrostatic force can be calculated from the surface potential as follows:
| B4 |
where k is the Boltzmann constant (1.38 × 10⁻²³), T is the temperature in Kelvin, ψr1 and ψr2 are the reduced surface potentials, κ is the reciprocal Debye–Hückel double-layer length, nb is the ion density in bulk solution, and h is the separating distance. The reduced surface potential and Debye–Hückel thickness were calculated as follows:
| B5 |
| B6 |
where z is the valence of a symmetrical electrolyte solution, e is the electron charge (1.6 × 10⁻¹⁹C), ψ0 is the surface potential, ε0 is the dielectric permittivity of a vacuum (8.854 × 10⁻¹²), and εr is the relative permittivity of the electrolyte solution.
Structural forces act at ranges of <1 nm compared to van der Waals and electrostatic forces, which are long-range forces.21,22,39 The structural force, similar to the van der Waals force, does not depend on the concentration of the electrolyte solution and can be calculated as follows:
| B7 |
where Ak is the coefficient and hs is the characteristic decay length of the exponential model. In this study, it was assumed that the coefficient and decay length were 1.5 × 10¹⁰ Pa and 0.05 nm, respectively.
Supporting Information Available
The Supporting Information is available free of charge at https://pubs.acs.org/doi/10.1021/acsomega.0c05332.
An example PHREEQC input file of the triple-layer surface complexation model coupled with the phase-equilibrium model for sandstone (PDF)
The authors declare no competing financial interest.
Supplementary Material
References
- Bartels W.-B.; Mahani H.; Berg S.; Hassanizadeh S. M. Literature review of low salinity waterflooding from a length and time scale perspective. Fuel 2019, 236, 338–353. 10.1016/j.fuel.2018.09.018. [DOI] [Google Scholar]
- Morrow N.; Buckley J. Improved Oil Recovery by Low-Salinity Waterflooding. J. Pet. Technol. 2011, 63, 106–112. 10.2118/129421-JPT. [DOI] [Google Scholar]
- Qiao C.; Johns R.; Li L. Modeling low salinity waterflooding in chalk and limestone reservoirs. Energy Fuels 2016, 30, 884–895. 10.1021/acs.energyfuels.5b02456. [DOI] [Google Scholar]
- Al-Saedi H. N.; Flori R. E.; Brady P. V. Effect of divalent cations in formation water on wettability alteration during low salinity water flooding in sandstone reservoirs: Oil recovery analyses, surface reactivity tests, contact angle, and spontaneous imbibition experiments. J. Mol. Liq. 2019, 275, 163. 10.1016/j.molliq.2018.11.093. [DOI] [Google Scholar]
- Yousef A. A.; Al-Saleh S.; Al-Kaabi A.; Al-Jawfi M. Laboratory Investigation of the Impact of Injection-Water Salinity and Ionic Content on Oil Recovery From Carbonate Reservoirs. SPE Reservoir Eval. Eng. 2011, 14, 578–593. 10.2118/137634-PA. [DOI] [Google Scholar]
- Austad T.; Shariatpanahi S. F.; Strand S.; Black C. J. J.; Webb K. J. Conditions for a low-salinity Enhanced Oil Recovery (EOR) effect in carbonate oil reservoirs. Energy Fuels 2012, 26, 569–575. 10.1021/ef201435g. [DOI] [Google Scholar]
- Mahani H.; Menezes R.; Berg S.; Fadili A.; Nasralla R.; Voskov D.; Joekar-Niasar V. Insights into the Impact of Temperature on the Wettability Alteration by Low Salinity in Carbonate Rocks. Energy Fuels 2017, 31, 7839–7853. 10.1021/acs.energyfuels.7b00776. [DOI] [Google Scholar]
- Al-Shalabi E. W.; Sepehrnoori K. A comprehensive review of low salinity/engineered water injections and their applications in sandstone and carbonate rocks. J. Pet. Sci. Eng. 2016, 139, 137–161. 10.1016/j.petrol.2015.11.027. [DOI] [Google Scholar]
- Sheng J. J. Critical review of low salinity waterflooding. J. Pet. Sci. Eng. 2014, 120, 216–224. 10.1016/j.petrol.2014.05.026. [DOI] [Google Scholar]
- Sohal M. A.; Thyne G.; Søgaard E. G. Review of Recovery Mechanisms of Ionically Modified Waterflood in Carbonate Reservoirs. Energy Fuels 2016, 30, 1904–1914. 10.1021/acs.energyfuels.5b02749. [DOI] [Google Scholar]
- Afekare D. A.; Radonjic M. From Mineral Surfaces and Coreflood Experiments to Reservoir Implementations: Comprehensive Review of Low-Salinity Water Flooding (LSWF). Energy Fuels 2017, 31, 13043–13062. 10.1021/acs.energyfuels.7b02730. [DOI] [Google Scholar]
- Yu M.; Zeinijahromi A.; Bedrikovetsky P.; Genolet L.; Behr A.; Kowollik P.; Hussain F. Effects of fines migration on oil displacement by low-salinity water. J. Pet. Sci. Eng. 2019, 175, 665–680. 10.1016/j.petrol.2018.12.005. [DOI] [Google Scholar]
- Tian H.; Wang M. Electrokinetic mechanism of wettability alternation at oil-water-rock interface. Surf. Sci. Rep. 2017, 72, 369–391. 10.1016/j.surfrep.2018.01.001. [DOI] [Google Scholar]
- Mahani H.; Keya A. L.; Berg S.; Bartels W. B.; Nasralla R.; Rossen W. R. Insights into the Mechanism of Wettability Alteration by Low-Salinity Flooding (LSF) in Carbonates. Energy Fuels 2015, 29, 1352–1367. 10.1021/ef5023847. [DOI] [Google Scholar]
- Sari A.; Xie Q.; Chen Y.; Saeedi A.; Pooryousefy E. Drivers of Low Salinity Effect in Carbonate Reservoirs. Energy Fuels 2017, 31, 8951–8958. 10.1021/acs.energyfuels.7b00966. [DOI] [Google Scholar]
- Fathi S. J.; Austad T.; Strand S. “Smart Water” as a wettability modifier in chalk: The effect of salinity and ionic composition. Energy Fuels 2010, 24, 2514–2519. 10.1021/ef901304m. [DOI] [Google Scholar]
- Sadeqi-Mogadam M.; Riahi S.; Bahramian A. An investigation into the electrical behavior of oil/water/reservoir rock interfaces: The implication for improvement in wettability prediction. Colloids Surf., A 2016, 490, 268–282. 10.1016/j.colsurfa.2015.11.040. [DOI] [Google Scholar]
- Chen Y.; Sari A.; Xie Q.; Brady P. V.; Hossain M. M.; Saeedi A. Electrostatic Origins of CO2-Increased Hydrophilicity in Carbonate Reservoirs. Sci. Rep. 2018, 8, 17691. 10.1038/s41598-018-35878-3. [DOI] [PMC free article] [PubMed] [Google Scholar]
- Xie Q.; Liu Y.; Wu J.; Liu Q. Ions tuning water flooding experiments and interpretation by thermodynamics of wettability. J. Pet. Sci. Eng. 2014, 124, 350–358. 10.1016/j.petrol.2014.07.015. [DOI] [Google Scholar]
- Tetteh J. T.; Almoradi S.; Brady P. V.; Ghahfarokhi R. B. Electrokinetics at calcite-rich limestone surface: Understanding the role of ions in modified salinity waterflooding. J. Mol. Liq. 2020, 297, 111868. 10.1016/j.molliq.2019.111868. [DOI] [Google Scholar]
- Sanaei A.; Tavassoli S.; Sepehrnoori K. Investigation of modified Water chemistry for improved oil recovery: Application of DLVO theory and surface complexation model. Colloids Surf., A 2019, 574, 131–145. 10.1016/j.colsurfa.2019.04.075. [DOI] [Google Scholar]
- Awolayo A. N.; Sarma H. K.; Nghiem L. X. Modeling the characteristic thermodynamic interplay between potential determining ions during brine-dependent recovery process in carbonate rocks. Fuel 2018, 224, 701–717. 10.1016/j.fuel.2018.03.070. [DOI] [Google Scholar]
- Liu F.; Wang M. Review of low salinity waterflooding mechanisms: Wettability alteration and its impact on oil recovery. Fuel 2020, 267, 117112. 10.1016/j.fuel.2020.117112. [DOI] [Google Scholar]
- Gomari S. R.; Amrouche F.; Santos R. G.; Greenwell H. C.; Cubillas P. A New Framework to Quantify the Wetting Behaviour of Carbonate Rock Surfaces Based on the Relationship between Zeta Potential and Contact Angle. Energies (Basel, Switz.) 2020, 13, 993. 10.3390/en13040993. [DOI] [Google Scholar]
- Tetteh J. T.; Veisi M.; Brady P. V.; Ghahfarokhi R. B. Surface Reactivity Analysis of the Crude Oil–Brine–Limestone Interface for a Comprehensive Understanding of the Low-Salinity Waterflooding Mechanism. Energy Fuels 2020, 34, 2739–2756. 10.1021/acs.energyfuels.9b03664. [DOI] [Google Scholar]
- Jackson M. D.; Vinogradov J.; Hamon G.; Chamerois M. Evidence, mechanisms and improved of controlled salinity waterflooding part 1: Sandstone. Fuel 2016, 185, 772–793. 10.1016/j.fuel.2016.07.075. [DOI] [Google Scholar]
- Bazyari A.; Soulgani B. S.; Jamialahmadi M.; Monfared A. D.; Zeinijahromi A. Performance of smart water in clay-rich sandstone: Experimental and theoretical analysis. Energy Fuels 2018, 10354–10366. 10.1021/acs.energyfuels.8b01663. [DOI] [Google Scholar]
- Chen Y.; Xie Q.; Saeedi A. Role of ion exchange, surface complexation, and albite dissolution in low salinity water flooding in sandstone. J. Pet. Sci. Eng. 2019, 126–131. 10.1016/j.petrol.2019.01.019. [DOI] [Google Scholar]
- Brady P. V.; Krumhansl J. L. A surface complexation model of oil–brine–sandstone interfaces at 100 °C: Low salinity waterflooding. J. Pet. Sci. Eng. 2012, 81, 171–176. 10.1016/j.petrol.2011.12.020. [DOI] [Google Scholar]
- Takeya M.; Shimokawara M.; Elakneswaran Y.; Nawa T.; Takahashi S. Predicting the electrokinetic properties of the crude oil/brine interface for enhanced oil recovery in low salinity water flooding. Fuel 2019, 235, 822–831. 10.1016/j.fuel.2018.08.079. [DOI] [Google Scholar]
- Takeya M.; Shimokawara M.; Elakneswaran Y.; Okano H.; Nawa T. Effect of Acid Number on the Electrokinetic Properties of Crude Oil during Low-Salinity Waterflooding. Energy Fuels 2019, 33, 4211–4218. 10.1021/acs.energyfuels.9b00653. [DOI] [Google Scholar]
- Takeya M.; Ubaidah A.; Shimokawara M.; Okano H.; Nawa T.; Elakneswaran Y. Crude oil/brine/rock interface in low salinity waterflooding: Experiments, triple-layer surface complexation model, and DLVO theory. J. Pet. Sci. Eng. 2020, 188, 106913. 10.1016/j.petrol.2020.106913. [DOI] [Google Scholar]
- Leroy P.; Devau N.; Revil A.; Bizi M. Influence of surface conductivity on the apparent zeta potential of amorphous silica nanoparticles. J. Colloid Interface Sci. 2013, 410, 81–93. 10.1016/j.jcis.2013.08.012. [DOI] [PubMed] [Google Scholar]
- Yoon R. H.; Salman T.; Donnay G. Predicting points of zero charge of oxides and hydroxides. J. Colloid Interface Sci. 1979, 70, 483. 10.1016/0021-9797(79)90056-0. [DOI] [Google Scholar]
- Sverjensky D. A. Prediction of surface charge on oxides in salt solutions: Revisions for 1:1 (M+L–) electrolytes. Geochim. Cosmochim. Acta 2005, 69, 225–257. 10.1016/j.gca.2004.05.040. [DOI] [Google Scholar]
- Sonnefeld J.; Lobbus M.; Vogelsberger W. Determination of electric double layer parameters for spherical silica particles under application of the triple layer model using surface charge density data and results of electrokinetic sonic amplitude measurements. Colloids Surf., A 2001, 215–225. 10.1016/S0927-7757(01)00845-7. [DOI] [Google Scholar]
- Shehata A. M.; Nasr-El-Din H. A. Zeta Potential Measurements: Impact of Salinity on Sandstone Minerals. SPE Int. Symp. Oilfield Chem. 2015, 173763. 10.2118/173763-MS. [DOI] [Google Scholar]
- Parkhust D. L.; Appelo C. A. J.. A computer program for speciation, batch- reaction, one-dimensional transport and inverse geochemical calculations, USGS Report, 1999.
- Xie Q.; Saeedi A.; Pooryousefy E.; Liu Y. Extended DLVO-based estimates of surface force in low salinity water flooding. J. Mol. Liq. 2016, 658–665. 10.1016/j.molliq.2016.06.004. [DOI] [Google Scholar]
- Bergstrom L. Hamaker constants of inorganic materials. Adv. Colloid Interface Sci. 1997, 70, 125–169. 10.1016/S0001-8686(97)00003-1. [DOI] [Google Scholar]
- Israelachvili J. N.Intermolecular and Surface Forces. revised, third ed. Academic press, 2011, New York City. [Google Scholar]
Associated Data
This section collects any data citations, data availability statements, or supplementary materials included in this article.


