Abstract
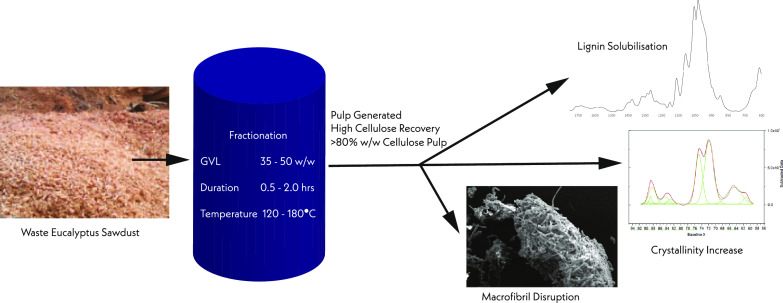
Organic solvents offer promising methods for the fractionation of Eucalyptus obliqua lignocellulosic biomass. This study investigated the impact of γ-valerolactone (GVL) fractionation on the morphology of cellulose and its internal structure using scanning electron microscopy (SEM), nuclear magnetic resonance (NMR) and Fourier-transform infrared (FT-IR) spectroscopy. The solubilized lignin precipitated on the macrofibril surface as lignin spheres. GVL fractionation significantly increased the crystallinity of the recovered pulps from 0.29 for the sawdust to an average of 0.53 and a maximum of 0.66. The main states of cellulose that were susceptible to hydrolysis during the fractionation were amorphous and surface cellulose, both of which were reduced significantly, while paracrystalline and pure crystalline fractions in the pulp increased. It was concluded that GVL fractionation can produce a crystalline cellulose pulp of high quality suitable for further processing.
1. Introduction
The production of sustainable platform chemicals and polymers has become increasingly important due to the increasing costs of petroleum oil and increasing environmental awareness in product chains. One pathway for producing these sustainable commodities is to utilize renewable lignocellulosic biomass, which is likely to constitute the key component of polymers and used for chemical production in the future. Lignocellulosic biomass is generally regarded as the nonedible plant material, for example, stalks, husk, stems, and woody biomass. In Australia, one of the largest lignocellulosic feedstocks is waste timber and wood, of which a significant proportion is Eucalyptus.1 It is composed of three primary components: hemicellulose, lignin, and cellulose. Hemicellulose is a hetero-branched polysaccharide generated from a mixture of hexose and pentose sugars. Lignin is the second most abundant polymer in the world and is a complex polymer crucial for protecting the cellulose fibrils. These two components hold value as potential chemicals that can be used by the pharmaceutical, fuel, and food industries.
Cellulose is the most abundant component in lignocellulosic biomass, and it exists as a long chain homopolymer comprising glucose bound with β-1–4 glycosidic linkages. Cellulose aggregates with adjacent cellulose polymers to produce elemental cellulose fibrils during this hydrogen bonding occurs between the adjacent polymers and van der Waals forces between the sheets causing the structure to become a crystalline substance.2 Crystalline cellulose is most prominent in woody biomass as cellulose Iβ. The elemental cellulose fibril is composed of 36 cellulose polymers, with the intra-chain bonding occurring at higher concentrations towards the center of the fibril. This is because the cellulose chains are completely surrounded, which in turn causes the cellulose in the center of the fibril to exhibit the highest levels of crystallinity.3 Cellulose exists in multiple bonding networks depending on the amount and location of bonding occurring along the polymer, and these are classified into two states, which are crystalline cellulose and amorphous cellulose. In crystalline cellulose, the fibrils are bound more closely and are more ordered with adjacent cellulose polymers and repeat linearly, while amorphous cellulose is disordered and experience less cross-bonding to the adjacent cellulose polymers.4 Crystalline cellulose has often been considered to be an unfavorable product in traditional bioethanol pretreatment techniques due to its apparent negative impact on enzymatic hydrolysis.5 Research results indicate that the effects of crystalline cellulose on hydrolysis are negligible.4 Advances in renewable polymer research have led to increased interest in nanocrystalline cellulose, the production of which is often performed by bleaching and acid washing of biomass of high cellulose content to remove amorphous cellulose and reduce its particle size.6
Several techniques have been used for crystallinity analysis, of which the two most popular are X-ray diffraction (XRD) and solid-state magic angle spinning 13C nuclear magnetic resonance (NMR). Fourier-transform infrared (FT-IR) spectroscopy can also provide information on the structural and morphological changes in the crystallinity of surface cellulose.4 Alongside these instruments, several analytical methods can be used to quantify the crystallinity index (CrI).
NMR has also been used to examine the changes in the cellulose structure and provide information on the amount of amorphous and crystalline cellulose present in the composite.7 The NMR spectra showed peaks for each carbon in the glucose unit, as such methods for the analysis of crystallinity using NMR often compare “crystalline” C4 peaks located between 86–92 ppm and the “amorphous” C4 peak located at 80–86 ppm.
The most common NMR crystallinity index is the NMR C4 peak separation method (NMR-PSM), in which the C4 crystalline (86–92 ppm) peak area is divided by the total C4 peak (80–92 ppm) area.8 Park et al.9 compared NMR-PSM to three common XRD methods of crystallinity measurement and found that NMR results were consistent with XRD, although NMR generated lower CrI values. The second NMR two-peak deconvolution (NMR TPD) in which deconvolution is used to isolate the C4 “crystalline” and “amorphous” peaks and calculate CrI from the area ratio of the total C4 peak. The final method is advanced C4 deconvolution (NMR AD), which enables detailed analysis of the cellulose structure, hence allowing the individual crystalline and amorphous components of the C4 peak to be measured.10 Within the C4 peaks, several peaks are combined to create the broad “crystalline” and “amorphous” peaks. These peaks are associated with cellulose Iα, cellulose Iβ, paracrystalline cellulose, cellulose Iα + β, accessible surface, inaccessible surface, and xylose.11 Using this process, it was possible to produce two separate CrI values, a pure CrI based only on cellulose Iα, Iβ, and Iα + β; and an apparent CrI which included the paracrystalline component.12 This analysis is largely avoided due to the complexity of the deconvolution process, but when used, it provided greater information about how the fractionation or pretreatment process impacted the interpolymer bonding of the cellulose fibril structure.7
FT-IR is often used for rapid measurement of the crystallinity of biomass, but due to the nature of FT-IR, only comparative analysis can be performed, limiting its use.4 There are two common crystallinity analyses using FT-IR with the “lateral order index” (LOI) CrI calculated by the comparison of the absorbance peaks at 1420 and 893 cm–1 and is often defined as the empirical method of CrI using FT-IR.13,14 The other major method for FT-IR crystallinity measurement is the total crystallinity index (TCI) based on the comparisons of bands at 1372 and 2900 cm–1. TCI has been the subject of much debate concerning its accuracy and relevance due to the potential for impact from other common peaks existing within these regions.3
Cellulose, hemicellulose, and lignin can all be used in advanced biorefinery, but they require partial or full isolation via fractionation. This is difficult to achieve due to the complex nature of the lignocellulosic matrix, which involves a combination of covalent, hydrogen, and van der Waals interactions.15,16 Several methods for fractionation of these components have been investigated, including the use of acids, ionic liquids, and organic solvents (e.g., ethanol, acetone). Organic solvent pretreatments (Organosolv) are a recoverable pretreatment that have been proved effective for delignification of biomass with a high lignin content such as hardwood.17,18 Among these organic solvents, γ-valerolactone (GVL) demonstrated promising results as a solvent for a renewable, safe Organosolv process that can be used to fractionate lignocellulosic biomass for bioethanol and biochemical production with only minor saccharide degradation.19,20 Trevorah et al.21 demonstrated the use of GVL for processing of Eucalyptus sawdust producing residual pulp with 89.3% (w/w) cellulose, >80% lignin solubilization and near-complete hemicellulose hydrolysis. Other advantages of GVL Organosolv pretreatment is the high recovery of GVL (87–99%), hemicellulose (94%), and lignin (89%) from the spent liquor.18,22 Additional works on GVL fractionation have reported favorable pretreatment results for a range of biomasses.23−25 When producing cellulose for use as an advanced fiber or polymer, the degree of fiber crystallinity is crucial as it correlates with the strength and resilience of the polymer.
A prior study assessed the effectiveness of GVL fractionation of Eucalyptus sawdust under a range of treatment conditions, including varying temperatures, reaction times, and GVL concentrations.20,21 The recovered pulp (RP) produced under the conditions tested was rich in cellulose with only a low lignin content.21 This study further investigated the structural and morphological changes in the lignocellulosic biomass following the >80% w/w cellulose isolation achieved by GVL fractionation. Using scanning electron microscopy (SEM), NMR, and FT-IR the macrostructural, crystallinity and cellulose morphological changes were investigated to develop a better understanding of the fractionation process and to provide characterization of the RP, which will allow for the assessment of its potential downstream applications.
2. Results and Discussion
2.1. Compositional Changes Following Fractionation
It is important to consider the compositional changes as they provide a keen insight into what fractions of lignocellulose were solubilized and hydrolyzed. A detailed investigation into the impact of fractionation conditions on the RP composition was reported by Trevorah et al.21 Whereas, this study investigated the morphological and structural changes under the same GVL fractionation conditions.
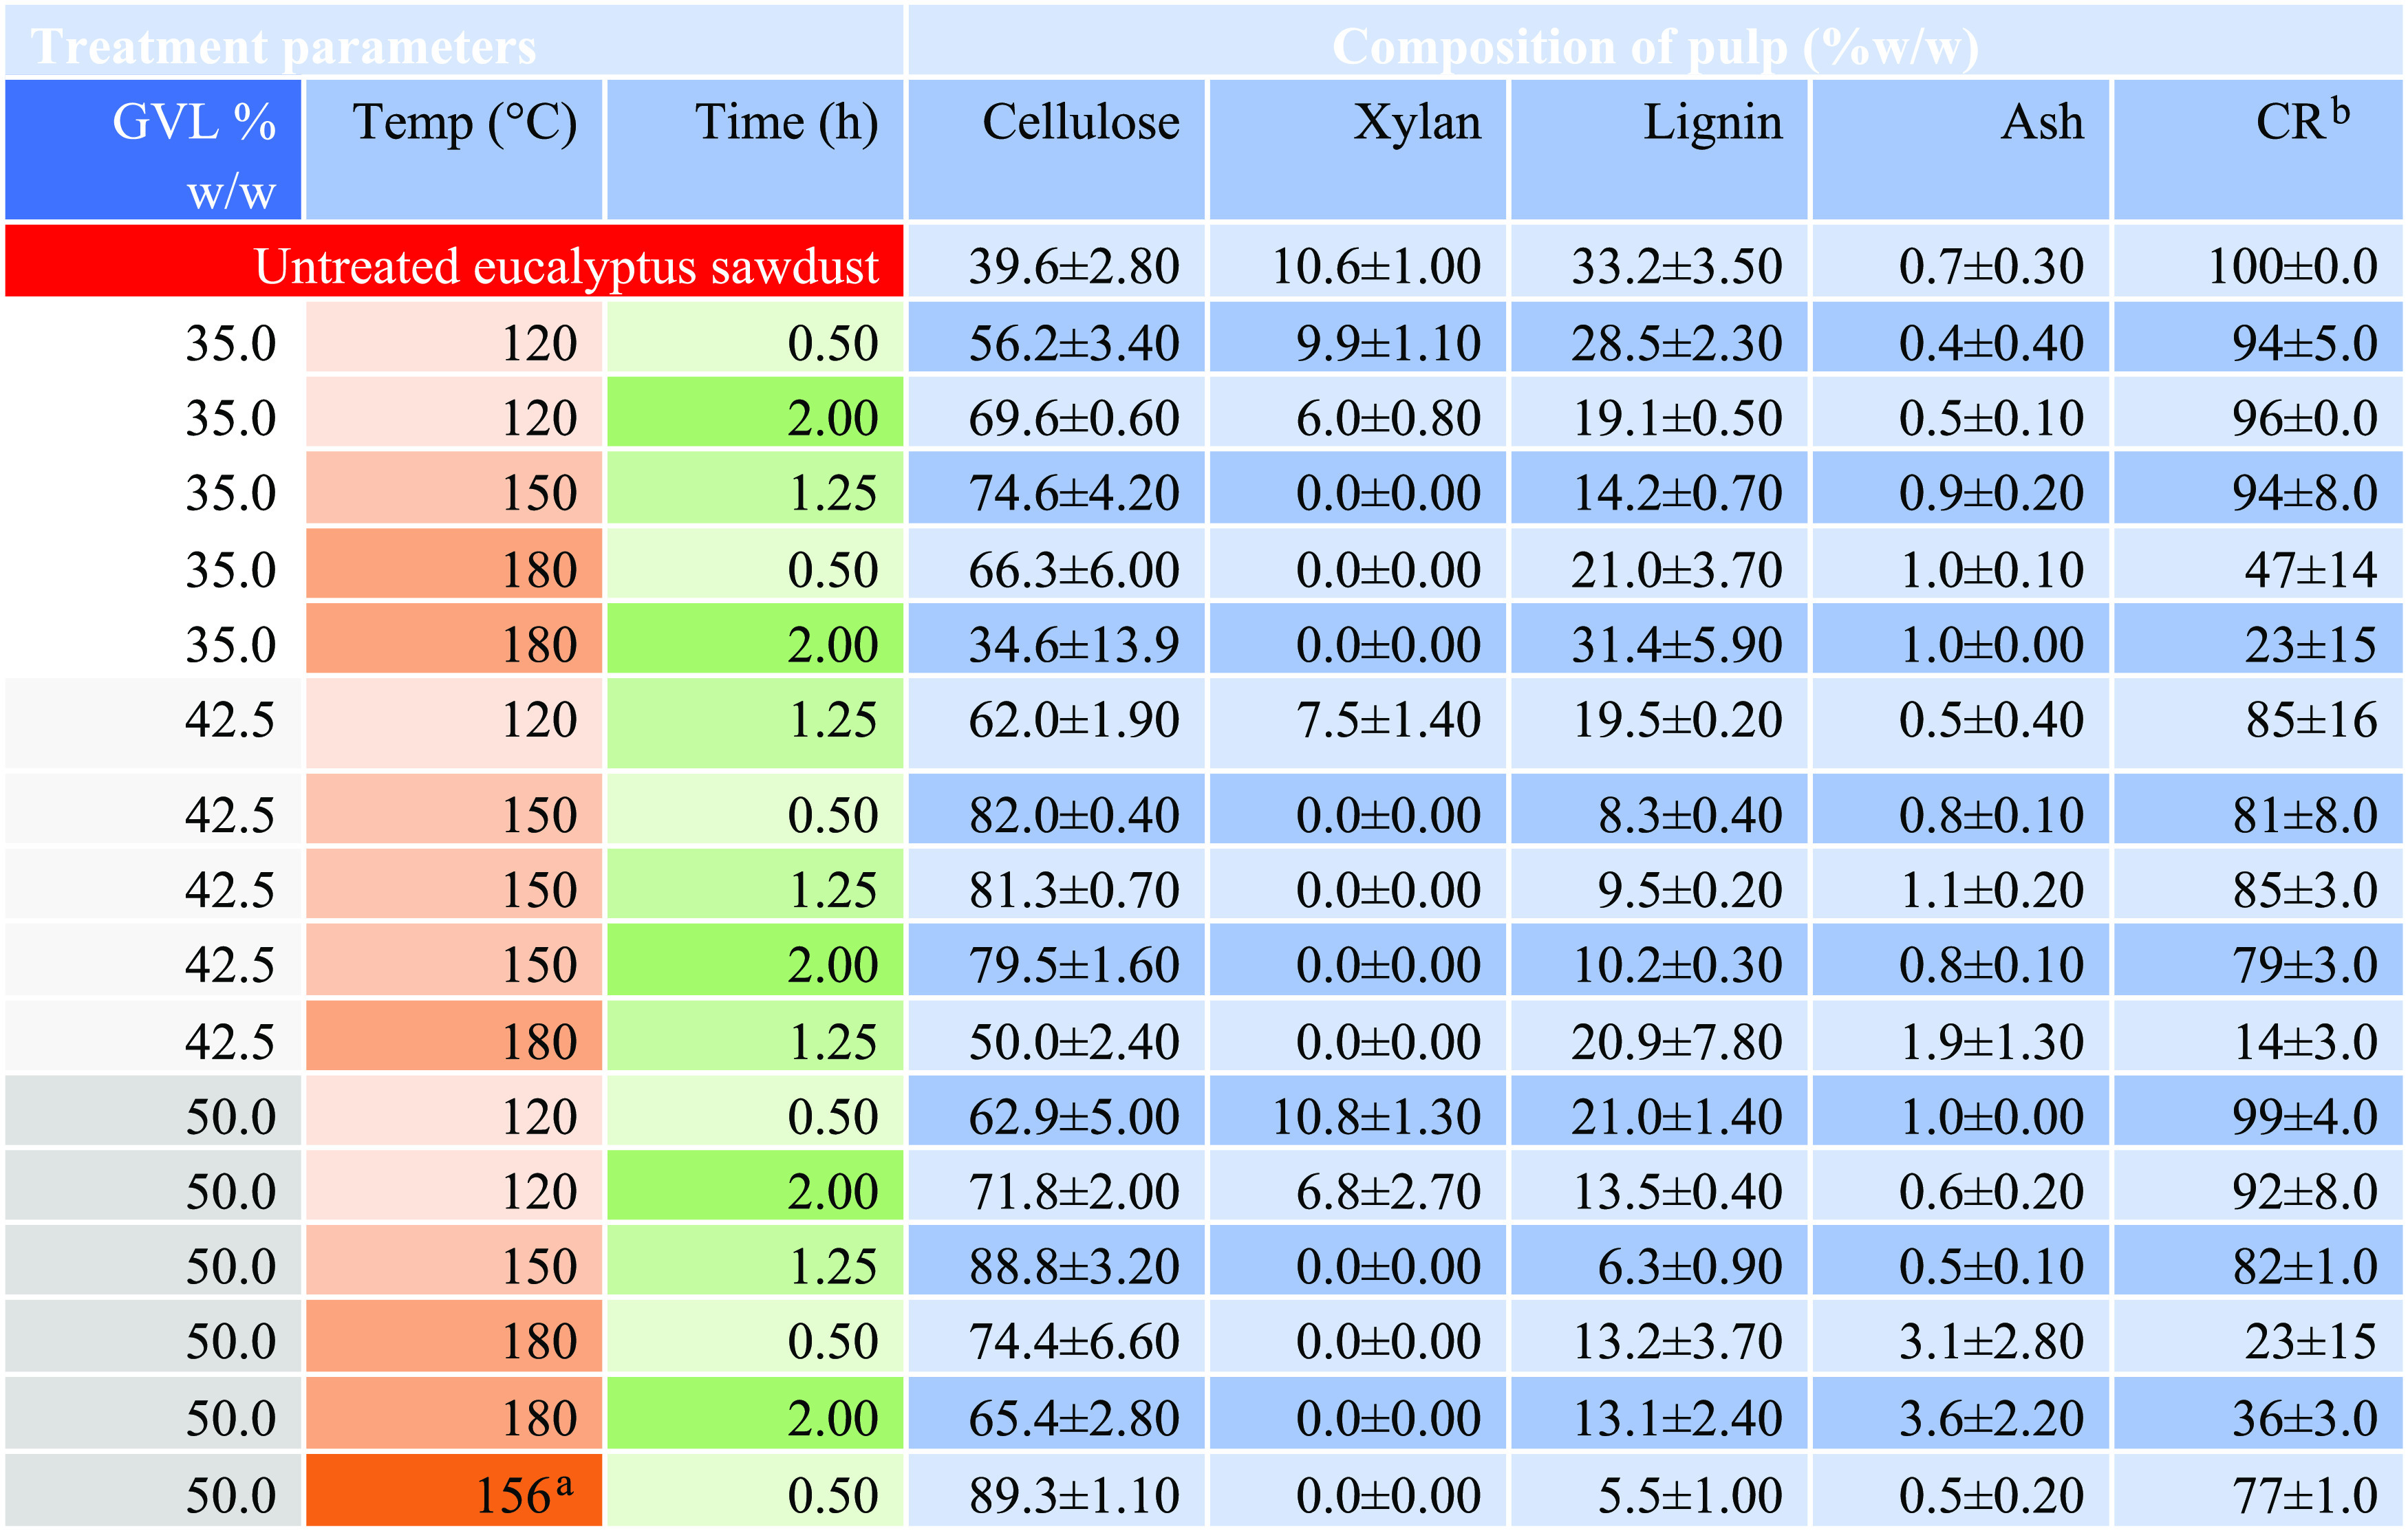
The composition fluctuated under fractionation conditions, with all conditions showing improved isolation of cellulose compared to untreated sawdust (Table 1). Notably, temperature had an impact on cellulose recovery with samples treated at 120 °C for all solvent concentrations and durations, demonstrating high cellulose recoveries of >85%. Treatments at 150 °C showed a similar high cellulose recovery of 79–94%, while fractionation at 180 °C showed the lowest cellulose recoveries at a range of 14–47%.
Table 1. Composition of Eucalyptus obliqua Residual Pulp Fractionated with Different GVL Concentrations, Temperatures, and Times as Presented by Trevorah et al.
Optimized conditions.
Cellulose recovery % = cellulose in RP (g)/cellulose in sawdust loaded into the reactor.
Hemicellulose was retained in the biomass fractionated at 120 °C but was completely hydrolyzed when fractionated at 150 and 180 °C (Table 1). This indicated that in all treatments some destruction of the lignin carbohydrate complex (LCC) had occurred, with the near-complete hydrolysis of the hemicellulose fractions under higher temperatures. Lignin content was reduced for all treatments, with the lowest level under the optimized conditions of 156 °C for 0.5 h and 50% GVL, where 5.5% lignin was detected, equating to lignin solubilization of 94.5% (Table 1). Only a minor increase in lignin solubilization occurred upon treatments at 180 °C, while cellulose experienced much lower recovery rates. This indicated that some lignin would be retained even when crystalline cellulose is hydrolyzed. This high lignin solubilization coupled with the hemicellulose at 150 °C indicated near-complete destruction of the LCC between the macrofibrils. SEM was used to investigate these changes in the structure following the fractionation.
2.2. Structural Changes
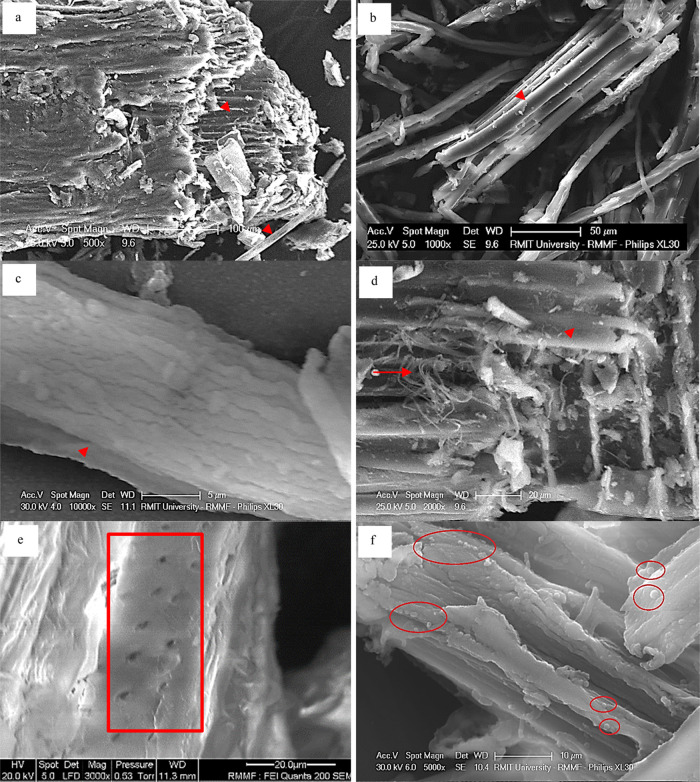
GVL fractionation significantly affected the structure of the Eucalyptus sawdust showing the destruction of the plant cell walls as it progressed into a residual pulp. Untreated Eucalyptus sawdust (Figure 1a) showed few pore openings with macrofibrils still bound together within the cell wall and LCC. Exposed macrofibrils and microfibrils were absent in the untreated sample. The untreated sawdust lacked surface micropore openings and lignin nanospheres because the material was strongly bound with no destruction of the LCC.
Figure 1.
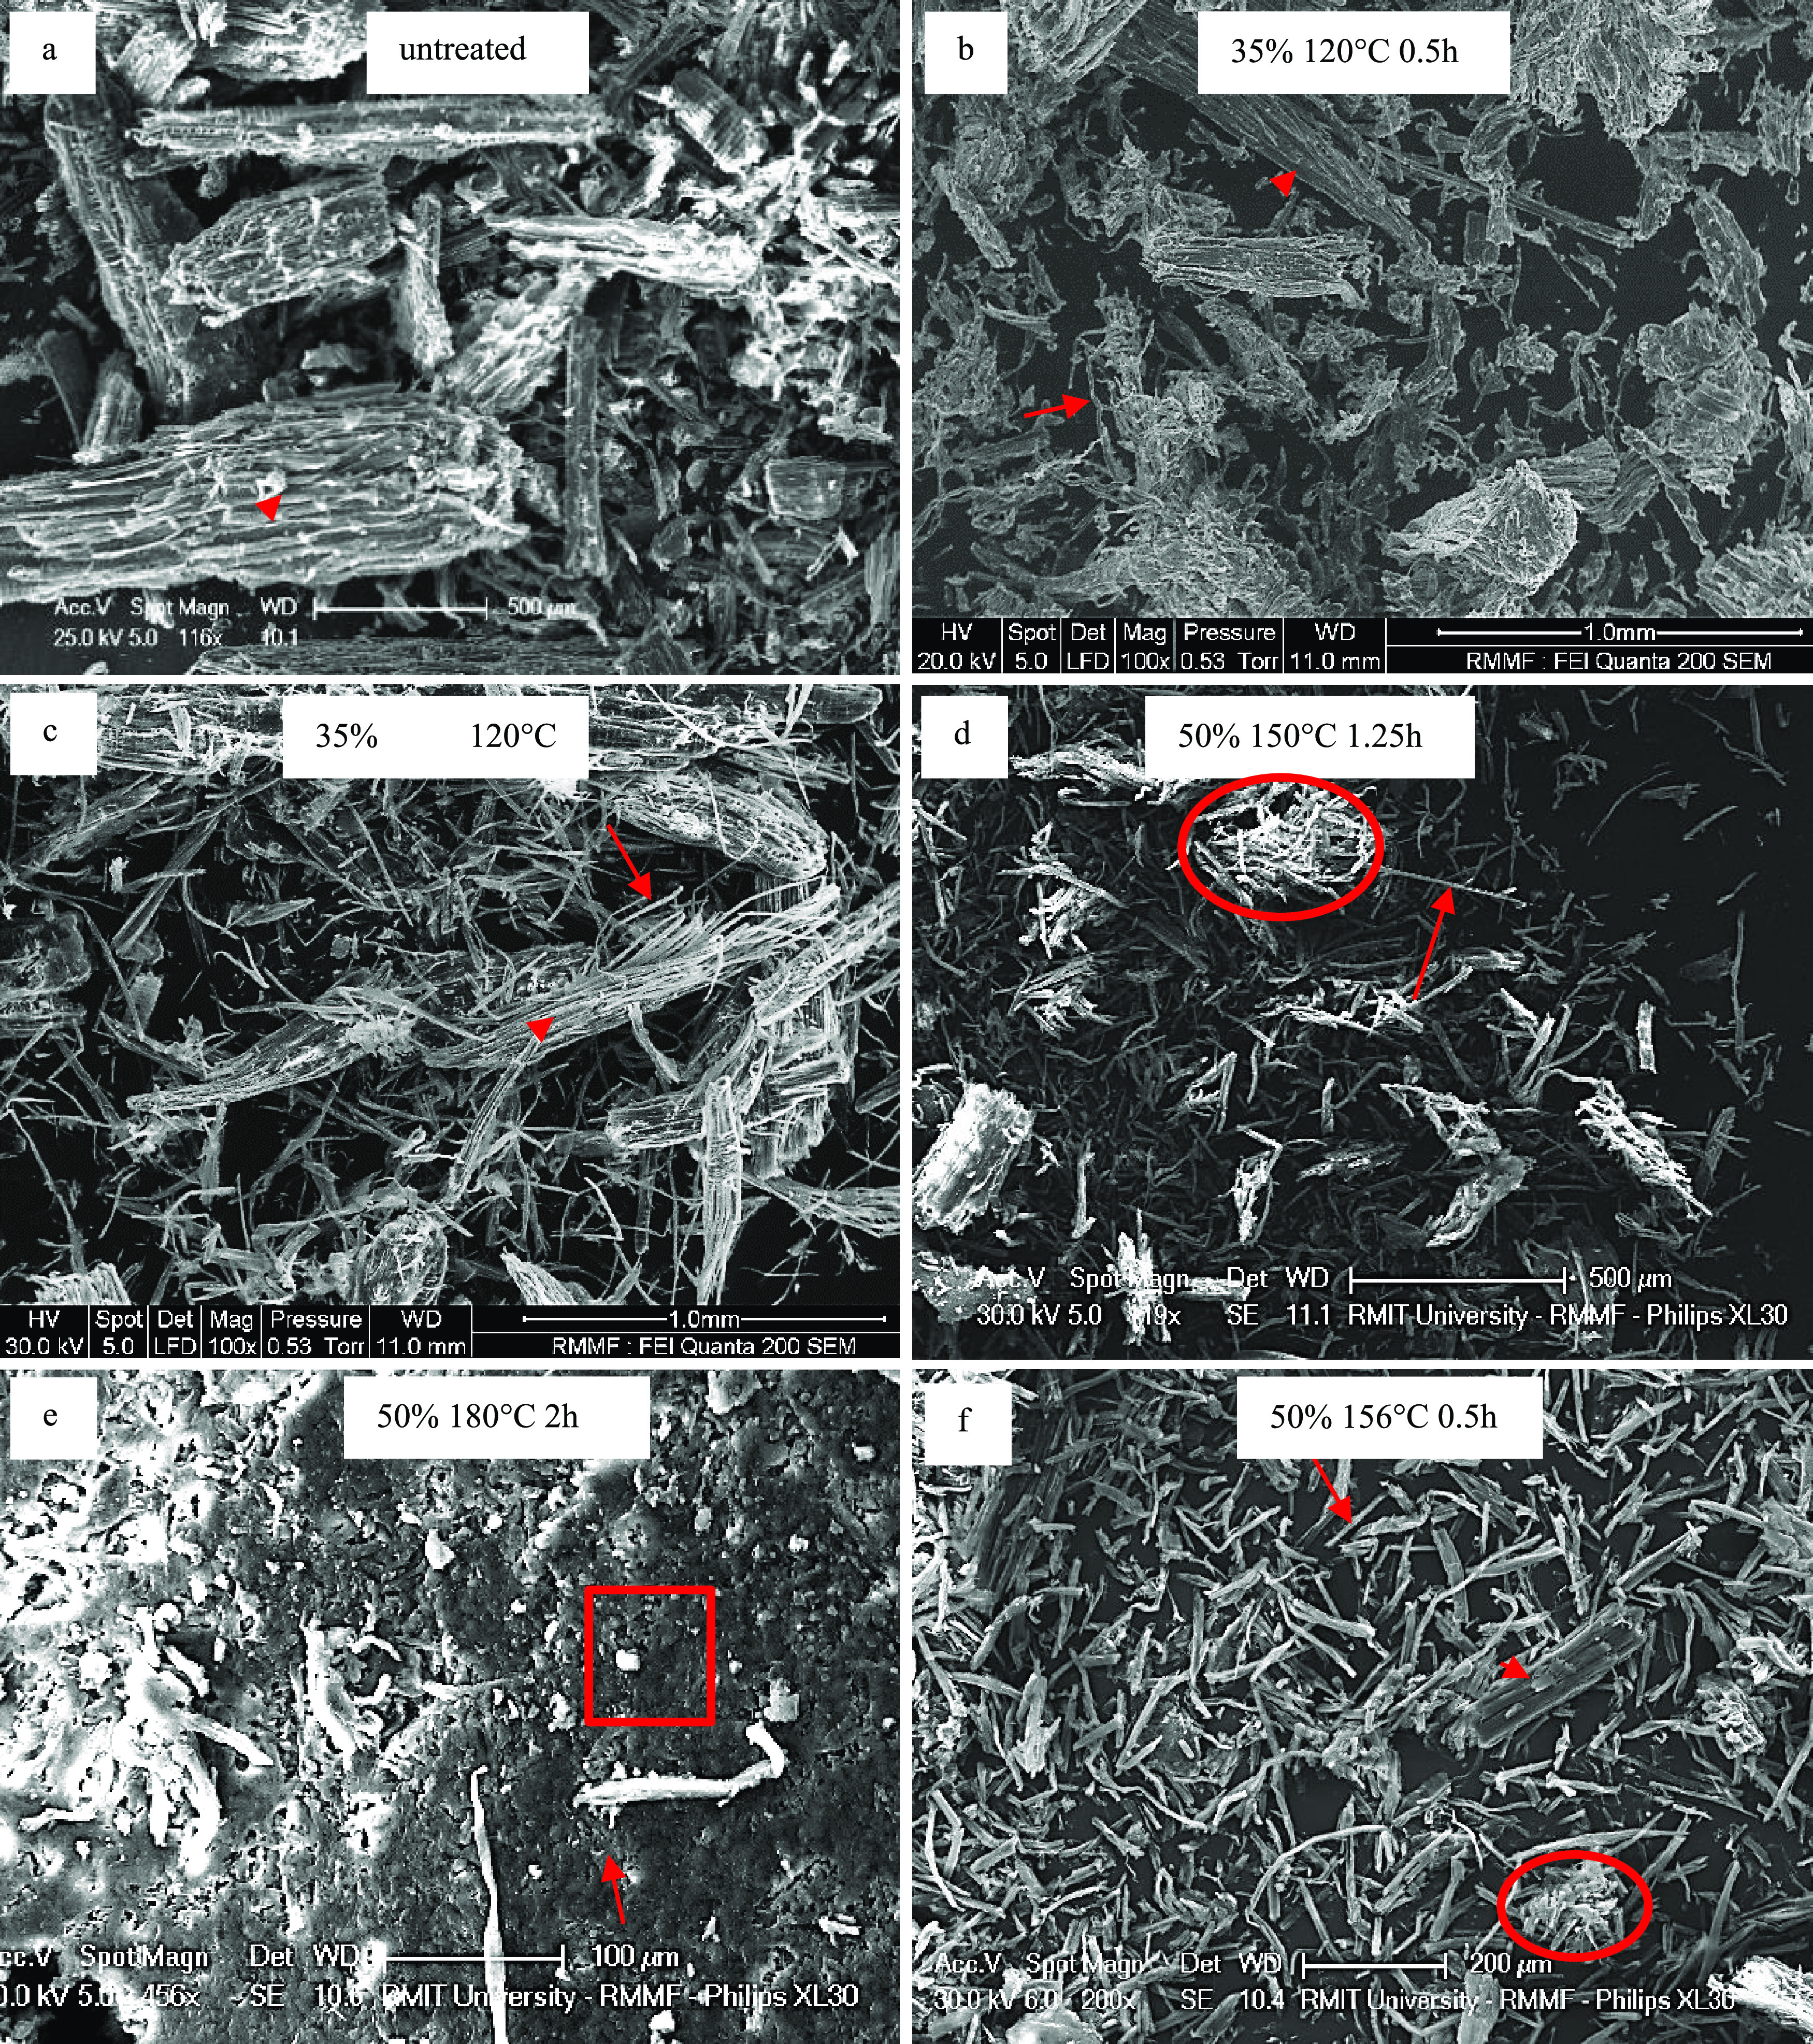
Eucalyptus sawdust micromorphology with untreated intact fibers (a); mostly intact fibers and some bound macrofibrils (b); partially bound macrofibrils (c); exposed long macrofibrils and clusters (d); fused macrofibrils (e); and abundantly exposed macrofibrils under optimized conditions (f). Bound microfibril are marked by arrowheads, microfibril clusters are marked by circles, exposed microfibril are marked by arrows, and fused macrofibrils are marked by a box.
The RP obtained after fractionation showed structural changes under all conditions tested, which is indicative of lignocellulose degradation. Temperature appeared to play a major role in impacting the structural features, with increasing temperatures leading to greater degradation of the LCC and eventually complete degradation of the macrofibrils. An increase in the solvent concentration and fractionation duration appeared to increase structural degradation, but these have a lesser impact compared to the temperature. The fractionations at 120 °C exhibited some destruction of the lignocellulose matrix freeing the macrofibrils (Figure 1c), but much of the material remained within the LCC as bound macrofibrils (Figure 1b). Generation of some surface micropores were observed and was likely due to partial lignin solubilization and hemicellulose hydrolysis, which were crucial for enzyme degradation.25
Fractionation at 150 °C led to the retention of the majority of whole macrofibrils, but significant destruction of the LCC was likely due to the high solubilization, as indicated in Table 1, leading to clustering of macrofibrils (Figure 1d). The LCC between the macrofibrils solubilized and transitioned from parallel linear intact aligned orientation (Figure 7b) to clustered macrofibril bundles (Figure 1d). Macrofibrils from fractionation at 150 °C generally showed shorter lengths of 50–400 μm (Figure 1d,f) compared to those from lower temperature treatments up to 1 mm lengths (Figure 1b,c). This significant reduction in the macrofibril length was likely due to hydrolysis occurring during the fractionation process.
Figure 7.
Distinguishing features of Eucalyptus sawdust showing intact macrofibrils within fibers (a); exposed macrofibrils of 5–20 μm width (b); exposed macrofibrils encasing microfibrils (c); exposed microfibrils of 0.1–2.0 μm width (d); with surface micropores of 1–5 μm (e); and lignin nanospheres of 0.5–2.0 μm (f). Macrofibrils are marked by arrowheads, microfibrils marked by arrows, surface micropores marked by a box, and nanospheres marked by circles.
The absence of macrofibrils when fractionations were performed at 180 °C indicated complete degradation of macrofibrils, and this was further confirmed by the presence of fused microfibrils (Figure 1e). This greater degradation is reflected by the higher levels of cellulose hydrolysis observed at 180 °C, causing greater destruction of the macrofibrils (Table 1). It is likely that the surface cellulose groups and amorphous cellulose would be hydrolyzed more readily than pure crystalline and paracrystalline cellulose. This was supported by NMR analysis, which showed that for the RP samples treated at 180 °C, the total crystallinity was generally higher than that for the RP produced at 120 and 150 °C treatments, mainly because much of the cellulose source was removed.
In many treated RP, the presence of clustered macrofibrils indicated a level of attraction between the macrofibrils with no significant degradation. Some cross-bonding between the exposed macrofibrils occurred, and it was possible that these free cellulose macrofibrils experienced van der Waals forces binding them together.3
Several lignin nanospheres were located on the surface of the material (Figure 7f). These were consistently observed in samples treated at 150 °C. It is likely that these nanospheres were coagulated lignin aggregates, which reprecipitated onto the microfibrils during the cooling process following fractionation. These results agreed with those reported by Xu et al.,27 who discovered lignin reprecipitation on fibers produced from Eucalyptus sawdust upon treatment with heated ethanol. The spheres they reported had a similar size and shape to those observed on the samples produced in this study using GVL fractionation. Therefore, it is probable that some of the residual lignin existed as these surface spheres, with a minimal negative impact on the potential of RP for bioethanol formation, which is supported by the high ethanol yields previously reported for GVL fractionated RP.21 Unfortunately, as the SEM data was only qualitative and as such unusable to determine accurate ratios of lignin existing as surface spheres and lignin remaining in the LCC. This is supported by the findings reported by Xu et al.,27 which indicated that the lignin existing on the outside of the fibrils had minimal impact on cellulase access and recovery efficiency. A recent study reported that it is possible to reduce the amount of reprecipitated lignin on the cellulose fibrils using a post fractionation solvent wash.18
Several impacts on the bioavailability of the RP may have occurred due to the morphological changes observed. The initial opening of micropores on the surface following treatment would likely aid in enzyme digestibility of the pulp.26 The destruction of the macrofibrils at 180 °C, as indicated by the highly interwoven closely bound microfibrils with less available surface and micropores, may have led to a lower enzymatic hydrolysis yield,21 where the RP fractionated using 35 and 42.5% GVL produced higher yields than those treated at 50%, 150 °C for 1.25 h despite the lower cellulose content.15
Several macrofibrils were encased finer microfibrils (Figure 7c) with 100–2000 nm widths (Figure 7d). The ability of the treatments to breakdown fibers without disruption of the macrofibrils may have value in the textile or manufacturing sector. However, to ascertain their potential for these applications, an understanding of their internal strength and bonding is required, which can be achieved thought NMR.
2.3. NMR of RP for Morphological Analysis of Cellulose Crystallinity
Cellulose exists in a range of crystalline states which impact the potential uses of the material. The results of NMR analysis provided an insight into how the GVL solution reacted with the macrofibrils and microfibrils. Macrofibrils emerged from plant cell walls that were only destroyed when fractionations were carried out at 150 °C, resulting in the removal of most of the lignin and hemicellulose. Subsequently, the macrofibrils within the cell walls retained their structure, but at shorter lengths. When fractionation temperatures increased, the macrofibril structure began to degrade, but highly crystalline cellulose remained in the RP. This suggested that the surrounding van der Waals forces and hydrogen bonding of the internal cellulose chains became more susceptible to hydrolysis with increasing fractionation severity. Consequently, the remaining material had significantly higher crystallinity, and this is likely to lead to a material with high strength and resilience. This strongly suggested that the fractionation process can be used to produce viable micro-crystalline cellulose or nanocrystalline cellulose.28
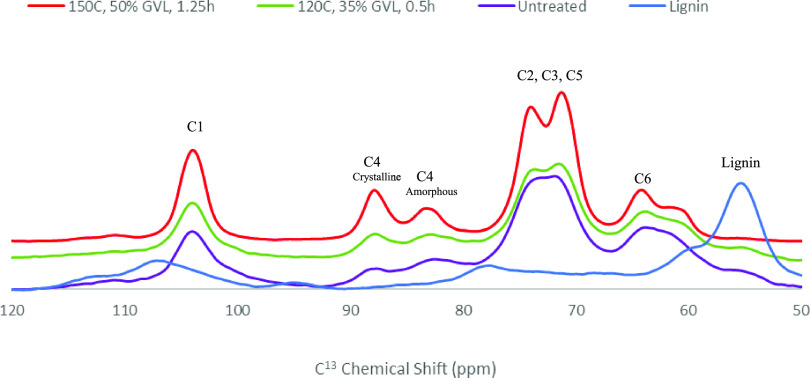
The NMR spectra generated an output for each of the six carbons in glucose that forms the cellulose chain with major peaks, particularly the C1 peak at 100–105 ppm, C4 peak at 80–90 ppm, C2, C3 and C5 peaks at 70–78 ppm, and C6 peak at 60–67 ppm (Figure 2). The main peaks of interest were at C4 and C1, associated with the β-1–4 glycosidic bond between the glucose units. This bond has a 180 °C twist, which is crucial for allowing interplanar hydrogen bonding. The C4 peak is used as it is easily separated into broader “crystalline” peaks appearing in the 86–92 ppm range and amorphous peaks appearing between 80 and 86 ppm.
Figure 2.
NMR spectra of untreated sawdust (purple), RP produced by fractionation at 120 °C, 35% for 0.5 h (green), and RP produced by fractionation at 150 °C, 50% for 1.25 h (red), and fractionated lignin (blue).
Untreated sawdust exhibited peaks for all carbon positions of glucose, and these were significantly sharpened following fractionation, increasing cellulose content from 39.6 up to 89.3% (Figure 2). Comparisons of the C4 peaks indicated that the untreated sawdust had low crystalline and amorphous cellulose that was increased in the treated sawdust. The crystalline peak increased relative to the amorphous peak and was proportional to the severity of the fractionation conditions, i.e., increasing temperature from 120 to 150 °C and GVL concentration from 35 to 50% (Figure 2). Fractionated lignin was included as a control and peaked only at 55 ppm and no other sawdust, treated or untreated, exhibited similar peaks. This indicated that lignin had a negligible impact on any carbon peaks (C1–C6) (Figure 2).
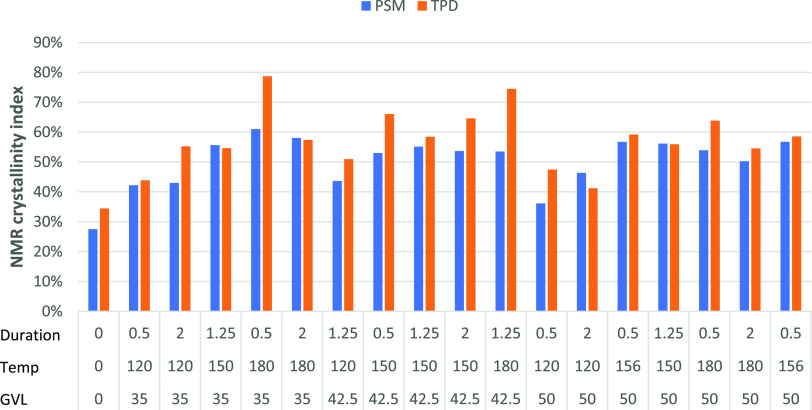
Further analysis of C4 peaks using PSM and TPD was performed to determine the cellulose crystallinity index (CrI). The CrI of the recovered biomass from the treated sawdust increased by a minimum of 0.15 and maximum up to 0.34 compared to untreated sawdust (Figure 3). There was a reduction in the CrI when the solvent concentration was increased. The duration of fractionation had a minor impact on crystallinity and was greatly outweighed by the effects of temperature and solvent concentration. Crystallinity increased with temperatures from 120 to 150 °C in proportion with to the increased levels of xylan hydrolysis. The xylan peak at 81.5 ppm was accounted for in the calculated “amorphous” component (Figure 2) and this may have led to the lower CrI values observed. Due to the xylan peak, deconvolution can allow for a more precise representation of how the crystallinity of the biomass changed following fractionation.
Figure 3.
Crystallinity index of Eucalyptus sawdust untreated and treated with GVL at different temperatures and durations measured by the peak separation method (PSM) and two-peak deconvolution (TPD).
The CrI obtained for the RP using PSM showed an increase of 82.6–121.7% when the saw dust was treated at 150 and 180 °C (Figure 3). Analysis of CrI exhibited a range of 0.35–0.79 in TPD and 0.28–0.60 in PSM (Figure 3). A comparison of PSM and TPD showed a general increase in CrI values with an average increase of 7 ± 2% in TPD over PSM (Figure 3). The results obtained using PSM and TPD in this study was significantly larger than those obtained in other studies, which found an increase in the crystallinity of cotton fibers pretreated with 60–90% GVL and 0.05 M H2SO4 at 170 °C for 1 h.24 They used PSM to calculate CrI and found an increase from 18.8 to 26–32.5% CrI, equating to 38–78% improvement in the crystallinity. This high CrI increase was likely due to the removal of non-crystalline polysaccharides during high-temperature treatment.7 On the contrary, Li et al.23 observed only minor increases of 3.1–5.6% in CrI by GVL treatments, as calculated by XRD. This lower reading may have been due to the impact of the microwave-based reactions on the structure compared to the standard heating method employed by Wu et al.24 and this study, which appears to have caused additional physical destruction of the crystalline matrix.
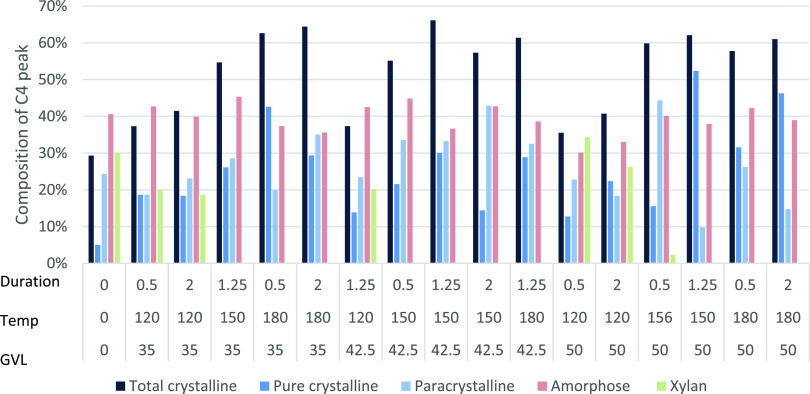
AD analysis differentiated between the cellulose crystallinity component types in untreated and treated sawdust pulp including crystalline, paracrystalline, and amorphous cellulose, and xylan (Figure 4). Total CrI from untreated sawdust was 29.3%, which increased to the highest at 66.1% upon GVL treatment. This increase in CrI due to GVL treatment agreed with PSM and TPD CrI calculations.
Figure 4.
NMR split peak deconvolution of Eucalyptus residual pulp treated with GVL at different times and durations to measure different crystallinity component types.
Crystalline cellulose increased after treatment, paracrystalline cellulose generally decreased after treatment, amorphous cellulose remained constant with and without treatment, while xylan was only present in the untreated and at lower temperature (120 °C) treatment. This is likely due to the hydrolysis of the amorphous cellulose components. Fractionation at temperatures >150 °C showed significant hydrolysis of the amorphous components producing CrI values over 54%, which was a significant increase of over 29.3% recorded for the untreated sawdust. Under optimized conditions (156 °C), both paracrystalline and amorphous cellulose exceeded 40% of the C4 peak.
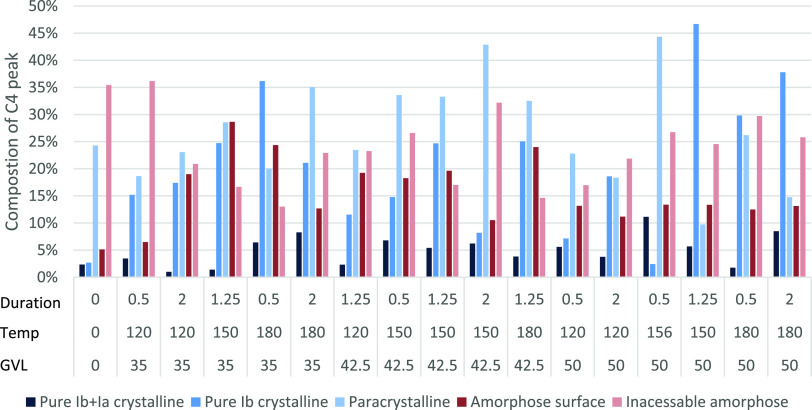
From the deconvolution analysis, untreated pure crystalline cellulose Iα + β was 2% that increased after some treatments, with the maximum at 11% at 156 °C (Figure 5). Pure crystalline Iβ cellulose was 2% untreated and increased with all treatments up to 47% at 150 °C. It also appeared that the pure crystalline fractions, particularly Iα + β had higher resistance to hydrolysis due to the large increase seen post fractionation (Figure 5). This finding supported the CrI calculations showing increased crystallinity after treatment (Figure 4). Pure crystalline material contained the strongest cross-bonding and was, therefore, the most resistant to hydrolysis during the fraction process.3
Figure 5.
Deconvoluted NMR of Eucalyptus residual pulp treated with GVL at different temperatures and duration to measure cellulose sub-components.
Paracrystalline cellulose started at 23% untreated and fluctuated in both directions after treatment ranging from 15 to 45%, depending on the GVL concentration and temperature (Figure 5). The paracrystalline component was largely unchanged, with only a minor increase in prevalence, but less increase when compared to those of the pure crystalline component. This indicated that during fractionation, partial hydrolysis of paracrystalline cellulose occurred; otherwise a similar increase in the pure crystalline component would have been observed. An exception is observed for the optimized samples, which showed a significant increase in the paracrystalline component. The highest CrI for both the PSM and TPD was obtained upon treatment with 35% GVL, at 180 °C for 0.5 h. This was not the highest CrI detected by AD analysis (Figure 4) treated with 35% GVL, at 180 °C for 2.0 h. Despite the high CrI value, cellulose was highly digestible with cellulosic ethanol yields reaching up to 94% in previous studies.21 This added weight to arguments against the hypothesis that crystallinity significantly inhibited cellulose enzymatic hydrolysis.4 Surface cellulose started at 5% untreated that increased with all treatments ranging from 6 to 29%. The paracrystalline and surface cellulose encasing the pure crystalline cellulose (internal) made it more probable for hydrolysis to occur at the cellulose chains on the surface before the internal chains.3
Inaccessible surface amorphous cellulose was reduced after fractionation, declining from 35.4% down to a minimum of 13.0%, with reductions in all but the most moderate of fractionation conditions. This suggested that the elementary cellulose fibrils experienced dispersion within the microfibril resulting in an increase in the exposed surface cellulose and reduction in the inaccessible surface. This may have been due to swelling during the thermal fractionation and destruction of the macrofibrils as observed by SEM. This reduction in inaccessible surface cellulose and a relative increase in accessible surface cellulose is in agreement with results observed for GVL-treated Loblolly pine reported in.29
2.4. FT-IR Analysis
FT-IR analysis was performed to gain a greater understanding of the existing bond network within the cellulose and lignocellulose matrix. Three samples were selected for FT-IR analysis: (1) untreated sawdust; (2) RP from the mid-point sample i.e., at 150 °C with 42.5% GVL for 1.25 h; and (3) RP treated under optimized conditions i.e., at 156 °C with 50% GVL for 0.5 h (Figure 6). As expected, many of the peaks associated with lignin groups, e.g., 1720, 1505, 1456, and 1320 cm–1 were reduced following the treatment at the mid-point and under optimum conditions. This mirrored the significant reduction in the lignin content after fractionation in other studies.30 With the removal of these peaks in the two RPs compared with the untreated sawdust, the peaks pertaining to cellulose became clearer with distinctive troughs, such as the alcohol groups on glucose at 1100 and 1050 cm–1.
Figure 6.
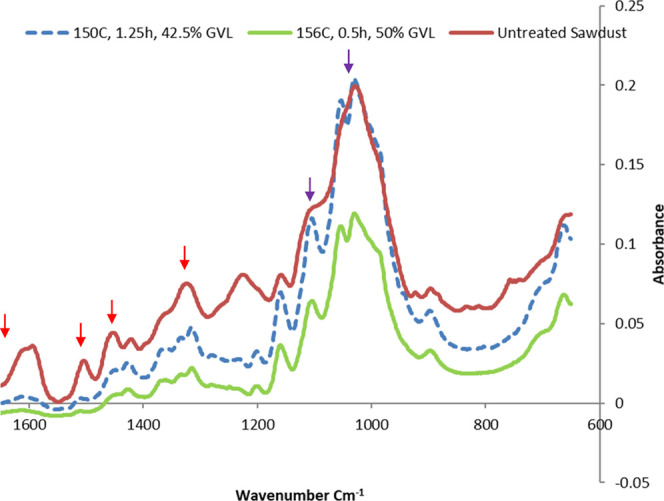
FT-IR spectra of untreated sawdust (dark red), RP produced by fractionation at 150 °C for 1.25 h with 42.5% GVL (blue), and RP produced by fractionation at 156 °C for 0.5 h with 50% GVL (green). Lignin peaks were observed at 1720, 1505, 1456, and 1320 cm–1 (red arrow) and cellulose peaks were observed at 1100 and 1050 cm–1 (purple arrow).
Using FT-IR results, the O’Conner lateral order index (LOI) was calculated to provide a crystallinity index, which was calculated by the absorbance ratio A1425/A894.14 The analysis showed that untreated sawdust had a LOI of 59.1%, while those under optimal and mid-point conditions had a LOI of 37.6 and 45%, respectively. The calculated TCI ratio of A1375/A2900 also showed a reduction with that for the untreated biomass being 4.8, while those under optimal and mid-point conditions had TCI ratios of 1.0 and 3.4, respectively. Optimal conditions produced a very small peak for A2900 when compared with the untreated and mid-point samples. This was interesting as it showed an inverse result compared to NMR analysis and may be due to the removal of large amounts of lignin and hemicellulose during the treatments reducing the baseline of the peaks over the 1200–800 cm–1 range lowering the A894 value and leading to an apparent reduction in crystallinity. The change to lignin based on the FT-IR spectra were consistent with what was observed by chemical compositional analysis, but both LOI and TCI measurements did not align with the NMR results. This was supported by many claims indicating a transition away from FT-IR based CrI measurements in favor of NMR- or XRD-based techniques.4
3. Conclusions
The results showed that GVL fractionation significantly increased the crystallinity of the RP. Significant hydrolysis of amorphous hemicellulose chains occurred during the treatment, where more than 99% removal of hemicellulose was observed for fractionations carried out at temperatures of 150 °C or higher.
During fractionation, the cellulose macrofibrils were freed from the LCC and became isolated, with macrofibrils held together by surface attraction in a new nonlinear aggregated cluster. With increasing severity of fractionation conditions, these macrofibrils degraded, leaving only consolidated microfibrils.
Significant removal of the amorphous surface cellulose due to the hydrolysis of cellulose fibrils was observed, which resulted in 114–129% increase in the CrI. Fractionation had no major impact on the internal pure crystalline component, whereas amorphous cellulose was hydrolyzed, similar to paracrystalline cellulose, though only to a lesser extent. Finally, the fractionation process generated a pulp of high cellulose content and crystallinity; therefore, it had high potential for application as an advanced biopolymer.
4. Materials and Methods
4.1. Materials
E. obliqua sawdust was collected from north-central Victoria, Australia, and via bladed IKA mill and passed through a 1 mm2 sieve. All chemicals used were of analytical grade, and purchased from Sigma-Aldrich (Australia).
4.2. GVL Fractionation and Compositional Analysis
The recovered pulp (RP) was produced according to the procedures described previously.21 Fractionations were carried out with GVL solutions with 35, 42.5, and 50% GVL w/w and 50 mM H2SO4.34 Reactions were performed at temperatures of 120, 150, and 180°C and durations of 0.5, 1.25, and 2.0 h. A 200 mL miniclave stainless steel pressure reactor (Bϋchiglas) was used for GVL fractionation. The reactor was fitted with a ceramic band heater, which was connected to an internal thermocouple to control and maintain the reaction temperature. Sawdust and GVL at a ratio of 1:10 g/mL were mixed using a magnetic stirrer (IKA). Reaction time was measured from when the designated temperature was reached. Following fractionation, the reactor contents were filtered by vacuum filtration (Whatman 1, 90 mm). The solid material was washed with 150 mL of Milli-Q water to remove fractionation liquor and the solid material was then stored at 3 °C for further analysis.
Compositional carbohydrate analysis to determine cellulose, xylan, galactan, and lignin was performed using methods described in NREL TP:510-42618.31 Moisture and ash were determined according to the NREL method TP 510-42622.32 Ethanol soluble extractives were determined using ASE 350 with ethanol extraction sequence as per NREL TP 510-42619.33 Monosaccharides were then measured using a Hitachi HPLC connected to a refractive index detector, equipped with a Phenomenex Rezex RPM-Monosaccharide Pb2+ column (300 × 7.8 mm2) and a Phenomenex RNM Carbohydrate Na+ (300 × 7.8 mm2) (Phenomenex) column (connected in series) with a (50 × 7.8 mm2) RPM Guard column. Both columns were maintained at 85 °C with a flow of 0.3 mL/min of degassed Milli-Q water, and the refractive index detector was maintained at 40 °C. During all runs, a minimum of one saccharide and recovery standard was analyzed within the batch. All compositions are reported in % (w/w) dry weight.
The E. obliqua sawdust was 39.6% w/w cellulose, 10.6% w/w xylan, and 33.2% w/w lignin. RP generated from GVL fractionation had cellulose content ranging from 34.6 to 89.3%. RP produced with the optimized fractionation parameters reported by the response surface modeling performed by Trevorah et al.21 had a biomass composition of 89.3% w/w cellulose and 5.5% w/w lignin (Table 1). All fractionation conditions showed a reduction in xylan with only the RP from treatments at 120°C retaining detectable levels. The lignin content was reduced in all RP, ranging from 5.5 to 28.5% w/w. Lignin solubilization of 78–94% (g/g) was observed for fractionations at 150 °C, and the highest lignin solubilization of 94% was observed for sawdust fractionated 156 °C for 0.5 h and 50% GVL.21
4.3. SEM
Scanning electron microscopy (SEM) was used to provide qualitative structural information on the impact of GVL fractionation on the lignin carbohydrate complex (LCC) and cellulose of the RP remaining after fractionation. Assessments of sawdust fiber structure were based on intact macrofibrils within fibers (Figure 7a), exposed macrofibrils of 5–20 μm width (Figure 7b) as described by Zhao et al., (2007),35 exposed macrofibrils encasing microfibrils (Figure 7c), exposed microfibrils of 0.1–2.0 μm width (Figure 7d), with surface micropores of 1–5 μm (Figure 7e) and lignin nanospheres of 0.5–2.0 μm (Figure 7f). Images for macro observation were obtained using a FEI Quanta 200 ESEM operating in a low vacuum and detailed fibril structural images were obtained using a Philips XL30 SEM. The untreated Eucalyptus sawdust and the fractionated pulps were air-dried at 30 °C for 24 h prior to loading onto the stub and imaged with a carbon coating.
4.4. NMR
NMR spectra of untreated Eucalyptus sawdust were acquired on an Agilent DD2 500 MHz NMR spectrometer equipped with a 4 mm magic angle spinning (MAS) solid-state triple resonance probe at a 5 kHz sample spin rate. The 13C spectra were acquired using a cross-polarization pulse with 8000 scans using a delay time of 3.5 s, 1 ms contact time, and an acquisition time of 40 ms. Three methods for measuring the crystallinity index (CrI) were used with the expectation of a minor increase in crystallinity due to the hydrolysis of some cellulose during fractionation.
First, the NMR-peak separation method (PSM) determined crystalline and amorphous cellulose as per Park et al.9 Second, the NMR two-peak deconvolution (TPD) method was used to determine which of the “crystalline” and “amorphous” peaks were deconvoluted as separate peaks and the CrI was calculated as the crystalline area over combined crystalline and amorphous areas. These methods allowed for the generation of a CrI for a quick comparison of the impacts of the fractionation process on the crystallinity but did not provide detailed information on the internal changes. The third method was an advanced deconvolution (AD) of the NMR spectra to define the ratios of the peak areas at 86–92 ppm for crystalline and 80–86 ppm for amorphous cellulose morphologies. Deconvolution of the spectra generated by NMR was undertaken using the software Origin 64 bit (2016). Using the model presented by Larsson et al.,11 a detailed investigation of each morphology of cellulose was assessed: peaks located at 89.2 ppm for cellulose Iα, 88.9 ppm for cellulose I(α + β), 88.4 ppm for paracrystalline cellulose, 87.6 ppm for cellulose Iβ, 84.0 ppm, 82.6 ppm for the accessible surface of cellulose, 82.9 ppm for inaccessible cellulose, and xylan at 81.5 ppm. Peaks for Iα could only be successfully deconvoluted within samples at a high cellulose concentration of ∼90% w/w as cellulose Iα was less in Eucalyptus wood pulp fibrils.36 Lorentzian models were used for cellulose I(α), I(α + β), and I(β) while all other peaks used Gaussian modeling.29 This deconvolution allowed for a pure crystalline and paracrystalline component calculation.12 Compensation to account for the slight increase due to lignin at 75 ppm was used to achieve a baseline across the C4 peak to the base of the C2, C3, and C5 peaks. This was done across all deconvolutions samples to ensure lignin would not impact cellulose and xylose measurements.
4.5. FT-IR Analysis
Samples were dried in a 35 °C oven, then ground using a mortar and pestle, and compressed and analyzed utilizing a Perkin Elmer Spectrum 100 FT-IR within the 650–4000 cm–1 spectrum for 64 scans.37 The measurement of lateral order index (LOI) change in the crystalline state was calculated in terms of A1430/A893.13 This method encountered issues with interference due to close peaks occurring from aromatic rings stretching at 1422 cm–1.38 The FT-IR total crystallinity index (TCI) was also analyzed using two measurements of CH stretching with a ratio of A1375/A2900.39 The analysis investigated the absorbance peaks at 1218, 1268 (C–O guaiacyl rings), and 1315 cm–1 (C–O of syringyl rings), as well as the presence of troughs at 1140–1111 cm–1.40,4140,41 This could signify a drop in S unit lignin.38,41,42 Reduction in the presence of S and G group lignin peaks following fractionation were investigated to provide greater insight into lignin solubilization.
Acknowledgments
This work was supported by Smartwood Timber Moulding, Bacchus March, Victoria. The authors thank Professor Spencer J. Williams, School of Chemistry, Melbourne University, for his support and Jessica Phippen for graphical assistance.
Author Contributions
R.M.T., T.H., R.B., and M.Z.O. have contributed equally. The manuscript was written through contributions from all authors. All authors have given approval to the final version of the manuscript.
The authors declare no competing financial interest.
References
- Australia’s State of the Forests Report 2018; ABARES: Canberra, December, CC BY 4.0.
- Zugenmaier P. Conformation and packing of various crystalline cellulose fibers. Prog. Polym. Sci. 2001, 26, 1341–1417. 10.1016/S0079-6700(01)00019-3. [DOI] [Google Scholar]
- Chundawat S. P.; Bellesia G.; Uppugundla N.; da Costa Sousa L.; Gao D.; Cheh A. M.; Agarwal U. P.; Bianchetti C. M.; Phillips G. N. Jr.; Langan P.; Balan V.; Gnanakaran S.; Dale B. E. Restructuring the crystalline cellulose hydrogen bond network enhances its depolymerization rate. J. Am. Chem. Soc. 2011, 133, 11163–11174. 10.1021/ja2011115. [DOI] [PubMed] [Google Scholar]
- Karimi K.; Taherzadeh M. J. A critical review of analytical methods in pretreatment of lignocelluloses: Composition, imaging, and crystallinity. Bioresour. Technol. 2016, 200, 1008–1018. 10.1016/j.biortech.2015.11.022. [DOI] [PubMed] [Google Scholar]
- Sun Y.; Cheng J. Hydrolysis of lignocellulosic materials for ethanol production: a review. Bioresour. Technol. 2002, 83, 1–11. 10.1016/S0960-8524(01)00212-7. [DOI] [PubMed] [Google Scholar]
- Islam M. S.; Kao N.; Bhattacharya S. N.; Gupta R.; Choi H. J. Potential aspect of rice husk biomass in Australia for nanocrystalline cellulose production. Chin. J. Chem. Eng. 2018, 26, 465–476. 10.1016/j.cjche.2017.07.004. [DOI] [Google Scholar]
- Foston M. Advances in solid-state NMR of cellulose. Curr. Opin. Biotechnol. 2014, 27, 176–184. 10.1016/j.copbio.2014.02.002. [DOI] [PubMed] [Google Scholar]
- Newman R. H.; Davidson T. C. Molecular conformations at the cellulose-water interface. Cellulose 2004, 11, 23–32. 10.1023/B:CELL.0000014778.49291.c6. [DOI] [Google Scholar]
- Park S.; Baker J. O.; Himmel M. E.; Parilla P. A.; Johnson D. K. Cellulose crystallinity index: measurement techniques and their impact on interpreting cellulase performance. Biotechnol. Biofuels 2010, 3, 10 10.1186/1754-6834-3-10. [DOI] [PMC free article] [PubMed] [Google Scholar]
- Wickholm K.; Larsson P. T.; Iversen T. Assignment of non-crystalline forms in cellulose I by CP/MAS 13C NMR spectroscopy. Carbohydr. Res. 1998, 312, 123–129. 10.1016/S0008-6215(98)00236-5. [DOI] [Google Scholar]
- Larsson P.; Hult E.; Wickholm K.; Pettersson E.; Iversen T. CPrMAS 13C-NMR spectroscopy applied to structure and interaction studies on cellulose I. Solid State Nucl. Magn. Reson. 1999, 15, 31–40. 10.1016/S0926-2040(99)00044-2. [DOI] [PubMed] [Google Scholar]
- Zuckerstätter G.; Schild G.; Wollboldt P.; Röder T.; Weber H. K.; Sixta H. The Elucidation Of Cellulose Supramolecular Structure By 13C CP-MAS NMR. Lenzinger Ber. 2009, 87, 38–46. [Google Scholar]
- Fan M.; Dai D.; Huang B.. Fourier Transform Infrared Spectroscopy for Natural Fibres. In Fourier Transform - Materials Analysis; Salih S. M., Ed.; IntechOpen, 2012; Chapter 3. [Google Scholar]
- O’Connor R. T.; DuPré E. F.; Mitcham D. Applications of Infrared Absorption Spectroscopy to Investigations of Cotton and Modified Cottons. Text. Res. J. 1958, 28, 382–392. 10.1177/004051755802800503. [DOI] [Google Scholar]
- Kim S. H.; Lee C. M.; Kafle K. Characterization of crystalline cellulose in biomass: Basic principles, applications, and limitations of XRD, NMR, IR, Raman, and SFG. Korean J. Chem. Eng. 2013, 30, 2127–2141. 10.1007/s11814-013-0162-0. [DOI] [Google Scholar]
- Yuan T.-Q.; Sun S.-N.; Xu F.; Sun R.-C. Characterization of lignin structures and lignin-carbohydrate complex (LCC) linkages by quantitative 13C and 2D HSQC NMR spectroscopy. J. Agric. Food Chem. 2011, 59, 10604–10614. 10.1021/jf2031549. [DOI] [PubMed] [Google Scholar]
- Zhang Z.; Harrison M.; Rackemann D.; Doherty W.; O’Hara I. Organosolv pretreatment of plant biomass for enhanced enzymatic saccharification. Green Chem. 2016, 18, 360–380. 10.1039/C5GC02034D. [DOI] [Google Scholar]
- Lê H. Q.; Pokki J.-P.; Borrega M.; Uusi-Kyyny P.; Alopaeus V.; Sixta H. Chemical recovery of γ-Valerolactone/Water Biorefinery. Ind. Eng. Chem. Res. 2018, 57, 15147–15158. 10.1021/acs.iecr.8b03723. [DOI] [PMC free article] [PubMed] [Google Scholar]
- Luterbacher J. S.; Alonso D. M.; Rand J. M.; Questell-Santiago Y. M.; Yeap J. H.; Pfleger B. F.; Dumesic J. A. Solvent-enabled nonenyzmatic sugar production from biomass for chemical and biological upgrading. ChemSusChem 2015, 8, 1317–1322. 10.1002/cssc.201403418. [DOI] [PubMed] [Google Scholar]
- Fang W.; Sixta H. Advanced biorefinery based on the fractionation of biomass in y-valerolactone and water. ChemSusChem 2015, 8, 73–76. 10.1002/cssc.201402821. [DOI] [PubMed] [Google Scholar]
- Trevorah R. M.; Huynh T.; Vancov T.; Othman M. Z. Bioethanol potential of Eucalyptus obliqua sawdust using gamma-valerolactone fractionation. Bioresour. Technol. 2018, 250, 673–682. 10.1016/j.biortech.2017.11.084. [DOI] [PubMed] [Google Scholar]
- Sun W.; Trevorah R.; Othman Z. Fractionation of spnt liqure from organosolv-pretreatment using lignin incompatible extraction. Bioresour. Technol. 2018, 269, 255–261. 10.1016/j.biortech.2018.08.097. [DOI] [PubMed] [Google Scholar]
- Li S. X.; Li M. F.; Yu P.; Fan Y. M.; Shou J. N.; Sun R. C. Valorization of bamboo by gamma-valerolactone/acid/water to produce digestible cellulose, degraded sugars and lignin. Bioresour. Technol. 2017, 230, 90–96. 10.1016/j.biortech.2017.01.041. [DOI] [PubMed] [Google Scholar]
- Wu M.; Yan Z. Y.; Zhang X. M.; Xu F.; Sun R. C. Integration of mild acid hydrolysis in γ-valerolactone/water system for enhancement of enzymatic saccharification from cotton stalk. Bioresour. Technol. 2016, 200, 23–28. 10.1016/j.biortech.2015.09.111. [DOI] [PubMed] [Google Scholar]
- Sun S. N.; Chen X.; Tao Y. H.; Cao X. F.; Li M. F.; Wen J. L.; Nie S. X.; Sun R. C. Pretreatment of Eucalyptus urophylla in γ-valerolactone/dilute Acid System for Removal of Non-cellulosic Components and Acceleration of Enzymatic Hydrolysis. Ind. Crops Prod. 2019, 132, 21–28. 10.1016/j.indcrop.2019.02.004. [DOI] [Google Scholar]
- Karimi K.; Taherzadeh M. J. A Critical Review on Analysis in Pretreatment of Lignocelluloses: Degree of Polymerization, Adsorption/desorption, and Accessibility. Bioresour. Technol. 2016, 203, 348–356. 10.1016/j.biortech.2015.12.035. [DOI] [PubMed] [Google Scholar]
- Xu Y.; Li K.; Zhang M. Lignin precipitation on the pulp fibers in the ethanol-based organosolv pulping. Colloids Surf., A 2007, 301, 255–263. 10.1016/j.colsurfa.2006.12.078. [DOI] [Google Scholar]
- Phanthong P.; Guan G.; Ma Y.; Hao X.; Abudula A. Effect of ball milling on the production of nanocellulose using mild acid hydrolysis method. J. Taiwan Inst. Chem. Eng. 2016, 60, 617–622. 10.1016/j.jtice.2015.11.001. [DOI] [Google Scholar]
- Sannigrahi P.; Miller S. J.; Ragauskas A. J. Effects of organosolv pretreatment and enzymatic hydrolysis on cellulose structure and crystallinity in Loblolly pine. Carbohydr. Res. 2010, 345, 965–970. 10.1016/j.carres.2010.02.010. [DOI] [PubMed] [Google Scholar]
- Santoni I.; Callone E.; Sandak A.; Sandak J.; Dire S. Solid state NMR and IR characterization of wood polymer structure in relation to tree provenance. Carbohydr. Polym. 2015, 117, 710–721. 10.1016/j.carbpol.2014.10.057. [DOI] [PubMed] [Google Scholar]
- Sluiter A.; Hames B.; Ruiz R.; Scarlata C.; Sluiter J.; Templeton D.; Crocker D.. Determination of Structural Carbohydrates and Lignin in Biomass; N.R.E. Laboratory, U.S. Department of Energy, Denver, 2008. [Google Scholar]
- Sluiter A.; Hames B.; Ruiz R.; Scarlata C.; Sluiter J.; Templeton D.. Determination of Ash in Biomass; NREL, Battelle, 2008. [Google Scholar]
- Sluiter A.; Ruiz R.; Scarlata C.; Sluiter J.; Templeton D.. Determination of Extractives in Biomass; NREL, Battelle, 2008. [Google Scholar]
- Walker T. W.; Kuch N.; Vander Meulen K. A.; Clewett C. F. M.; Huber G. W.; Fox B. G.; Dumesic J. A. Solid-state NMR studies of solvent-mediated, acid-catalyzed woody biomass pretreatment for enzymatic conversion of residual cellulose. ACS Sustainable Chem. Eng. 2020, 8, 6551–6563. 10.1021/acssuschemeng.0c01538. [DOI] [PMC free article] [PubMed] [Google Scholar]
- Zhao H.; Kwak J.; Conradzhang Z.; Brown H.; Arey B.; Holladay J. Studying cellulose fiber structure by SEM, XRD, NMR and acid hydrolysis. Carbohydr. Polym. 2007, 68, 235–241. 10.1016/j.carbpol.2006.12.013. [DOI] [Google Scholar]
- Hult E.-L.; Larsson P. T.; Iversen T. Cellulose fibril aggregation - an inherent property of kraft pulps. Polymer 2001, 42, 3309–3314. 10.1016/S0032-3861(00)00774-6. [DOI] [Google Scholar]
- Łojewska J.; Miśkowiec P.; Łojewski T.; Proniewicz L. M. Cellulose oxidative and hydrolytic degradation: In situ FTIR approach. Polym. Degrad. Stab. 2005, 88, 512–520. 10.1016/j.polymdegradstab.2004.12.012. [DOI] [Google Scholar]
- Gierlinger N.; Goswami L.; Schmidt M.; Burgert I.; Coutand C.; Rogge T.; Schwanninger M. In Situ FT-IR Microsocopic study on enzymatic treatment of poplar wood cross sections. Biomacromolecules 2008, 9, 2194–2201. 10.1021/bm800300b. [DOI] [PubMed] [Google Scholar]
- Salehian P.; Karimi K.; Zilouei H.; Jeihanipour A. Improvement of biogas production from pine wood by alkali pretreatment. Fuel 2013, 106, 484–489. 10.1016/j.fuel.2012.12.092. [DOI] [Google Scholar]
- Kim T. H.; Kim J. S.; Sunwoo C.; Lee Y. Y. Pretreatment of corn stover by aqueous ammonia. Bioresour. Technol. 2003, 90, 39–47. 10.1016/S0960-8524(03)00097-X. [DOI] [PubMed] [Google Scholar]
- Pandey K. K. A study of the chemical structure of soft and hardwood and wood polymers by FTIR spectroscopy. J. Appl. Polym. Sci. 1999, 71, 1969–1975. . [DOI] [Google Scholar]
- Schwanninger M.; Rodrigues J. C.; Pereira H.; Hinterstoisser B. Effects of short-time vibratory ball milling on the shape of FT-IR spectra of wood and cellulose. Vib. Spectrosc. 2004, 36, 23–40. 10.1016/j.vibspec.2004.02.003. [DOI] [Google Scholar]


