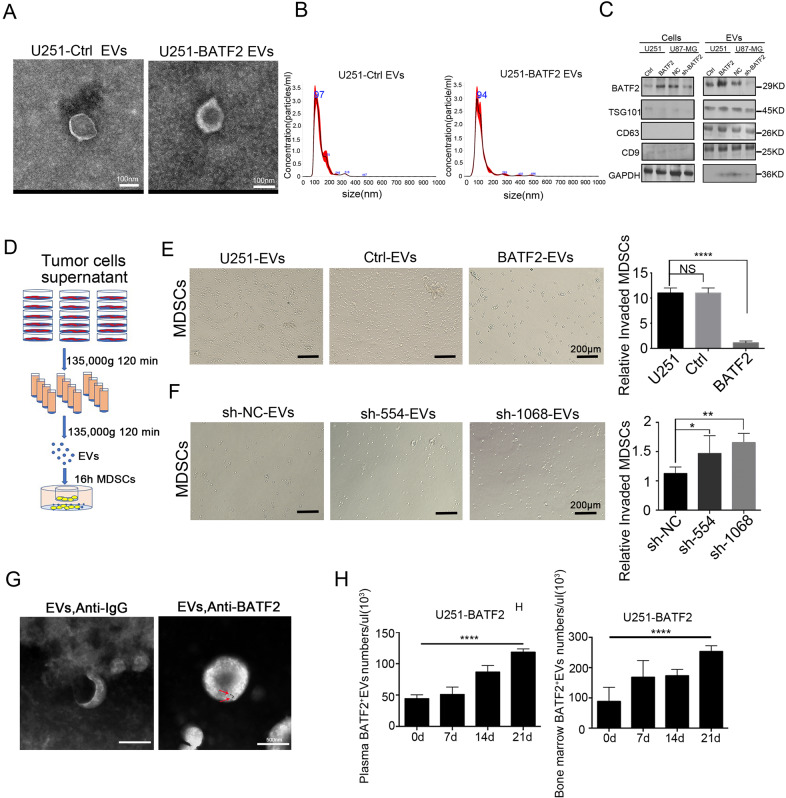
Fig. 3. EVs from BATF2-overexpressing cell lines inhibit MDSCs chemotaxis in vitro.
A Images of U251-Ctrl and U251-BATF2 derived EVs from supernatant were taken by scanning Transmission electron microscopic analysis. Scale bars, 100 nm. B Nanoparticle tracking analysis results from representative U251-Ctrl and U251-BATF2 derived EVs samples are shown (1:100 dilution with particle-free PBS). C The protein levels of BATF2, TSG101, CD9, CD63, and GAPDH in U251-Ctrl, U251-BATF2, U87-sh-NC, U87-sh-BATF2 tumour cells-derived EVs and tumour cells were assessed by western blotting. D Experimental design for Matrigel invasion assay of tumour-derived EVs activated and recruiting MDSCs. E Representative images and statistics of invaded MDSCs cells after co-culture with U251, U251-Ctrl, U251-BATF2 tumour-derived EVs. Scale bars, 200 μm (n = 3, independent experiment, *p < 0.05, **p < 0.01, ***p < 0.001). F Representative images and statistics of invaded MDSCs cells after co-culture with U87-sh-NC, U87-sh-554, U87-sh-1068 tumour-derived EVs. Scale bars, 200 μm (n = 3, independent experiment, *p < 0.05, **p < 0.01, ***p < 0.001). G Transmission electron microscopy of GBM patient plasma EVs stained with primary anti-BATF2 and gold-conjugated secondary antibody. The arrow indicates EV staining positive for BATF2. Scale bars, 100 nm. H Exo-Counter detection of BATF2+EVs in plasma and bone marrow of U251-BATF2-bearing mice in 0, 7, 14, 21 days (n = 3, independent experiment, *p < 0.05, **p < 0.01, ***p < 0.001).

