

Abstract
Background:
Chronic inflammation is known to cause alterations in vascular homeostasis that directly affects blood vessel morphogenesis, angiogenesis, and tissue permeability. These phenomena have been investigated and exploited for targeted drug delivery applications in the context of cancers and other disease processes. Vascular pathophysiology and its associated genes and signaling pathways, however, have not been systematically investigated in patients with chronic rhinosinusitis (CRS). Understanding the interplay between key vascular signaling pathways and top biomarkers associated with CRS may facilitate the development of new targeted delivery strategies and treatment paradigms. Herein, we report findings from a gene meta-analysis to identify key vascular pathways and top genes involved in CRS.
Methods:
Proprietary software (Illumina BaseSpace Correlation Engine) and open-access data sets were used to perform a gene meta-analysis to systematically determine significant differences between key vascular biomarkers and vascular signaling pathways expressed in sinonasal tissue biopsies of controls and patients with CRS.
Results:
Thirteen studies were initially identified, and then reduced to five after applying exclusion principle algorithms. Genes associated with vasculature development and blood vessel morphogenesis signaling pathways were identified to be overexpressed among the top 15 signaling pathways. Out of many significantly upregulated genes, the levels of pro angiogenic genes such as early growth response (EGR3), platelet endothelial cell adhesion molecule (PECAM1) and L-selectin (SELL) were particularly significant in patients with CRS compared to controls.
Discussion:
Key vascular biomarkers and signaling pathways were significantly overexpressed in patients with CRS compared to controls, suggesting a contribution of vascular dysfunction in CRS pathophysiology. Vascular dysregulation and permeability may afford opportunities to develop drug delivery systems to improve efficacy and reduce toxicity of CRS treatment.
Keywords: Chronic Rhinosinusitis, meta-analysis, vascular permeability, neoangiogenesis, signaling pathways, drug delivery
Introduction
Chronic Rhinosinusitis (CRS) is one of the most prevalent and debilitating chronic inflammatory diseases, affecting approximately 12% of the U.S. population [1]. In the last 15 years, therapeutic advancements have focused on the local delivery of topical corticosteroids through the development of drug-eluting stents and nasal aerosol delivery devices [2, 3]. Despite the improvements in topical delivery systems, approximately 20% of patients with CRS require surgical intervention to control their disease [4]. The development of new, safe, and targeted systemic delivery methods would greatly benefit those patients who fail topical medical management.
Chronic inflammation is known to cause alterations in vascular homeostasis that directly affects blood vessel morphogenesis, angiogenesis, and tissue permeability. Enhanced vascular permeability and hyperpermeability has been exploited in inflammatory pathologies for improved drug delivery to target tissue [5]. Further defining and characterizing vascular pathophysiology and its associated genes and signaling pathways, however, has not been systematically investigated in patients with CRS. Understanding the interplay between key vascular signaling pathways and top biomarkers associated with CRS may facilitate the development of new systemically delivered treatment paradigms, whereby the drug concentration is increased at the target site with reducing off-target accumulation.
Prior investigations have utilized gene array analysis as a tool to evaluate inflammatory gene expression patterns, identify potential new biomarkers, and define endotypes of subpopulations in individual cohorts of patients with CRS [6]. These studies have begun to shed light on many meaningful transcription products involved in CRS, including inflammatory cytokines and genes implicated in neoplastic processes, apoptosis inhibition, and fibrosis. Microarray analysis additionally enables genome-wide comparisons between disease and non-disease states. Recent advancements in bioinformatics have made microarray meta-analysis widely available through the use of proprietary software, enabling the comparison of key signaling pathways and biomarkers across gene array data sets to facilitate new qualitative and quantitative studies including pathophysiology-focused research investigations, biomarker discovery, and improved drug development. [7].
In this manuscript we report a meta-analysis on publicly available gene-array biosets to characterize the interplay between key vascular signaling pathways and top biomarkers associated with CRS. To our knowledge, this is the first meta-analysis that specifically examines large sample analysis of vascular gene expression in CRS. We hypothesized that patients with CRS will demonstrate unique vascular pathways and associated genes compared to patients without CRS.
Materials and Methods:
Software and apps
Illumina BaseSpace Correlation Engine (San Diego, CA) was used to run this meta-analysis study [8]. The correlation engine software has several applications that allow the user to derive a consensus gene signature and/or discover sets of commonly regulated biogroups based on a collection of individual biosets (Figure 1). Correlation Engine filters the top results based on overall statistical significance and consistency of the enrichment, or overlap, between the set of genes. Combination of these genes makes up each biogroup within a selected curated study for the meta-analysis. Based on these factors, the most significant biogroup or gene is given a score of 100, and all other biogroups and genes are normalized to the top-ranked biogroup or gene. The top 15 biogroups were first selected based on their overall statistical significance. The top upregulated and downregulated genes were then selected, and their biological roles and associated signaling pathways in the human body were identified.
Figure 1: Screenshot of BaseSpace software used for meta-analysis.

The solid red box represents the software. The dashed red box represents the different apps that are available for use, such as meta-analysis and body atlas. The dotted red box highlights the 5 biosets that were identified after exclusion criteria was applied.
Inclusion and exclusion criteria
The inclusion-exclusion principle is a combinatorial method to include and determine the size of a bioset or the probability of inclusion and exclusion based on a specific query. An inclusion criteria algorithm was employed to search for previously performed and publicly available studies that investigated the genomic variations in CRS via a microarray or RNA-seq platform. The terms ‘Chronic Rhinosinusitis’ and ‘Chronic sinusitis’ were searched as the primary boundary condition. These terms were selected on the basis of their definition: ‘chronic inflammation of the mucous membrane in the nose.’ A total of 13 studies were identified after searching for ‘Chronic Rhinosinusitis’ and ‘Chronic sinusitis’. An exclusion principle algorithm was then employed to narrow down the studies to fit our selection criteria, which is explained further in Figure 2. The secondary boundary condition for the exclusion principle was set to compare data generated from only sinonasal biopsies collected from patients with CRS vs. healthy or non-disease control tissues, and not any other type of tissue, mucus or blood.
Figure 2: Exclusion criteria.

Flow chart depicting the number of biosets that were identified and the criteria that were applied to reject studies that did not fit the scope of our meta-analysis objective.
The total number of 13 studies were identified after the application of the primary and secondary boundary conditions in the Illumina Correlation Engine. We then filtered the studies based on type of organism: homo sapiens, to avoid any any discrepancies arising from the organism type. This filtered the total number of studies down to 12 as one of the gene array studies was perfomed in sinonasal tissue obtained from mouse. Further, we selected only those studies that offered RNA expression results and discarded any studies comparing somatic mutations or DNA copy numbers to avoid correlations or comparisons of different genetic material, which can result in false data interpretation. To further select a more homogenous CRS population, phenotypic variations and/or variation in cell type in CRS were excluded from the analysis. Patients with other heterogenous causes of CRS such as aspirin-exacerbated respiratory disease, cystic fibrosis or studies comparing nucleophilic CRS vs eosinophilic CRS were excluded in this meta-analysis, to avoid cross-contamination between different phenotypes of CRS. This rendered the total number of studies available for comparison to 5. The Correlation Engine named each selected curated study for meta-analysis as a ‘Bioset’. . After applying the exclusion principle algorithm, 5 biosets were identified for meta-analysis (Figure 2 and Table 1), which were further manually evaluated for inclusion and exclusion criteria fit.
Table 1: Five identified biosets for meta-analysis.
The numbers of genes reported in each bioset are also listed.
Bioset summaries
The bioset summaries were copied from Illumina BaseSpace Correlation Engine by clicking on the ‘Bioset summary’ link for each study.
Statistics:
BaseSpace Correlation Engine uses a proprietary algorithm: Fisher running algorithm and the Fisher exact test [8–12]. These algorithms are used to compute statistical significance between different biosets and genes that are differentially expressed. The most important two parameters in each bioset are the activity level of a gene (fold change) and the number of biosets in which that particular gene is active. The most significant gene (combination of fold change and p-values) was given a score of 100, and subsequent significant genes were normalized and given a score out of 100.
Results:
Selected biosets
After screening the identified biosets using inclusion and exclusion principle algorithms, the top 5 biosets shown below (1–5) were identified and manually assessed to ensure inclusion and exclusion criteria fit. The number of genes that were studied or reported by each respective research group was also identified (Table 1).
1. CRS Patients vs_ non-CRS patients
Study: Patients with CRS, Series GSE10406
Analysis summary: Genes with statistically significant differences between test and control conditions. Statistical analyses were performed on log-scale data.
Statistical tests: Parametric tests were performed, assuming unequal variances (Welch t-test) and a p-value cutoff less than 0.05. An additional fold change of 1.2 was applied to generate the final list of genes.
Gene filtering: Genes that had a mean normalized test and control intensity falling below the 20th percentile of the combined normalized signal intensities were removed. The intensities reported below correspond to the mean normalized test and control data rescaled to a median of 500.
Platform: Affymetrix GeneChip Human HG_U133 Plus 2.0
2. CRS patients _vs_ non-CRS patients
Study: Patients with CRS, Series GSE72713
Analysis summary: Reads are aligned to the human genome (UCSC iGenomes hg19, download date 5/23/2014) using STAR 2.3 and RefSeq annotations. Reads are assigned to a gene if the read (or both reads in a pair) uniquely and fully map to the exons of one gene. The differential gene expression between the control and test sample groups were generated based on these counts using DESeq2. The base-mean read count, fold change, p-value, and q-value (Benjamini-Hochberg adjusted) were derived from this analysis. The median FPKMs per group were calculated separately based on normalized read counts, number of aligned reads, and the full gene length. The genes were filtered with a q-value cutoff of less than 0.05. An additional fold change cutoff of +/−1.2 was applied to generate the final list of genes.
Platform: Illumina iGenome UCSC, hg19, March 6, 2013 RefSeq
3. CRS patients _vs_ non-CRS patients
Study: Patients with CRS, Series GSE36830
Analysis summary: Genes with statistically significant differences between control and test samples. Statistical analyses were performed on log scale data.
Statistical tests: Parametric tests were performed, assuming unequal variances (Welch t-test) and a p-value cutoff less than 0.05. An additional fold change of 1.2 was applied to generate the final list of genes.
Gene filtering: Genes that had a mean normalized test and control intensity falling below the 20th percentile of the combined normalized signal intensities were removed. The intensities reported below correspond to the mean normalized test and control data rescaled to a median of 500.
Platform: Affymetrix GeneChip Human HG_U133 Plus 2.0
4. CRS patients vs non-CRS patients
Study: Patients with CRS, Series GSE36830
Analysis summary: Genes with statistically significant differences between test and control conditions. Statistical analyses were performed on log-scale data.
Statistical tests: Parametric tests were performed, assuming unequal variances (Welch t-test) and a p-value cutoff less than 0.05. An additional fold change of 1.2 was applied to generate the final list of genes.
Gene filtering: Genes that had a mean normalized test and control intensity falling below the 20th percentile of the combined normalized signal intensities were removed. The intensities reported below correspond to the mean normalized test and control data rescaled to a median of 500.
Platform: Affymetrix GeneChip Human HG_U133 Plus 2.0
5. CRS patients vs non-CRS patients
Study: Patients with CRS, Series GSE36830
Analysis summary: Genes with statistically significant differences between test and control conditions. Statistical analyses were performed on log-scale data.
Statistical tests: Parametric tests were performed, assuming unequal variances (Welch t-test) and a p-value cutoff less than 0.05. An additional fold change of 1.2 was applied to generate the final list of genes.
Gene filtering: Genes that had a mean normalized test and control intensity falling below the 20th percentile of the combined normalized signal intensities were removed. The intensities reported below correspond to the mean normalized test and control data rescaled to a median of 500.
Platform: Affymetrix GeneChip Human HG_U133 Plus 2.0
Top 15 selected signaling pathways and biological roles
As a result of bioset analysis, multiple signaling pathways were determined to be overexpressed (Figure 3 and Table 2), with the most relevant signaling pathways being related to immune response activation, including ‘regulation of cell activation’ and ‘innate immune response.’ Among the top 15 selected pathways, a large number of genes associated with ‘vascular development’ and ‘blood vessel morphogenesis’ were found to be significantly different between controls and patients with CRS, suggesting the importance of these pathways in CRS vascular pathophysiology.
Figure 3: List of the top 15 overexpressed signaling pathways in CRS, as analyzed by meta-analysis of 5 gene array biosets.
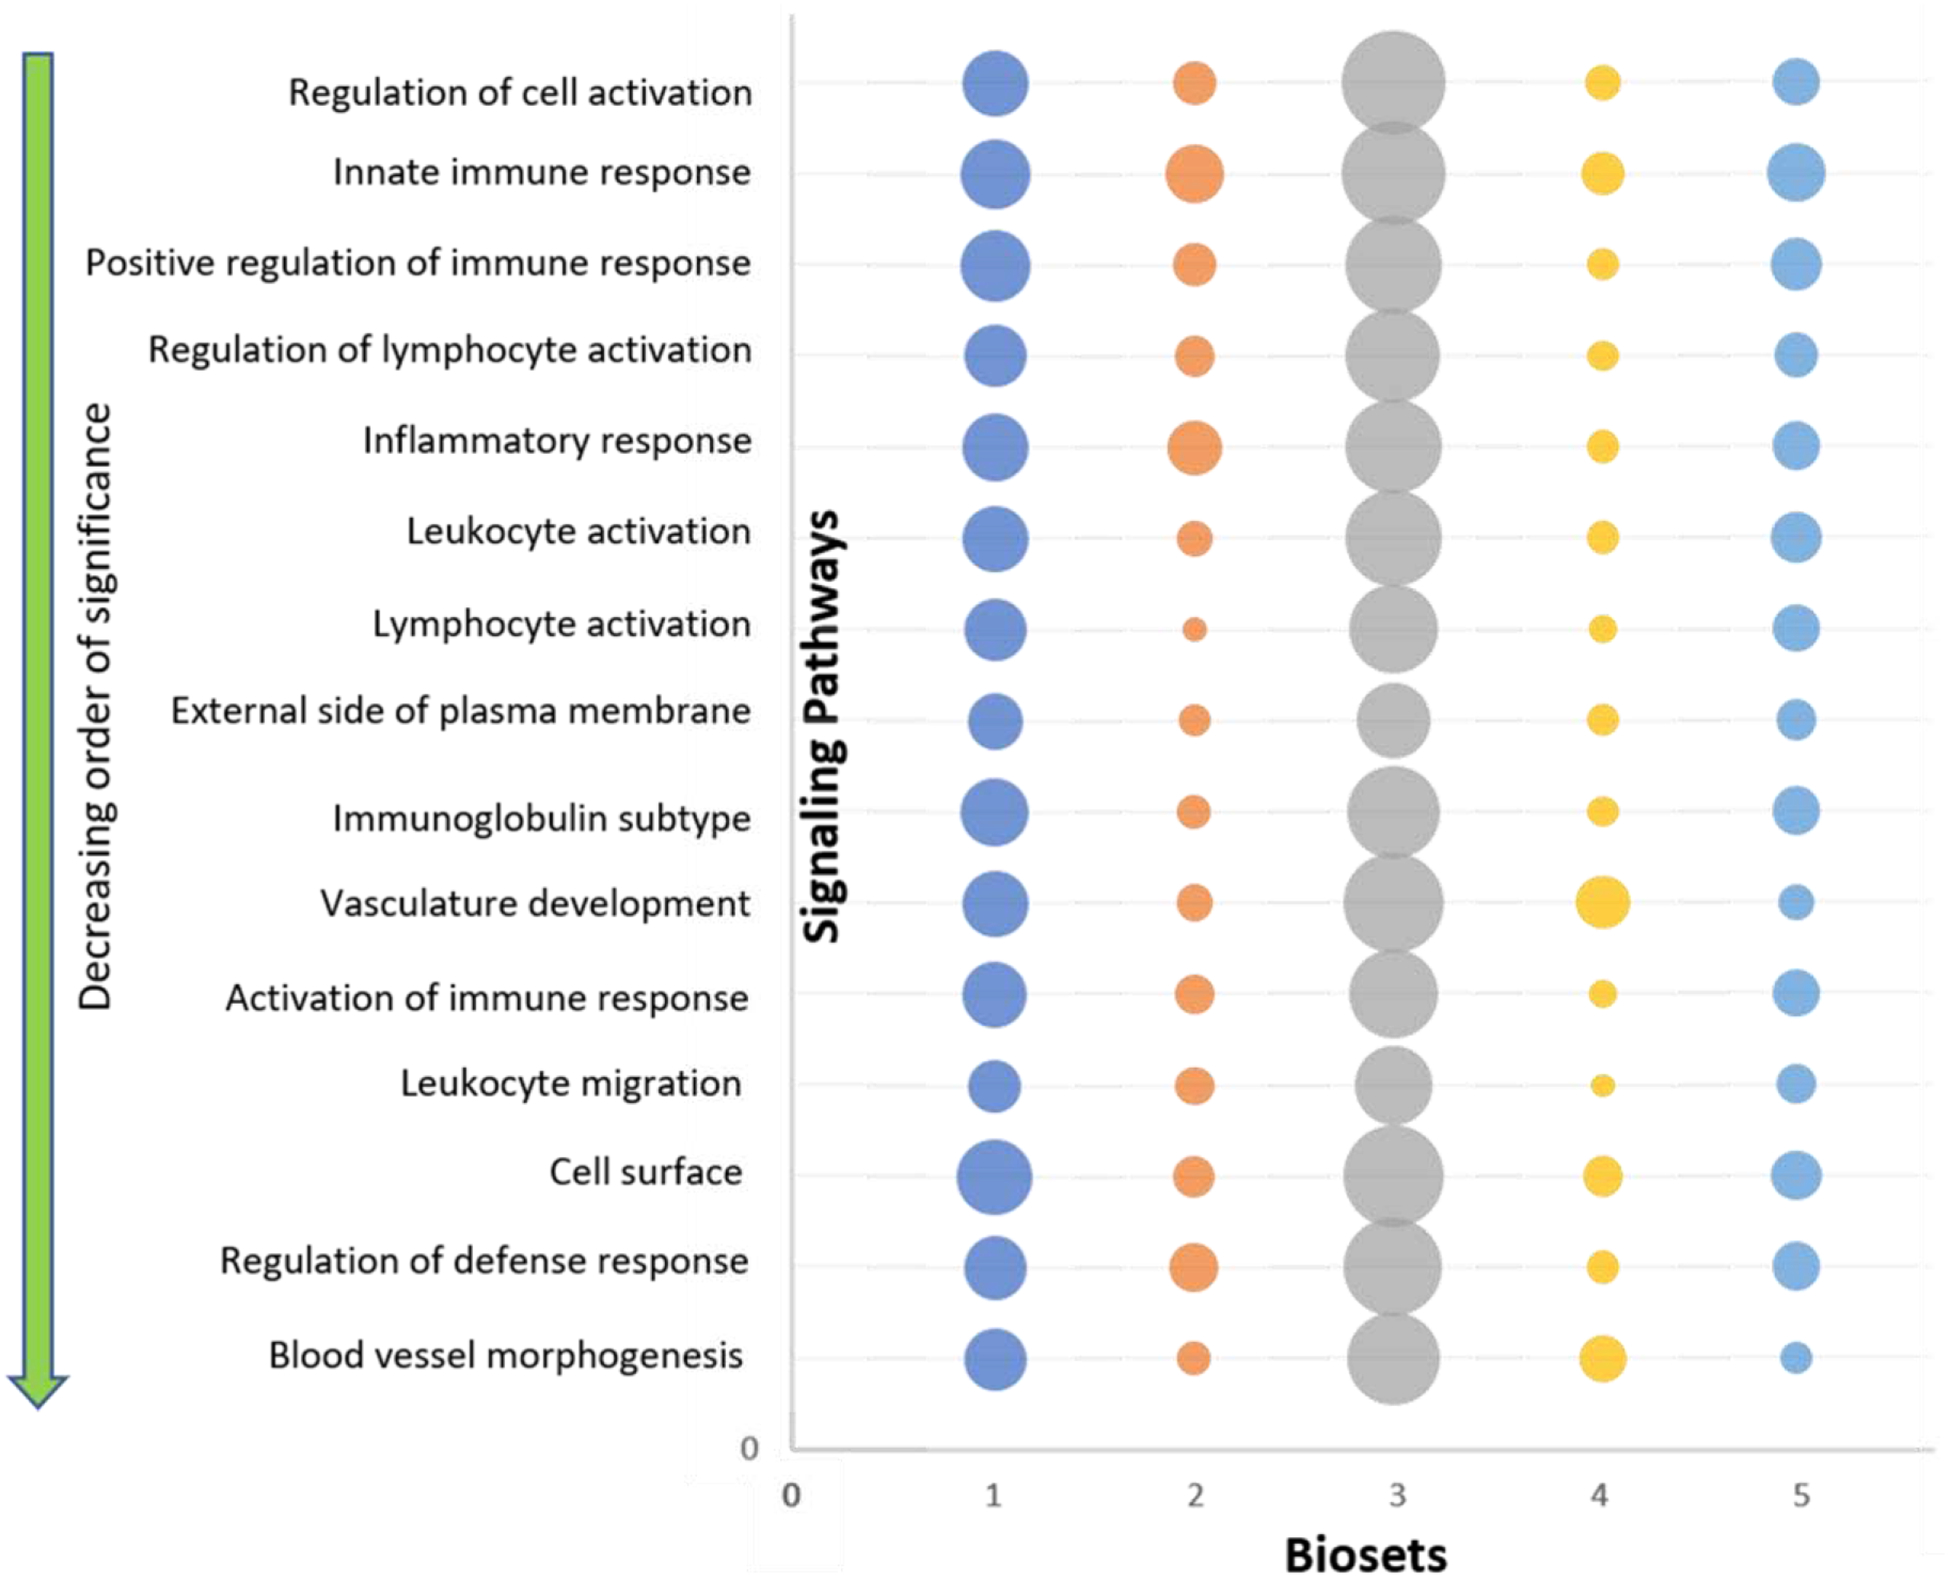
The top 15 signaling pathways are shown in decreasing order of significance starting from the top. The size of circle represents the number of genes studied in each respective bioset (For scale, smallest circle represents 11 genes and the largest circle represents 164 genes).
Table 2: Top 15 signaling pathways identified.
The top 15 signaling pathways and their biological roles. The score given to each pathway is based on Correlation’s Engine statistical analysis.
| Biogroup | Score | Role in the human body |
|---|---|---|
| Regulation of cell activation | 100 | Modulates the frequency, rate or extent of cell activation, the change in the morphology or behavior of a cell resulting from exposure to an activating factor such as a cellular or soluble ligand [50] |
| Innate immune response | 99 | Defense responses mediated by germline encoded components that directly recognize components of potential pathogens [51] |
| Positive regulation of immune response | 96 | Activates or increases the frequency, rate or extent of the immune response, the immunological reaction of an organism to an immunogenic stimulus [52] |
| Regulation of lymphocyte activation | 89 | Any process that modulates the frequency, rate or extent of lymphocyte activation [53] |
| Inflammatory response | 87 | The immediate defensive reaction (by vertebrate tissue) to infection or injury caused by chemical or physical agents. The process is characterized by local vasodilation, extravasation of plasma into intercellular spaces and accumulation of white blood cells and macrophages [16] |
| Leukocyte activation | 85 | A change in morphology and behavior of a leukocyte resulting from exposure to a specific antigen, mitogen, cytokine, cellular ligand, or soluble factor [54] |
| Lymphocyte activation | 75 | Change in morphology and behavior of a lymphocyte resulting from exposure to a specific antigen, mitogen, cytokine, chemokine, cellular ligand, or soluble factor [55] |
| External side of plasma membrane | 74 | The side of the plasma membrane that is opposite to the side that faces the cytoplasm [56] |
| Immunoglobulin subtype | 72 | The basic structure of immunoglobulin (Ig) molecules is a tetramer of two light chains and two heavy chains linked by disulphide bonds [57] |
| Vasculature development | 72 | The process whose specific outcome is the progression of the vasculature over time, from its formation to the mature structure. [58] |
| Activation of immune response | 69 | Any process that initiates an immune response [59] |
| Leukocyte migration | 68 | The movement of a leukocyte within or between different tissues and organs of the body [60] |
| Cell surface | 68 | The external part of the cell wall and/or plasma membrane [61] |
| Regulation of defense response | 68 | Any process that modulates the frequency, rate or extent of a defense response [62] |
| Blood vessel morphogenesis | 64 | The process in which the anatomical structures of blood vessels are generated and organized [63] |
‘Vasculature development’ and ‘Blood vessel morphogenesis’ pathways
We compared the significance of the ‘vasculature development’ and ‘blood vessel morphogenesis’ pathways amongst all of the biosets (Figure 4). Both signaling pathways were found to be significant across all 5 biosets (confidence threshold set to 95%). We then identified the top 10 genes that were significantly differentially expressed in each bioset with respect to ‘vasculature development’ (Table 3) and ‘blood vessel morphogenesis’ (Table 4) pathways. Several genes such as early growth response 3 (EGR3), transforming growth factor beta 2 (TGFB2), 15-hydroxyprostaglandin dehydrogenase (HPGD) and collagen and calcium binding EGF domains 1 (CCBE1) were found to be significantly elevated in more than one bioset.
Figure 4. Significance of signaling pathways.

(A) Significance of ‘vasculature development’ across different biosets. (B) Significance of ‘blood vessel morphogenesis’ across different biosets.
Table 3:
The top 10 differentially expressed genes in each bioset within the ‘vasculature development’ pathway.
| Bioset | Top 10 differentially expressed genes associated with vasculature development |
|---|---|
| 1 | SFRP1, ERRFI1, HPGD, EGR3, PLAT, ENPEP, ZFAND5, RHOB, CEACAM1, NR4A1 |
| 2 | SLIT2, CCBE1, IL8, SFRP4, ADM, SAT1, PDE3B, SERPINE1, SOCS3, TYMP |
| 3 | SCG2, EGF, NKX3–1, CCL2, THY1, NDP, HMOX1, CCBE1, THBS1, GJC1 |
| 4 | CITED2, HPGD, EGR3, HPGD, APOLD1, NOX1, NDP, CXCL12, TGFB2, PECAM1 |
| 5 | CCBE1, SCG2, HPGD, TGFB2, BMPER, SFRP2, FGF9, ITGB1, MYLK, PECAM1 |
Table 4:
The top 10 differentially expressed genes in each bioset within the ‘blood vessel morphogenesis’ pathway.
| Bioset | Top 10 differentially expressed genes associated with blood vessel morphogenesis |
|---|---|
| 1 | HPGD, EGR3, PLAT, ENPEP, RHOB, CEACAM1, NR4A1, TIPARP, TFAP2B, VEGFA |
| 2 | SLIT2, CCBE1, IL8, ADM, SAT1, PDE3B, SERPINE1, TYMP, WARS, FGF9 |
| 3 | SCG2, EGF, CCL2, THY1, HMOX1, CCBE1, THBS1, GJC1, GJA5, GREM1 |
| 4 | CITED2, HPGD, EGR3, APOLD1, NOX1, CXCL12, TGFB2, HHEX, NOTCH3, MCAM |
| 5 | CCBE1, SCG2, HPGD, TGFB2, BMPER, TGFB2, SFRP2, FGF9, ITGB1, MYLK |
Top upregulated and downregulated genes
We analyzed the top up - and downregulated genes identified in our meta-analysis and screened for associations to vasculature-related signaling pathways (Tables 5 and 6). The top overexpressed genes implicated in pro-angiogenic and vasculature signaling pathways included: parathyroid hormone-like hormone (PTHLH), CD27 molecule (CD27), carcinoembryonic antigen-related cell adhesion molecule (CEACAM21), platelet/endothelial cell adhesion molecule (PECAM1), ADAM metallopeptidase domain (ADAM19), and L-Selectin (SELL). The top downregulated genes related to pro-angiogenic and vasculature signaling pathways included: solute carrier family 6 (SLC6), coiled coil domain (CCD), epidermal growth factor-like (EGFL), and mucin 15 (MUC15).
Table 5: The top upregulated genes.
The gene abbreviation is followed by a score which is provided by the BaseSpace correlation engine. The descriptive name of the gene is also mentioned. Corresponding role of the gene in our body is also listed.
| Gene | Score | Description | Role in the human body | Implicated in | ||
|---|---|---|---|---|---|---|
| Inflammatory diseases | Drug delivery | |||||
| 1 | CCL19 | 94 | Chemokine (C-C motif) ligand 9 | Chemokines are family of secreted proteins involved in immunoregulatory and inflammatory processes [64] | Yes [64] | Yes [65] |
| 2 | NOX2 | 83 | NADPH oxidase 2 | Primary component of the microbicidal oxidase system of phagocytosis [66] | Yes [67] | Yes [67] |
| 3 | FBLN1 | 82 | Fibulin 1 | It is a secreted glycoprotein that mediates platelet adhesion via binding fibrinogen [68] | Yes [69] | Yes [70] |
| 4 | HLA-DPA1 | 80 | Major histocompatibility complex, class II, DP alpha 1 | Plays a central role in the immune system by presenting peptides derived from extracellular proteins [71] | NA | NA |
| 5 | TMEM176B | 76 | Transmembrane protein 176B | Protein coding gene that plays a role in the maturation of dendritic cells [72] | NA | Yes [73] |
| 6 | LST1 | 75 | Leukocyte specific transcript 1 | Can inhibit the proliferation of lymphocytes [74] | Yes [75] | NA |
| 7 | PTHLH | 75 | Parathyroid hormone-like hormone | Regulates endochondral bone development and epithelial-mesenchymal interactions during the formation of mammary glands and teeth [76] | Yes [77] | NA |
| 8 | TDO2 | 71 | Tryptophan 2,3-dioxygenase | Plays a role in catalyzing the first and rate-limiting step in major tryptophan metabolism [78] | Yes [79] | Yes [79] |
| 9 | CCL13 | 69 | Chemokine (C-C motif) ligand 13 | Cytokines are family of secreted proteins involved in immunoregulatory and inflammatory processes. Responsible for accumulation of leukocytes during inflammation [80] | Yes[81] | NA |
| 10 | CD79A | 66 | CD791 molecule, immunoglobulin-associated alpha | It is a B lymphocyte antigen receptor. It includes the antigen-specific component, surface immunoglobulin (Ig). It encodes the Ig-alpha protein of the B-cell antigen component [82] | NA | NA |
| 11 | CSF2RB | 66 | Colony stimulating factor 2 receptor | Defects in this gene have been reported to be associated with protein alveolar proteinosis (PAP) [83] | NA | NA |
| 12 | IGHG3 | 66 | Immunoglobulin heavy constant gamma 3 | Membrane-bound immunoglobulins serve as receptors which, upon binding of a specific antigen, trigger the differentiation of B lymphocytes into immunoglobulins-secreting plasma cells [84] | Yes [85] | NA |
| 13 | CLEC7A | 65 | C-type lectin domain family 7 | It functions as a pattern-recognition receptor that recognizes a variety of beta-1,3-linked glucans from fungi and plants, and in a way plays a role in innate immune response [86] | NA | NA |
| 14 | CD27 | 63 | CD27 molecule | Plays a role in regulating B-cell activation and immunoglobulin synthesis [87] | Yes [88] | Yes [89] |
| 15 | RNASE2 | 62 | Ribonuclease, RNAse family 2 | Protein has antimicrobial activity against viruses [90] | NA | NA |
| 16 | EMR1 | 62 | Egf-like module containing, mucinlike, hormone receptor like 1 | EMR1 expression in humans is restricted to eosinophils and is a specific marker for these cells [91] | Yes[41] | Yes[41] |
| 17 | FCER1G | 62 | Fc fragment of IgE | The high affinity IgE receptors is a key molecule involved in allergic reactions [92] | Yes [93] | NA |
| 18 | ZBP1 | 61 | Z-DNA binding protein 1 | It encodes a Z-DNA binding protein. Z-DNA formation is a dynamic process, largely controlled by the amount of supercoiling [94] | Yes [95] | NA |
| 19 | CEACAM21 | 60 | Carcinoembryonic antigen-related cell adhesion molecule 21 | Encoded proteins mediate cell adhesion and play a role in arrangement of tissue threedimensional structure, angiogenesis, apoptosis, metastasis and modulation of innate immune response [96] | NA | NA |
| 20 | ADAM19 | 59 | ADAM metallopeptidase domain 19 | It serves a s a marker for dendritic cell differentiation. They are also involved in normal physiological and pathological processes such as cell migration, cell adhesion, signal transduction etc. [97] | Yes [97] | Yes [97] |
| 21 | H2BC8 | 59 | Histone cluster 1, H2bg | Plays a role in Cellular senescence, chromosome maintenance, cell cycle etc. [98] | NA | NA |
| 22 | SLAMF7 | 58 | SLAM family member 7 | It is a robust marker of normal plasma cells and malignant plasma cells in multiple myeloma [99] | NA | Yes [100] |
| 23 | SLFN5 | 57 | schlafen family member 5 | It is a member of the Schlafen family and may have a role in hematopoietic cell differentiation [101] | NA | NA |
| 24 | AIF1 | 57 | Allograft inflammatory factor 1 | Involved in negative regulation of growth of vascular smooth muscle cells, which contributes to the antiinflammatory response to vessel wall trauma [102] | NA | NA |
| 25 | PECAM1 | 55 | Platelet/endothelial cell adhesion molecule 1 | Makes up a large portion of endothelial cell intercellular junctions and is involved in angiogenesis, vasculature development, leukocyte migration etc. [26] | Yes [28] | Yes [103] |
| 26 | HLA-DMB | 54 | Major histology complex, class II | Plays a central role in the peptide loading of MHC class II molecules by helping to release class II-associated invariant chain peptide molecule from the peptide binding site [104] | Yes [46] | Yes [46] |
| 27 | CYSLTR1 | 53 | Cysteinyl leukotriene receptor 1 | Activation of this receptor by LTD4 results in contradiction and proliferation of smooth muscle, edema, eosinophil migration and damage to the mucus layer in the lung [105] | Yes [106] | Yes [106] |
| 28 | SELL | 53 | Selectin L | Plays an important role in leukocyte-endothelial cell interactions [27] | Yes [107] | Yes [107] |
| 29 | ARHGDIB | 51 | Rho GDP dissociation inhibitor beta | Involved in diverse cellular events, including cell signaling, proliferation, cytoskeletal organization and secretion [108] | NA | NA |
| 30 | NCF4 | 51 | Neutrophil cytosolic factor 4 | Pi3 kinase signaling pathways are activated that are a part of cellular functions such as cell growth, proliferation, differentiation, survival etc. [109] | Yes [110] | NA |
Table 6. The top downregulated genes.
The gene abbreviation is followed by a score which is provided by the BaseSpace correlation engine. The descriptive name of the gene is also mentioned. Corresponding role of the gene in our body is also listed.
| Gene | Score | Description | Role in the human body | Implicated in | ||
|---|---|---|---|---|---|---|
| Inflammatory disease | Drug Delivery | |||||
| 1 | SEC14L3 | 100 | SEC-14 like 3 | Essential for biogenesis of Golgi-derived transport vesicles, and thus is required for the export of yeast secretory proteins form the Golgi complex [111] | Yes [112] | NA |
| 2 | SLC6A13 | 92 | Solute carrier family 6, member 13 | Involved in signaling pathways such as, synaptic vesicle cycle and benzodiazepine pathway [113] | NA | NA |
| 3 | FYB2 | 92 | Chromosome 1 open reading frame 168 | Plays a role in T-cell receptor mediated activation of signaling pathways. Required for T-cell activation and integrin-mediated T-cell adhesion in response to TCR simulation [114] | NA | NA |
| 4 | GSTA3 | 89 | Glutathione S-transferase alpha 3 | Involved in cellular defense against toxic, carcinogenic and pharmacologically active electrophilic compounds [115] | Yes [116] | NA |
| 5 | OSBPL6 | 85 | Oxysterol binding protein-like 6 | The gene encodes a member of the oxysterol-binding protein (OSBP) family, a group of intracellular lipid receptors and the related pathways are synthesis of bile acids and bile salts and metabolism [117] | NA | NA |
| 6 | CCDC81 | 84 | Coiled-coil domain containing 81 | This gene is a member of the coiled coil domain structure family. Other functions are still unknown [118] | NA | NA |
| 7 | HHLA2 | 83 | HERV-H LTR associating 2 | Thought to regulate cell-mediated immunity by binding to a receptor on T lymphocytes and inhibiting proliferation of these cells [119] | NA | Yes [120] |
| 8 | ZBTB16 | 79 | Zinc finger and BTB domain containing 16 | This gene is involved in cell cycle progression, and interacts with a histone deacetylase [121] | NA | NA |
| 9 | SLC15A2 | 79 | Solute family carrier 15, member 2 | Responsible for the absorption of small peptides, as well as beta-lactam antibodies and other peptidelike drugs, from the tubular filtrate [122] | Yes [123] | NA |
| 10 | DNAH5 | 79 | Dynein, axonemal, heavy chain 5 | Functions as a force-generating protein with ATPase activity, whereby the release of ADP is thought to produce the force-producing power stroke [124] | NA | NA |
| 11 | CSMD1 | 76 | CUB and Sushi multiple domains 1 | It is believed that the gene product of CSMD1 functions as Complement control protein [125] | NA | NA |
| 12 | CES1 | 76 | Carboxylesterase 1 | Responsible for hydrolysis of ester- and amide-bond containing drugs such as cocaine and heroin [126] | NA | NA |
| 13 | ARX | 76 | Aristaless related homebook | This gene is thought to be involved in Central Nervous System (CNS) development. Mutations in these genes cause epilepsy [127] | NA | NA |
| 14 | EGFL6 | 74 | EGF-like-domain, multiple 6 | Members of this superfamily (Epidermal Growth Factor family) are often involved in the regulation of cell cycle, proliferation and development processes [128] | NA | Yes [129] |
| 15 | KLHL32 | 73 | Kelch-like 32 | No reported function for this gene so far | NA | NA |
| 16 | TTC6 | 72 | Tetratricopeptide repeat domain 6 | Has shared roles in cilia formation and function [130] | NA | NA |
| 17 | ERICH5 | 72 | Chromosome 8 open reading frame 47 | Encodes a ubiquitously expressed protein of unknown function. It co-localizes at the base of primary cilium in human retinal pigment epithelial cells [131] | NA | NA |
| 18 | ARG2 | 71 | Arginase, type II | They are NADPH-dependent flavoenzymes that catalyzes the oxidation of soft nucleophilic heteroatom centers in drugs, pesticides and xenobiotics [132] | Yes [133] | NA |
| 19 | FMO5 | 70 | Flavin containing monooxygenase 5 | Flavin-containing monooxygenases are NAPDH-dependent flavoenzymes that catalyzes the oxidation of soft nucleophilic heteroatom centers in drugs, pesticides and xenobiotics [134] | Yes [135] | NA |
| 20 | SLC23A1 | 69 | Solute carrier family 23, member 1 | The encoded protein is active in bulk vitamin C transport involving epithelial surfaces [136] | Yes [137] | NA |
| 21 | VEPH1 | 69 | Ventricular zone expressed PH domain homolog 1 | Interacts with TGF-beta receptor type-1 (TGFBR1) and inhibits dissociation of activated SMAD2, impeding its nuclear accumulation and resulting in impaired TGF-beta signaling [138] | NA | NA |
| 22 | NELL2 | 67 | NEL-like 2 (chicken) | Plays a role in cell growth and differentiation as well as in oncogenesis [139] | NA | NA |
| 23 | MUC15 | 67 | Mucin 15, cell surface associated | May play a role in the cell adhesion to the extracellular matrix [140] | Yes [141] | Yes [142] |
| 24 | PKIB | 67 | Protein kinase inhibitor beta | Study suggests that this protein may interact with the catalytic subunit of cAMP-dependent protein kinase and act as a competitive inhibitor [143] | NA | NA |
| 25 | FOXP2 | 66 | Forkhead box P2 | The product of this gene is thought to be required for proper development of speech and language regions of the brain during embryogenesis [144] | NA | Yes [144] |
| 26 | DLG2 | 66 | Discs, large homolog | The encoded protein may interact at postsynaptic sites to form a multimeric scaffold for the clustering of receptors, ion channels and associated signaling proteins [145] | NA | NA |
| 27 | ADRB1 | 64 | Adrenoceptor beta 1 | Mediates the physiological effects of hormone epinephrine and the neurotransmitter norepinephrine [146] | NA | NA |
| 28 | PER1 | 63 | Period homolog 1 | Plays a role in the modulation of the neuroinflammatory state via the regulation of inflammatory mediators release, such as CCL2 and IL6 [147] | Yes [148] | NA |
| 29 | ALDH3B1 | 63 | Aldehyde dehydrogenase 3 family | Plays a major role in the detoxification of the aldehydes generated by alcohol metabolism and lipid peroxidation [149] | NA | NA |
| 30 | ERBB4 | 63 | V-erb-a erythroblastic leukemia viral oncogene homolog 4 | The protein binds to and is activated by neuregulins and other factors and induces a variety of cellular responses [150] | Yes [150] | Yes [151] |
Discussion
The vascular system is critical for supplementing tissue with nutrients and proteins such as growth factors, as well as for removing waste products [13, 14]. An increase in vascular permeability is typically observed in inflammatory conditions [15] with associated increase in inflammatory gene expression [16]. This permeability is regulated by various vascular-permeabilizing agents, as well as vessel morphogenic and growth factors such as vascular endothelial growth factor (VEGF) and vascular endothelial growth factor A (VEGFA) [17]. Understanding the underlying vascular gene and pathway expression in CRS will allow for the strategic design and development of new nanoscale drug delivery technologies that exploit endothelial junction permeability to increase the extravasation of drug into the target sinonasal tissues.
Large sample studies are critical for studying the effects of genes on the development and regulation of the underlying vascular changes that occur in disease and performing meta-analysis on prior gene arrays allows this insight into CRS. This is in contrast to the current available level of evidence in gene expression studies which are based off of cohorts from single institutions with small sample sizes [18, 19]. Gene-array meta-analysis offsets this limitation by examining a larger population of patients at multiple institutions. Meta-analysis also helps to address the heterogeneity and biases that arise based on regional factors and differences such as patient demographics and environment [20]. Performing an analysis of the top genes that are over- and under-expressed affords a more comprehensive view of which genes are contributing to the neoangeogenesis that is occuring in patients with CRS [21, 22]. Further, key pathways and genes identified hold the promise of becoming potential therapeutic targets or biologic markers to monitor treatment responses for drug delivery platform development. Altogether, meta-analysis provides a more precise estimate of gene expression integration by reducing heterogeneity of the overall estimate, and ultimately, a reduction in the effects of individual study-specific biases.
Herein, we observed two vascular pathways (vasculature development and blood vessel morphogenesis) to be highly overexpressed in patients with CRS. Typically in adults these pathways are quiescent, with little to no vascular growth or remodeling, unless stimulated by inflammation or injury. These two pathways incorporate key genes that mediate neoangiogenesis, by stimulating endothelial cells to dynamically assemble into new blood vessels via growth factor-mediated signaling through VEGF that is known to strongly upregulate EGR3 [23]. EGR3 is also critical in the regulation of inflammation and antigen-induced proliferation of both B and T cells [24] that are associated with the pro-inflammatory response seen in patients with CRS. EGR3 is also hypothesized to be upregulated in both mice and humans to control inflammation [25]. Herein, we demonstrate EGR3 gene expression to be significantly upregulated in multiple biosets associated with the vasculature development and blood vessel morphogenesis in addition to its upregulation across all 5 biosets that were explored for this meta-analysis (Table 3, 4 and 5).
Leukocytye trafficking and endothelial tight junctions are two functions that are critical for controlling the inflammatory response in patients with CRS by regulating the permeability between endothelial cells to selectively allow the migration of leukocytes. Unregulated, endothelial cell remodeling results in an increase in the transmigration of inflammatory leukocytes, which in turn, release stimulatory inflammatory cytokines initiating further neoangiogenesis, perpetuating the inflammatory neo-angiogenesis cycle. Herein, we demonstrate significant overexpression of PECAM1 and SELL (Table 3–5) two key mediators involved in endothelial cell permeability (Table 5). PECAM1 and SELL function as regulators of leukocyte trafficking, and in the maintenance of endothelial cell junction permeability [26, 27]. As expected PECAM1 and SELL expression are preferentially upregulated and highly expressed in patients with CRS compared to controls [28]. Reducing leukocyte trafficking into the sinonasal mucosa and controlling permeability presents a novel unique target to further study.
It is clear that neoangiogenesis is a complex coordinated event that regulates blood flow, while regulating the activation of leukocytes and by selectively controlling the exchange of macromolecules [29]. However, due to the complex coordination of neoangiogenesis during chronic inflammation, this tightly controlled system results in leaky and dysfunctional blood vessels, allowing for an increased exchange of macromolecules. Interestingly, neoangiogenesis is also suggested to be central to the mechanism by which acute inflammation which initially can trigger the activation of endothelial cells can transition to chronic inflammation [30]. Although limited, our results align with prior investigations that have demonstrated blood vessel dysfunction, endothelial damage to the endothelial lining and widening of endothelial cell gap junctions, mediated through VEGF, EGR3, Tumor Necrosis Factor (TNF), and TGFβ in patients with CRS [31]. Further, vasculature development and blood vessel morphogenesis is well known to be involved in other inflammatory diseases such as rheumatoid arthritis (RA) that have inflammation-driven vascular changes [32].
Taking advantage of inflammation-driven vascular changes for nanoparticle drug delivery has not been explored for CRS but has been explored in inflammatory joint conditions such as RA [33, 34]. In fact, a large amount of effort and resources have been aimed at understanding and exploring ways to take therapeutic advantage of enhanced permeability and retention in disease [33, 35]. Several key landmark articles expand this concept to chronic inflammation in animal models of RA, for which the mechanism of Extravasation via Leaky Vasculature and subsequent Inflammatory cell-mediated Sequestration (ELVIS) was first introduced [36–38]. The authors, demonstrated that N-(2-hydroxypropyl)methacrylamide (HPMA) copolymer-dexamethasone conjugates administered via intravenous injection in rats preferentially accumulated in the inflamed joints to facilitate the reduction of arthritis-associated inflammation. Similarly, Metselaar et al [39] demonstrated prolonged accumulation of glucocorticosteroid-encapsulated long-circulating liposomes, resulting in the complete remission of joint arthritis. In another study Gawne et al. looked at the correlation between the ankle and wrist joint swelling and uptake of PEGylated liposomal methylprednisolone liposomes labelled with radioisotope 89Zr (NSSL-MPS). A significant correlation was identified between joint swelling (inflammation) and uptake of NSSL-MPS, which was not the case for free 89Zr [40]. Similarly, defining and characterizing the vascular changes in CRS will allow investigators to design and deliver nano-drug delivery systems to promote increased efficacy while taking advantage of nano-drug delivery systems to improve targeting while reducing the off-target toxicities of free drug.
We next sought to better understand how our meta-analysis data could be applied to drug delivery. A comprehensive literature search was performed on all of genes found to be significantly up- or down-regulated in the meta-analysis. We sought to identify those genes that have already been implicated in both inflammation and drug delivery. This revealed 11 upregulated genes (Table 5) and 2 downregulated genes (Table 6) that have been linked to both inflammation and drug delivery. Specifically, genes we identified have been associated with targeting therapies (EMR1:[41], PECAM1:[42]), prognostic biomarkers for therapeutic efficacy (PECAM1:[43], SELL:[44]), defining vascular permeability and characterizing the pathophysiology of disease to improve drug design (PECAM1:[45]).
Biomarkers also provide understanding into disease progression and prognosis. Further, biomarkers are invaluable in drug delivery for designing efficacy studies in both pre-clinical and clinical trials. For example, Morel et al [46], demonstrate the advantage of HLA class II histocompatibility antigen, DM beta chain (HLA-DMB) as a novel prognostic biomarker in RA and correlated the expression of HLA-DMB to disease severity. Herein, we demonstrate significant upregulation of HLA-DMB across all 5 biosets of the meta-analysis study (Table 5). Such biomarkers have not been identified in patients with CRS. These findings may act as a starting point to find those differentially expressed genes in CRS that may be similarily used as biomarkers in efficacy studies. Additional studies are needed to further investigate and identify new biomarkers that can be used in the development of improved targeted drug delivery systems.
Although this investigation aims to diminish the limitations of single institution array investigations it is not without its own limitations. We acknowledge gene expression results of our meta-analysis could not be cross validated using other available platforms. Due to the limited number of acceptable array studies to include in the final meta-analysis, the data presented has inherent heterogeneity that should be considered. For example, each individual gene array looks at different types and different number of genes, making a direct comparison between two studies difficult.
Conclusions
A meta-analysis approach using publicly available gene array data enables the evaluation of differentially expressed genes and signaling pathways in disease. In our meta-analysis, we identified key signaling pathways and associated genes in patients with CRS and highlight the key genes associated with vasculature development, blood vessel morphogenesis, and angiogenesis with links to drug delivery. We report significant differential expression of genes associated with vascular signaling pathways such as EMR1, PECAM1 and SELL related to vascular pathophysiology in CRS. Additional studies should be focused on further defining vasculature development, blood vessel morphogenesis, and angiogenesis in CRS.
Highlights.
Understanding the underlying vascular gene and pathway expression in CRS will allow for the strategic design and development of new nanoscale drug delivery
We observed two vascular pathways (vasculature development and blood vessel morphogenesis) to be highly overexpressed in patients with CRS
Vascular dysregulation and permeability contribute to the CRS pathophysiology
This provides opportunity to develop nanoscale drug delivery systems to improve efficacy and reduce toxicity of CRS treatment
Acknowledgement
We would like to thank the Bioinformatics core at the Huntsman Cancer Institute at the University of Utah and Dr. Aaron Atkinson for their guidance in utilizing the Illumina BaseSpace Correlation Engine. This research was in part supported by the National Center for Advancing Translational Sciences of the National Institutes of Health under Award Number UL1TR002538. The content is solely the responsibility of the authors and does not necessarily represent the official view of the National Institutes of Health.
Footnotes
Publisher's Disclaimer: This is a PDF file of an unedited manuscript that has been accepted for publication. As a service to our customers we are providing this early version of the manuscript. The manuscript will undergo copyediting, typesetting, and review of the resulting proof before it is published in its final form. Please note that during the production process errors may be discovered which could affect the content, and all legal disclaimers that apply to the journal pertain.
Conflict of interest: Jeremiah A. Alt is supported by grants from the National Institute on Deafness and Other Communication Disorders (Award R01 DC005805) and the Flight Attendant Medical Research Institute (CIA160008). Abigail Pulsipher and Jeremiah A. Alt are supported by a grant from the National Institute of Allergy and Infectious Diseases (Award R44AI126987). Jeremiah A. Alt is a consultant for Medtronic, Inc. (Jacksonville, FL). Abigail Pulsipher and Jeremiah A. Alt are affiliated with GlycoMira Therapeutics, Inc. (Salt Lake City, UT). None of these companies are affiliated with this research.
References
- [1]. https://www.cdc.gov/nchs/fastats/sinuses.htm.
- [2].Cho SH, Ledford D, and Lockey RF, “Medical Management Strategies in Acute and Chronic Rhinosinusitis,” (in eng), J Allergy Clin Immunol Pract, vol. 8, no. 5, pp. 1559–1564, May 2020. [DOI] [PMC free article] [PubMed] [Google Scholar]
- [3].Santarelli GD and Han JK, “Evaluation of the PROPEL,” (in eng), Expert Opin Drug Deliv, vol. 13, no. 12, pp. 1789–1793, December 2016. [DOI] [PubMed] [Google Scholar]
- [4]. https://www.cdc.gov/nchs/data/ahcd/namcs_summary/2016_namcs_web_tables.pdf.
- [5].Nagy JA, Benjamin L, Zeng H, Dvorak AM, and Dvorak HF, “Vascular permeability, vascular hyperpermeability and angiogenesis,” (in eng), Angiogenesis, vol. 11, no. 2, pp. 109–19, 2008. [DOI] [PMC free article] [PubMed] [Google Scholar]
- [6].Anand VK, Kacker A, Orjuela AF, Huang C, Manarey C, and Xiang J, “Inflammatory pathway gene expression in chronic rhinosinusitis,” (in eng), Am J Rhinol, vol. 20, no. 4, pp. 471–6, 2006. Jul-Aug 2006. [DOI] [PubMed] [Google Scholar]
- [7].Colburn WA, “Biomarkers in drug discovery and development: from target identification through drug marketing,” (in eng), J Clin Pharmacol, vol. 43, no. 4, pp. 329–41, April 2003. [DOI] [PubMed] [Google Scholar]
- [8].Kupershmidt I et al. , “Ontology-based meta-analysis of global collections of high-throughput public data,” (in eng), PLoS One, vol. 5, no. 9, September 2010. [DOI] [PMC free article] [PubMed] [Google Scholar]
- [9].“BaseSpace Correlation Engine Support page. (support.illumina.com/sequencing_software/basespace-correlation-engine.html),” ed.
- [10].“Illumina (2014) Ranking of Genes, SNVs, and Sequence Regions. (support.illumina.com/content/dam/illumina-marketing/documents/products/technotes/technote-ranking-snvs.pdf),” ed.
- [11].Subramanian A et al. , “Gene set enrichment analysis: a knowledge-based approach for interpreting genome-wide expression profiles,” (in eng), Proc Natl Acad Sci U S A, vol. 102, no. 43, pp. 15545–50, October 2005. [DOI] [PMC free article] [PubMed] [Google Scholar]
- [12].“Illumia (2014) Data Correlation Details: Enrichment Analaysis. (support.illumina.com/content/dam/illumina-marketing/documents/products/technotes/technote-data-correlation-enrichment.pdf),” ed.
- [13].Monahan-Earley R, Dvorak AM, and Aird WC, “Evolutionary origins of the blood vascular system and endothelium,” (in eng), J Thromb Haemost, vol. 11 Suppl 1, pp. 46–66, June 2013. [DOI] [PMC free article] [PubMed] [Google Scholar]
- [14].Pugsley MK and Tabrizchi R, “The vascular system. An overview of structure and function,” (in eng), J Pharmacol Toxicol Methods, vol. 44, no. 2, pp. 333–40, 2000. Sep-Oct 2000. [DOI] [PubMed] [Google Scholar]
- [15].Bates DO, “Vascular endothelial growth factors and vascular permeability,” (in eng), Cardiovasc Res, vol. 87, no. 2, pp. 262–71, July 2010. [DOI] [PMC free article] [PubMed] [Google Scholar]
- [16].Chen L et al. , “Inflammatory responses and inflammation-associated diseases in organs,” (in eng), Oncotarget, vol. 9, no. 6, pp. 7204–7218, January 2018. [DOI] [PMC free article] [PubMed] [Google Scholar]
- [17].McDonald and DM, “Angiogenesis and vascular remodeling in inflammation and cancer: Biology and Architecture of the Vasculature,” ed. Angiogenesis, 2008, pp. 17–33.19067197 [Google Scholar]
- [18].Lam K, Schleimer R, and Kern RC, “The Etiology and Pathogenesis of Chronic Rhinosinusitis: a Review of Current Hypotheses,” (in eng), Curr Allergy Asthma Rep, vol. 15, no. 7, p. 41, July 2015. [DOI] [PMC free article] [PubMed] [Google Scholar]
- [19].Tomassen P et al. , “Pathophysiology of chronic rhinosinusitis,” (in eng), Proc Am Thorac Soc, vol. 8, no. 1, pp. 115–20, March 2011. [DOI] [PubMed] [Google Scholar]
- [20].Higgins JP, Thompson SG, Deeks JJ, and Altman DG, “Measuring inconsistency in meta-analyses,” (in eng), BMJ, vol. 327, no. 7414, pp. 557–60, September 2003. [DOI] [PMC free article] [PubMed] [Google Scholar]
- [21].Hulse KE, “Immune Mechanisms of Chronic Rhinosinusitis,” (in eng), Curr Allergy Asthma Rep, vol. 16, no. 1, p. 1, January 2016. [DOI] [PMC free article] [PubMed] [Google Scholar]
- [22].Cao PP, Wang ZC, Schleimer RP, and Liu Z, “Pathophysiologic mechanisms of chronic rhinosinusitis and their roles in emerging disease endotypes,” (in eng), Ann Allergy Asthma Immunol, vol. 122, no. 1, pp. 33–40, 01 2019. [DOI] [PMC free article] [PubMed] [Google Scholar]
- [23].Liu D, Evans I, Britton G, and Zachary I, “The zinc-finger transcription factor, early growth response 3, mediates VEGF-induced angiogenesis,” (in eng), Oncogene, vol. 27, no. 21, pp. 2989–98, May 2008. [DOI] [PubMed] [Google Scholar]
- [24].Li S et al. , “The transcription factors Egr2 and Egr3 are essential for the control of inflammation and antigen-induced proliferation of B and T cells,” (in eng), Immunity, vol. 37, no. 4, pp. 685–96, October 2012. [DOI] [PMC free article] [PubMed] [Google Scholar]
- [25].Morita K, Okamura T, Sumitomo S, Iwasaki Y, Fujio K, and Yamamoto K, “Emerging roles of Egr2 and Egr3 in the control of systemic autoimmunity,” (in eng), Rheumatology (Oxford), vol. 55, no. suppl 2, pp. ii76–ii81, 12 2016. [DOI] [PubMed] [Google Scholar]
- [26].Woodfin A, Voisin MB, and Nourshargh S, “PECAM-1: a multi-functional molecule in inflammation and vascular biology,” (in eng), Arterioscler Thromb Vasc Biol, vol. 27, no. 12, pp. 2514–23, December 2007. [DOI] [PubMed] [Google Scholar]
- [27].Muller WA, “Leukocyte-endothelial cell interactions in the inflammatory response,” (in eng), Lab Invest, vol. 82, no. 5, pp. 521–33, May 2002. [DOI] [PubMed] [Google Scholar]
- [28].Xiang R et al. , “Different effects of allergic rhinitis on nasal mucosa remodeling in chronic rhinosinusitis with and without nasal polyps,” (in eng), Eur Arch Otorhinolaryngol, vol. 276, no. 1, pp. 115–130, January 2019. [DOI] [PMC free article] [PubMed] [Google Scholar]
- [29].Pober JS and Sessa WC, “Inflammation and the blood microvascular system,” (in eng), Cold Spring Harb Perspect Biol, vol. 7, no. 1, p. a016345, October 2014. [DOI] [PMC free article] [PubMed] [Google Scholar]
- [30].Paleolog EM, “The vasculature in rheumatoid arthritis: cause or consequence?,” (in eng), Int J Exp Pathol, vol. 90, no. 3, pp. 249–61, June 2009. [DOI] [PMC free article] [PubMed] [Google Scholar]
- [31].Ucuzian AA, Gassman AA, East AT, and Greisler HP, “Molecular mediators of angiogenesis,” (in eng), J Burn Care Res, vol. 31, no. 1, pp. 158–75, 2010. Jan-Feb 2010. [DOI] [PMC free article] [PubMed] [Google Scholar]
- [32].Szekanecz Z and Koch AE, “Vascular involvement in rheumatic diseases: ‘vascular rheumatology’,” (in eng), Arthritis Res Ther, vol. 10, no. 5, p. 224, 2008. [DOI] [PMC free article] [PubMed] [Google Scholar]
- [33].Goel S et al. , “Normalization of the vasculature for treatment of cancer and other diseases,” (in eng), Physiol Rev, vol. 91, no. 3, pp. 1071–121, July 2011. [DOI] [PMC free article] [PubMed] [Google Scholar]
- [34].Wang Q and Sun X, “Recent advances in nanomedicines for the treatment of rheumatoid arthritis,” (in eng), Biomater Sci, vol. 5, no. 8, pp. 1407–1420, July 2017. [DOI] [PubMed] [Google Scholar]
- [35].Azzi S, Hebda JK, and Gavard J, “Vascular permeability and drug delivery in cancers,” (in eng), Front Oncol, vol. 3, p. 211, 2013. [DOI] [PMC free article] [PubMed] [Google Scholar]
- [36].Liu XM et al. , “Synthesis and evaluation of a well-defined HPMA copolymer-dexamethasone conjugate for effective treatment of rheumatoid arthritis,” (in eng), Pharm Res, vol. 25, no. 12, pp. 2910–9, December 2008. [DOI] [PMC free article] [PubMed] [Google Scholar]
- [37].Wang D, Miller SC, Liu XM, Anderson B, Wang XS, and Goldring SR, “Novel dexamethasone-HPMA copolymer conjugate and its potential application in treatment of rheumatoid arthritis,” (in eng), Arthritis Res Ther, vol. 9, no. 1, p. R2, 2007. [DOI] [PMC free article] [PubMed] [Google Scholar]
- [38].Yuan F, Quan LD, Cui L, Goldring SR, and Wang D, “Development of macromolecular prodrug for rheumatoid arthritis,” (in eng), Adv Drug Deliv Rev, vol. 64, no. 12, pp. 1205–19, September 2012. [DOI] [PMC free article] [PubMed] [Google Scholar]
- [39].Metselaar JM, Wauben MH, Wagenaar-Hilbers JP, Boerman OC, and Storm G, “Complete remission of experimental arthritis by joint targeting of glucocorticoids with long-circulating liposomes,” (in eng), Arthritis Rheum, vol. 48, no. 7, pp. 2059–66, July 2003. [DOI] [PubMed] [Google Scholar]
- [40].Gawne PJ et al. , “PET Imaging of Liposomal Glucocorticoids using,” (in eng), Theranostics, vol. 10, no. 9, pp. 3867–3879, 2020. [DOI] [PMC free article] [PubMed] [Google Scholar]
- [41].Legrand F et al. , “The eosinophil surface receptor epidermal growth factor-like module containing mucin-like hormone receptor 1 (EMR1): a novel therapeutic target for eosinophilic disorders,” (in eng), J Allergy Clin Immunol, vol. 133, no. 5, pp. 1439–47, 1447.e1–8, May 2014. [DOI] [PMC free article] [PubMed] [Google Scholar]
- [42].Delisser HM, “Targeting PECAM-1 for anti-cancer therapy,” (in eng), Cancer Biol Ther, vol. 6, no. 1, pp. 121–2, January 2007. [DOI] [PubMed] [Google Scholar]
- [43].Anastassiou G et al. , “Platelet endothelial cell adhesion molecule-1 (PECAM-1): a potential prognostic marker involved in leukocyte infiltration of renal cell carcinoma,” (in eng), Oncology, vol. 53, no. 2, pp. 127–32, 1996. Mar-Apr 1996. [DOI] [PubMed] [Google Scholar]
- [44].Zhang W, Zuo Z, Huang X, Liu J, Jin G, and Su D, “Identification of endothelial selectin as a potential prognostic marker in breast cancer,” (in eng), Oncol Lett, vol. 15, no. 6, pp. 9908–9916, June 2018. [DOI] [PMC free article] [PubMed] [Google Scholar]
- [45].Chistiakov DA, Orekhov AN, and Bobryshev YV, “Endothelial PECAM-1 and its function in vascular physiology and atherogenic pathology,” (in eng), Exp Mol Pathol, vol. 100, no. 3, pp. 409–15, 06 2016. [DOI] [PubMed] [Google Scholar]
- [46].Morel J, Roch-Bras F, Molinari N, Sany J, Eliaou JF, and Combe B, “HLA-DMA*0103 and HLA-DMB*0104 alleles as novel prognostic factors in rheumatoid arthritis,” (in eng), Ann Rheum Dis, vol. 63, no. 12, pp. 1581–6, December 2004. [DOI] [PMC free article] [PubMed] [Google Scholar]
- [47].Hoffman and EP, “Mucus overproduction,” ed. Gene Expression Omnibus, 2008. [Google Scholar]
- [48].Wang and W, “Transcriptome analysis of eosinophilic and noneosinophilic chronic rhinosinusitis with nasal polyps reveals distinct lncRNA expression profiles,” ed. Gene Expression Omnibus, 2017. [DOI] [PMC free article] [PubMed] [Google Scholar]
- [49].Kato and A, “Gene expression analysis of Chronic rhinosinusitis,” ed. Gene Expression Omnibus, 2012. [Google Scholar]
- [50].“http://www.informatics.jax.org/vocab/gene_ontology/GO:0050867,” ed.
- [51].Janeway and C, Immunobiology, Fifth ed. New York and London: Garland Science, 2001. [Google Scholar]
- [52].Jeffrey KL et al. , “Positive regulation of immune cell function and inflammatory responses by phosphatase PAC-1,” (in eng), Nat Immunol, vol. 7, no. 3, pp. 274–83, March 2006. [DOI] [PubMed] [Google Scholar]
- [53].Heinzel S, Marchingo JM, Horton MB, and Hodgkin PD, “The regulation of lymphocyte activation and proliferation,” (in eng), Curr Opin Immunol, vol. 51, pp. 32-38, 04 2018. [DOI] [PubMed] [Google Scholar]
- [54].Ali H, Haribabu B, Richardson RM, and Snyderman R, “Mechanisms of inflammation and leukocyte activation,” (in eng), Med Clin North Am, vol. 81, no. 1, pp. 1–28, January 1997. [DOI] [PubMed] [Google Scholar]
- [55].Cantrell D, “Signaling in lymphocyte activation,” (in eng), Cold Spring Harb Perspect Biol, vol. 7, no. 6, June 2015. [DOI] [PMC free article] [PubMed] [Google Scholar]
- [56].Cooper and GM, The cell: a molecular approach, Second ed. Sunderlad (MA): Sinauer associates, 2000. [Google Scholar]
- [57].Vidarsson G, Dekkers G, and Rispens T, “IgG subclasses and allotypes: from structure to effector functions,” (in eng), Front Immunol, vol. 5, p. 520, 2014. [DOI] [PMC free article] [PubMed] [Google Scholar]
- [58].Udan RS, Culver JC, and Dickinson ME, “Understanding vascular development,” (in eng), Wiley Interdiscip Rev Dev Biol, vol. 2, no. 3, pp. 327–46, 2013. May-Jun 2013. [DOI] [PMC free article] [PubMed] [Google Scholar]
- [59].Chaplin DD, “Overview of the immune response,” (in eng), J Allergy Clin Immunol, vol. 125, no. 2 Suppl 2, pp. S3–23, February 2010. [DOI] [PMC free article] [PubMed] [Google Scholar]
- [60].Nourshargh S and Alon R, “Leukocyte migration into inflamed tissues,” (in eng), Immunity, vol. 41, no. 5, pp. 694–707, November 2014. [DOI] [PubMed] [Google Scholar]
- [61].Lecuit T and Lenne PF, “Cell surface mechanics and the control of cell shape, tissue patterns and morphogenesis,” (in eng), Nat Rev Mol Cell Biol, vol. 8, no. 8, pp. 633–44, August 2007. [DOI] [PubMed] [Google Scholar]
- [62]. http://www.informatics.jax.org/vocab/gene_ontology/GO:0031349.
- [63].Drake CJ, Hungerford JE, and Little CD, “Morphogenesis of the first blood vessels,” (in eng), Ann N Y Acad Sci, vol. 857, pp. 155–79, October 1998. [DOI] [PubMed] [Google Scholar]
- [64].Zou Y et al. , “Characteristic expression and significance of CCL19 in different tissue types in chronic rhinosinusitis,” (in eng), Exp Ther Med, vol. 11, no. 1, pp. 140–146, January 2016. [DOI] [PMC free article] [PubMed] [Google Scholar]
- [65].Liu X et al. , “Powerful Anticolon Tumor Effect of Targeted Gene Immunotherapy Using Folate-Modified Nanoparticle Delivery of CCL19 To Activate the Immune System,” (in eng), ACS Cent Sci, vol. 5, no. 2, pp. 277–289, February 2019. [DOI] [PMC free article] [PubMed] [Google Scholar]
- [66].Segal AW, “The function of the NADPH oxidase of phagocytes and its relationship to other NOXs in plants, invertebrates, and mammals,” (in eng), Int J Biochem Cell Biol, vol. 40, no. 4, pp. 604–18, 2008. [DOI] [PMC free article] [PubMed] [Google Scholar]
- [67].Diebold BA, Smith SM, Li Y, and Lambeth JD, “NOX2 As a Target for Drug Development: Indications, Possible Complications, and Progress,” (in eng), Antioxid Redox Signal, vol. 23, no. 5, pp. 375–405, August 2015. [DOI] [PMC free article] [PubMed] [Google Scholar]
- [68].Balbona K, Tran H, Godyna S, Ingham KC, Strickland DK, and Argraves WS, “Fibulin binds to itself and to the carboxyl-terminal heparin-binding region of fibronectin,” (in eng), J Biol Chem, vol. 267, no. 28, pp. 20120–5, October 1992. [PubMed] [Google Scholar]
- [69].Liu G et al. , “Airway remodelling and inflammation in asthma are dependent on the extracellular matrix protein fibulin-1c,” (in eng), J Pathol, vol. 243, no. 4, pp. 510–523, 12 2017. [DOI] [PubMed] [Google Scholar]
- [70].Pupa SM et al. , “Regulation of breast cancer response to chemotherapy by fibulin-1,” (in eng), Cancer Res, vol. 67, no. 9, pp. 4271–7, May 2007. [DOI] [PubMed] [Google Scholar]
- [71].“https://www.ncbi.nlm.nih.gov/gene?cmd=Retrieve&dopt=full_report&list_uids=3113,” ed.
- [72].Picotto G, Morse LR, Nguyen N, Saltzman J, and Battaglino R, “TMEM176A and TMEM176B Are Candidate Regulators of Inhibition of Dendritic Cell Maturation and Function after Chronic Spinal Cord Injury,” (in eng), J Neurotrauma, vol. 37, no. 3, pp. 528–533, February 2020. [DOI] [PMC free article] [PubMed] [Google Scholar]
- [73].Segovia M et al. , “Targeting TMEM176B Enhances Antitumor Immunity and Augments the Efficacy of Immune Checkpoint Blockers by Unleashing Inflammasome Activation,” (in eng), Cancer Cell, vol. 35, no. 5, pp. 767–781.e6, 05 2019. [DOI] [PMC free article] [PubMed] [Google Scholar]
- [74].Rollinger-Holzinger I et al. , “LST1: a gene with extensive alternative splicing and immunomodulatory function,” (in eng), J Immunol, vol. 164, no. 6, pp. 3169–76, March 2000. [DOI] [PubMed] [Google Scholar]
- [75].Mulcahy H, O’Rourke KP, Adams C, Molloy MG, and O’Gara F, “LST1 and NCR3 expression in autoimmune inflammation and in response to IFN-gamma, LPS and microbial infection,” (in eng), Immunogenetics, vol. 57, no. 12, pp. 893–903, January 2006. [DOI] [PubMed] [Google Scholar]
- [76].Wysolmerski JJ et al. , “Absence of functional type 1 parathyroid hormone (PTH)/PTH-related protein receptors in humans is associated with abnormal breast development and tooth impaction,” (in eng), J Clin Endocrinol Metab, vol. 86, no. 4, pp. 1788–94, April 2001. [DOI] [PubMed] [Google Scholar]
- [77].Wu X, Peters-Hall JR, Ghimbovschi S, Mimms R, Rose MC, and Peña MT, “Glandular gene expression of sinus mucosa in chronic rhinosinusitis with and without cystic fibrosis,” (in eng), Am J Respir Cell Mol Biol, vol. 45, no. 3, pp. 525–33, September 2011. [DOI] [PMC free article] [PubMed] [Google Scholar]
- [78].Badawy AA, “Kynurenine Pathway of Tryptophan Metabolism: Regulatory and Functional Aspects,” (in eng), Int J Tryptophan Res, vol. 10, p. 1178646917691938, 2017. [DOI] [PMC free article] [PubMed] [Google Scholar]
- [79].Ye Z, Yue L, Shi J, Shao M, and Wu T, “Role of IDO and TDO in Cancers and Related Diseases and the Therapeutic Implications,” (in eng), J Cancer, vol. 10, no. 12, pp. 2771–2782, 2019. [DOI] [PMC free article] [PubMed] [Google Scholar]
- [80].Hughes CE and Nibbs RJB, “A guide to chemokines and their receptors,” (in eng), FEBS J, vol. 285, no. 16, pp. 2944–2971, 08 2018. [DOI] [PMC free article] [PubMed] [Google Scholar]
- [81].Oue S et al. , “Increased IL-13 expression is independently associated with neo-osteogenesis in patients with chronic rhinosinusitis,” (in eng), J Allergy Clin Immunol, vol. 140, no. 5, pp. 1444–1448.e11, 11 2017. [DOI] [PubMed] [Google Scholar]
- [82].Minegishi Y, Coustan-Smith E, Rapalus L, Ersoy F, Campana D, and Conley ME, “Mutations in Igalpha (CD79a) result in a complete block in B-cell development,” (in eng), J Clin Invest, vol. 104, no. 8, pp. 1115–21, October 1999. [DOI] [PMC free article] [PubMed] [Google Scholar]
- [83].Nogee and LM, Lung Diseases Associated With Disruption of Pulmonary Surfactant Homeostasis. Kendig’s Disorders of the Respiratory Tract in Children: Elsevier Inc, 2019. [Google Scholar]
- [84].“https://www.genecards.org/cgi-bin/carddisp.pl?gene=IGHG3,” ed.
- [85].Buck D et al. , “Genetic variants in the immunoglobulin heavy chain locus are associated with the IgG index in multiple sclerosis,” (in eng), Ann Neurol, vol. 73, no. 1, pp. 86–94, January 2013. [DOI] [PMC free article] [PubMed] [Google Scholar]
- [86].Drummond RA and Brown GD, “The role of Dectin-1 in the host defence against fungal infections,” (in eng), Curr Opin Microbiol, vol. 14, no. 4, pp. 392–9, August 2011. [DOI] [PubMed] [Google Scholar]
- [87].Agematsu K, “Memory B cells and CD27,” (in eng), Histol Histopathol, vol. 15, no. 2, pp. 573–6, 04 2000. [DOI] [PubMed] [Google Scholar]
- [88].Arjomandi H et al. , “Relationship of eosinophils and plasma cells to biofilm in chronic rhinosinusitis,” (in eng), Am J Rhinol Allergy, vol. 27, no. 4, pp. e85–90, 2013. Jul-Aug 2013. [DOI] [PubMed] [Google Scholar]
- [89].Wajant H, “Therapeutic targeting of CD70 and CD27,” (in eng), Expert Opin Ther Targets, vol. 20, no. 8, pp. 959–73, August 2016. [DOI] [PubMed] [Google Scholar]
- [90].Lu L, Li J, Moussaoui M, and Boix E, “Immune Modulation by Human Secreted RNases at the Extracellular Space,” (in eng), Front Immunol, vol. 9, p. 1012, 2018. [DOI] [PMC free article] [PubMed] [Google Scholar]
- [91].Hamann J et al. , “EMR1, the human homolog of F4/80, is an eosinophil-specific receptor,” (in eng), Eur J Immunol, vol. 37, no. 10, pp. 2797–802, October 2007. [DOI] [PubMed] [Google Scholar]
- [92].“https://www.ncbi.nlm.nih.gov/gene?cmd=Retrieve&dopt=full_report&list_uids=2207,” ed.
- [93].Tsuboi N, Asano K, Lauterbach M, and Mayadas TN, “Human neutrophil Fcgamma receptors initiate and play specialized nonredundant roles in antibody-mediated inflammatory diseases,” (in eng), Immunity, vol. 28, no. 6, pp. 833–46, June 2008. [DOI] [PMC free article] [PubMed] [Google Scholar]
- [94].“https://www.ncbi.nlm.nih.gov/gene?cmd=Retrieve&dopt=full_report&list_uids=81030,” ed.
- [95].Kuriakose T and Kanneganti TD, “ZBP1: Innate Sensor Regulating Cell Death and Inflammation,” (in eng), Trends Immunol, vol. 39, no. 2, pp. 123–134, 02 2018. [DOI] [PMC free article] [PubMed] [Google Scholar]
- [96].Helfrich I and Singer BB, “Size Matters: The Functional Role of the CEACAM1 Isoform Signature and Its Impact for NK Cell-Mediated Killing in Melanoma,” (in eng), Cancers (Basel), vol. 11, no. 3, March 2019. [DOI] [PMC free article] [PubMed] [Google Scholar]
- [97].Qi B, Newcomer RG, and Sang QX, “ADAM19/adamalysin 19 structure, function, and role as a putative target in tumors and inflammatory diseases,” (in eng), Curr Pharm Des, vol. 15, no. 20, pp. 2336–48, 2009. [DOI] [PubMed] [Google Scholar]
- [98].“https://www.ncbi.nlm.nih.gov/gene?cmd=Retrieve&dopt=full_report&list_uids=8339,” ed.
- [99].Frigyesi I et al. , “Robust isolation of malignant plasma cells in multiple myeloma,” (in eng), Blood, vol. 123, no. 9, pp. 1336–40, February 2014. [DOI] [PubMed] [Google Scholar]
- [100].Malaer JD and Mathew PA, “CS1 (SLAMF7, CD319) is an effective immunotherapeutic target for multiple myeloma,” (in eng), Am J Cancer Res, vol. 7, no. 8, pp. 1637–1641, 2017. [PMC free article] [PubMed] [Google Scholar]
- [101].Kovalenko PL and Basson MD, “Schlafen 12 expression modulates prostate cancer cell differentiation,” (in eng), J Surg Res, vol. 190, no. 1, pp. 177–84, July 2014. [DOI] [PMC free article] [PubMed] [Google Scholar]
- [102].“https://www.ncbi.nlm.nih.gov/gene?cmd=Retrieve&dopt=full_report&list_uids=199,” ed.
- [103].Chacko AM et al. , “Collaborative Enhancement of Endothelial Targeting of Nanocarriers by Modulating Platelet-Endothelial Cell Adhesion Molecule-1/CD31 Epitope Engagement,” (in eng), ACS Nano, vol. 9, no. 7, pp. 6785–93, July 2015. [DOI] [PMC free article] [PubMed] [Google Scholar]
- [104].“https://www.ncbi.nlm.nih.gov/gene?cmd=Retrieve&dopt=full_report&list_uids=3109,” ed.
- [105].Thompson-Souza GA, Gropillo I, and Neves JS, “Cysteinyl Leukotrienes in Eosinophil Biology: Functional Roles and Therapeutic Perspectives in Eosinophilic Disorders,” (in eng), Front Med (Lausanne), vol. 4, p. 106, 2017. [DOI] [PMC free article] [PubMed] [Google Scholar]
- [106].Gelosa P, Colazzo F, Tremoli E, Sironi L, and Castiglioni L, “Cysteinyl Leukotrienes as Potential Pharmacological Targets for Cerebral Diseases,” (in eng), Mediators Inflamm, vol. 2017, p. 3454212, 2017. [DOI] [PMC free article] [PubMed] [Google Scholar]
- [107].Barthel SR, Gavino JD, Descheny L, and Dimitroff CJ, “Targeting selectins and selectin ligands in inflammation and cancer,” (in eng), Expert Opin Ther Targets, vol. 11, no. 11, pp. 1473–91, November 2007. [DOI] [PMC free article] [PubMed] [Google Scholar]
- [108].“https://www.ncbi.nlm.nih.gov/gene?cmd=Retrieve&dopt=full_report&list_uids=397,” ed.
- [109].“https://www.ncbi.nlm.nih.gov/gene?cmd=Retrieve&dopt=full_report&list_uids=4689,” ed.
- [110].Winter S, Hultqvist Hopkins M, Laulund F, and Holmdahl R, “A Reduction in Intracellular Reactive Oxygen Species Due to a Mutation in NCF4 Promotes Autoimmune Arthritis in Mice,” (in eng), Antioxid Redox Signal, vol. 25, no. 18, pp. 983–996, 12 2016. [DOI] [PubMed] [Google Scholar]
- [111].“https://www.ncbi.nlm.nih.gov/gene?cmd=Retrieve&dopt=full_report&list_uids=266629,” ed.
- [112].Shan L et al. , “Inverse relationship between Sec14l3 mRNA/protein expression and allergic airway inflammation,” (in eng), Eur J Pharmacol, vol. 616, no. 1–3, pp. 293–300, August 2009. [DOI] [PubMed] [Google Scholar]
- [113].“https://www.genecards.org/cgi-bin/carddisp.pl?gene=SLC6A13,” ed.
- [114].“https://www.genecards.org/cgi-bin/carddisp.pl?gene=FYB2,” ed.
- [115].“https://www.genecards.org/cgi-bin/carddisp.pl?gene=GSTA3,” ed.
- [116].Xiao Y et al. , “GSTA3 Attenuates Renal Interstitial Fibrosis by Inhibiting TGF-Beta-Induced Tubular Epithelial-Mesenchymal Transition and Fibronectin Expression,” (in eng), PLoS One, vol. 11, no. 9, p. e0160855, 2016. [DOI] [PMC free article] [PubMed] [Google Scholar]
- [117].“https://www.ncbi.nlm.nih.gov/gene?cmd=Retrieve&dopt=full_report&list_uids=114880,” ed.
- [118].“https://www.genecards.org/cgi-bin/carddisp.pl?gene=CCDC81,” ed.
- [119].“https://www.ncbi.nlm.nih.gov/gene?cmd=Retrieve&dopt=full_report&list_uids=11148,” ed.
- [120].Cheng H et al. , “HHLA2, a New Immune Checkpoint Member of the B7 Family, Is Widely Expressed in Human Lung Cancer and Associated with EGFR Mutational Status,” (in eng), Clin Cancer Res, vol. 23, no. 3, pp. 825–832, February 2017. [DOI] [PMC free article] [PubMed] [Google Scholar]
- [121].“https://www.ncbi.nlm.nih.gov/gene?cmd=Retrieve&dopt=full_report&list_uids=7704,” ed.
- [122].Liu W et al. , “Molecular cloning of PEPT 2, a new member of the H+/peptide cotransporter family, from human kidney,” (in eng), Biochim Biophys Acta, vol. 1235, no. 2, pp. 461–6, May 1995. [DOI] [PubMed] [Google Scholar]
- [123].Hu Y, Song F, Jiang H, Nuñez G, and Smith DE, “SLC15A2 and SLC15A4 Mediate the Transport of Bacterially Derived Di/Tripeptides To Enhance the Nucleotide-Binding Oligomerization Domain-Dependent Immune Response in Mouse Bone Marrow-Derived Macrophages,” (in eng), J Immunol, vol. 201, no. 2, pp. 652–662, 07 2018. [DOI] [PMC free article] [PubMed] [Google Scholar]
- [124].“https://www.ncbi.nlm.nih.gov/gene?cmd=Retrieve&dopt=full_report&list_uids=1767,” ed.
- [125].Kraus DM et al. , “CSMD1 is a novel multiple domain complement-regulatory protein highly expressed in the central nervous system and epithelial tissues,” (in eng), J Immunol, vol. 176, no. 7, pp. 4419–30, April 2006. [DOI] [PubMed] [Google Scholar]
- [126].“https://www.ncbi.nlm.nih.gov/gene?cmd=Retrieve&dopt=full_report&list_uids=1066,” ed.
- [127].“https://www.ncbi.nlm.nih.gov/gene?cmd=Retrieve&dopt=full_report&list_uids=170302,” ed.
- [128].“https://www.ncbi.nlm.nih.gov/gene?cmd=Retrieve&dopt=full_report&list_uids=25975,” ed.
- [129].Noh K et al. , “Differential Effects of EGFL6 on Tumor versus Wound Angiogenesis,” (in eng), Cell Rep, vol. 21, no. 10, pp. 2785–2795, December 2017. [DOI] [PMC free article] [PubMed] [Google Scholar]
- [130].“https://www.genecards.org/cgi-bin/carddisp.pl?gene=TTC6,” ed.
- [131].“https://www.genecards.org/cgi-bin/carddisp.pl?gene=ERICH5,” ed.
- [132].“https://www.ncbi.nlm.nih.gov/gene?cmd=Retrieve&dopt=full_report&list_uids=384,” ed.
- [133].Yang Z and Ming XF, “Functions of arginase isoforms in macrophage inflammatory responses: impact on cardiovascular diseases and metabolic disorders,” (in eng), Front Immunol, vol. 5, p. 533, 2014. [DOI] [PMC free article] [PubMed] [Google Scholar]
- [134].“https://www.ncbi.nlm.nih.gov/gene?cmd=Retrieve&dopt=full_report&list_uids=2330,” ed.
- [135].Zhang J et al. , “Hepatic flavin-containing monooxygenase gene regulation in different mouse inflammation models,” (in eng), Drug Metab Dispos, vol. 37, no. 3, pp. 462–8, March 2009. [DOI] [PMC free article] [PubMed] [Google Scholar]
- [136].“https://www.ncbi.nlm.nih.gov/gene?cmd=Retrieve&dopt=full_report&list_uids=9963,” ed.
- [137].Amir Shaghaghi M, Bernstein CN, Serrano León A, El-Gabalawy H, and Eck P, “Polymorphisms in the sodium-dependent ascorbate transporter gene SLC23A1 are associated with susceptibility to Crohn disease,” (in eng), Am J Clin Nutr, vol. 99, no. 2, pp. 378–83, February 2014. [DOI] [PubMed] [Google Scholar]
- [138].Brown TJ, Kollara A, Shathasivam P, and Ringuette MJ, “Ventricular Zone Expressed PH Domain Containing 1 (VEPH1): an adaptor protein capable of modulating multiple signaling transduction pathways during normal and pathological development,” (in eng), Cell Commun Signal, vol. 17, no. 1, p. 116, 09 2019. [DOI] [PMC free article] [PubMed] [Google Scholar]
- [139].“https://www.ncbi.nlm.nih.gov/gene?cmd=Retrieve&dopt=full_report&list_uids=4753,” ed.
- [140].Huang J et al. , “Overexpression of MUC15 activates extracellular signal-regulated kinase 1/2 and promotes the oncogenic potential of human colon cancer cells,” (in eng), Carcinogenesis, vol. 30, no. 8, pp. 1452–8, August 2009. [DOI] [PubMed] [Google Scholar]
- [141].Chen ZG et al. , “Upregulation of cell-surface mucin MUC15 in human nasal epithelial cells upon influenza A virus infection,” (in eng), BMC Infect Dis, vol. 19, no. 1, p. 622, July 2019. [DOI] [PMC free article] [PubMed] [Google Scholar]
- [142].Rao CV, Janakiram NB, and Mohammed A, “Molecular Pathways: Mucins and Drug Delivery in Cancer,” (in eng), Clin Cancer Res, vol. 23, no. 6, pp. 1373–1378, March 2017. [DOI] [PMC free article] [PubMed] [Google Scholar]
- [143].“https://www.ncbi.nlm.nih.gov/gene?cmd=Retrieve&dopt=full_report&list_uids=5570,” ed.
- [144].Herrero MJ and Gitton Y, “The untold stories of the speech gene, the,” (in eng), Genes Cancer, vol. 9, no. 1–2, pp. 11–38, January 2018. [DOI] [PMC free article] [PubMed] [Google Scholar]
- [145].“https://www.ncbi.nlm.nih.gov/gene?cmd=Retrieve&dopt=full_report&list_uids=1740,” ed.
- [146].Yi B et al. , “Discovery of novel brain permeable and G protein-biased beta-1 adrenergic receptor partial agonists for the treatment of neurocognitive disorders,” (in eng), PLoS One, vol. 12, no. 7, p. e0180319, 2017. [DOI] [PMC free article] [PubMed] [Google Scholar]
- [147].“https://www.ncbi.nlm.nih.gov/gene?cmd=Retrieve&dopt=full_report&list_uids=5187,” ed.
- [148].Wang T et al. , “PER1 prevents excessive innate immune response during endotoxin-induced liver injury through regulation of macrophage recruitment in mice,” (in eng), Cell Death Dis, vol. 7, p. e2176, April 2016. [DOI] [PMC free article] [PubMed] [Google Scholar]
- [149].Marchitti SA, Brocker C, Orlicky DJ, and Vasiliou V, “Molecular characterization, expression analysis, and role of ALDH3B1 in the cellular protection against oxidative stress,” (in eng), Free Radic Biol Med, vol. 49, no. 9, pp. 1432–43, November 2010. [DOI] [PMC free article] [PubMed] [Google Scholar]
- [150].Schumacher MA et al. , “ErbB4 signaling stimulates pro-inflammatory macrophage apoptosis and limits colonic inflammation,” (in eng), Cell Death Dis, vol. 8, no. 2, p. e2622, 02 2017. [DOI] [PMC free article] [PubMed] [Google Scholar]
- [151].Paatero I and Elenius K, “ErbB4 and its isoforms: patentable drug targets?,” (in eng), Recent Pat DNA Gene Seq, vol. 2, no. 1, pp. 27–33, 2008. [DOI] [PubMed] [Google Scholar]