Abstract
Activated Vγδ9Vδ2 (γδ2) T lymphocytes that sense parasite-produced phosphoantigens are expanded in Plasmodium falciparum-infected patients. Although previous studies suggested that γδ2 T cells help control erythrocytic malaria, whether γδ2 T cells recognize infected red blood cells (iRBCs) was uncertain. Here we show that iRBCs stained for the phosphoantigen sensor, butyrophilin 3A1 (BTN3A1). γδ2 T cells formed immune synapses and lysed iRBCs in a contact, phosphoantigen, BTN3A1 and degranulation-dependent manner, killing intracellular parasites. Granulysin released into the synapse lysed iRBCs and delivered death-inducing granzymes to the parasite. All intra-erythrocytic parasites were susceptible, but schizonts were most sensitive. A second protective γδ2 T cell mechanism was identified. In the presence of patient serum, γδ2 T cells phagocytosed and degraded opsonized iRBCs in a CD16-dependent manner, decreasing parasite multiplication. Thus, γδ2 T cells have two ways to control blood stage malaria – γδT cell antigen receptor (TCR)-mediated degranulation and phagocytosis of antibody-coated iRBCs.
Keywords: malaria, γδ T cell, cytotoxicity, granulysin, granzyme, butyrophilin, antibody-dependent phagocytosis
Introduction
CD8+ T lymphocytes recognize Plasmodium vivax (Pv)-infected reticulocytes, lyse the host cell and kill intracellular parasites by releasing cytotoxic granules that contain granulysin (GNLY) and granzymes (Gzm)1. However, P. falciparum (Pf) infects mature red blood cells (RBCs), which lack HLA class I expression and are not recognized by conventional T cells2. Pf-infected patients, however, have an expansion of activated circulating Vγ9Vδ2 T cells (hereafter called γδ2 T cells)3–11. γδ2 T cells recognize a phosphoantigen ((E)-4-hydroxy-3-methyl-but-2-enyl pyrophosphate (HMBPP)) intermediate of isoprenoid biosynthesis in bacteria and protozoan parasites that binds to the intracellular domain of the immunoglobulin-like molecule butyrophilin 3A1 (BTN3A1), which acts as a phosphoantigen sensor12–14. Children with repeated Pf infections in endemic regions of Africa are relatively depleted of γδ2 T cells and their residual γδ2 T cells show signs of exhaustion, including inhibitory co-receptor expression and reduced cytokine production7–9. The combination of γδ2 T cell expansion, activation and dysfunction with recurrent infections suggests that γδ2 T cells recognize erythrocytic Pf. Increased γδ2 T cell numbers pre-vaccination correlate with protection from natural infection or experimental challenge after attenuated sporozoite vaccination15–18.
How γδ2 T cells recognize blood stage Pf infection is not well understood, since merozoites and RBCs were not thought to express BTN3A112,19. Previous studies showed that parasite-produced HMBPP was released when infected RBCs (iRBCs) rupture during merozoite egress. The released HMBPP was taken up by γδ2 T cells, which highly express BTN3A1, and activated them to degranulate even without direct iRBC contact10,19. γδ2 T cell degranulation inhibited merozoite infection of uninfected RBCs (uRBCs) by a GNLY-dependent mechanism that was perforin (PFN)-independent. These studies postulated that parasite inhibition was caused by direct killing of merozoites by GNLY in the blood, but this was not experimentally tested. A high GNLY concentration (>1 μM) is needed to lyse extracellular bacteria, fungi and other parasites20. However, the highest reported GNLY concentration in Pf plasma was in the low nanomolar range19. Thus, merozoite killing by dispersed GNLY in the blood may not occur under physiological conditions.
Here we reexamine how γδ2 T cells respond to Pf-infected RBCs and provide a new model for γδ2 T cell protection against blood stage infection. Merozoites do not express BTN3A1 or take up host proteins and BTN3 homologous genes only exist in mammals, making it unlikely that γδ2 T cells directly recognize merozoites. However, surface BTN3A1 was detected on iRBCs. γδ2 T cells selectively formed immune synapses with iRBCs, but not uRBCs, which triggered γδTCR, BTN3A1 and phosphoantigen-dependent degranulation, lysis of iRBCs at all blood stages of parasite development, and destruction of intracellular parasites, preventing them from invading fresh uRBCs. RBC lysis and parasite killing depended on GNLY and γδ2 T cell direct contact with the iRBC and degranulation. Unlike other lymphocytes, γδ2 T cells have some properties of myeloid cells – they express some professional antigen-presenting cell markers, cross-present antigens to T cells21–25 and phagocytose antibody-opsonized bacteria21,26. Here we found that γδ2 T cells phagocytose and degrade antibody-coated iRBCs.
Results
γδ2 T cells in P. falciparum are activated and cytotoxic
To assess the cytotoxic lymphocyte response to erythrocytic Pf infection, the frequency of circulating T lymphocytes and natural killer cells (NK) in acutely infected Pf patients and apparently healthy donors (HD) in the Amazon endemic region in Porto Velho, Brazil was compared (Fig. 1a, Extended Data 1a). Although CD4+ and CD8+ T and NK cell numbers were not significantly different, malaria patients in Porto Velho showed a significant ~3-fold increase in circulating γδ2 T cells (Pf, 3.71±0.44% of circulating lymphocytes vs HD, 1.17±0.23%, P<0.01). Consistently, circulating γδ2 T cells in Pf donors were more activated than in HD, since they had a higher proportion of CD69+ and CD16+ cells (Fig. 1b,c, Extended Data 1b). Comparing cytotoxic molecule expression, about twice as many freshly isolated circulating γδ2 T cells from Pf donors stained for GNLY and GzmB, but Pf γδ2 T cells were less likely to stain for PFN (Fig.1d, Extended Data 1c). Cytotoxic molecule staining did not increase in circulating CD4+ T cells from Pf donors, but CD8+ T cells were significantly more likely to stain for all 3 cytotoxic molecules (GNLY, PFN, GzmB) and NK from Pf donors were twice as likely to express GzmB. Freshly isolated Pf γδ2 T cells lysed iRBCs, unlike HD γδ2 T cells (Fig 1e, Extended Data 2). Consistent with the expansion of GNLY-expressing γδ2 T cells and increased GNLY in circulating CD8+ T cells in Pf patients, GNLY was elevated in Pf sera (82.07 ± 5.67 pM, Fig.1f), but not detected in most HD sera. Thus γδ2 T cells were the only lymphocyte subtype significantly expanded in Pf blood and they were activated and lysed iRBCs.
Figure 1. γδ2 T cells are activated in P. falciparum infection.
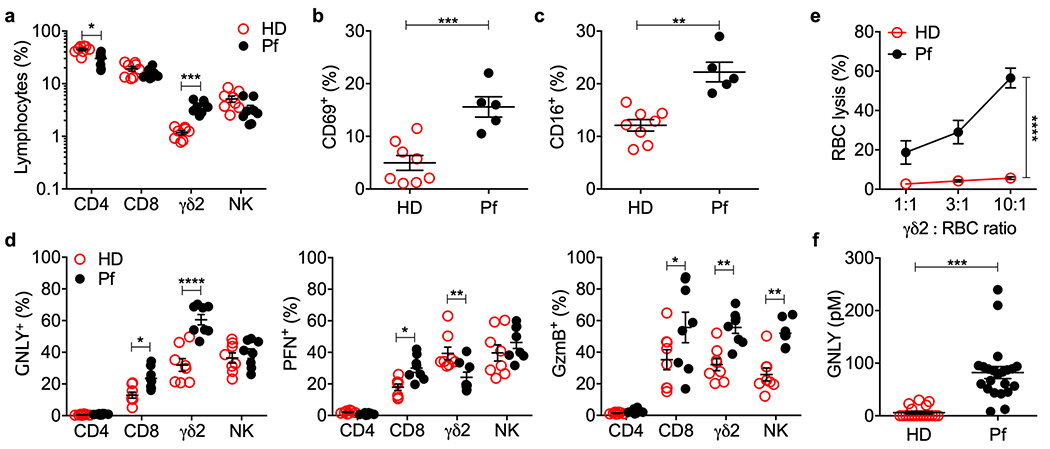
a, Frequency of circulating lymphocytes from 8 healthy donors (HD) and 8 P. falciparum patients (Pf). CD3+CD4+ (CD4), CD3+CD8+ (CD8), CD3+TCRδ2+ (γδ2), CD3−CD56+ (NK). b,c, Circulating γδ2 T cell activation in 8 HD and 5 Pf was evaluated by CD69 and CD16 staining. d, Intracellular granulysin (GNLY), perforin (PFN) and granzyme B (GzmB) in 8 HD and 8 Pf. e, CFSE-stained iRBC were co-cultured with fresh purified γδ2 T cells from 3 HD and 3 Pf at indicated E:T ratios for 12 hr and iRBC lysis was assessed by flow cytometry analysis of the number of viable CFSE+ cells relative to added counting beads. f, Plasma GNLY concentration in 16 HD and 22 Pf patients by GNLY ELISA. Statistical analysis was performed by two-tailed nonparametric unpaired t-test (a,f), two-way ANOVA with Sidak’s multiple comparisons test (d), and area under the curve, followed by two-tailed nonparametric paired t-test, followed by two-tailed nonparametric paired t-test (e). Mean ± s.e.m. is shown. P value: *<0.05, **<0.01, ***<0.001, ****<0.0001.
Infected RBCs induce GNLY in healthy donor γδ2 T and NK
γδ2 T cell expansion, activation and killing suggested that γδ2 T cells recognize iRBCs. To determine which lymphocytes respond to iRBCs, peripheral blood mononuclear cells (PBMCs) from HD in a nonendemic area (Boston) were analyzed for cytotoxic molecule up-regulation and activation after 7 days of coculture with uRBCs or iRBCs in medium containing interleukin 2 (IL-2) and IL-15, which were required to maintain γδ2 T cell viability. uRBCs did not significantly alter GNLY expression in any lymphocyte subset or alter PFN or GzmB in T cells. uRBC coculture significantly down-regulated PFN and slightly increased GNLY in NK. However, incubation with iRBCs up-regulated the proportion of GNLY+ γδ2 T and NK cells compared to culture with uRBCs but had no effect on GNLY in CD4+ or CD8+ T cells, which remained uniformly GNLY− (Fig. 2a). CD4+ and CD8+ T cells also did not significantly change GzmB or PFN staining in response to iRBCs compared to uRBCs, suggesting that they did not recognize iRBCs (Fig 2b,c). Incubation with iRBCs, compared to uRBCs, down-regulated PFN and did not change GzmB staining in HD γδ2 T cells, consistent with the changes observed in circulating Pf vs HD γδ2 T cells. A higher proportion of HD γδ2 T cells stained for both CD69 and CD16 after incubation with iRBCs than with uRBCs (Fig. 2d,e). HD NK significantly increased expression of all three cytotoxic molecules after coculture with iRBCs, consistent with NK changes observed in Pf patients (Fig. 1). Taken together these data suggest that γδ2 T cells and NK respond to iRBCs.
Figure 2. iRBCs activate γδ2 T cells.
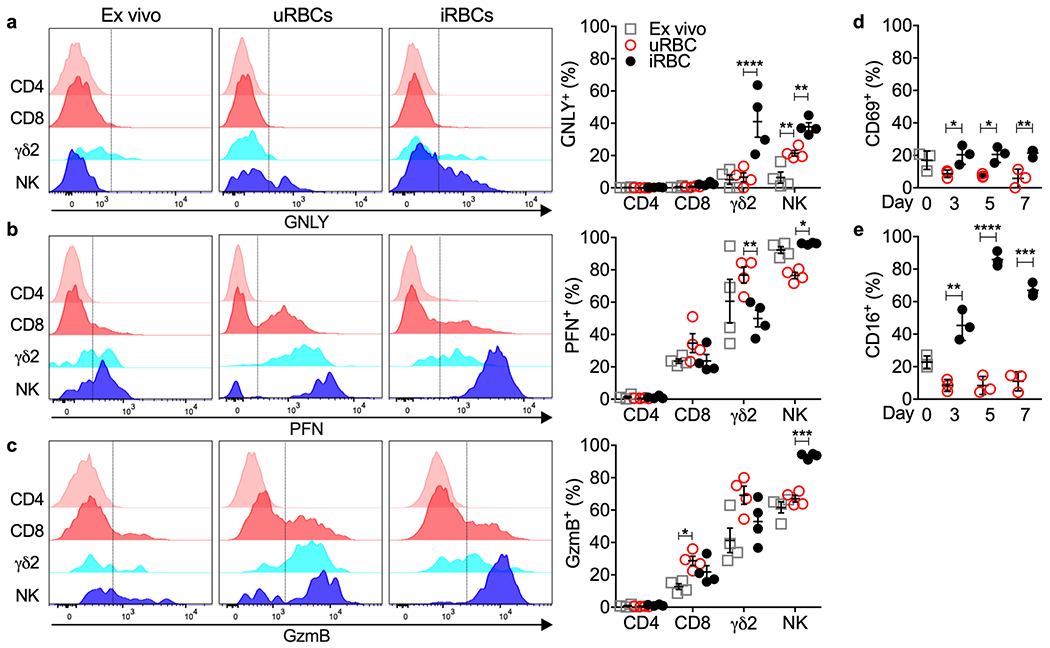
a-c, PBMC from HD were evaluated ex vivo (day 0) and after co-culture with uRBCs or iRBCs for 7 days. Shown are representative flow cytometry histograms (left) and percent positive cells for 4 HD samples (right) after staining for cell surface CD3+CD4+ (CD4), CD3+CD8+ (CD8), CD3+TCRδ2+ (γδ2), CD3−CD56+ (NK) and intracellular GNLY (a), PFN (b) or GzmB (c). The vertical gating lines were drawn based on the unstained sample. d,e, γδ2 T cell activation before and during co-culture with uRBCs or iRBCs was evaluated by CD69 and CD16 staining, n=3 independent donor samples. Statistical analysis was performed by two-way ANOVA with Sidak’s multiple comparisons test (a-c) and two-way ANOVA with Tukey’s multiple comparisons test (d-e). Mean ± s.e.m. is shown. P value: *<0.05, **<0.01,***<0.001, ****<0.0001. Data shown are representative of three independent experiments.
Infected RBCs dimly express BTN3A1 and BTN2A1
The γδ2TCR recognizes BTN3A1 when phosphoantigen is bound to its intracellular domain27–29. To determine whether iRBCs express the γδ2TCR ligand, BTN3A1 cell surface staining was analyzed by immunofluorescence microscopy and flow cytometry (Fig. 3a–d). uRBCs dimly stained for surface BTN3A1 (antibody clone BT3.1) but staining on iRBCs was greater. The increase in BTN3A1 expression on iRBCs was unexpected, since mature RBCs cannot synthesize proteins. BTN3A1 staining also increased in uRBCs incubated with HMBPP, suggesting that phosphoantigen binding to BTN3A1 may have stabilized the receptor or introduced a conformational change that increased antibody binding. Nonetheless, iRBC BTN3A1 staining was much dimmer than on brightly staining γδ2 T cells. Of note, BTN3A1 staining was brighter on trophozoite and schizont than ring stage iRBCs (Extended Data 3a,b). BTN2A1, which associates with BTN3A1 to activate γδ2 T cells30,31, faintly stained uRBCs but similarly increased on iRBCs (most strongly in trophozoite and schizont stages) and after adding HMBPP (Extended Data 3c,d). γδ2 T cells also expressed more cell surface BTN2A1 than iRBCs.
Figure 3. γδ2 T cells recognize and lyse iRBCs.
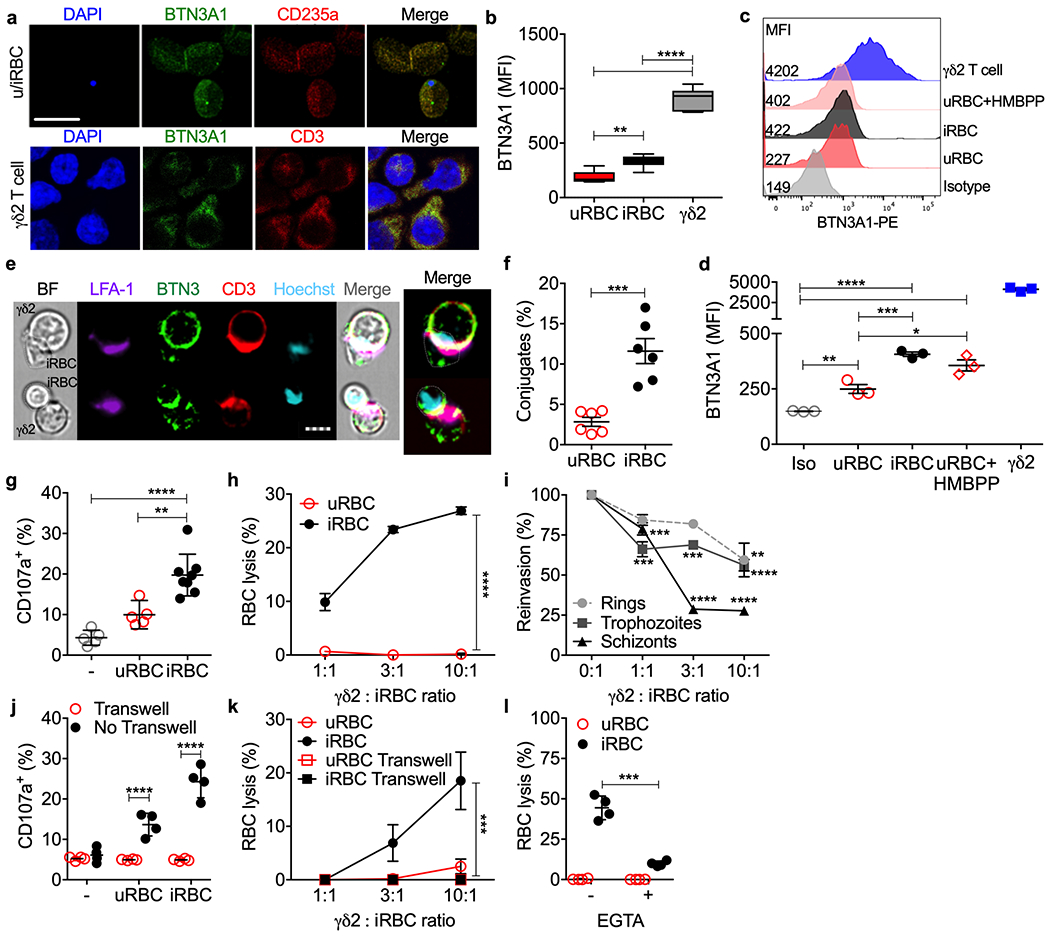
a-d, Cell surface BTN3A1 on RBCs (a, top row) and γδ2 T cells (a, bottom) imaged and quantified for 3 HD samples (b) by confocal microscopy and by flow cytometry (c,d). DAPI stains parasite DNA in iRBCs and T cell nuclei; CD235A stains glycophorin A on RBCs. An isotype control antibody (Iso) was added to a mixture of uRBCs, iRBCs, γδ2 T cells (c,d). e-i, Highly purified HD γδ2 T cells activated by culture in IL-2 and IL-15, were added to uRBCs or iRBCs to assess immunological synapse formation (e) and conjugation with uRBCs and iRBCs by imaging flow cytometry (n=6) (f), degranulation by externalized CD107a (n=5 and 8) (g), RBC lysis by flow cytometry (n=5) (h) and effect on parasite reinvasion (n=5) (i). (e) shows representative images of conjugated cells by bright field (BF) and staining for LFA-1, BTN3A1 (BTN3), CD3 and Hoechst DNA dye. In (i), parasite reinvasion was measured by flow cytometry after iRBCs synchronized at ring, trophozoite and schizont stages were cultured with or without γδ2 T cells at indicated E:T ratios. j,k, γδ2 T cells and RBCs, cultured together or separated by a Transwell membrane (n=4), were assayed for γδ2 T cell degranulation by CD107a staining (j) and RBC lysis (k). l, γδ2 T cells, pre-incubated or not with EGTA, were added to CFSE-labeled RBCs and RBC lysis was measured by flow cytometry (n=4). Scale bars: 10 μm (a), 7 μm (e). n, biological independent samples. Statistical analysis was by one-way ANOVA with Tukey’s multiple comparisons test (b,d,g), two-tailed nonparametric unpaired t-test (f), and area under the curve, followed by two-tailed nonparametric paired t-test (h), area under the curve, followed by one-way ANOVA (k) or two-way ANOVA with Sidak’s multiple comparisons test (i,j,l). Mean ± s.e.m. is shown. P value: *<0.05, **<0.01, ***<0.001, ****<0.0001. Data shown are representative of three independent experiments.
γδ2 T cells form synapses with and lyse infected RBCs
To evaluate whether uRBCs and iRBCs bind to γδ2 T cells, purified HD γδ2 T cells, cultured in IL-2 and IL-15 for 5 days, were incubated with iRBCs or uRBCs and analyzed by imaging flow cytometry for conjugate and immune synapse formation (Fig. 3e,f). Immune synapses were visualized by capping of CD3 and LFA-1 on the γδ2 T cell. RBCs were identified by staining for CD235a (glycophorin A) and iRBCs were identified by Hoechst staining of parasite DNA. HD γδ2 T cells formed significantly more conjugates with iRBCs than uRBCs and immune synapses were only visualized with iRBCs. Capping of BTN3A1 in the iRBCs could not be assessed because BTN3A1 staining of γδ2 T cells was so much brighter than on iRBCs. HD γδ2 T cells co-cultured with iRBCs at trophozoite stage (30 h post infection (hpi)) degranulated, as assessed by CD107a externalization, significantly more than those cultured alone or with uRBCs (Fig. 3g, Extended Data 4a). Moreover, HD γδ2 T cells lysed iRBCs, but not uRBCs (Fig. 3h). To determine if iRBC lysis was restricted to γδ T cells expressing Vδ2, purified HD γδ1 and γδ2 T cell degranulation and killing were compared (Extended Data 5a). γδ2 T cells, but not γδ1 T cells, degranulated and lysed iRBCs. To identify which stage of infection γδ2 T cells recognize, parasite invasion of fresh RBCs was assessed (reinvasion assay) in co-cultures of synchronized iRBCs (rings (12 hpi), trophozoites (30 hpi) and schizonts (40 hpi)) incubated with or without HD γδ2 T cells (Fig. 3i, Extended Data 4b). Although HD γδ2 T cells reduced reinvasion when added to iRBCs at all stages, schizonts were most susceptible. At a γδ2 T cell:iRBC ratio of 10:1, parasite reinvasion was inhibited by about 40% when γδ2 T cells were added to ring or trophozoite stage iRBCs, but by approximately 70% when added at schizont stage. γδ2 T cell degranulation and iRBC lysis required direct contact between T cells and iRBCs. No degranulation or killing occurred if a membrane separated the γδ2 T cells and iRBCs (30 hpi) (Fig. 3j,k). iRBC lysis was mediated by cytotoxic granule release since it was strongly inhibited by EGTA, which prevents degranulation (Fig. 3l). Thus, HD γδ2 T cells form immune synapses with iRBCs at all stages of infection, degranulate and lyse iRBCs, crippling the parasite in a contact- and degranulation-dependent manner.
The above experiments (Fig. 3g–l) used HD γδ2 T cells that were cultured for 5 days in the lowest amount of IL-2 and IL-15 that maintained their viability. To determine whether freshly isolated HD γδ2 T cells also respond to iRBCs, degranulation and lysis of iRBCs were assessed without any in vitro culture. Fresh HD γδ2 T cells did not respond to or lyse iRBCs (Extended Data 5b,c). Thus, cytokine exposure is a prerequisite for a cytolytic γδ2 T cell response to iRBCs.
GNLY and GzmB mediate intracellular P. falciparum killing
In previous studies of CD8+ T cell defense against other protozoan parasites (T. cruzi, T. gondii, L. major, Pv), intracellular parasites were killed when killer cells degranulated, leading to GNLY entry into the host cell and binding to the parasite and parasitophorous vacuole membranes. GNLY permeabilized both membranes, allowing GzmB access to kill the parasite1,32. GNLY is much more active in cholesterol-poor microbial membranes than cholesterol-rich mammalian plasma membranes. Killing of intracellular non-malaria protozoan parasites depended on PFN to deliver GNLY and GzmB into the host cell32, while Pv killing in infected reticulocytes was PFN-independent, because Pv harvests cholesterol from the reticulocyte cell membrane, making it susceptible to GNLY1. To determine which cytotoxic proteins are involved in iRBC lysis and parasite killing, combinations of recombinant human GzmB and purified human PFN and GNLY were incubated with iRBCs 30 hpi (trophozoite stage) and assessed for iRBC lysis (Fig. 4a) and parasite invasion of fresh RBCs (Fig. 4b). iRBC lysis was mediated by GNLY but increased (but not significantly) if PFN was also added. GzmB on its own had no effect and when added to GNLY did not increase iRBC lysis. In contrast, inhibition of parasite replication required both GNLY and GzmB and was not enhanced by PFN. These results resemble what was previously found for Pv-infected reticulocytes1.
Figure 4. GNLY delivers GzmB into iRBCs to cause iRBC lysis and parasite killing.
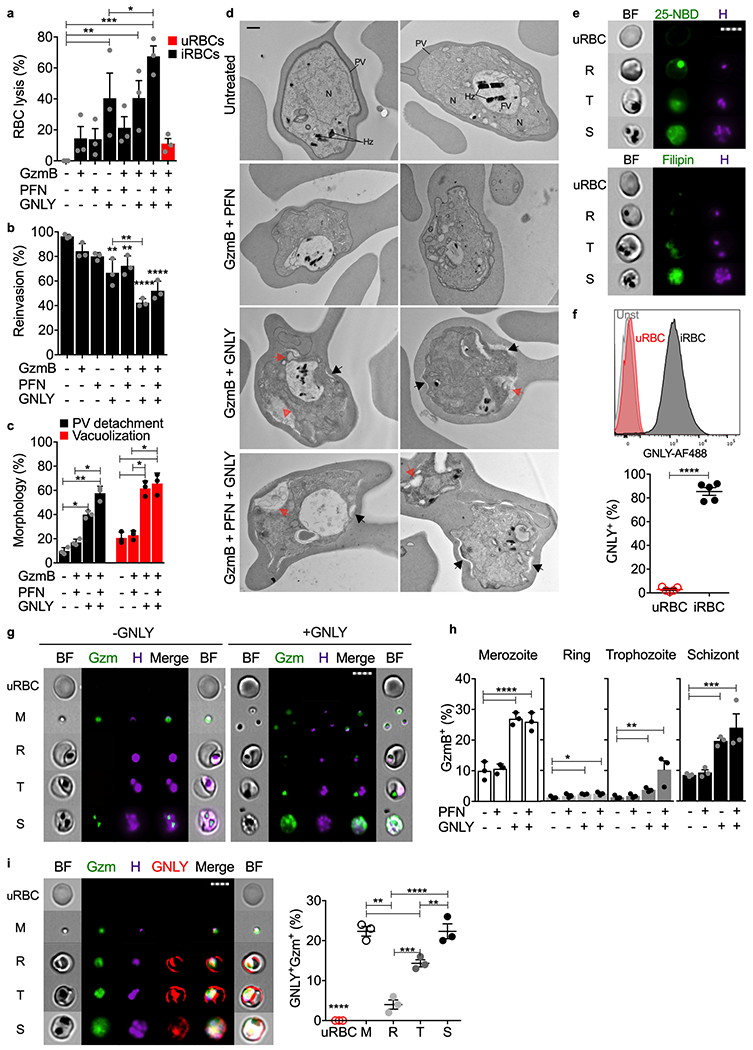
a-c, RBCs, incubated with indicated combinations of cytotoxic effector proteins (n=3), were assayed for RBC lysis by LDH release (a), parasite reinvasion into fresh RBCs by flow cytometry (b), and parasite morphology by electron microscopy (c,d). (c) quantifies prominent morphological alterations in EM images - parasitophorous vacuole (PV) detachment (black arrows) and increased parasite vacuolization (red arrows) in 15 images from 3 sections. Parasite nucleus (N), food vacuole (FV), hemozoin (Hz) are labeled in untreated iRBCs. e, uRBCs or unsynchronized iRBCs, stained with 25-NBD or filipin as cholesterol probes and Hoechst for parasite DNA, were analyzed by imaging flow cytometry using DNA staining to gate for different parasite stages (R ring, T trophozoite, S schizont). BF, bright field, H, Hoechst dye. f, Representative histograms (top) and quantification of multiple samples (bottom) of AF647-GNLY binding to uRBCs and iRBCs (trophozoite stage) by flow cytometry (n=5). g,h, GzmB-AF488 internalization in the absence or presence of GNLY or PFN assessed by imaging flow cytometry (n=3). (g) shows GzmB-AF488 (Gzm) internalization in representative images and (h) shows the proportion of RBCs at different parasite stages that stained for GzmB in multiple experiments, n=3. i, Representative images (left) and quantification (right) of imaging flow cytometry showing RBC, uninfected or infected at indicated parasite stage, incubated with GzmB-AF488, GNLY-AF647 and unlabeled GNLY, n=3. M, merozoite; R, ring; T, trophozoite; S, schizont; H, Hoechst dye; BF, bright field; n, biological independent samples. Scale bars: 500 nm (d), 7 μm (e,g,i). Statistical analysis was by one-way ANOVA with Tukey’s multiple comparisons test (a,b,c,h,i) or two-tailed nonparametric unpaired t-test (f). Mean ± s.e.m. is shown. P value: *<0.05, **<0.01, ***<0.001, ****<0.0001. Data shown are representative of three independent experiments.
Adding γδ2 T cells to iRBCs at all stages of parasite development inhibited the parasite multiplication rate, as did addition of cytotoxic effector molecules to trophozoite stage iRBCs (Fig. 4b). To evaluate which asexual stages were susceptible, unsynchronized iRBCs, untreated or incubated with GzmB together with GNLY and/or PFN, were analyzed for changes in parasite morphology by electron microscopy (Fig. 4c,d, Extended Data 6a). GzmB plus GNLY, but not GzmB plus PFN, caused detachment of the parasitophorous vacuole membrane and extensive changes in parasite morphology, especially prominent vacuolization. Vacuolization occurred in both ring and trophozoite stages. Thus, all Pf asexual stages are killed by the combination of GNLY and GzmB, independently of PFN.
GNLY binding to iRBC delivers GzmB to the parasite
Cholesterol depletion of RBC membranes renders uRBC membranes susceptible to GNLY1. Membrane cholesterol depletion can be assessed by measuring binding of the cholesterol analog 25-[N-[(7-nitro-2-1,3-benzoxadiazol-4-yl)methyl]amino]-27-norcholesterol (NBD) or the Streptomyces filipinensis natural product, filipin. Both compounds only bound weakly to uRBCs, but both bound to iRBCs and concentrated with the Hoechst-labeled parasite at all stages of blood infection (Fig. 4e). Staining was much brighter at the schizont stage than earlier in infection, presumably because the higher parasite burden at schizont stage more efficiently harvested cholesterol. As expected, GNLY bound to iRBCs, but at best weakly to uRBCs (Fig. 4f). To assess whether GNLY delivered GzmB into iRBCs and to the parasite at different stages or to free merozoites, uRBCs or unsynchronized iRBCs, were incubated with Hoechst dye and fluorescent GzmB-AF488 and analyzed by imaging flow cytometry (Fig. 4g,h, Extended Data 6b,c). In the absence of GNLY, some GzmB was taken up by merozoites and iRBCs harboring schizonts, likely reflecting the fragility of parasite and iRBC membranes just before and after egress. However, GNLY significantly enhanced GzmB uptake into merozoites and iRBCs at all stages. Moreover, GzmB concentrated in or near the parasite Hoechst signal, indicating it was accessing the parasite. PFN on its own had no significant effect, but enhanced GzmB uptake by GNLY into ring and trophozoite stage iRBCs. We interpret these results to indicate that iRBC membranes at earlier stages still retain enough cholesterol to make them PFN-sensitive and partially GNLY-resistant. To compare GNLY and GzmB trafficking in merozoites and iRBCs, GNLY and PFN uptake and localization were analyzed by imaging flow cytometry in uRBCs and unsynchronized iRBCs after incubation with GzmB-AF488, GNLY-AF647, unlabeled GNLY (since fluorescent labeling interferes with GNLY membrane permeabilization but not binding) and Hoechst dye to stain the parasite (Fig. 4i). Fluorescent GNLY bound to merozoite and iRBC plasma membranes, but not uRBCs, and also brightly stained intracellular parasites. In contrast, GzmB was disseminated in the merozoite and iRBC cytosol but concentrated with the parasite in iRBCs. Thus, GNLY binds to parasite and iRBC membranes and delivers GzmB to the parasite at all blood stages.
iRBC recognition depends on the γδ2TcR, HMBPP and BTN3A1
We hypothesized that γδ2 T cells recognize and lyse BTN3A1+ iRBCs via their TCR13,14. To determine whether γδ2 T cell degranulation and iRBC lysis depends on the γδ2TCR, HD γδ2 T cell degranulation (Fig. 5a) and RBC lysis (Fig. 5b) were measured in the presence of blocking antibodies to the γδTCR, αβTCR, HLA class I, or CD36 (a γδ2 T cell scavenger receptor)33 or control antibody. As expected, γδ2 T cells did not degranulate to or lyse uRBCs. γδ2 T cell degranulation and iRBC lysis were strongly and significantly inhibited by blocking the γδTCR, but not by the other antibodies, indicating that iRBC recognition is mediated by the γδTCR. To evaluate whether recognition depends on malaria phosphoantigen, degranulation (Fig. 5c) and RBC lysis (Fig. 5d) by HD γδ2 T cells against uRBCs or iRBCs (30 hpi) were measured in the presence of added HMBPP or isopentenyl pyrophosphate (IPP) and/or pretreatment with fosmidomycin, an inhibitor of isoprenoid biosynthesis. Fosmidomycin was added 6 hpi34. IPP is a mammalian phosphoantigen metabolite that weakly stimulates γδ2 T cells at micromolar concentrations, compared to the parasite metabolite HMBPP, which is active at picomolar concentrations27,29. γδ2 T cell degranulation increased significantly when HMBPP was added to cultures with or without uRBCs or iRBCs. Moreover, fosmidomycin pretreatment of iRBCs, reduced degranulation to background, which was partially restored by adding IPP. Similarly, uRBC lysis only occurred in the presence of added phosphoantigen and iRBC lysis was inhibited by fosmidomycin and partially rescued by exogenous IPP. Taken together, these data indicate that iRBCs express enough BTN3A1 to be recognized by γδ2 T cells. To confirm the role of BTN3A1, HD γδ2 T cell degranulation and iRBC lysis were compared when iRBCs were pretreated with blocking antibodies to BTN3A1 (clone 103.2), the γδTCR or an isotype control antibody. Both degranulation and iRBC killing were strongly inhibited by BTN3A1 and γδTCR blocking antibodies (Fig. 5e,f), indicating that γδ2 T cell lysis of iRBCs depends on both BTN3A1 and the γδTCR.
Figure 5. P. falciparum HMBPP activates γδ2 T cells via the γδTCR and BTN3A1.
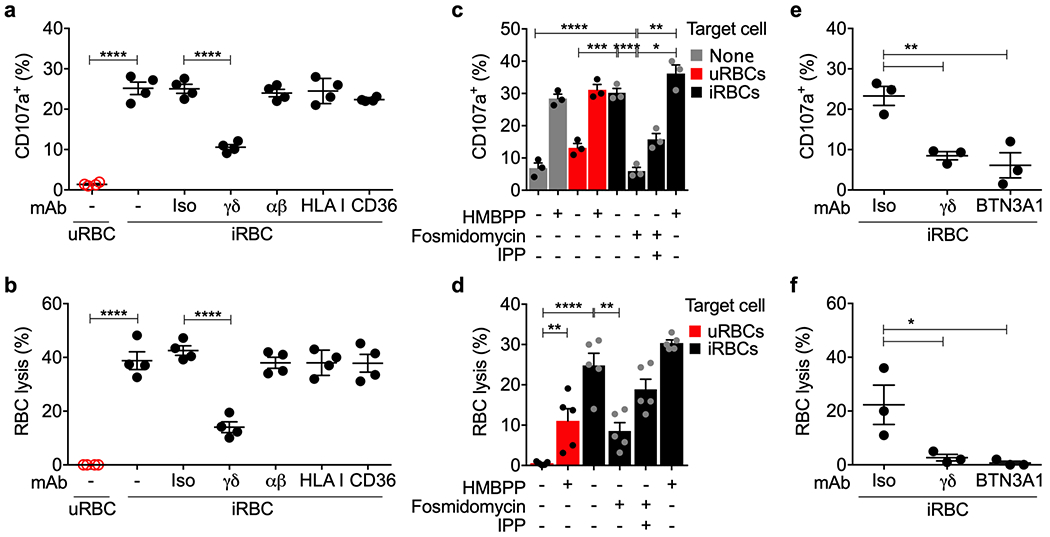
a,b, Highly purified HD γδ2 T cells, pre-activated with IL-2 and IL-15, were co-cultured with iRBCs in the presence of indicated blocking or isotype control (Iso) antibodies (n=4) and assayed for γδ2 T cell degranulation by cell surface CD107a (a) and RBC lysis (b) by flow cytometry. c,d, HD γδ2 T cells were co-cultured with iRBCs pre-treated with indicated combinations of fosmidomycin and IPP, uRBCs or HMBPP to assess degranulation (n=3) (c) and RBC lysis (n=5) (d). e,f, γδ2 T cell or iRBCs were pre-incubated with blocking antibodies to γδTCR, BTN3A1 or isotype control (Iso) before co-culture (n=3) to assess degranulation (e) and RBC lysis (f). n, biological independent samples. Statistical analysis was performed by one-way ANOVA with Tukey’s multiple comparisons test. Mean ± s.e.m. is shown; P value: *<0.05, **<0.01, ***<0.001, ****<0.0001. Data shown are representative of three independent experiments.
γδ2 T cells phagocytose opsonized iRBCs
Since γδ2 T cells can phagocytose opsonized bacteria21, we wondered whether they might also phagocytose iRBCs, which could provide another mechanism for controlling erythrocytic infection. To test this hypothesis, HD γδ2 T cells were incubated with carboxyfluorescein diacetate succinimidyl ester (CFSE)-stained uRBCs or iRBCs (blood type O, Rh-negative) that had been pre-incubated with medium, AB HD or Pf patient serum, or anti-CD235a (glycophorin A). Cocultures were analyzed by imaging flow cytometry for HD γδ2 T cell engulfment of RBCs (Fig. 6a,b). HD γδ2 T cells took up uRBCs or iRBCs if they were opsonized with anti-CD235a, but phagocytosis of iRBCs was significantly higher than uRBCs. Moreover, Pf sera, but not HD sera, increased γδ2 T cell phagocytosis of iRBCs compared to uRBCs. γδ2 T cell phagocytosis of iRBCs was confirmed by staining for the RBC marker CD235a after coculture of Pf serum-opsonized CFSE-labeled iRBCs with HD γδ2 T cells (Fig. 6c,d). As expected, the CD3+CFSE+ γδ2 T cells did not stain for external CD235a, confirming that the iRBCs were internalized. To further confirm internalization, Cell-tracker-labeled γδ2 T cells and CFSE-labeled iRBCs were cocultured in the presence of Pf sera and imaged by confocal live cell imaging over 1 h (Fig. 6e). 3D reconstructions clearly showed iRBCs completely enclosed within the γδ2 T cells after 30 min. The proportion of phagocytosed iRBCs increased from 30 to 60 min. At 60 min, CSFE fluorescence within the γδ2 T cells was fragmented and reduced in intensity, suggesting lysosomal degradation of phagocytosed iRBCs. Freshly isolated HD γδ2 T cells did not phagocytose opsonized iRBCs (Extended Data 5d,e), unlike the ex vivo-cultured HD γδ2 T cells used in Fig. 6a–e. Thus, HD γδ2 T cells require cytokine exposure to both lyse and phagocytose iRBCs.
Figure 6. γδ2 T cells phagocytose opsonized P. falciparum-infected RBCs.
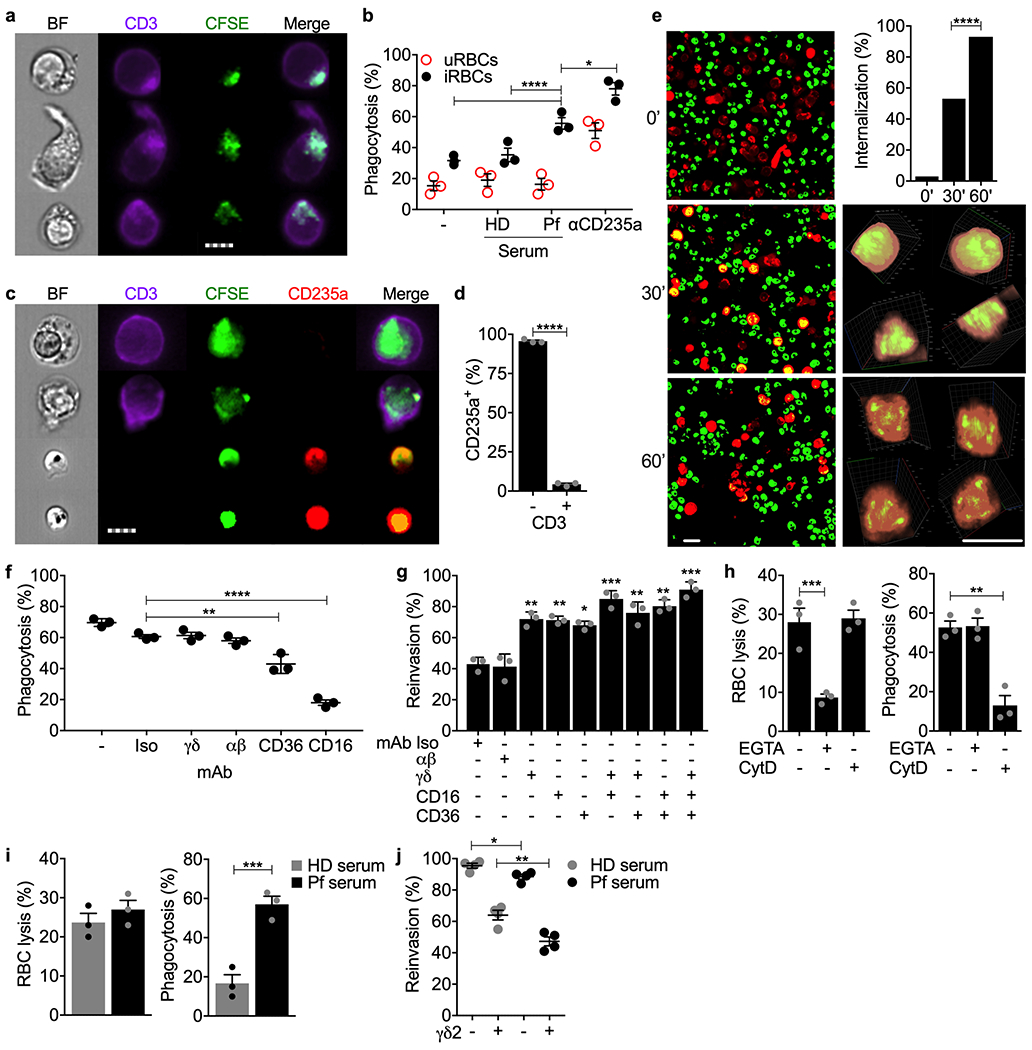
a,b, CFSE-stained iRBCs and uRBCs, pre-incubated with HD human AB serum, Pf-infected patient serum or anti-CD235a, were co-cultured with HD γδ2 T cells and assessed for phagocytosis by costaining of gated singlet cells for CFSE and CD3 by imaging flow cytometry. Representative images of three experiments are shown in (a) and quantification of the proportion of γδ2 T cells with internalized RBCs in 3 samples is in (b). c,d, CFSE-labeled iRBC were opsonized with Pf serum and co-cultured with 3 HD γδ2 T cells. Samples were fixed and stained with PerCP-Cy5.5-anti-CD235a and PB-anti-CD3. (c) shows representative images of engulfed iRBC (CFSE+CD235a−) by γδ2 T cells (CD3+) (top 2 panels) and free iRBCs (CFSE+CD235a+) (bottom 2 panels), quantified in (d) for the proportion of cells that stained for accessible RBC marker CD235a. e, Confocal time-lapse images (63x) over 1 hr of co-culture of CellTracker-labeled γδ2 T cells (red) and CSFE-labeled iRBCs (green) opsonized with Pf serum (left) and quantification of proportion of γδ2 T cells that internalized iRBCs (upper right). Magnified 3D reconstructions of individual cells in two orthogonal rotations at 30’ and 60’ are shown at right. f,g, Effect of indicated blocking antibodies on HD γδ2 T cell phagocytosis (f) and inhibition of parasite reinvasion (g). γδ2 T cells were pre-treated with blocking or isotype (Iso) control antibodies before co-culture with CFSE-stained, Pf serum-opsonized iRBCs. Phagocytosis was measured by imaging flow cytometry and parasite reinvasion was measured by flow cytometry. h, Effect of an actin inhibitor and Ca++ chelator on γδ2 T cell lysis (left) and phagocytosis (right) of iRBCs opsonized with Pf serum (n=4). HD γδ2 T cells were pre-treated with EGTA or cytochalasin D (CytD) prior to co-culture with iRBCs. i,j, Comparison of the effect of HD and Pf sera on HD γδ2 T cell iRBC lysis (i, left), phagocytosis (i, right) (n=4) and inhibition of parasite reinvasion (j). n, biological independent samples. Scale bars: 7 μm (a,c), 10 μm (e). Statistical analysis was by two-way ANOVA (b,j), one-way ANOVA with Tukey’s multiple comparisons test (f-h), two-tailed Chi-square test (e), and two-tailed nonparametric unpaired t-test (d,i). Mean ± s.e.m. is shown. P value: *<0.05, **<0.01, ***<0.001, ****<0.0001. Data shown are representative of at least three independent experiments.
To determine whether γδ2 T cell phagocytosis depended on the TCR or opsonized antibody recognition by the Fcγ receptor III CD16 (which is increased on Pf donor γδ2 T cells8 and after HD γδ2 T cell exposure to iRBCs (Fig. 1c,2e)), phagocytosis of iRBCs opsonized with Pf sera was assessed in the presence of blocking antibodies to γδTCR, αβTCR, CD16, CD36 or control antibody (Fig. 6f). Blocking CD16 and to a lesser extent CD36 impaired iRBC phagocytosis, but TCR antibodies had no effect. To evaluate whether phagocytosis of iRBCs inhibited parasite infectivity and how much parasite control was due to γδTCR-dependent killing versus phagocytosis, parasite invasion of fresh RBCs was measured in the presence of control antibodies or TCR, CD16 or CD36 blocking antibodies (Fig. 6g). In the presence of isotype control or αβTCR antibodies, adding γδ2 T cells reduced reinvasion to 40% of the levels obtained without γδ2 T cells. Blocking the γδTCR, CD16 or CD36 in γδ2 T cell-opsonized iRBC cocultures all similarly enhanced parasite reinvasion to ~70% of the levels obtained without γδ2 T cells, while the combination of γδTCR and CD16 antibodies or all three together restored reinvasion to ~85-90% of cultures without added γδ2 T cells. Thus, both γδTCR-mediated degranulation and CD16-mediated phagocytosis contributed to controlling parasite reinvasion in the presence of opsonizing antibodies, and the combination explains most γδ2 T cell activity to prevent spread of erythrocytic infection. γδ2 T cell degranulation is inhibited by EGTA, while phagocytosis is Ca++-independent and not inhibited by EGTA but depends on actin polymerization and is inhibited by cytochalasin D. To confirm that iRBC lysis was mediated by cytotoxic granule release, while phagocytosis was independent of degranulation, iRBC lysis and phagocytosis were measured using γδ2 T cells preincubated with EGTA, cytochaslasin D or no inhibitor. As expected, EGTA strongly suppressed iRBC lysis while cytochalasin D had no effect, whereas cytochalasin D strongly inhibited phagocytosis, but EGTA did not (Fig. 6h).
CD16 activation can also trigger T and NK cells to degranulate and kill target cells via antibody-dependent cellular cytotoxicity (ADCC). To determine whether iRBC opsonization triggered γδ2 T cell ADCC, iRBC lysis and phagocytosis were compared when γδ2 T cells were added to iRBCs preincubated with HD or Pf sera (Fig. 6i). Although Pf sera strongly increased phagocytosis as expected (Fig. 6b), it had no significant effect on iRBC lysis, indicating that ADCC is not an important component of the γδ2 T cell response to blood stage infection. To assess the relative importance of killing vs phagocytosis in parasite control, parasite reinvasion was compared when iRBCs were preincubated with HD or Pf sera in the presence or absence of γδ2 T cells (Fig. 6j). γδ2 T cells reduced reinvasion by 36±8% when iRBCs were incubated with HD sera, but by 53±4% after incubation with Pf sera. The increased inhibition of parasite reinvasion by γδ2 T cells in Pf vs HD sera was significant (P = 0.042), confirming the importance of phagocytosis in deterring reinvasion. Although γδ2 T cell killing appeared to have more of a role than phagocytosis in limiting parasite reinvasion in this experiment, the relative importance of killing versus phagocytosis in immune protection likely changes with the abundance of opsonizing antibodies and their ability to trigger CD16-mediated phagocytosis.
Discussion
Although conventional T cells and NK contribute to Pf malaria protection35,36,37, circulating innate-like γδ2 T cells are increasingly recognized as important defenders against erythrocytic malaria. Here we showed that γδ2 T cells formed immunological synapses with and lysed iRBCs at all parasite stages, and destroyed the parasite. Parasite reinvasion was reduced by just GNLY, which lysed iRBCs independently of PFN, and further reduced by adding GzmB, which killed the parasite. For CD8+ T cell control of Pv, Pv-infected reticulocytes become GNLY-susceptible because cholesterol inhibits GNLY activity and the parasite harvests and depletes cholesterol from the reticulocyte membrane1. Here we showed that the same mechanism applies to Pf-infected mature RBC. Schizont stage iRBC were most susceptible, probably not only because the RBC membrane is more depleted of cholesterol at that stage, but also because iRBCs generate more phosphoantigen as the parasites replicate and because schizont stage iRBC cell membranes are more fragile.
iRBC lysis and parasite inhibition required direct iRBC contact and depended on the γδ2TCR and parasite-produced phosphoantigens bound to BTN3A1, since they were abrogated when γδ2 T cells and iRBCs were separated by a membrane or by blocking γδTCR, BTN3A1 or isoprenoid biosynthesis. BTN2A1, which associates with BTN3A1 and binds to Vγ9 and is also required for γ9δ2TCR phosphoantigen sensing30,31, is also weakly expressed on uRBCs (as previously shown by proteomics38,39), but increased on iRBCs. T cells can likely recognize low BTN expression on iRBCs, as has been shown for recognition of another BTN even when its expression was below detection40,41.
We identified an unexpected additional mechanism by which γδ2 T cells destroy iRBCs - antibody-dependent phagocytosis (ADP). In a CD16-dependent, but TCR and degranulation-independent process, γδ2 T cells engulfed and destroyed antibody-opsonized iRBC. Surprisingly opsonized iRBCs did not activate ADCC, which is normally triggered by the same (CD16) receptor8,9. Understanding why opsonized iRBCs trigger CD16-dependent ADP, but not ADCC, in γδ2 T cells needs investigating.
ADP is typically a property of myeloid cells21,42. γδ2 T lymphocytes have some myeloid cell properties - phagocytosis of opsonized bacteria22 and antigen cross-presentation23. However, γδ2 T cells were not previously known to phagocytose antibody-coated mammalian cells. Thus, these innate-like lymphocytes, whose TCR responds to phosphoantigen, a pathogen-associated molecular pattern (PAMP)43, can be considered innate lymphocytes, which also deploy myeloid functions to control infection. γδ T-like cells have been described in lamprey and most vertebrates and are the first T cells to develop in the thymus before αβ T cells44. In more primitive vertebrates, including amphibians and birds, the δ chain uses V genes that closely resemble immunoglobulin heavy chain V genes, suggesting that an antibody-like protective mechanism may have dominated in primitive γδ T cells. It will be worth investigating whether other subsets of innate and innate-like cytotoxic lymphocytes (NK, MAIT, iNKT, ILC) perform ADP. Circulating γδ T cells or other lymphocytes that phagocytose opsonized RBC could also play an unsuspected pathogenic role in autoimmune hemolytic anemias.
Why γδ2 T cell expansions correlate with protection from vaccination has been puzzling. Both γδ2 T cell myeloid functions and cytotoxicity could contribute to vaccine protection. Phagocytosis of opsonized iRBCs should not only suppress parasite replication but also induce adaptive immune responses to cross-presented malaria antigens when the parasite is degraded in the phagolysosome. ADP by tissue T cells bearing other γδTCRs, that could for example neutralize sporozoites injected into the skin by mosquitoes, could also help protect against challenge following vaccination. Evaluating γδ T cell ADP should be added to the list of functional assays performed to evaluate vaccines that induce cellular and humoral immunity, such as attenuated sporozoite vaccines, and that primarily elicit antibodies, such as RTS,S.
Both the lytic and phagocytic functions of γδ2 T cells required exposure to IL-2 and/or IL-15 since freshly isolated HD γδ2 T cells lacked both activities. In Pf-infected patients, where there is a lot of inflammation and circulating cytokines, γδ T cells are highly activated and likely have these functional capabilities. Since cryopreserved activated lymphocytes do not survive well after thawing, future onsite studies are needed to evaluate the relative importance of cytolysis versus phagocytosis in immune protection and pathology in different infection settings. These studies can only be done in humans (or possibly non-human primates) since small animals, such as rodents, lack both Vγ9 and GNLY. γδ2 T cell ADP function likely is more important in chronic infection, reinfection and after vaccination when pathogen-specific antibodies are present. This is likely true not only for malaria, but also for other bacterial and parasite infections that γδ T cells recognize.
ADP likely contributes to clinical immunity that develops in children repeatedly exposed to Pf, who eventually become asymptomatic7–9, which correlates with development of Pf antibodies45,46. The γδ2 T cell population in these multiply infected children becomes “exhausted” for TCR activation and cytotoxicity7, but CD16 expression after repeated exposures increases8. γδ2 T cell exhaustion was not evaluated in our study, since it was unlikely to happen over the time scale of our in vitro experiments. Future onsite work should examine whether γδ2 T cell exhaustion coincides with increased ADP function and whether the relative importance of ADP versus cytolysis increases after multiple exposures when anti-malarial antibody titers are increased. Phagocytosis should be less inflammatory in controlling blood-stage infection than iRBC lysis, which would release PAMPs and DAMPs that trigger fever and other symptoms. Clinical resistance to Pf malaria in multiply exposed children has also been correlated to CD16-mediated ADCC by an expansion of adaptive NK36,47,48. Studies to evaluate whether NK also phagocytose opsonized iRBCs should be performed to evaluate whether ADP might contribute to NK protection.
Pioneering studies by C. Behr19,12, which were confirmed in a recent publication49 and here, showed that Pf patient γδ2 T cells degranulate in the presence of iRBCs and inhibit parasitemia in a synchronized trophozoite RBC infection in a phosphoantigen, γδTCR and GNLY-dependent, but PFN-independent, mechanism. However, they did not detect BTN3A1 on iRBCs12 and therefore did not investigate whether γδ2 T cells directly recognize iRBCs. The Behr study12 likely didn’t detect dim BTN3A1 on iRBCs because they used a weak fluorophore (FITC)-coupled secondary antibody to detect BTN3A1, while we used a brighter directly conjugated fluorophore (PE). Because they didn’t detect BTN3A1 on iRBCs and found that phosphoantigen released during merozoite egress caused γδ2 T cell degranulation, they proposed that released phosphoantigen activates γδ2 T cell degranulation and released GNLY kills merozoites in a cell contact-independent manner. The evidence for their model is based on γδ T cell suppression of parasite levels in merozoite-infected RBC after a day of culture. The inhibition they saw could have been due to either targeting merozoites or targeting parasites within iRBCs.
Neither the Behr group nor we evaluated whether γδ2 T cells bind to or are activated by merozoites, which would be challenging to assess because merozoites are short-lived and fragile. γδ2TCR activation by merozoites is unlikely because merozoites do not display host proteins, no parasite genes are homologous to BTNs, and BTN3A1 is not detected on merozoites (data not shown). GNLY may not be released in sufficient amounts to lyse merozoites. Plasma GNLY in Pf patients averaged 11 nM in a previous study21 and in the Brazilian Pf patients analyzed here was even lower. Although merozoite sensitivity to GNLY would be difficult to measure, micromolar GNLY concentrations are required to lyse other parasites20,50. We found, however, that merozoites bind GNLY and take up GzmB. It remains unclear whether GNLY serum concentrations are high enough for merozoites to be vulnerable to secreted GNLY in vivo.
Methods
Malaria patients and healthy donors.
Pf-infected patients were recruited from the outpatient malaria clinic in the Tropical Medicine Research Center in Porto Velho, Brazil. Male and female patients, older than 18 years old were tested for Pf infection by blood thick smear and PCR. Untreated acute Pf-infected patients or uninfected HD signed informed consent prior to blood collection. Patients co-infected with Pv, other known infectious diseases, chronic inflammatory disease or pregnancy were excluded. Collected blood samples were used to obtain PBMCs, plasma and serum. HD blood samples from a nonendemic region (Boston) were obtained from the Brigham and Women’s Hospital blood bank. The research protocol was approved by the Institutional Review Boards of the Oswaldo Cruz Foundation and National Ethical Council (Brazil), University of Massachusetts Medical School and Boston Children’s Hospital.
Reagents.
Antibodies and fluorescent dyes are listed in Supplementary Table 1.
PBMCs and γδ T cells.
PBMCs were isolated from total peripheral blood by Ficoll gradient (GE Healthcare) centrifugation. γδ T cells were purified from total PBMCs by staining with phycoerythrin (PE) anti-γδ2 or anti-γδ1, followed by positive selection with anti-PE magnetic microbeads (Miltenyi Biotec). Unless otherwise indicated, γδ T cells were cultured in vitro for 5 days in RPMI supplemented with 10% human AB serum, penicillin/streptomycin and 200 IU/ml IL-2 and 25 ng/ml IL-15 at 37°C, 5% CO2. The IL-2 and IL-15 concentrations were titrated to the lowest concentrations, which on their own without any added phosphoantigen preserved viability with minimal activation of γδ2 T cells.
Pf culture.
3D7 strain (BEI) was cultured in human O+ RBCs in RPMI medium supplemented with 0.5% Albumax II + 0.62% NaHCO3 at 37°C, 5% CO2, 1% O2, 94 % N2. For phagocytosis assays, parasites were cultured in O− RBCs. Parasite synchronization was achieved by consecutive rounds of 60% Percoll gradient and 5% sorbitol centrifugation. iRBCs at trophozoite or schizont developmental stages were enriched by parasite hemozoin affinity on magnetic MACS LS columns (Miltenyi Biotec)51. Ring stages were isolated 12 h post infection (hpi), trophozoites at 30 hpi and schizonts at 42 hpi. The functional assays with iRBCs at trophozoite and schizont stages were performed with magnetically purified iRBCs which had an infection rate of >95%. Ring stage killing assays were performed with ~50% infected RBCs. Infected RBCs from Pf-infected patients (Fig.1e) were isolated by 60% Percoll gradient and had an infection rate of >95%.
Immunophenotyping and flow cytometry.
PBMCs were stained for lymphocyte populations (CD4+, CD8+, γδ2 or NK). Cells were first stained for cell surface CD4, CD8, CD3, CD56, TCRδ2, CD69 and CD16 and then permeabilized in Fix/Perm buffer and stained in Perm/Wash buffer (BD Bioscience) for cytotoxic granule proteins (GzmB, GNLY, PFN) as per the manufacturer’s instructions. HD PBMCs were cultured with uRBCs or iRBCs at an E:T ratio of 1:5 for 7 d in RPMI supplemented with 10% human AB serum, penicillin/streptomycin and low IL-2 (20 IU/ml) and IL-15 (25 ng/ml) at 37°C and 5% CO2. At days 0 (ex vivo), 3, 5 or 7, cells were harvested, then stained with the same antibodies. RBCs, infected or not, were incubated with 100 nM GNLY-Alexa Fluor 488 to quantify GNLY binding to the cell membrane by flow cytometry. Flow cytometry data acquisition was performed using a FACSCelesta (BD Bioscience) or FACSCanto II (BD Bioscience) flow cytometer and analyzed using FlowJo software V.10 (Tri-Star). PE-anti-BTN3A1 (BT3.1) stained samples were acquired using the FACSCanto SORP yellow-green laser for optimal excitation of the fluorophore.
γδ T cell–RBC coculture.
Purified γδ T cells and RBCs were co-cultured at 37°C, 5% CO2 for 4 h in 96-well plates or in 0.4 μm Transwell plates (Corning) (γδ T cells on bottom, RBCs on top) to assess T cell degranulation (E:T ratio 1:5), RBC lysis or parasite reinvasion (E:T ratio 1:1, 3:1, 10:1). Degranulation was assessed by CD107a staining52 and flow cytometry. Some experiments were performed in the presence of 10 μg/ml blocking antibodies to γδTCR, αβTCR, CD16, CD36 or isotype control IgG1κ, which were added to γδ2 T cells 30 min before RBC coculture or to the RBCs (anti-HLA-I or anti-BTN3A1 clone 103.2). For phagocytosis assays, RBCs were pre-treated with 20% human AB serum, 20% Pf patient serum or CD235a monoclonal antibody at 100× dilution. γδ2 T cell degranulation was inhibited by pre-treating cells for 30 min with 2 mM EGTA and actin polymerization was inhibited by pre-treating cells for 30 min with 10 μg/ml cytochalasin D.
Isoprenoid pathway inhibition.
Pf were treated with 10 μM fosmidomycin for 12 h, then supplemented or not with 200 μM IPP for 12 h before co-culture with γδ2 T cells. As positive control, 50 μM of HMBPP was added to γδ2 T cell cultures with or without RBCs.
Plasma GNLY.
GNLY in plasma from HD and Pf patients was quantified using the Human Granulysin DuoSet ELISA (R&D Systems).
RBC lysis assay.
iRBCs, labeled with 2.5 μM carboxyfluorescein diacetate succinimidyl ester (CFSE, Sigma-Aldrich), were cultured with γδ2 T cells at 10:1 or indicated E:T ratios. Co-cultured cells were stained for CD235a and CD3 after 4 h (cytokine-activated HD γδ2 T cells) or 12 h (ex vivo HD or Pf γδ2 T cells), and counting beads were added to individual tubes to normalize RBC counts. Live RBCs were gated as CD3−CD235a+CFSE+. The proportion of CD235a+CFSE+ RBCs in conditions without γδ2 T cells was used to determine background lysis and Triton X100-lysed RBCs were used to determine 100% lysis. % cell lysis was calculated as 100 - [(CFSE+ cells in cultures with γδ2 T cells/counting beads in cultures with γδ2 T cells) × 100/(CFSE+ cells in cultures without γδ2 T cells/counting beads in cultures without γδ2 T cells)]. Gated cells were compared with the number of CFSE+ cells surviving after culture in the absence of lymphocytes. RBC lysis by cytotoxic granule enzymes was measured by lactate dehydrogenase (LDH) release using the CytoTox 96 assay (Promega). GzmB, GNLY and PFN, purified from YT-Indy cells as described53, were added to 105 uRBCs or iRBCs in microtiter wells at indicated parasite stages and incubated for 1 h at 37°C using 100 nM GNLY, 500 nM GzmB, and/or a sublytic concentration of PFN. RBC supernatants were analyzed by LDH release assay and cell pellets were used for electron microscopy.
Parasite re-invasion assay.
Infected RBCs, enriched by magnetic column binding, were treated with 100 nM GNLY, 500 nM GzmB, and/or a sublytic concentration of PFN for 1 h at 37°C or co-cultured with γδ2 T cells at indicated E:T ratios for 12 h (for schizonts), 24 h (for trophozoites) and 42 h (for rings) in the presence or absence of blocking antibodies or chemical inhibitors. Uninfected RBCs were added at a ratio of 10 uRBCs to 1 iRBC. To evaluate the effect of ADP on parasite re-invasion, trophozoite stage iRBCs, opsonized with HD or Pf sera, were incubated with γδ2 T cells for 1 h in the presence or absence of indicated blocking antibodies and then added to uRBCs for 24 h. After each culture period, the cells were stained with SYBR Green for parasite DNA staining and anti-CD3 to exclude γδ2 T cells. The samples were acquired by FACSCanto II (BD Bioscience) flow cytometry and analyzed using FlowJo software V.10 (Tri-Star). The percentage of newly invaded RBCs (ring stage) was compared with the untreated condition (100% reinvasion).
Imaging flow cytometry.
RBCs were pre-stained with Hoechst, then co-cultured with purified γδ2 T cells at an E:T ratio of 1:5 for 30 min to assess immunological synapse formation. Cells were then fixed with 4% paraformaldehyde (PFA) and stained with antibodies to LFA-1, BTN3A1 (clone BT3.1), CD3 and CD235a before analysis on an ImageStream X MKII (Amnis) using Ideas software (Amnis). Cell conjugates were selected based on aspect ratio versus cell area and staining as CD3+Hoechst+ (γδ2/iRBC) or CD3+Hoechst− (γδ2/uRBCs). Mixed stage Pf cultures were treated with 500 nM GzmB-Alexa Fluor 488 in the presence or absence of 100 nM unlabeled GNLY for 1 h at 37°C. Cells were washed and fixed with 2% PFA in PBS prior to imaging flow cytometry. The frequency of cells staining for GzmB was quantified using Ideas software. To analyze localization, RBCs were incubated for 1 h with 100 nM unlabeled GNLY, 100 nM GNLY-Alexa Fluor 647, 500 nM GzmB-Alexa Fluor 488 and Hoechst 33342.
Confocal microscopy.
Thin smears of mixed stage Pf culture or cytospun slides of γδ2 T cells were fixed with 4% PFA and incubated with primary antibodies to BTN3A1 (clone BT3.1), CD235a (RBCs) or CD3 (γδ2 T cells), then stained with secondary antibodies labeled with Alexa Fluor 488. DNA was stained with DAPI. Images were captured using an LSM 880 with Airyscan confocal microscope (Zeiss) with 63× magnification.
Cholesterol depletion assay.
Mixed stage Pf cultures were stained with 5 μM 25-[N-[(7-nitro-2-1,3-benzoxadiazol-4-yl)methyl]amino]-27-norcholesterol or 200 μg/ml filipin for 30 min at 37°C. Cells were analyzed by imaging flow cytometry.
Electron microscopy.
Treated iRBC pellets were fixed in 1.25% formaldehyde, 2.5% glutaraldehyde, 0.1 M sodium cacodylate, pH 7.4, for 1 h at 20°C, followed by 1% osmium tetroxide and 1.5% (w/v) potassium ferrocyanide. Samples were then dehydrated in ethanol and embedded in Epon-Araldite 502 (Electron Microscopy Sciences). Extra thin sections, obtained using a Reichert Ultracut-S ultramicrotome (Leica), were applied to 200-mesh copper grids and stained with 2% uranyl acetate and Reynolds’ lead citrate. Images were obtained by transmission electron microscopy using a Tecnai G2-12-SpiritBiotwin −120 kV (FEI). Morphological changes were quantified in a blinded manner from a total of 15 image fields obtained from 3 different sections (5 fields/section).
Phagocytosis assay.
RBCs were stained with 2.5 μM CFSE, then incubated for 30 min with HD sera, Pf sera or purified anti-CD235a. Stained and opsonized RBCs were co-cultured with γδ2 T cells at an E:T ratio of 1:5 for 1 h at 37°C in 5% CO2, then labeled with anti-CD3 and anti-CD235a antibodies. Samples were acquired by imaging flow cytometry ImageStream X MKII (Amnis). RBC internalization (phagocytosis) was quantified using Ideas software (Amnis). iRBC internalization was measured by imaging flow cytometry after pre-treating γδ2 T cells for 30 min with blocking antibodies to γδTCR, αβTCR, CD16, CD36, or isotype control IgG1κ, with 2 mM EGTA or 50 μg/ml cytochalasin D. CFSE-stained and Pf serum-opsonized iRBCs were co-cultured with CellTracker Deep Red (Molecular Probes)-labeled γδ2 T cells at an E:T ratio of 1:5. Live cells were analyzed after 0, 30 and 60 min of co-culture by confocal microscopy in an imaging chamber maintained at 37°C with 5% CO2. Images were captured using an LSM 880 with Airyscan confocal microscope (Zeiss) with 40× and 63× magnification.
Statistical Analysis.
Statistical analysis was performed using GraphPad Prism V7.0. Prior to applying statistical methods, whether the data fit a normal distribution was evaluated by the D’Agostino and Pearson normality test. The distribution was considered normal when P ≤ 0.05. Parametric or non-parametric (Mann-Whitney test) two-tailed unpaired t-tests were used to compare two groups. Column comparisons were analyzed by one-way ANOVA using the Kruskal-Wallis test and Sidak’s or Tukey’s multiple comparisons test. Two-tailed Chi-square test was used for categorical column statistics. Multiple groups were compared by two-way ANOVA with additional Tukey’s multiple comparisons test. Differences were considered statistically significant when P ≤ 0.05.
Extended Data
Extended Data 1. Gating strategy for phenotypic analysis of peripheral blood lymphocytes from healthy donors (HD) and P. falciparum-infected patients (Pf).
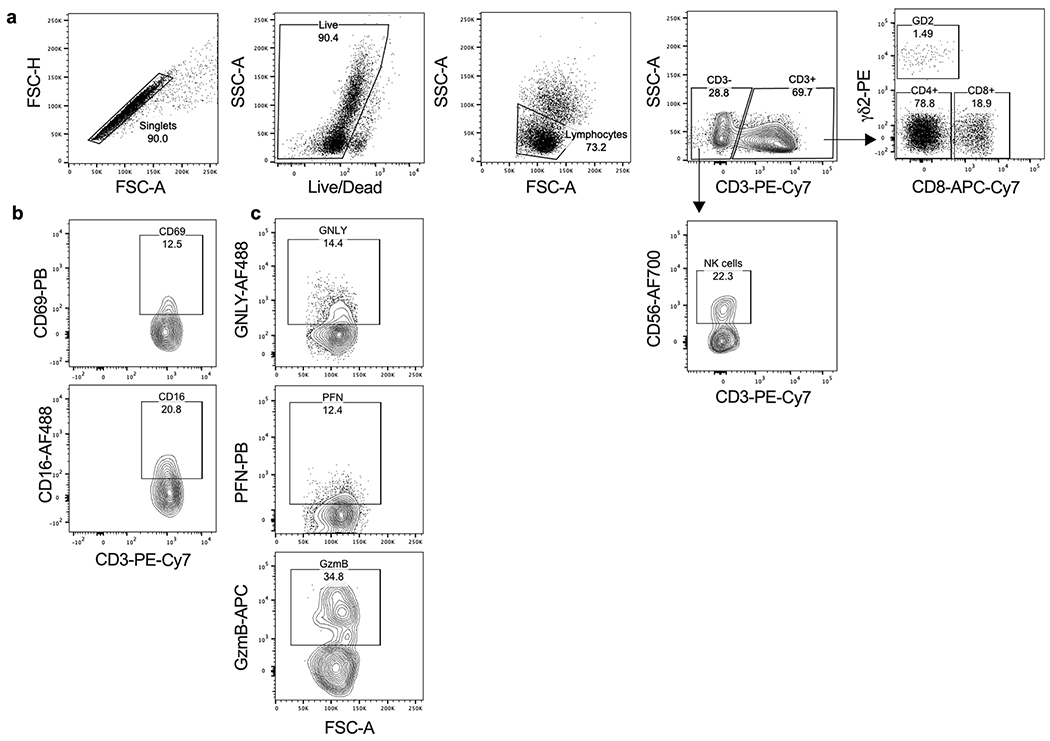
a, PBMCs were stained with the Live/Dead viability dye and antibodies to CD3, CD4, CD8, TCRδ2 and CD56. Single live cells were gated on SSC-A vs FSC-A and dead cells were excluded. Lymphocyte subpopulations were gated as: CD3+CD4+ (CD4+ T cells), CD3+CD8+ (CD8+ T cells), CD3+TCRδ2+ (γδ2 T cells) and CD3−CD56+ (NK). b, PBMCs co-stained for CD69, CD16 and cytotoxic effector protein expression (GNLY, PFN and GzmB) were gated on γδ2 T cells.
Extended Data 2. Gating strategy to measure RBC lysis.
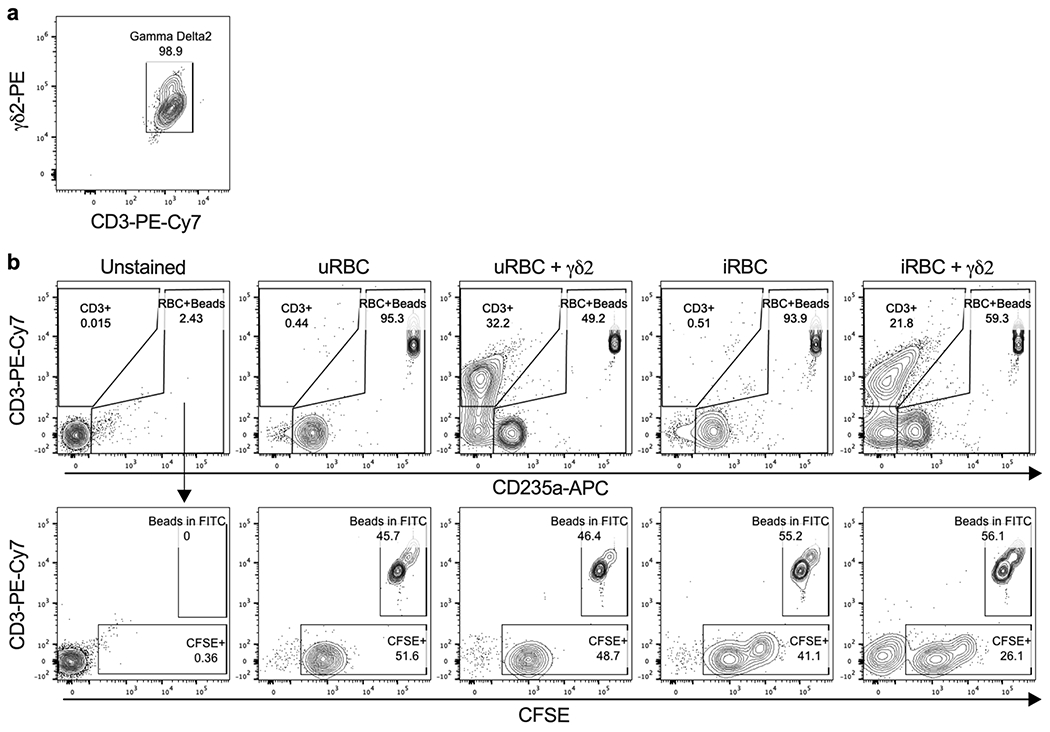
a, γδ2 T cells stained with anti-γδ2-PE were purified by positive selection with anti-PE microbeads and cell purity was evaluated by flow cytometry co-staining with anti-CD3. b, Infected or uninfected RBCs were stained with CFSE prior to co-culture with γδ2 T cells. After co-culture, cells were stained with anti-CD3 (γδ2 T cells) and anti-CD235a (RBCs). An equivalent number of counting beads as CSFE-stained RBCs (before γδ2 T cell coculture) was added to each condition prior to flow cytometry acquisition. A CD3+ gate was used to exclude γδ2 T cells (top panels). A second gate on CD235a+ RBCs and beads was used to analyze CD235a+CFSE+ RBCs (bottom panels). RBC lysis was calculated as the ratio between CFSE+ cells to counting beads and then normalized to the ratio in samples without γδ2 T cells.
Extended Data 3. BTN3A1 and BTN2A1 expression on iRBCs.
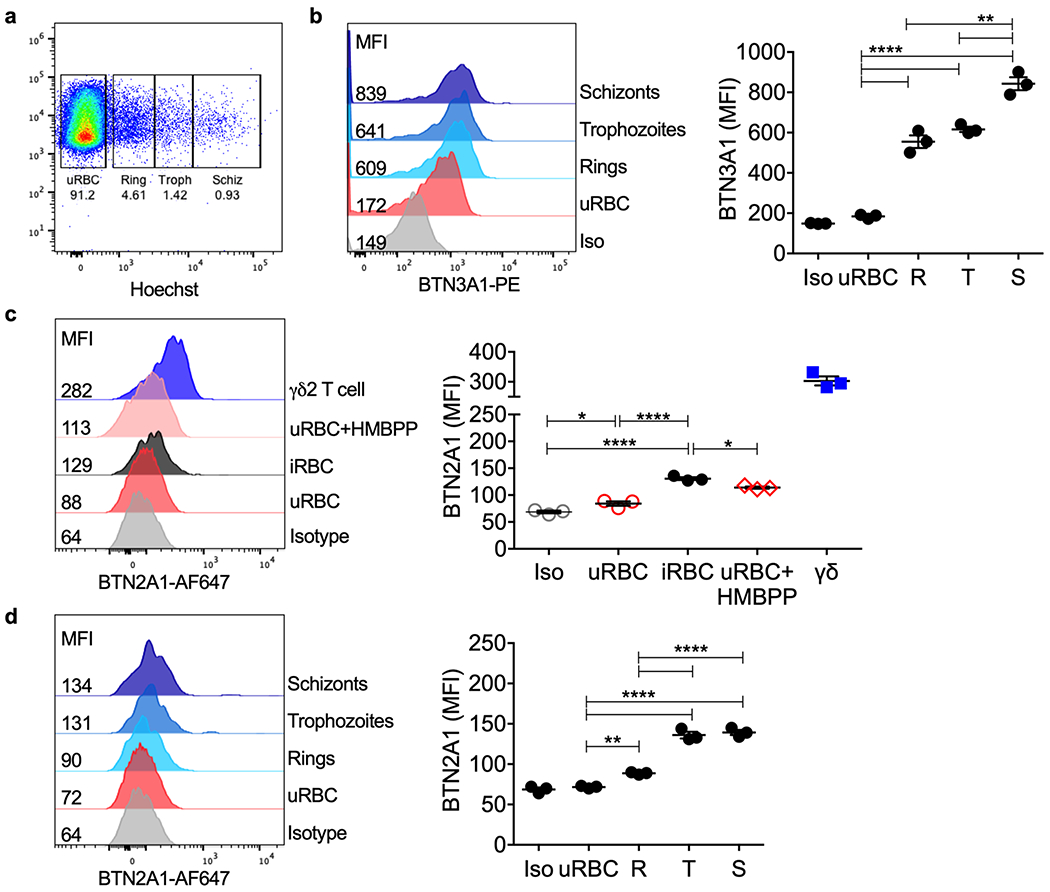
a, Pf mixed stage culture and γδ2 T cells were stained with anti-BTN3A1, anti-BTN2A1 and Hoechst dye (DNA). Parasite stage gates were set based on RBC DNA content (rings, R; trophozoites, T; schizonts, S). b, BTN3A1 expression was plotted as median of fluorescence intensity (MFI) (n=3). c, BTN2A1 MFI in uRBCs, iRBCs, uRBCs incubated with HMBPP and γδ2 T cells (n=3). d, BTN2A1 MFI on uRBCs compared to iRBCs at different parasite stages. Isotype-stained control samples were a mixture of uRBCs, iRBCs and γδ2 T cells (n=3). In b-d, shown at left are representative histograms from 1 sample and at right are the mean ± s.e.m. of 3 independent experiments. Iso, isotype control. n, biological independent samples. Statistical analysis was by one-way ANOVA with Tukey’s multiple comparisons test. P value: **<0.01, ***<0.001, ****<0.0001. Data shown are representative of at least three independent experiments
Extended Data 4. Gating strategy to measure γδ2 T cell degranulation and parasite reinvasion.
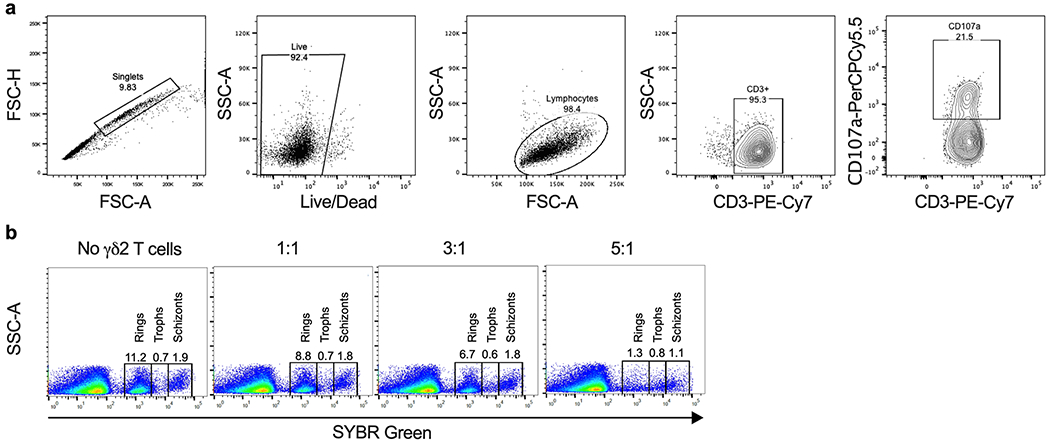
a, To measure degranulation, γδ2 T cells were co-cultured with RBCs in the presence of anti-CD107a for 4 hr. Cells were then stained with viability Live/Dead dye and anti-CD3. Single live cells were gated on SSC-A vs FSC-A, excluding dead cells. CD107a+ staining was analyzed on gated CD3+ γδ2 T cells. b, To determine the effect of γδ2 T cells on parasite reinvasion, synchronized iRBCs infected 12, 30 or 42 hr earlier were cultured for 42, 24 and 12 hr, respectively, with or without γδ2 T cells at different E:T ratios. Parasite reinvasion was measured by flow cytometry using SYBR green staining to detect parasite DNA and anti-CD235a for RBC gating and anti-CD3 to exclude γδ2 T cells. The DNA content of iRBCs at different stages enabled gating on each stage of parasite infection to quantify the proportion of iRBCs at each stage. Reinvasion of fresh RBC increased the proportion of rings. The reinvasion % was calculated as the percentage of newly invaded RBCs at ring stage in comparation with the Plasmodium culture without γδ2 T cells or any treatment (100% reinvasion).
Extended Data 5. γδ1 T cells and freshly isolated healthy donor peripheral blood γδ2 T cells do not respond to iRBCs.
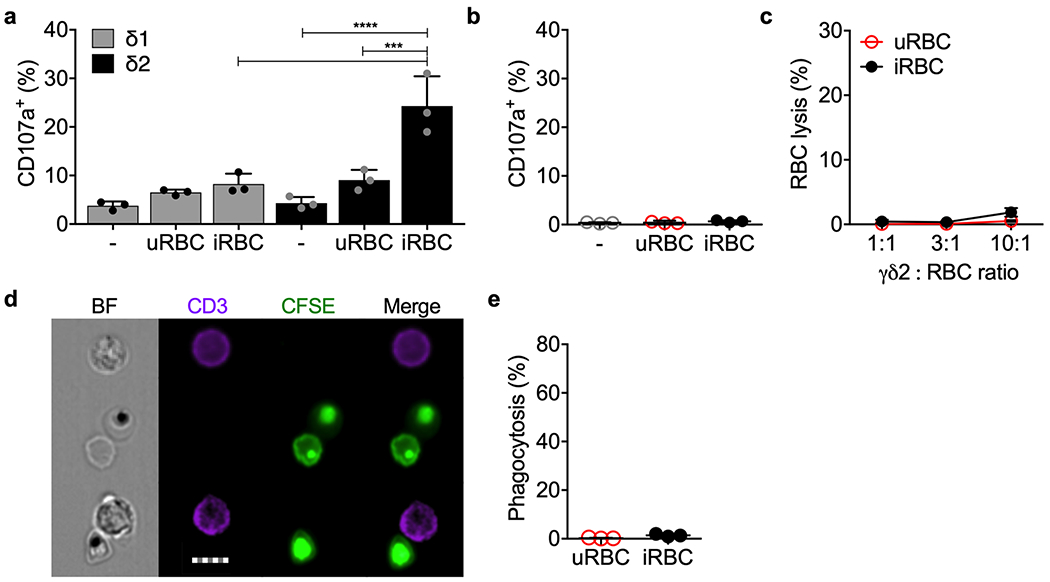
a, Vδ1 and Vδ2 T cells, enriched by positive selection from 3 HD and cultured for 5 days in medium containing IL-2 and IL-15, were co-cultured with uRBCs or iRBCs or no added cells in the presence of anti-CD107a. Cell degranulation was measured by CD107a staining. b-e, Highly purified freshly isolated HD γδ2 T cells from 3 donors were added to uRBCs or iRBCs to assess degranulation by CD107a staining (b), RBC lysis (c) and phagocytosis of CFSE-labeled and Pf serum-opsonized RBC (d,e). Representative images are shown in (d) and quantification of 2 independent experiments is shown in (e). Scale bar: 7 μm (d). Statistical analysis was by one-way ANOVA (a,b), two-way ANOVA with Tukey’s multiple comparisons test (c) and two-tailed nonparametric paired t-test (e). Mean ± s.e.m. is shown. P value: ***<0.001, ****<0.0001. Data shown are representative of at least three independent experiments.
Extended Data 6. iRBC lysis and parasite killing at different stages of infection by purified cytotoxic granule proteins.
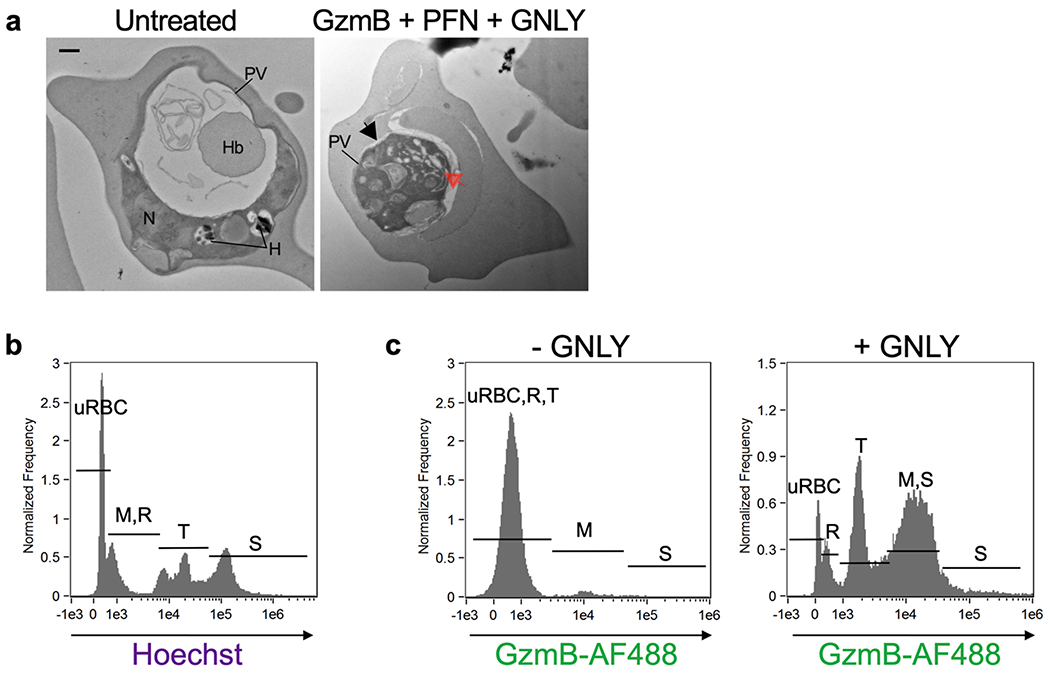
a, Electron microscopy of a ring stage iRBC treated or not with GzmB, PFN and GNLY showing disruption of morphology after treatment (right). In (a), parasitophorous vacuole (PV) detachment is indicated by a black arrow and increased parasite vacuolization by a red arrow. Parasite nucleus (N), hemoglobin vacuole (Hb), hemozoin (H). b, Imaging flow cytometry gating strategy for parasite developmental stages based on DNA content by Hoechst staining. M merozoites, R rings, T trophozoites, S schizonts. c, GzmB-AF488 uptake in the presence or absence of GNLY. Scale bar: 500 nm (a). n, biological independent samples. Data shown are representative of at least three independent experiments.
Supplementary Material
Acknowledgements
This research was supported by NIH AI116577 and AI131632 (J.L., R.T.G.), NIH U19 AI089681 Amazonian Center of Excellence in Malaria Research (C.J., R.T.G.), NIH AI145941 (J.D.D.), Harvard University Lemann Brazil Fund (J.L.) and Fundação de Amparo ã Pesquisa do Estado de Minas Gerais-FAPEMIG APQ-00653-16 (C.J.), Fundação de Amparo à Pesquisa do Estado de São Paulo-FAPESP, 2016/23618-8 (C.J., R.T.G.), Brazilian National Institute of Science and Technology for Vaccines (CNPq/FAPMIG) (C.J., R.T.G.). C.J., R.P., G.C. and R.T.G. are recipients of Conselho Nacional de Desenvolvimento Científico e Tecnológico (CNPq) fellowships. C.J. and G.C. are fellows of Coordenação de Aperfeiçoamento de Pessoal de Ensino Superior (CAPES).
Footnotes
Competing Interests. The authors declare no competing interests.
Data Availability. The data that support the findings of this study are available from the corresponding authors upon request.
Further information on research design is available in the Nature Research Reporting Summary linked to this article.
References
- 1.Junqueira C et al. Cytotoxic CD8(+) T cells recognize and kill Plasmodium vivax-infected reticulocytes. Nat Med 24, 1330–1336, doi: 10.1038/s41591-018-0117-4 (2018). [DOI] [PMC free article] [PubMed] [Google Scholar]
- 2.Silvestre D, Kourilsky FM, Nicolai MG & Levy JP Presence of HLA antigens on human reticulocytes as demonstrated by electron microscopy. Nature 228, 67–68 (1970). [DOI] [PubMed] [Google Scholar]
- 3.Worku S et al. Lymphocyte activation and subset redistribution in the peripheral blood in acute malaria illness: distinct gammadelta+ T cell patterns in Plasmodium falciparum and P. vivax infections. Clin Exp Immunol 108, 34–41 (1997). [DOI] [PMC free article] [PubMed] [Google Scholar]
- 4.Troye-Blomberg M et al. Human gamma delta T cells that inhibit the in vitro growth of the asexual blood stages of the Plasmodium falciparum parasite express cytolytic and proinflammatory molecules. Scand J Immunol 50, 642–650 (1999). [DOI] [PubMed] [Google Scholar]
- 5.Ramsey JM et al. Plasmodium falciparum and P. vivax gametocyte-specific exoantigens stimulate proliferation of TCR gammadelta+ lymphocytes. J Parasitol 88, 59–68, doi: 10.1645/0022-3395(2002)088[0059:PFAPVG]2.0.CO;2 (2002). [DOI] [PubMed] [Google Scholar]
- 6.Pichyangkul S, Saengkrai P, Yongvanitchit K, Stewart A & Heppner DG Activation of gammadelta T cells in malaria: interaction of cytokines and a schizont-associated Plasmodium falciparum antigen. J Infect Dis 176, 233–241 (1997). [DOI] [PubMed] [Google Scholar]
- 7.Jagannathan P et al. Vdelta2+ T cell response to malaria correlates with protection from infection but is attenuated with repeated exposure. Sci Rep 7, 11487, doi: 10.1038/s41598-017-10624-3 (2017). [DOI] [PMC free article] [PubMed] [Google Scholar]
- 8.Farrington LA et al. Frequent Malaria Drives Progressive Vdelta2 T-Cell Loss, Dysfunction, and CD16 Up-regulation During Early Childhood. J Infect Dis 213, 1483–1490, doi: 10.1093/infdis/jiv600 (2016). [DOI] [PMC free article] [PubMed] [Google Scholar]
- 9.Jagannathan P et al. Loss and dysfunction of Vdelta2(+) gammadelta T cells are associated with clinical tolerance to malaria. Sci Transl Med 6, 251ra117, doi: 10.1126/scitranslmed.3009793 (2014). [DOI] [PMC free article] [PubMed] [Google Scholar]
- 10.Farouk SE, Mincheva-Nilsson L, Krensky AM, Dieli F & Troye-Blomberg M Gamma delta T cells inhibit in vitro growth of the asexual blood stages of Plasmodium falciparum by a granule exocytosis-dependent cytotoxic pathway that requires granulysin. European journal of immunology 34, 2248–2256, doi: 10.1002/eji.200424861 (2004). [DOI] [PubMed] [Google Scholar]
- 11.Liu C et al. Vgamma9Vdelta2 T cells proliferate in response to phosphoantigens released from erythrocytes infected with asexual and gametocyte stage Plasmodium falciparum. Cell Immunol 334, 11–19, doi: 10.1016/j.cellimm.2018.08.012 (2018). [DOI] [PubMed] [Google Scholar]
- 12.Guenot M et al. Phosphoantigen Burst upon Plasmodium falciparum Schizont Rupture Can Distantly Activate Vgamma9Vdelta2 T Cells. Infect Immun 83, 3816–3824, doi: 10.1128/IAI.00446-15 (2015). [DOI] [PMC free article] [PubMed] [Google Scholar]
- 13.Vavassori S et al. Butyrophilin 3A1 binds phosphorylated antigens and stimulates human gammadelta T cells. Nature immunology 14, 908–916, doi: 10.1038/ni.2665 (2013). [DOI] [PubMed] [Google Scholar]
- 14.Wang H et al. Butyrophilin 3A1 plays an essential role in prenyl pyrophosphate stimulation of human Vgamma2Vdelta2 T cells. J Immunol 191, 1029–1042, doi: 10.4049/jimmunol.1300658 (2013). [DOI] [PMC free article] [PubMed] [Google Scholar]
- 15.Seder RA et al. Protection against malaria by intravenous immunization with a nonreplicating sporozoite vaccine. Science 341, 1359–1365, doi: 10.1126/science.1241800 (2013). [DOI] [PubMed] [Google Scholar]
- 16.Mordmuller B et al. Sterile protection against human malaria by chemoattenuated PfSPZ vaccine. Nature 542, 445–449, doi: 10.1038/nature21060 (2017). [DOI] [PMC free article] [PubMed] [Google Scholar]
- 17.Ishizuka AS et al. Protection against malaria at 1 year and immune correlates following PfSPZ vaccination. Nat Med 22, 614–623, doi: 10.1038/nm.4110 (2016). [DOI] [PMC free article] [PubMed] [Google Scholar]
- 18.Zaidi I et al. gammadelta T Cells Are Required for the Induction of Sterile Immunity during Irradiated Sporozoite Vaccinations. Journal of immunology 199, 3781–3788, doi: 10.4049/jimmunol.1700314 (2017). [DOI] [PMC free article] [PubMed] [Google Scholar]
- 19.Costa G et al. Control of Plasmodium falciparum erythrocytic cycle: gammadelta T cells target the red blood cell-invasive merozoites. Blood 118, 6952–6962, doi: 10.1182/blood-2011-08-376111 (2011). [DOI] [PubMed] [Google Scholar]
- 20.Dotiwala F & Lieberman J Granulysin: killer lymphocyte safeguard against microbes. Curr Opin Immunol 60, 19–29, doi: 10.1016/j.coi.2019.04.013 (2019). [DOI] [PMC free article] [PubMed] [Google Scholar]
- 21.Wu Y et al. Human gamma delta T cells: a lymphoid lineage cell capable of professional phagocytosis. Journal of immunology 183, 5622–5629, doi: 10.4049/jimmunol.0901772 (2009). [DOI] [PubMed] [Google Scholar]
- 22.Himoudi N et al. Human gammadelta T lymphocytes are licensed for professional antigen presentation by interaction with opsonized target cells. Journal of immunology 188, 1708–1716, doi: 10.4049/jimmunol.1102654 (2012). [DOI] [PubMed] [Google Scholar]
- 23.Brandes M, Willimann K & Moser B Professional antigen-presentation function by human gammadelta T Cells. Science 309, 264–268, doi: 10.1126/science.1110267 (2005). [DOI] [PubMed] [Google Scholar]
- 24.Meuter S, Eberl M & Moser B Prolonged antigen survival and cytosolic export in cross-presenting human gammadelta T cells. Proc Natl Acad Sci U S A 107, 8730–8735, doi: 10.1073/pnas.1002769107 (2010). [DOI] [PMC free article] [PubMed] [Google Scholar]
- 25.Howard J et al. The Antigen-Presenting Potential of Vgamma9Vdelta2 T Cells During Plasmodium falciparum Blood-Stage Infection. J Infect Dis 215, 1569–1579, doi: 10.1093/infdis/jix149 (2017). [DOI] [PubMed] [Google Scholar]
- 26.Barisa M et al. E. coli promotes human Vgamma9Vdelta2 T cell transition from cytokine-producing bactericidal effectors to professional phagocytic killers in a TCR-dependent manner. Sci Rep 7, 2805, doi: 10.1038/s41598-017-02886-8 (2017). [DOI] [PMC free article] [PubMed] [Google Scholar]
- 27.Hsiao CH et al. Synthesis of a phosphoantigen prodrug that potently activates Vgamma9Vdelta2 T-lymphocytes. Chem Biol 21, 945–954, doi: 10.1016/j.chembiol.2014.06.006 (2014). [DOI] [PubMed] [Google Scholar]
- 28.Yang Y et al. A Structural Change in Butyrophilin upon Phosphoantigen Binding Underlies Phosphoantigen-Mediated Vgamma9Vdelta2 T Cell Activation. Immunity 50, 1043–1053 e1045, doi: 10.1016/j.immuni.2019.02.016 (2019). [DOI] [PubMed] [Google Scholar]
- 29.Gu S et al. Phosphoantigen-induced conformational change of butyrophilin 3A1 (BTN3A1) and its implication on Vgamma9Vdelta2 T cell activation. Proc Natl Acad Sci U S A 114, E7311–E7320, doi: 10.1073/pnas.1707547114 (2017). [DOI] [PMC free article] [PubMed] [Google Scholar]
- 30.Karunakaran MM et al. Butyrophilin-2A1 Directly Binds Germline-Encoded Regions of the Vgamma9Vdelta2 TCR and Is Essential for Phosphoantigen Sensing. Immunity 52, 487–498 e486, doi: 10.1016/j.immuni.2020.02.014 (2020). [DOI] [PMC free article] [PubMed] [Google Scholar]
- 31.Rigau M et al. Butyrophilin 2A1 is essential for phosphoantigen reactivity by gammadelta T cells. Science 367, doi: 10.1126/science.aay5516 (2020). [DOI] [PubMed] [Google Scholar]
- 32.Dotiwala F et al. Killer lymphocytes use granulysin, perforin and granzymes to kill intracellular parasites. Nat Med 22, 210–216, doi: 10.1038/nm.4023 (2016). [DOI] [PMC free article] [PubMed] [Google Scholar]
- 33.Muto M, Baghdadi M, Maekawa R, Wada H & Seino K Myeloid molecular characteristics of human gammadelta T cells support their acquisition of tumor antigen-presenting capacity. Cancer Immunol Immunother 64, 941–949, doi: 10.1007/s00262-015-1700-x (2015). [DOI] [PMC free article] [PubMed] [Google Scholar]
- 34.Yeh E & DeRisi JL Chemical rescue of malaria parasites lacking an apicoplast defines organelle function in blood-stage Plasmodium falciparum. PLoS Biol 9, e1001138, doi: 10.1371/journal.pbio.1001138 (2011). [DOI] [PMC free article] [PubMed] [Google Scholar]
- 35.Kurup SP, Butler NS & Harty JT T cell-mediated immunity to malaria. Nat Rev Immunol 19, 457–471, doi: 10.1038/s41577-019-0158-z (2019). [DOI] [PMC free article] [PubMed] [Google Scholar]
- 36.Arora G et al. NK cells inhibit Plasmodium falciparum growth in red blood cells via antibody-dependent cellular cytotoxicity. Elife 7, doi: 10.7554/eLife.36806 (2018). [DOI] [PMC free article] [PubMed] [Google Scholar]
- 37.Goodier MR, Wolf AS & Riley EM Differentiation and adaptation of natural killer cells for anti-malarial immunity. Immunol Rev 293, 25–37, doi: 10.1111/imr.12798 (2020). [DOI] [PubMed] [Google Scholar]
- 38.Ravenhill BJ et al. Quantitative comparative analysis of human erythrocyte surface proteins between individuals from two genetically distinct populations. Commun Biol 2, 350, doi: 10.1038/s42003-019-0596-y (2019). [DOI] [PMC free article] [PubMed] [Google Scholar]
- 39.Bryk AH & Wisniewski JR Quantitative Analysis of Human Red Blood Cell Proteome. J Proteome Res 16, 2752–2761, doi: 10.1021/acs.jproteome.7b00025 (2017). [DOI] [PubMed] [Google Scholar]
- 40.Barbee SD et al. Skint-1 is a highly specific, unique selecting component for epidermal T cells. Proc Natl Acad Sci U S A 108, 3330–3335, doi: 10.1073/pnas.1010890108 (2011). [DOI] [PMC free article] [PubMed] [Google Scholar]
- 41.Turchinovich G & Hayday AC Skint-1 identifies a common molecular mechanism for the development of interferon-gamma-secreting versus interleukin-17-secreting gammadelta T cells. Immunity 35, 59–68, doi: 10.1016/j.immuni.2011.04.018 (2011). [DOI] [PubMed] [Google Scholar]
- 42.Gordon S Phagocytosis: An Immunobiologic Process. Immunity 44, 463–475, doi: 10.1016/j.immuni.2016.02.026 (2016). [DOI] [PubMed] [Google Scholar]
- 43.Chien YH, Meyer C & Bonneville M gammadelta T cells: first line of defense and beyond. Annual review of immunology 32, 121–155, doi: 10.1146/annurev-immunol-032713-120216 (2014). [DOI] [PubMed] [Google Scholar]
- 44.Das S et al. Evolution of two prototypic T cell lineages. Cell Immunol 296, 87–94, doi: 10.1016/j.cellimm.2015.04.007 (2015). [DOI] [PMC free article] [PubMed] [Google Scholar]
- 45.Barry A & Hansen D Naturally acquired immunity to malaria. Parasitology 143, 125–128, doi: 10.1017/S0031182015001778 (2016). [DOI] [PubMed] [Google Scholar]
- 46.Crompton PD et al. Malaria immunity in man and mosquito: insights into unsolved mysteries of a deadly infectious disease. Annu Rev Immunol 32, 157–187, doi: 10.1146/annurev-immunol-032713-120220 (2014). [DOI] [PMC free article] [PubMed] [Google Scholar]
- 47.Moebius J et al. PD-1 expression on NK cells in malaria-exposed individuals is associated with diminished natural cytotoxicity and enhanced antibody dependent cellular cytotoxicity. Infect Immun, doi: 10.1128/IAI.00711-19 (2020). [DOI] [PMC free article] [PubMed] [Google Scholar]
- 48.Hart GT et al. Adaptive NK cells in people exposed to Plasmodium falciparum correlate with protection from malaria. J Exp Med 216, 1280–1290, doi: 10.1084/jem.20181681 (2019). [DOI] [PMC free article] [PubMed] [Google Scholar]
- 49.Hernandez-Castaneda MA et al. gammadelta T Cells Kill Plasmodium falciparum in a Granzyme- and Granulysin-Dependent Mechanism during the Late Blood Stage. J Immunol 204, 1798–1809, doi: 10.4049/jimmunol.1900725 (2020). [DOI] [PMC free article] [PubMed] [Google Scholar]
- 50.Stenger S et al. An antimicrobial activity of cytolytic T cells mediated by granulysin. Science 282, 121–125 (1998). [DOI] [PubMed] [Google Scholar]
Methods-only References
- 51.Ribaut C et al. Concentration and purification by magnetic separation of the erythrocytic stages of all human Plasmodium species. Malar J 7, 45, doi: 10.1186/1475-2875-7-45 (2008). [DOI] [PMC free article] [PubMed] [Google Scholar]
- 52.Betts MR et al. Sensitive and viable identification of antigen-specific CD8+ T cells by a flow cytometric assay for degranulation. J Immunol Methods 281, 65–78 (2003). [DOI] [PubMed] [Google Scholar]
- 53.Thiery J, Walch M, Jensen DK, Martinvalet D & Lieberman J Isolation of cytotoxic T cell and NK granules and purification of their effector proteins. Curr Protoc Cell Biol Chapter 3, Unit3 37 (2010). [DOI] [PubMed] [Google Scholar]
Associated Data
This section collects any data citations, data availability statements, or supplementary materials included in this article.


