Abstract
During chronic infection and cancer, a self-renewing CD8+ T cell subset maintains long-term immunity and is critical to the effectiveness of immunotherapy. These stem-like CD8+ T cells diverge from other CD8+ subsets early after chronic viral infection. However, pathways guarding stem-like CD8+ T cells against terminal exhaustion remain unclear. Here, we show that the gene encoding transcriptional repressor BACH2 is transcriptionally and epigenetically active in stem-like CD8+ T cells but not terminally exhausted cells early after infection. BACH2 overexpression enforced stem-like cell fate, whereas BACH2 deficiency impaired stem-like CD8+ T cell differentiation. Single-cell transcriptomics and epigenomics approaches revealed that BACH2 establishes the transcriptional and epigenetic programs of stem-like CD8+ T cells. In addition, BACH2 suppressed the molecular program driving terminal exhaustion through transcriptional repression and epigenetic silencing. Thus, our study reveals a novel pathway that enforces commitment to stem-like CD8+ lineage and prevents alternative terminally exhausted cell fate.
Introduction
During chronic viral infection and cancer, antigen-specific CD8+ T cells become dysfunctional, a state termed exhaustion. As antigen stimulation continues, exhausted CD8+ T cells gradually lose their effector function and proliferative potential and upregulate inhibitory receptors, targets of checkpoint inhibitors that reinvigorate T cell function1,2. Thus, understanding the cellular and molecular mechanisms involved in the T cell response against chronic antigen stimulation will help identify targets to treat chronic viral infection and cancer.
The notion that exhausted CD8+ T cells are a homogenous population has been challenged by recent studies, which demonstrated that a self-renewing antigen-specific TCF-1hi stem-like CD8+ subset maintains long-term immunity by replenishing the more terminally exhausted TCF-1lo population during chronic viral infection and cancer3-12. Unlike terminally exhausted CD8+ T cells, stem-like CD8+ T cells are less differentiated and reside in lymphoid tissues4-6,13. Growing evidence from animal and human studies has confirmed the critical role of stem-like CD8+ T cells in the effectiveness of various immunotherapies against chronic infection and cancer3-7,14-17. The differentiation of stem-like CD8+ T cells is tightly regulated by transcription factors (TFs) including TCF-1, BCL-6, E2A, Blimp-1, TOX, IRF-4, and Myb, and cytokines such as type I interferon (IFN-I) and interleukin 27 (IL-27)3-7,18-25. Single-cell RNA-Seq (scRNA-Seq) and histone 3 lysine 27 acetylation (H3K27ac) ChIP-Seq analyses of antiviral CD8+ subsets during acute and chronic viral infections have revealed that stem-like CD8+ T cells become a lineage distinct from other antiviral CD8+ subsets at the transcriptional and epigenetic levels early after chronic viral infection19. This finding raises the possibility that stem-like CD8+ T cells are spared from the epigenetic imprint of terminal and irreversible exhaustion previously shown in studies analyzing bulk exhausted CD8+ T cells26,27. However, the molecular pathway that establishes the unique transcriptional and epigenetic programs of stem-like CD8+ T cells and protect them from terminal exhaustion remains unclear.
BACH2 is a transcriptional repressor that belongs to the BACH family of basic leucine zipper transcription factors28. BACH2 deficiency leads to defects in regulatory T cells and impaired memory CD8+ T cell differentiation after acute infection29-32. However, the role of BACH2 in the antiviral CD8+ response during chronic viral infection is unclear. In this study, we demonstrate that BACH2 was essential for the differentiation of stem-like CD8+ T cells during chronic viral infection. H3K27ac ChIP-Seq and ATAC-Seq data revealed that genomic regions with differential epigenetic signatures between stem-like and terminally exhausted CD8+ T cells are highly enriched with BACH2 binding motifs. Notably, overexpression of BACH2 enforced the commitment of antiviral CD8+ T cells to stem-like cell fate, whereas BACH2 deficiency impaired stem-like CD8+ T cell differentiation. Using RNA-Seq, scRNA-Seq, and ATAC-Seq, we show that BACH2 imposed the transcriptional and epigenetic programs of stem-like CD8+ T cells early during chronic viral infection and epigenetically silenced the molecular program driving terminal exhaustion. Thus, our results reveal a novel pathway that establishes the lineage identity of stem-like CD8+ T cells.
Results
BACH2 is upregulated in stem-like CD8+ T cells.
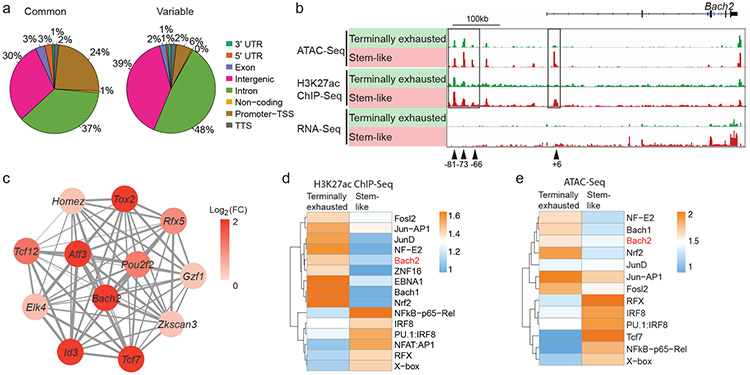
We sought to determine the chromatin accessibility profiles of virus-specific stem-like and terminally exhausted CD8+ T cells early after lymphocytic choriomeningitis virus (LCMV) clone 13 infection using the assay for transposase-accessible chromatin with sequencing (ATAC-Seq). On day 7 post-infection (p.i.), stem-like (Ly108hiTIM-3lo) and terminally exhausted (Ly108loTIM-3hi) P14 CD8+ T cells were isolated for ATAC-Seq analysis (Extended Data Fig. 1a,b). Compared to common open chromatin sites, open chromatin sites unique to one CD8+ subset were more likely to be found in intergenic and intronic regions and less likely to be found in promoters (Fig. 1a and Extended Data Fig. 1c). The majority of the genes upregulated in one CD8+ subset contained regions with greater chromatin accessibility in the same CD8+ subset (Extended Data Fig. 1d). Among these, we noted that the promoter and multiple upstream cis-regulatory elements at the Bach2 locus displayed greater chromatin accessibility and higher amounts of H3K27ac, an active histone mark, in stem-like CD8+ T cells than in terminally exhausted CD8+ T cells (Fig. 1b and Extended Data Fig. 1d). These results suggest that Bach2 is epigenetically active in stem-like CD8+ T cells. Consistent with the epigenetic activity, the abundance of Bach2 mRNA was higher in stem-like CD8+ T cells (Fig. 1b and Extended Data Fig. 1e). Notably, deleting Prdm1, which encodes Blimp-1 and was highly expressed in terminally exhausted CD8+ T cells, upregulated BACH2 in P14 CD8+ T cells after LCMV clone 13 infection (Extended Data Fig. 1e,f). These results suggest that Blimp-1 likely represses Bach2 expression in virus-specific CD8+ T cells. In addition, based on published scRNA-Seq data19, Bach2 and multiple genes encoding signature TFs of stem-like CD8+ T cells (Tcf7 and Id3) belong to the same co-expression gene module (Fig. 1c).
Fig.1 ∣. Bach2 locus is epigenetically and transcriptionally active in stem-like CD8+ T cells.
a, C57BL/6 mice received naïve P14 CD8+ T cells and were then infected with LCMV clone 13. ATAC-Seq were performed with stem-like (Ly108hiTIM-3lo) and terminally exhausted (Ly108loTIM-3hi) P14 cells isolated from mice on day 7 p.i.. Pie charts demonstrating the distribution of ATAC-Seq peaks that are shared between stem-like and terminally exhausted CD8+ T cells (common) or specific to one of the CD8+ subsets (variable) across the genome (three prime untranslated region [3’ UTR], five prime untranslated region [5’ UTR], exon, intergenic, intron, non-coding, promoter-transcription start sites [TSS], and transcription termination site [TTS]). ATAC-Seq data include n=2 independent samples per group. b, Genomic tracks of mapped ATAC-Seq, H3K27ac ChIP-Seq, and RNA-Seq reads at Bach2 locus in stem-like (red) and terminally exhausted (green) CD8+ T cells. c, Correlation network analysis of transcription factors (TFs) in the co-expression gene module containing Tcf7 identified by WGCNA of scRNA-Seq data from P14 CD8+ T cells after LCMV infection. The thickness of lines represents correlation. Log2 fold change of mRNA between stem-like and terminally exhausted CD8+ T cells are color-coded. d,e, Heatmaps illustrate enrichment of TF motifs in differential H3K27ac peaks (d) and ATAC-Seq peaks (e) between stem-like and terminally exhausted CD8+ T cells. Differential peaks were determined by edgeR (fold change >1.2, FDR <0.1).
Next, we performed a TF motif enrichment analysis of genomic regions with differential H3K27ac content or differential chromatin accessibility between stem-like and terminally exhausted CD8+ T cells (Fig. 1d,e). Consistent with the function of BACH2 as a transcriptional repressor33, open chromatin regions and H3K27ac peaks in stem-like CD8+ T cells showed significantly less enrichment of BACH2 binding motif compared to those in terminally exhausted CD8+ T cells (Fig. 1d,e). Among the transcription factors significantly upregulated in stem-like CD8+ T cells compared to terminally exhausted CD8+ T cells, BACH2, TCF-1, and Jun displayed enrichment of binding motifs in the genomic regions with differential chromatin accessibility between stem-like and terminally exhausted CD8+ T cells (Extended Data Fig. 1g). In summary, our epigenomics data in stem-like and terminally exhausted CD8+ T cells have revealed TFs including BACH2 as potential regulators of stem-like CD8+ T cells.
BACH2 overexpression enhances stem-like CD8+ T cell differentiation.
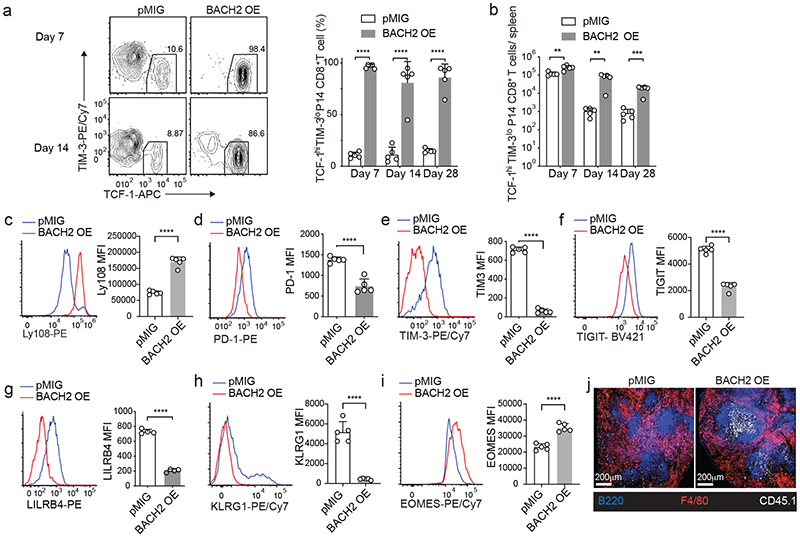
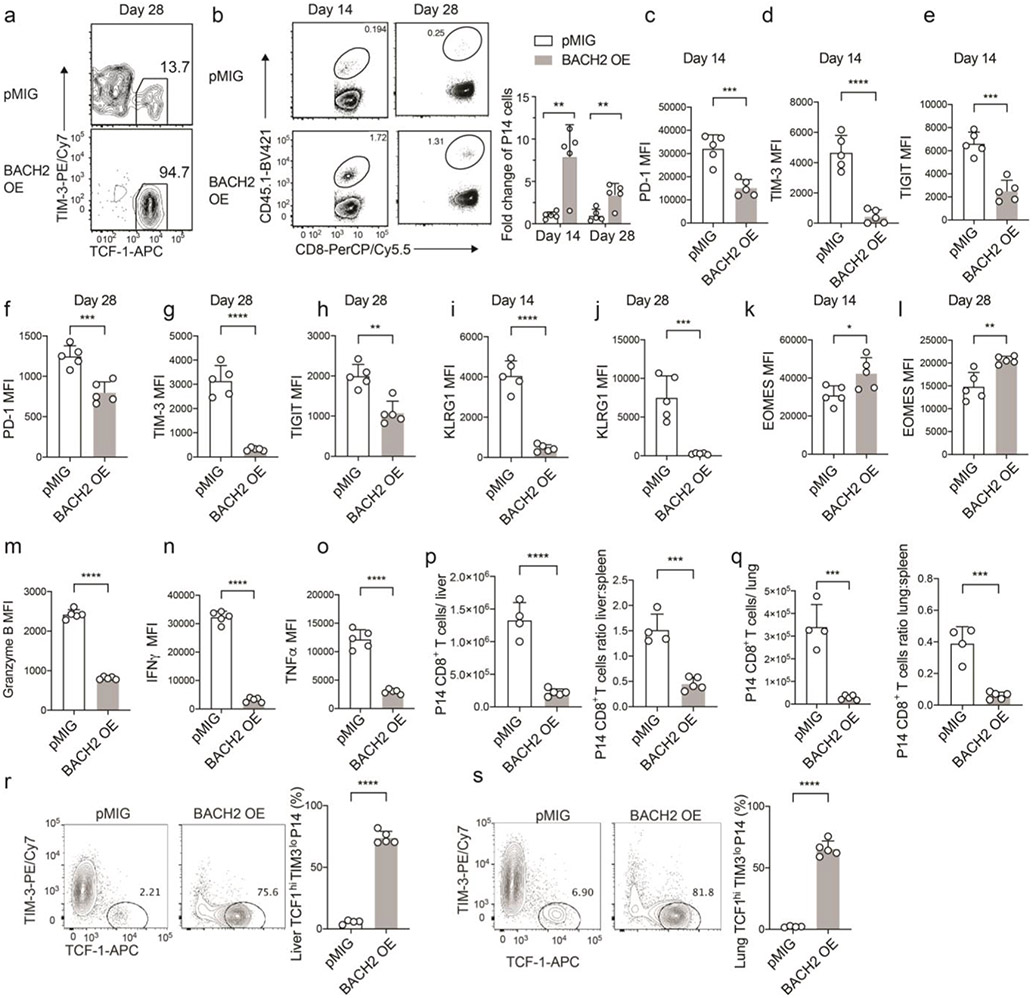
We next sought to determine the role of BACH2 in antiviral CD8+ T cell response against chronic LCMV infection. Control (pMIG) or BACH2 overexpression (BACH2 OE) transduced P14 cells were transferred separately to mice which were then infected with LCMV clone 13. On days 7, 14, and 28 p.i., whereas ~10% of control P14 CD8+ T cells were stem-like (TCF-1hiTIM-3lo) CD8+ T cells, ~90% of BACH2 OE P14 cells displayed a stem-like phenotype (Fig. 2a and Extended Data Fig. 2a). An increase in the number of stem-like CD8+ T cells was observed upon BACH2 overexpression in all time points examined and was more evident in the chronic phase of infection (days 14 and 28 p.i.) (Fig. 2b). In addition, BACH2 overexpression led to a 3~8-fold increase in the number of P14 cells on days 14 and 28 p.i. (Extended Data Fig. 2b). In line with the enhanced stem-like CD8+ differentiation, BACH2 overexpression upregulated Ly108 on P14 CD8+ T cells (Fig. 2c). Notably, BACH2 overexpression reduced the expression of multiple inhibitory receptors including PD-1, TIM-3, TIGIT, and LILRB4 on P14 CD8+ T cells (Fig. 2d-g and Extended Data Fig. 2c-h). In addition, BACH2 overexpression reduced the expression of KLRG1 (Fig. 2h and Extended Data Fig. 2i,j), a marker of a short-lived effector-like CD8+ subset in chronic viral infection8-10, and upregulated EOMES (Fig. 2i and Extended Data Fig. 2k,l), which promotes persistence of virus-specific CD8+ T cells during chronic infection9. Consistent with the increased frequency of stem-like CD8+ T cells which express low abundance of granzyme B3,4,7,19, BACH2 OE P14 CD8+ T cells downregulated granzyme B (Extended Data Fig. 2m). In addition, reduced production of IFN-γ and tumor necrosis factor (TNF) were observed in BACH2 OE P14 cells (Extended Data Fig. 2n,o).
Fig.2 ∣. BACH2 overexpression promotes stem-like CD8+ differentiation and inhibits exhaustion.
P14 CD8+ T cells transduced with control MSCV-IRES-GFP (pMIG) or BACH2 overexpression (BACH2 OE) construct were adoptively transferred into C57BL/6 mice that were subsequently infected with LCMV clone 13. a, Left panel: representative FACS plots of stem-like (TCF-1hiTIM-3lo) CD8+ T cells within pMIG and BACH2 OE P14 cells on day 7 and day 14 p.i.. Right panel: frequencies of stem-like CD8+ T cells in pMIG and BACH2 OE P14 cells on day 7 (n=5), day 14 (n=5) and day 28 (n=5) p.i.. b, Numbers of stem-like (TCF-1hiTIM-3lo) pMIG and BACH2 OE P14 CD8+ T cells on day 7 (n=5), day 14 (n=5) and day 28 (n=5) p.i.. c-i FACS analyses of Ly108 (c, n=5), PD-1 (d, n=5), TIM-3 (e, n=5), TIGIT (f, n=5), LILRB4 (g, n=4), KLRG1(h, n=5), and EOMES (i, n=5) expression in pMIG and BACH2 OE P14 CD8+ T cells on day 7 p.i.. j, Localization of pMIG and BACH2 OE P14 cells (CD45.1+) in the spleen of LCMV clone 13-infected mice on day 7 p.i.. Data are representative of at least two independent experiments. n equals the number of mice per group. Each circle represents one mouse. Bar graphs represent mean±s.d.. Statistical significance was calculated with a two-sided Student’s t-test. **P < 0.01, ***P < 0.001, ****P < 0.0001.
Unlike terminally exhausted CD8+ T cells, stem-like CD8+ T cells primarily reside in lymphoid tissues4,6. We found that majority of BACH2 OE P14 cells were located in the white pulp of spleen from day 7 LCMV clone 13-infected mice whereas control P14 cells were predominantly present in the red pulp (Fig. 2j). In addition, BACH2 overexpression reduced the migration of P14 CD8+ T cells to nonlymphoid tissues such as liver and lung and increased the frequency of stem-like CD8+ T cells in these two organs during LCMV clone 13 infection (Extended Data Fig. 2p-s). Thus, BACH2 promotes lymphoid tissue homing of antiviral CD8+ T cells during chronic viral infection. Taken together, these results suggest that BACH2 overexpression in virus-specific CD8+ T cells promotes the differentiation of stem-like CD8+ T cells and long-term persistence of virus-specific CD8+ T cells while suppressing the expression of inhibitory receptors during chronic viral infection.
BACH2 overexpression enforces the transcriptome of stem-like CD8+ T cells.
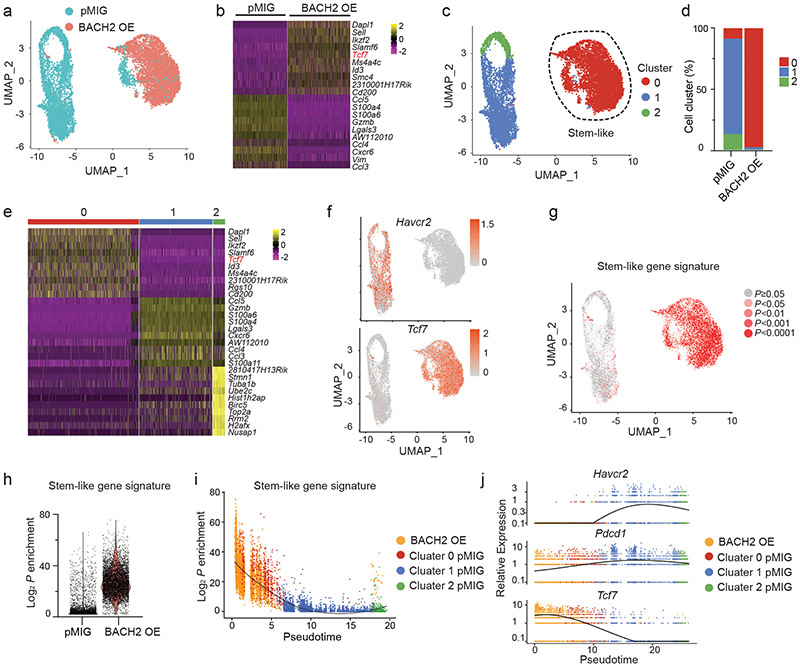
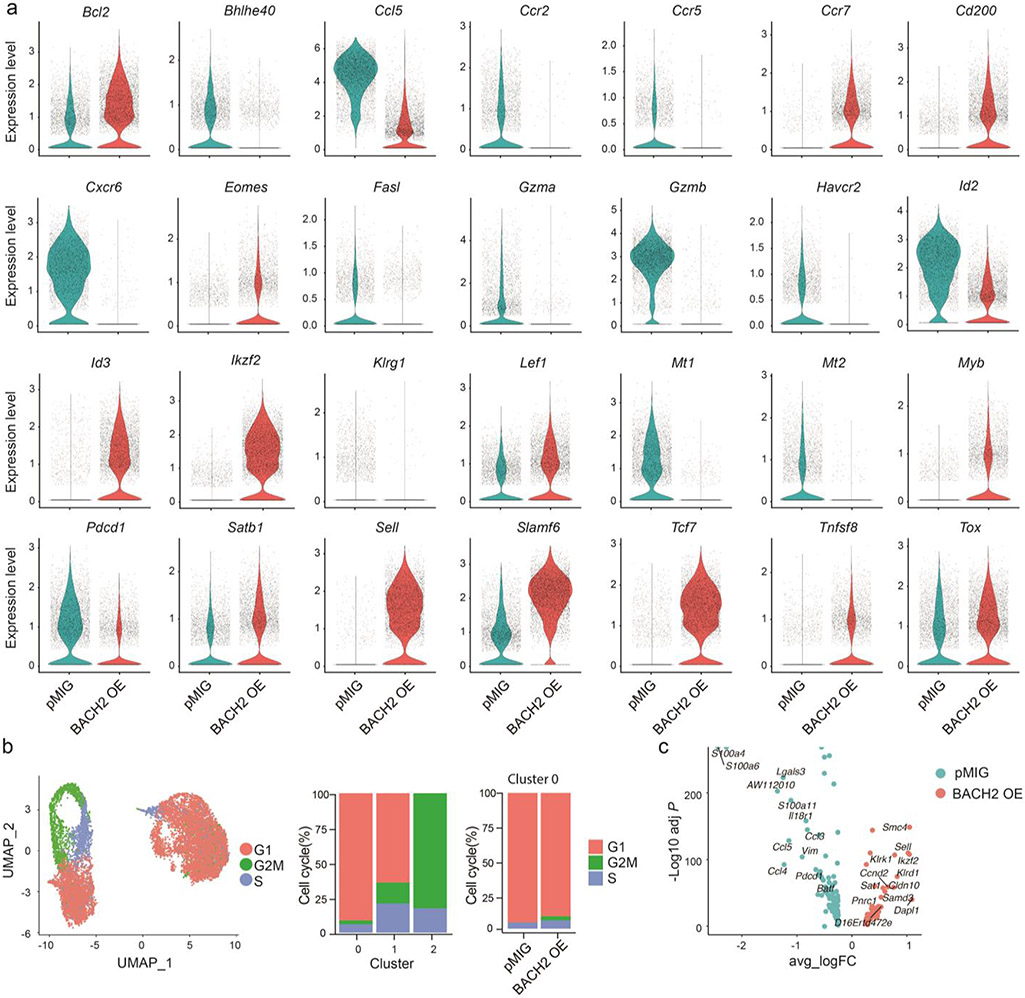
To understand the effect of BACH2 overexpression on the transcriptional program of virus-specific CD8+ T cells, we performed a scRNA-Seq analysis of control and BACH2 OE P14 CD8+ T cells on day 7 after LCMV clone 13 infection (Fig. 3a). In addition to upregulation of stem-like signature genes including Tcf7, Id3, Slamf6 (encoding Ly108), BACH2 OE P14 cells also upregulated Eomes, Myb, and Satb1, genes that promote lymphoid tissue homing including Sell and Ccr7, and anti-apoptotic gene Bcl2 (Fig. 3b and Extended Data Fig. 3a). Among genes downregulated in BACH2 OE P14 cells were those encoding inhibitory receptors (e.g. Havcr2 and Pdcd1), chemokine receptors (Ccr2, Ccr5, and Cxcr6), and proteins that drive T cell dysfunction (Mt1 and Mt2)34 (Extended Data Fig. 3a).
Fig.3 ∣. BACH2 establishes a stem-like transcriptional program at the single-cell level.
Experimental setup is the same as in Fig. 2. ScRNA-Seq was performed with splenic P14 CD8+ T cells collected on day 7 p.i.. a, UMAP projection of pMIG (iris blue, n=5,312) and BACH2 OE (Salmon, n=6,172) P14 cells. Each dot represents one cell. b, A heatmap of the top 10 genes expressed in pMIG and BACH2 OE P14 cells. Each column represents a cell; each row represents a gene. Color represents Z-score distribution from −2 (purple) to 2 (yellow). c, Unsupervised clustering identified three subsets (clusters 0-2) of P14 cells from Fig. 3a shown in a UMAP projection. d, Percentages of cells in each cluster defined in Fig. 3c in pMIG and BACH2 OE P14 CD8+ T cells. e, A heatmap of the top 10 genes expressed in each cluster defined in Fig. 3c. f, Single-cell expression of Tcf7 and Havcr2 illustrated in UMAP plots. Color represents transcript abundance (gray: no expression; red: expressed). g,h, Feature plot (g) and violin plot (h) illustrating enrichment (log2 P values) of stem-like gene signature in each cell. P values were calculated by a one-sided Fisher’s exact test. i, Enrichment (log2 P values) of stem-like gene signature in pMIG P14 CD8+ T cells in clusters 0 (red), 1 (blue), and 2 (green) as well as all BACH2 OE P14 CD8+ T cells (orange) plotted against pseudo-time determined by Monocle 2. Each dot represents one cell. The black line represents the spline. j, Single-cell expression of Havcr2, Pdcd1, and Tcf7 projected against pseudo-time. Cells were color-coded as in Fig.3i.
Unsupervised clustering assigned P14 cells from control and overexpression groups into three clusters (Fig. 3c,d). Notably, a small portion of control P14 cells and nearly all BACH2 OE P14 cells were in cluster 0, whereas the majority of control P14 cells were partitioned into cluster 1 or cluster 2, both of which were devoid of BACH2 OE P14 cells (Fig. 3c,d). Among the top genes upregulated in cluster 0 were Tcf7, Id3, Slamf6, Ikzf2, and Sell (Fig. 3e,f). We confirmed that cluster 0 was highly enriched for a stem-like gene signature19 (Fig. 3g). Consistent with these results, BACH2 OE P14 CD8+ T cells exhibited a significant higher proportion of cells enriched with stem-like gene signature compared to control P14 cells (Fig. 3h). Both cluster 1 and cluster 2 upregulated genes associated with terminally exhausted CD8+ T cells including Havcr2 (encoding TIM-3) and Gzmb (Fig. 3e,f). In addition, genes related to cell cycle including Birc5 and Top2a were upregulated in cluster 2 (Fig. 3e and Extended Data Fig. 3b). To understand the potential differentiation trajectory of control and BACH2 OE P14 CD8+ T cells, we performed a pseudo-time analysis35. Enrichment of stem-like gene signature gradually reduced along pseudo-time (Fig. 3i), which likely reflects the differentiation from stem-like CD8+ T cells to terminally exhausted CD8+ T cells. Consistently, Tcf7 expression decreased along pseudo-time, whereas expression of Pdcd1 and Havcr2 increased along pseudo-time (Fig. 3j). Of note, most BACH2 OE P14 cells were positioned in the beginning of the pseudo-time axis, which raises the possibility that BACH2 overexpression prevents terminal exhaustion of P14 CD8+ T cells.
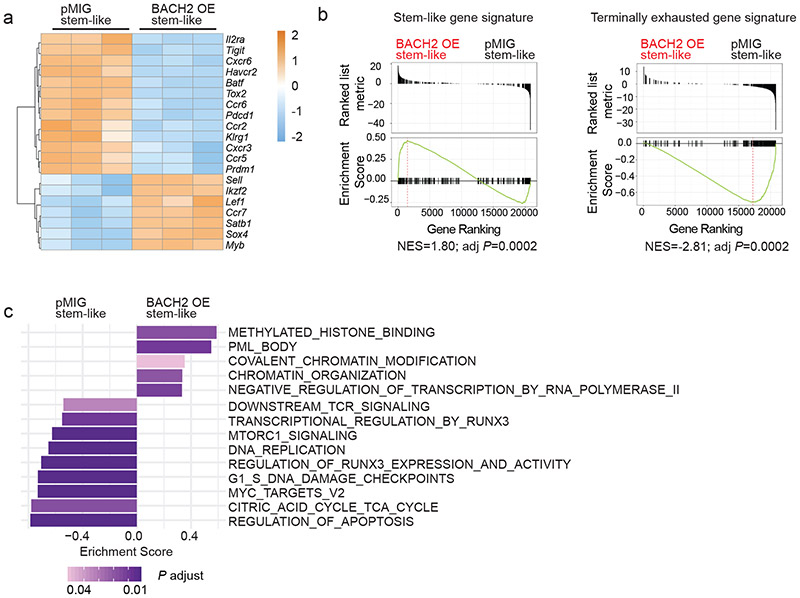
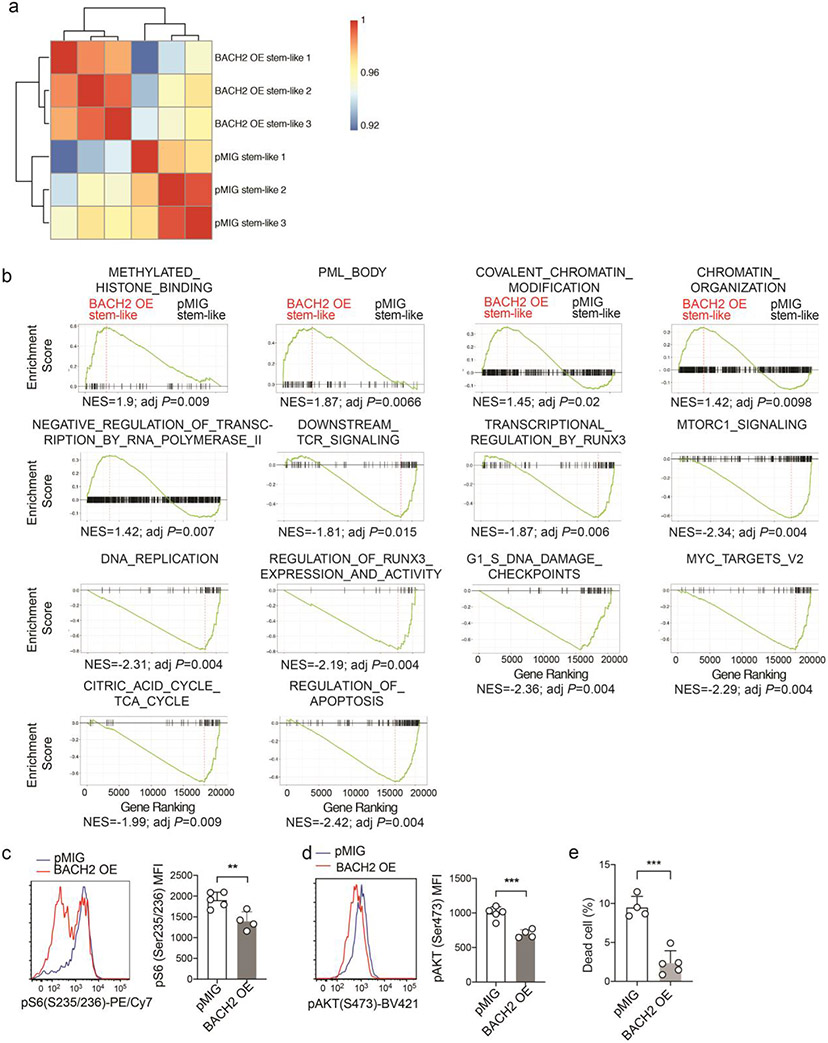
Next, we sought to define the genes and pathways in stem-like CD8+ T cells that are transcriptionally regulated by BACH2 overexpression. Although belonging to the same cluster, cluster 0 BACH2 OE P14 cells and cluster 0 control P14 cells displayed a significant number of differentially expressed genes (Extended Data Fig. 3c). Dropout events are common in most scRNA-Seq platforms and limit their ability to detect differentially expressed genes and pathways. To achieve a higher sensitivity, we used RNA-Seq to profile the transcriptomes of control and BACH2 OE stem-like P14 CD8+ T cells on day 7 p.i. (Extended Data Fig. 4a). Among genes upregulated in BACH2 OE stem-like P14 cells were those encoding TFs including Lef1, Ikzf2, Satb1, Myb, and Sox4 and lymphoid tissue homing molecules including Ccr7 and Sell (Fig. 4a). In addition, BACH2 overexpression downregulated chemokine receptors including Ccr2, Ccr5, and Cxcr6 and inhibitory receptors including Pdcd1, Havcr2, and Tigit in stem-like P14 cells (Fig. 4a). Notably, expression of Prdm1 and Batf, both of which encode TFs driving T cell exhaustion18,36, was also reduced in BACH2 OE stem-like P14 CD8+ T cells (Fig. 4a). Next, we used gene-set enrichment analysis (GSEA)37 to determine the effect of BACH2 overexpression on the transcriptional activity of gene sets in stem-like CD8+ T cells. Compared to control stem-like P14 CD8+ T cells, BACH2 OE stem-like CD8+ T cells upregulated stem-like gene signature and downregulated terminal exhaustion gene signature (Fig. 4b). In addition, BACH2 overexpression upregulated pathways including “Negative regulation of transcription by RNA polymerase II”, “Covalent chromatin modification”, and “Chromatin organization”, consistent with the role of BACH2 as a transcriptional repressor (Fig. 4c and Extended Data Fig. 4b). Among the pathways downregulated by BACH2 overexpression were “Downstream TCR signaling”, “Regulation of RUNX3 expression and activity”, and “Regulation of apoptosis” (Fig. 4c and Extended Data Fig. 4b). Consistent with the GSEA results, BACH2 overexpression reduced the amounts of phospho-Akt (S473) and phospho-ribosomal protein S6 (S235/S236) in P14 CD8+ T cells after re-stimulation with GP33-41 peptide (Extended Data Fig. 4c,d), suggesting that BACH2 inhibits TCR-driven PI3K-Akt-mTOR signaling. In addition, we have also observed a lower frequency of dead cells in BACH2 OE P14 CD8+ T cells than control P14 cells on day 7 p.i. (Extended Data Fig. 4e), suggesting a potential role of BACH2 in repressing cell death of antiviral CD8+ T cells. Taken together, using scRNA-Seq and RNA-Seq, we have shown that BACH2 overexpression imposes the transcriptional program of stem-like CD8+ T cells and represses the expression of genes and pathways associated with T cell exhaustion.
Fig.4 ∣. BACH2 overexpression alters the expression of genes and pathways in stem-like CD8+ T cells.
Experimental setup is the same as in Fig. 2. RNA-Seq was performed with pMIG (n=3 independent samples) and BACH2 OE (n=3 independent samples) stem-like (Ly108hiTIM-3lo) P14 CD8+ T cells collected from mice on day 7 after LCMV clone 13 infection. a, A heatmap of representative differentially expressed genes (fold change >1.5, FDR < 0.05) between pMIG and BACH2 OE stem-like P14 cells. Each column represents an independent sample. The color scale is based on z-score distribution. FDR was calculated by edgeR. b, Gene set enrichment analysis (GSEA) illustrating the enrichment of stem-like (left) and terminally exhausted (right) gene signatures in BACH2 OE versus pMIG stem-like P14 CD8+ T cells. NES, normalized enrichment score; adj P, adjusted P value. c, GSEA by clusterProfiler illustrates gene sets upregulated or downregulated in BACH2 OE versus pMIG stem-like P14 cells.
BACH2 deficiency impairs stem-like CD8+ T cell differentiation.
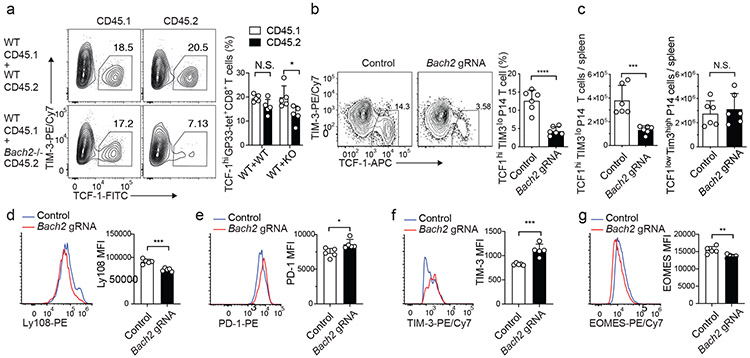
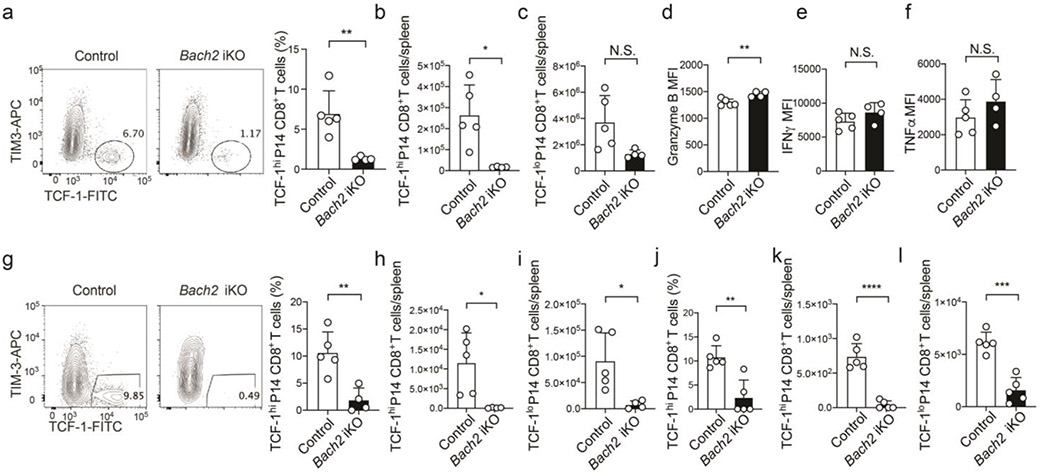
To determine whether cell-intrinsic BACH2 activity is required for stem-like CD8+ T cell differentiation during chronic viral infection, we reconstituted lethally irradiated wild-type CD45.1 mice with either wild-type CD45.1 and wild-type CD45.2 or wild-type CD45.1 and Bach2−/− CD45.2 mixed bone marrows. On day 10 p.i., significantly lower frequency of stem-like (TCF-1hiTIM-3lo) CD8+ T cells was found in Bach2−/− LCMV-specific CD8+ T cells than in wild-type LCMV-specific CD8+ T cells in the same mice (Fig. 5a). This result suggests that cell-intrinsic BACH2 activity is required for the differentiation of stem-like CD8+ T cells. Germline deletion of Bach2 compromises the quiescence of naïve T cells31,38. To overcome this problem, we used retroviral CRISPR/Cas9 system to delete Bach2 in activated CD8+ T cells. There was a ~3-fold reduction in the frequency and number of stem-like CD8+ T cells in Cas9; P14 CD8+ T cells transduced with Bach2 gRNA on day 7 p.i., whereas the number of terminally exhausted CD8+ T cells on day 7 p.i. was not overtly affected by BACH2 deficiency (Fig. 5b,c). There was also a reduction in Ly108 expression in BACH2-deficient P14 CD8+ T cells (Fig. 5d). These results suggest that cell-intrinsic requirement for BACH2 in stem-like CD8+ differentiation is independent of its role in the quiescence of naïve T cells. We found that BACH2 deficiency led to upregulation of PD-1 and TIM-3 in stem-like P14 CD8+ T cells (Fig. 5e,f). In addition, compared to control P14 CD8+ T cells, BACH2-deficient P14 cells downregulated EOMES (Fig. 5g). To further determine the cell-intrinsic effect of BACH2 deficiency on the differentiation of stem-like CD8+ T cells and long-term antiviral CD8+ immunity, we adoptively transferred CD45.2 Bach2loxP/loxP Cre/ERT2 CD8+ T cells transduced with P14 TCR into B6 CD45.1 recipients and treated the recipients with vehicle (control) or tamoxifen to induced knockout (Bach2 iKO). On day 7 after LCMV clone 13 infection, BACH2 deficiency significantly reduced the frequency and the number of stem-like CD8+ T cells within the transferred P14 cells without overtly affecting the number of terminally exhausted CD8+ T cells (Extended Data Fig. 5a-c). Bach2 iKO P14 cells upregulated granzyme B compared to control P14 cells (Extended Data Fig. 5d). However, the production of IFN-γ and TNF by P14 CD8+ T cells was not significantly affected by BACH2 deficiency (Extended Data Fig. 5e,f). Notably, BACH2 deficiency significantly reduced the numbers of both stem-like and terminally exhausted P14 CD8+ T cells as well as the frequency of stem-like P14 cells in two weeks and one month after LCMV clone 13 infection (Extended Data Fig. 5g-l), indicating that BACH2 deficiency causes defective persistence of antiviral CD8+ T cells during the chronic phase of infection. Thus, our results suggest that cell-intrinsic BACH2 activity is required for the differentiation of stem-like CD8+ T cells and persistence of virus-specific CD8+ T cells during chronic LCMV infection.
Fig.5 ∣. BACH2 deficiency impairs the differentiation of stem-like CD8+ T cells.
a, Mixed bone marrow chimeric mice reconstituted with wild-type CD45.2 and wild-type CD45.1 (WT+WT) or Bach2−/− CD45.2 and wild-type CD45.1 bone marrows (WT+KO) were infected with LCMV clone 13 and analyzed on day 10 p.i.. Frequencies of stem-like (TCF-1hiTIM-3lo) cells within H-2Db GP33 tetramer+ CD45.1 and CD45.2 CD8+ T cells in chimeras are shown in FACS plots (left) and summary bar graph (right, n=5). b-g, Cas9; P14 CD8+ T cells transduced with control or Bach2 gRNA constructs were adoptively transferred into C57BL/6 mice that were subsequently infected with LCMV clone 13. Splenic P14 cells were analyzed on day 7 p.i.. b, Frequencies of stem-like (TCF-1hiTIM-3lo) cells within control or Bach2 gRNA transduced P14 CD8+ T cells are shown in FACS plots (left) and summary bar graph (right, n=6). c, Numbers of control or Bach2 gRNA transduced stem-like (TCF-1hiTIM-3lo, left panel) or terminally exhausted (TCF-1loTIM-3hi, right panel) P14 CD8+ T cells (n=6). d-g, FACS analyses of Ly108 (d, n=5), PD-1 (e, n=5), TIM-3 (f, n=5), and EOMES (g, n=5) expression in control and Bach2 gRNA transduced stem-like P14 CD8+ T cells on day 7 p.i.. n equals the number of mice per group. Each circle represents one mouse. Bar graphs represent mean±s.d.. Data are representative of at least two independent experiments. In a, statistical significance was determined with a two-sided paired Student’s t-test. In b-g, statistical significance was determined with a two-sided unpaired Student’s t-test. *P < 0.05, **P < 0.01, ***P < 0.001, ****P < 0.0001.
The transcriptional program of stem-like CD8+ T cells requires BACH2.
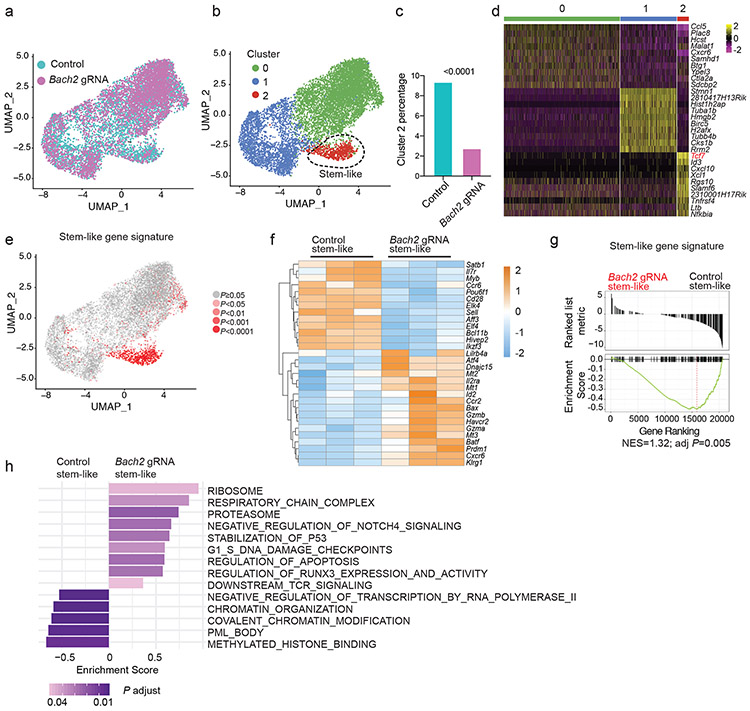
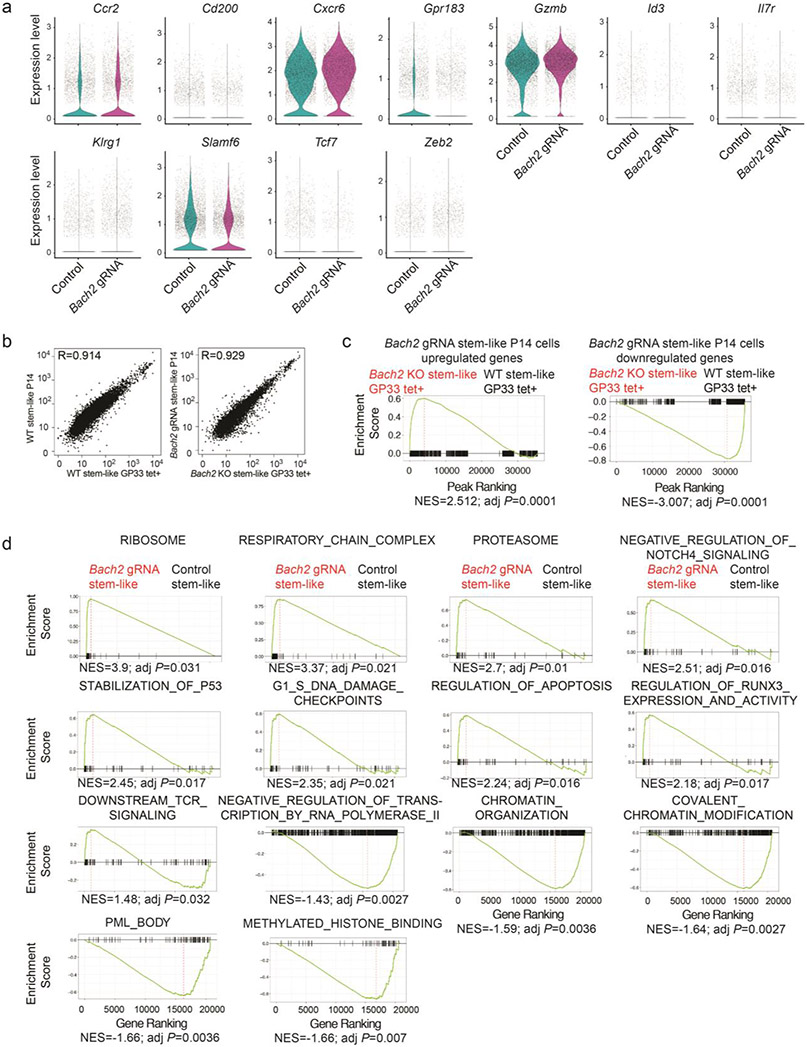
To understand the effect of BACH2 deficiency on the transcriptome of virus-specific CD8+ T cells responding to chronic infection, we performed a scRNA-Seq analysis with Cas9; P14 CD8+ T cells transduced with control or Bach2 gRNA construct from mice on day 7 after LCMV clone 13 infection (Fig. 6a). Cells were partitioned into three distinct clusters using unsupervised clustering (Fig. 6b). Notably, BACH2 deficiency led to a ~3-fold reduction in the frequency of cells in cluster 2 (Fig. 6c). 163 genes including several markers of stem-like CD8+ T cells (e.g. Tcf7, Id3, and Slamf6) were upregulated in P14 cells in cluster 2 compared to cells in other clusters (Fig. 6d). Consistently, single-cell gene set enrichment revealed that cells in cluster 2 were highly enriched with the gene signature of stem-like CD8+ T cells (Fig. 6e). Thus, we confirmed that BACH2 deficiency led to a profound defect in stem-like CD8+ T cell differentiation. In line with these results, expression of Tcf7, Id3, Slamf6, Cd200, and Il7r was reduced in BACH2-deficient P14 cells compared to control P14 cells (Extended Data Fig. 6a). In addition, BACH2 deficiency upregulated genes highly expressed by terminally exhausted CD8+ T cells including Ccr2, Cxcr6, and Gzmb, and genes associated with short-lived effector CD8+ T cells including Klrg1 and Zeb29,39,40 (Extended Data Fig. 6a).
Fig.6 ∣. BACH2 is required for the transcriptional program of stem-like CD8+ T cells.
Experimental setup is the same as in Fig. 5b. a-e, scRNA-Seq was performed with control and Bach2 gRNA transduced P14 CD8+ T cells on day 7 p.i.. a, UMAP projection of control (iris blue, n=5,457) and Bach2 gRNA (Magenta, n=4,579) transduced P14 CD8+ T cells. Each dot represents one cell. b, Unsupervised clustering identified three subsets (clusters 0-2) of P14 CD8+ T cells. c, Percentages of cells in cluster 2 in control and Bach2 gRNA transduced P14 cells. Statistical significance was determined by one-sided Chi-squared test. ****P < 0.0001. d, A heatmap of the top 10 genes expressed in each cluster defined in Fig. 6b. e, Feature plot illustrating enrichment (log2 P values) of stem-like gene signature in each cell. Each dot represents one cell. P values were determined by a one-sided Fisher’s exact test. f-h, RNA-Seq was performed with stem-like (Ly108hiTIM-3lo) control (n=3 independent samples) and Bach2 gRNA (n=3 independent samples) transduced P14 CD8+ T cells on day 7 p.i.. f, A heatmap of representative differentially expressed genes (fold change >1.5, FDR < 0.05) between control and Bach2 gRNA transduced stem-like P14 cells. Each column represents an independent sample. The color scale is based on z-score distribution. FDR is determined by edgeR. g, Enrichment of stem-like gene signature in BACH2-deficient versus control stem-like P14 CD8+ T cells determined by GSEA. NES, normalized enrichment score; adj P, adjusted P value. h, GSEA by clusterProfiler illustrating gene sets upregulated or downregulated in Bach2 gRNA transduced stem-like P14 cells relative to controls.
Given that BACH2 deficiency did not overtly alter the transcriptome of terminally exhausted CD8+ T cells (clusters 0 and 1 in Fig. 6b), we decided to focus on analyzing the effect of BACH2 deficiency on the transcriptome of stem-like CD8+ T cells using RNA-Seq. A total of 1,024 genes exhibited significant upregulation (fold change>1.5, FDR<0.05) in BACH2-deficient stem-like CD8+ T cells, whereas 585 genes showed significant downregulation (fold change>1.5, FDR<0.05) due to BACH2 deficiency. Next, we performed an additional RNA-Seq experiment to compare the transcriptomes between wild-type and Bach2−/− polyclonal LCMV-specific CD8+ T cells and confirmed a strong correlation between polyclonal LCMV-specific and P14 CD8+ T cells with the same genotype (Extended Data Fig. 6b, Pearson’s R >0.9). In addition, genes upregulated or downregulated in BACH2-deficient P14 CD8+ T cells were significantly enriched in Bach2−/− or wild-type polyclonal LCMV-specific CD8+ T cells, respectively (Extended Data Fig. 6c). Notably, genes associated with T cell exhaustion such as Havcr2, Lilrb4a, Prdm1, Mt1, Mt2, and Mt3 were upregulated in BACH2-deficient stem-like CD8+ T cells (Fig. 6f). Expression of multiple genes encoding TFs including Myb, Satb1, Elk4, Hivep2, Pou6f1, Aff3, Ikzf3, and Elf4 were downregulated in stem-like CD8+ T cells upon BACH2 deficiency (Fig. 6f). We next performed a GSEA, which revealed that BACH2 deficiency downregulated stem-like gene signature in stem-like P14 cells (Fig. 6g). In addition, BACH2-deficient stem-like CD8+ T cells upregulated pathways associated with RUNX signaling, TCR signaling, and apoptosis and downregulated pathways associated with chromatin organization and histone modification (Fig. 6h and Extended Data Fig. 6d). Thus, BACH2 is required for establishing the transcriptional program of stem-like CD8+ T cells.
BACH2 epigenetically regulates stem-like CD8+ T cells.
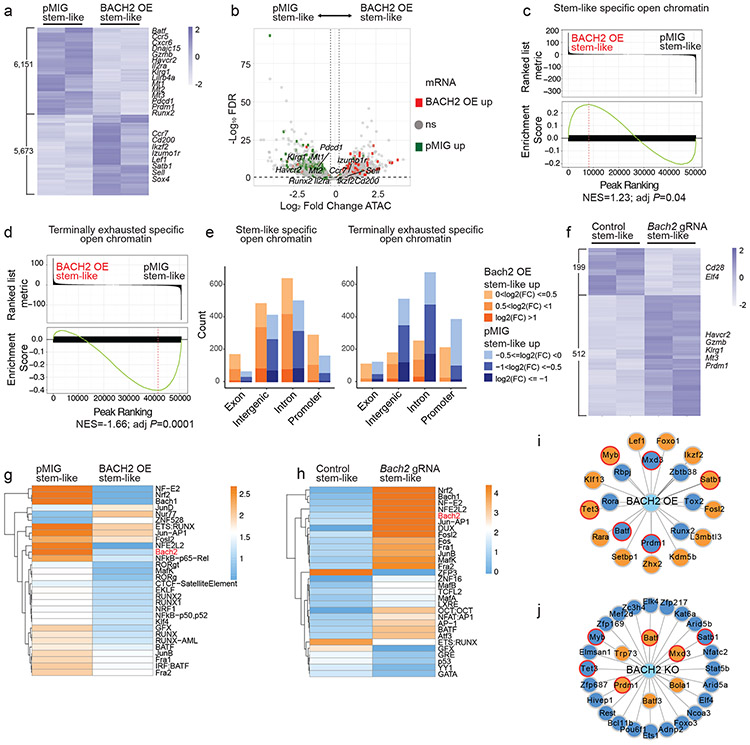
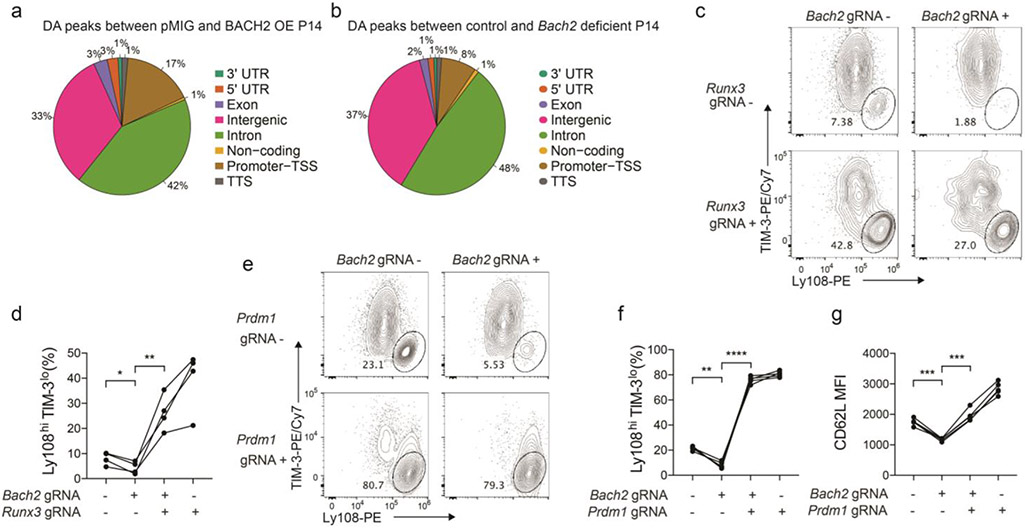
To understand the role of BACH2 in the epigenetic program of stem-like CD8+ T cells, we first performed an ATAC-Seq analysis with control (pMIG) and BACH2 OE stem-like P14 CD8+ T cells from LCMV-infected mice on day 7 p.i. (Fig. 7a). BACH2 overexpression significantly increased chromatin accessibility at 5,673 genomic regions and decreased chromatin accessibility at 6,151 genomic loci (fold change>1.2, FDR<0.1). Most genes downregulated by BACH2 overexpression contained genomic regions with reduced chromatin accessibility, whereas those upregulated by BACH2 overexpression often contained regions with greater open chromatin (Fig. 7b). In addition, BACH2 overexpression increased chromatin accessibility in regions more open in stem-like CD8+ T cells and reduced chromatin accessibility in regions more open in terminally exhausted CD8+ T cells (Fig. 7c-e). ATAC-Seq analysis with control and BACH2-deficient stem-like P14 CD8+ T cells on day 7 p.i. identified 199 genomic regions with reduced chromatin accessibility and 512 regions with increased chromatin accessibility (fold change>1.2, FDR<0.1) in BACH2-deficient stem-like P14 CD8+ T cells (Fig. 7f). Notably, the majority of differential chromatin accessible regions caused by BACH2 overexpression or BACH2 deficiency were located in intergenic or intronic regions rather than promoters (Extended Data Fig. 6a,b).
Fig.7 ∣. BACH2 regulates the epigenetic program of antiviral CD8+ T cells.
a-e, ATAC-Seq analysis of pMIG (n=2 independent samples) and BACH2 OE (n=2 independent samples) stem-like (Ly108hiTIM-3lo) P14 CD8+ T cells on day 7 after LCMV clone 13 infection. a, A heatmap showing differentially accessible chromatin regions (fold change >1.2, FDR < 0.1) between pMIG and BACH2 OE stem-like P14 T cells. Each column represents an independent sample. The color scale is based on z-score distribution. b, A volcano plot illustrating differentially accessible chromatin regions between pMIG and BACH2 OE stem-like P14 T cells. Each symbol represents a peak. Squares represent peaks associated with genes upregulated in pMIG (green) or BACH2 OE (red) stem-like P14 T cells. Grey dots represent peaks associated with genes that are not differentially expressed. c,d, Enrichment of open chromatin region signature associated with stem-like (c) or terminally exhausted (d) CD8+ T cells in BACH2 OE versus pMIG stem-like P14 T cells were determined by GSEA. NES, normalized enrichment score; adj P, adjusted P value. e, Numbers of stem-like (left) or terminally exhausted (right) specific open chromatin regions that were more accessible in BACH2 OE (orange) or pMIG (blue) stem-like P14 cells in indicated genomic features. f, A heatmap showing differentially accessible chromatin regions (fold change >1.2, FDR < 0.1) between control (n=2 independent samples) and Bach2 gRNA (n=2 independent samples) transduced stem-like P14 T cells. g,h, Heatmaps illustrate enrichment of TF motifs in differential chromatin accessibility regions between pMIG and BACH2 OE stem-like P14 T cells (g), and between control and Bach2 gRNA transduced stem-like P14 T cells (h). i,j, Bach2-centered network analysis of TFs that were differentially expressed between pMIG and BACH2 OE stem-like P14 cells as defined in Fig. 4a (i), or between control and Bach2 gRNA transduced stem-like P14 cells as defined in Fig. 6f (j). At least one BACH2 motif is present in the open chromatin regions of genes encoding these TFs. Filled color indicates upregulation (orange) or downregulation (dark blue) in BACH2 OE (i) or Bach2 gRNA (j) transduced stem-like P14 cells. Red border color highlights TFs showing consistent results in both BACH2 OE (i) and Bach2 knockout (j) experiments.
We performed a motif enrichment analysis on genomic loci with differential chromatin accessibility upon BACH2 overexpression and/or BACH2 deficiency. Consistent with the role of BACH2 as a transcriptional repressor, BACH2 overexpression reduced enrichment of BACH2 binding motif in open chromatin regions, whereas BACH2 deficiency increased enrichment of BACH2 binding motif in open chromatin regions (Fig. 7g,h). In addition, motifs of RUNX proteins, BATF, MafK, and NRF2 (or NFE2L2) exhibited less enrichment in BACH2 OE stem-like CD8+ T cells relative to control cells, whereas BACH2 deficiency in stem-like CD8+ T cells led to greater enrichment of BATF, MafK, and NRF2 motifs (Fig. 7g,h). Of note, RUNX3 downregulates signature genes of stem-like CD8+ T cells including Bcl6, Tcf7, and Cxcr5 in virus-specific CD8+ T cells during acute LCMV infection41. To test whether BACH2 antagonizes RUNX3 to promote stem-like CD8+ T cell differentiation, we co-transduced Cas9; P14 CD8+ T cells with Bach2 gRNA and Runx3 gRNA constructs. On day 7 p.i., whereas transduction with Bach2 gRNA alone significantly reduced the frequency of stem-like CD8+ T cells, P14 cells co-transduced with both Bach2 gRNA and Runx3 gRNA showed a higher frequency of stem-like CD8+ T cells than untransduced P14 cells or those transduced with Bach2 gRNA alone (Extended Data Fig. 7c,d). Therefore, BACH2 may promote stem-like CD8+ T cell differentiation by antagonizing RUNX3 pathway.
We next sought to determine TF-encoding genes that contain BACH2 binding motif in open chromatin regions and were differentially expressed in BACH2 OE and/or BACH2-deficient virus-specific stem-like CD8+ T cells (Fig. 7i,j). Notably, Prdm1, Batf, and Mxd3, which all contain BACH2 motif in open chromatin, were downregulated in BACH2 OE virus-specific stem-like CD8+ T cells and upregulated in BACH2-deficient stem-like CD8+ T cells (Fig. 7i,j). We co-transduced Cas9; P14 CD8+ T cells with retroviruses expressing a Bach2 gRNA or a Prdm1 gRNA as above. On day 7 p.i., co-transduction of P14 CD8+ T cells with Bach2 and Prdm1 gRNAs rescued the defective differentiation of stem-like CD8+ T cells and impaired CD62L expression observed in BACH2-deficient P14 cells (Extended Data Fig. 7e-g). Thus, BACH2 may enhance the differentiation of stem-like CD8+ T cells by repressing the expression of Prdm1. In summary, our results suggest that BACH2 is critical for establishing the epigenetic program of stem-like CD8+ T cells and epigenetically silences genes and pathways involved in terminal exhaustion.
Discussion
In this study, we have revealed a critical role of transcriptional repressor BACH2 in the differentiation of stem-like CD8+ T cells. During chronic LCMV infection, Bach2 locus was both transcriptionally and epigenetically active in stem-like CD8+ T cells but not in terminally exhausted CD8+ T cells. Overexpression of BACH2 drove antiviral CD8+ T cells towards stem-like lineage, whereas BACH2 deficiency impaired the differentiation of stem-like CD8+ T cells. BACH2 established the transcriptional program of stem-like CD8+ T cells and constrained transcription of genes and pathways that drive terminal exhaustion. In addition, BACH2 controlled the chromatin structure in stem-like CD8+ T cells and epigenetically silenced chromatin regions associated with terminal exhaustion.
H3K27ac ChIP-Seq, ATAC-Seq, and RNA-Seq data have revealed that Bach2 was epigenetically and transcriptionally active in stem-like CD8+ T cells. Given that Bach2 locus contains a prominent T cell super-enhancer and single-nucleotide variants at this locus is associated with multiple autoimmune diseases42,43, it is intriguing to speculate that the super-enhancer at the Bach2 locus may play a role in establishing the cellular identity of stem-like CD8+ T cells. In addition to BACH2 binding motif, motif analysis of H3K27ac and open chromatin profiles has revealed enrichment of other TF motifs in terminally exhausted CD8+ T cells such as AP1 TFs or in stem-like CD8+ T cells such as IRF8 and NFκBp65. The role of these TFs in the differentiation of stem-like CD8+ T cells awaits future investigations.
Despite facing an immunosuppressive environment, a fraction of virus-specific CD8+ T cells resist terminal exhaustion and commit to the stem-like CD8+ lineage. The molecular mechanism responsible for establishing the program of stem-like CD8+ T cells and suppressing terminal exhaustion is unclear. We have shown here that BACH2 overexpressing virus-specific CD8+ T cells almost exclusively committed to the stem-like CD8+ lineage. Pseudo-time analysis has revealed that BACH2 overexpression “froze” virus-specific CD8+ T cells in a less differentiated state and prevents them from terminal exhaustion. Consistent with these results, BACH2 deficiency led to defective differentiation of stem-like CD8+ T cells. GSEA results suggest that BACH2 may negatively regulate RUNX3 and TCR signaling in stem-like CD8+ T cells. Notably, TCR-driven RUNX3 activity suppresses the expression of Tcf7, Bcl6, and Bach2 in virus-specific CD8+ T cells during acute LCMV infection41,44. Here, we have shown that RUNX3 inhibited the differentiation of stem-like CD8+ T cells during chronic viral infection. GSEA results also show that BACH2 expression was positively associated with transcriptional repression and chromatin modification. Using ATAC-Seq analysis, we have found that BACH2 is a key regulator of the epigenetic program of stem-like CD8+ T cells. In addition to reducing chromatin accessibility at regions open in terminally exhausted CD8+ T cells, BACH2 also reduced the chromatin accessibility at genomic regions controlled by TFs such as RUNX, BATF, MafK, and NRF2. During the revision of this manuscript, a study showed that BATF counteracts BACH2 and inhibits the generation of stem-like CD8+ T cells45. The potential role of TFs such as Mafk and NRF2 in stem-like CD8+ T cell differentiation remains to be investigated.
In summary, using scRNA-Seq, RNA-Seq, and epigenomics profiling, we have demonstrated that BACH2 is essential for establishing the transcriptional and epigenetic programs of stem-like CD8+ T cells during chronic viral infection. Our study has revealed a key pathway that promotes T cell stemness and constrains terminal exhaustion and sheds light on future interventions that harness the differentiation of therapeutic T cells to treat chronic infection and cancer.
Methods
Mice, mixed bone marrow chimeras, adoptive transfer, and tamoxifen treatment.
C57BL/6 (B6), B6.CD45.1 (B6.SJL-Ptprca Pepcb/Boy), R26-CreERT2 (B6.129-Gt(ROSA)26Sortm1(cre/ERT2)Tyj) and Cas9 (B6J.129(Cg)-Gt(ROSA)26Sortm1.1(CAG-cas9*,-EGFP)Fezh) mice were purchased from the Jackson Laboratory. P14 transgenic mice expressing a transgenic TCR that recognizes the H2Db GP33-41 epitope of LCMV were backcrossed to C57BL/6 background for more than 15 generations46. Bach2−/− mice were generated by removing the second coding exon using CRISPR/Cas9 and were kept in a C57BL/6 background. Bach2loxP/loxP mice have been previously described47 and maintained in a C57BL/6 background. Mixed bone marrow chimeras were generated by reconstituting lethally irradiated CD45.1 mice with bone marrows from a CD45.1 and a CD45.2 donors mixed at 1:1 ratio. Adoptive transfer experiments were performed by intravenous injection with 5,000 P14 CD8+ T cells to recipient mice. In all experiments, mice were sex- and age-matched. To induce deletion of floxed allele by CreERT2, mice were intraperitoneally injected with tamoxifen dissolved in sunflower seed oil as previously described48. Mice were housed at 72°F(22°C) with humidity at 35~37%. The dark/light cycle was 14/10 (6am-8pm). All animal husbandry and experiments were approved by the Institutional Animal Care and Use Committee (IACUC) at the University of Colorado Anschutz Medical Campus (CU), National Institute of Allergy and Infectious Diseases (NIAID), National Human Genome Research Institute (NHGRI), or National Institute of Neurological Disorders and Stroke (NINDS).
Virus and infection.
Stock of LCMV clone 13 were generated by propagating viruses in Baby hamster kidney (BHK-21) cells. Viral titers were determined by plaque assay using Vero cells. Mice were infected by intravenous injection with 2×10⁶ plaque-forming unit (PFU) LCMV clone 13.
Retroviral transduction.
BACH2 open reading frame was inserted into MSCV-IRES-GFP (pMIG) plasmid to generate BACH2 overexpression construct. Bach2 gRNA was inserted after the U6 promoter in pMKO GFP plasmid as described previously49. Prdm1 or Runx3 gRNA was inserted after the U6 promoter in SL21 VEX plasmid. The MP71 plasmid expressing P14 TCR has been previously described50 and was a gift from W. Uckert (MDC at Berlin). Retroviruses were generated by collecting the supernatant from HEK 293T cells co-transfected with a retroviral construct described above and a pCL-Eco packaging plasmid. For retroviral transduction, activated P14 CD8+ T cells were infected with retroviruses at 32°C for 90 min during spinoculation.
Flow cytometry and cell sorting.
The following fluorophore-conjugated antibodies or proteins, and dyes were used for flow cytometry and cell sorting: anti-CD45.1 (A20, dilution 1:200), anti-CD8a (53-6.7, dilution 1:100), anti-KLRG1 (2F1, dilution 1:200), anti-PD-1 (RMP1-30, dilution 1:200), anti-TIGIT (1G9, dilution 1:100), anti-LILRB4 (H1.1, dilution 1:100), anti-IFN-γ (XMG1.2, dilution 1:200), anti-TNF (MP6-XT22, dilution 1:200), anti-CD62L (MEL-14, dilution 1:200), annexin V (dilution 1:20), and anti-CD44 (IM7, dilution 1:100) were from BioLegend; anti-rabbit IgG (dilution 1:500), anti-rat IgG (dilution 1:500), anti-B220 (RA3-6B2, dilution 1:200), anti-CD45.1 (A20, dilution 1:200), anti-CD45.2 (104, dilution 1:200), anti-TIM-3 (RMT3-23, dilution 1:50), anti-EOMES (Dan11mag, dilution 1:100), anti-CD8a (53-6.7, dilution 1:100), anti-Ly6G (1A8, dilution 1:100), anti-NK1.1 (PK136, dilution 1:100), LIVE/DEAD™ Fixable Near-IR (dilution 1:500), and LIVE/DEAD™ Fixable Aqua (dilution 1:200) were from Thermo Fisher Scientific; anti-granzyme B (GB11, dilution 1:100), anti-Ly108 (13G3, dilution 1:100) and anti-phospho-AKT(S473) (M89-61, dilution 1:20) were from BD Biosciences; anti-phospho-S6(S235/236) (D57.2.2E, dilution 1:100) and anti-TCF-1 (C63D9, dilution 1:200) from Cell Signaling Technology. H-2Db GP33-41 tetramer (dilution 1:100) was acquired from NIH Tetramer Core Facility at the Emory University. TCF-1 staining was performed using anti-TCF-1 and fluorophore-conjugated goat anti-rabbit IgG secondary antibodies as previously described48. BACH2 staining was performed with an anti-BACH2 primary antibody (7A4, dilution 1:100, Abcam) and a fluorophore-conjugated goat anti-rat IgG secondary antibody. Flow cytometry analysis and Fluorescence-activated cell sorting (FACS) were performed using BD™ LSRII, Cytek™ Aurora, and BD FACSAria™ II with BD FACSDIVA™ v8.0.2 or SpectroFlo v2.1.0. Analysis of flow cytometry data was performed with FlowJo 9.9 and FlowJo 10.6.2.
Immunohistochemistry.
Spleens were fixed with 2.5% neutral buffered formalin (NBF) overnight at 4°C and then equilibrated in 30% sucrose solution for 24h at 4°C. Spleens were embedded with tissue freezing medium (Triangle Biomedical Sciences). Cryosections were cut using a Leica CM1850 cryostat at a thickness of 30 μm. Sections were washed and stained in PBS containing 5 μM EDTA and 2% FBS. Anti-CD45.1 Alexa-647 (0.4 μg/ml; clone A20; BioLegend), anti-B220 Brilliant Violet 421 (0.5 μg/ml clone RA3-6B2, BioLegend) and anti-F4/80 PE (0.5 μg/ml clone BM8, BioLegend) were used for staining. Primary antibodies were incubated on cryosections overnight at 4°C. After staining, sections were washed 4-5 times in staining buffer. 2-3 drops of FluorSave Reagent (Calbiochem) were added to each section before addition of a coverslip. Images were acquired using an Olympus FV1200 laser scanning confocal microscope equipped 4 detectors, 6 laser lines (405, 458, 488, 515, 559, and 635 nm) and 5 objectives (4x/0.16 NA, 10x/0.4 NA, 20x/0.75 NA, 40x/0.95 NA, and chromatic aberration corrected 60x/1.4 NA).
Sample preparation for ATAC-Seq.
ATAC-Seq libraries of stem-like and terminally exhausted CD8+ T cells were generated using the protocol as previously described51. Libraries were sequenced on a HiSeq 3000 with 50 cycles of paired reads. A Fast-ATAC protocol52 was used to generate ATAC-Seq libraries of pMIG, BACH2OE, control and Bach2 gRNA samples. Briefly, 1×10⁴ FACS-sorted cells were pelleted and resuspended in 50 μl transposase mixture containing 25 μl of 2x TD buffer, 2.5 μl of TDE1 (Illumina), 0.5 μl of 1% digitonin (Promega), 22 μl of nuclease-free water. After 30 min incubation at 37 °C, transposed DNA was purified and eluted in 10 μl elution buffer with MinElute PCR purification kit (QIAGEN). Libraries were generated by PCR amplification of transposed DNA, and sequenced on a NextSeq with 50 cycles of paired reads.
ATAC-Seq analysis.
ATAC-seq data were processed as previously described51. In brief, ATAC-seq reads were mapped to the mouse genome (mm10 assembly) using Bowtie v.1.1.153. Unique reads from fragments that were less than 175 base pairs were used for peak calling with MACS (version 1.4.2)54(P < 1 × 10⁻⁵) . Peaks presents in both replicates were used for downstream analysis with Hypergeometric Optimization of Motif EnRichment program (HOMER) v.4.9.155. Peak intensities were normalized as reads-per-10-million reads (RP10M), and differentially accessible regions were determined by edgeR v.3.28.056 with the criteria FDR (Benjamini–Hochberg) < 0.1 and a fold change > 1.2. Integrative Genomics Viewer is used to visualize peaks. Peak set enrichment was performed with ClusterProfiler v.3.14.057. Volcano plots, heatmaps, Venn diagram, and pie chart were generated with R v.3.6.1.
Sample preparation for scRNA-Seq.
Chromium Single Cell 3′ Library & Gel Bead Kit v.2 (10x Genomics) was used to generate scRNA-Seq libraries according to the manufacturer’s protocol. In brief, FACS-sorted cells were loaded onto a Chromium Single Cell Chip A to generate barcoded complementary DNA. PCR (12 cycles) was performed to barcoded amplify cDNA. Index PCR (8 cycles) was performed following cDNA fragmentation, end repair and A-tailing. The purified libraries were sequenced with a 26-bsase read 1, an 8-base index read, and a 98-base read 2 on an Illumina HiSeq 3000.
scRNA-Seq analysis.
Cell Ranger toolkit v.2.0.0 was used for aligning and filtering reads, and counting barcodes and unique molecular identifiers (UMI). Seurat v.3.1.158 was used for downstream analysis. Briefly, cells with a percentage of mitochondria genes > 5% were considered as apoptotic cells and were removed. Cells with the top 0.2% or bottom 0.2% numbers of detected genes were excluded. Raw UMI counts were scaled and normalized through log transformation. Top 2,000 variable genes were selected for principle component analysis. Top 25 principal components were selected for UMAP and clustering analysis. Seurat function FindAllMarkers (logfc.threshold = 0.1) were used to find sample or cluster specific genes. Function FeaturePlot and VlnPlot were used for feature plots and violins plot with default parameters. Single-cell gene set enrichment analysis was performed as previously described19. Pseudo-time analysis was performed with Monocle v.2.14.035. Cytoscape v.3.7.259 were used for network analysis on data generated by weighted correlation network analysis (WGCNA).
Sample preparation for RNA-Seq.
RNA-Seq was performed as previously described19. Briefly, RNA was isolated from 50,000 FACS-sorted cells using miRNeasy Mini Kit (QIAGEN). NEBNext Ultra RNA Library Prep Kit for Illumina was used to generate RNA-Seq libraries, following mRNA selection with Poly(A) mRNA Magnetic Isolation Module (New England Biolabs). 12 cycles of index PCR was performed for multiplexing with NEBNext Multiplex Oligos for Illumina. The libraries were sequenced on a HiSeq 3000 in a 50-bp single read run.
RNA-Seq analysis.
RNA-Seq data were analyzed as previously described19. Briefly, TopHat v.2.1.060 was used to map reads to the mouse genome (mm10). Partek Genomics Suite analysis software v.6.6 was used to calculate reads per kilobase of transcript per million mapped reads. Differentially expressed genes (FDR < 0.05, fold change > 1.5) were determined by EdgeR v.3.28.0. GSEA was performed with ClusterProfiler v.3.14.057. Heat maps were plotted with the R package ggplot2. Bigwig files were generated with STAR v.2.4.2.
Statistical analysis
Prism 8 (GraphPad Software) and R v.3.6.1 are used to perform statistical analysis. A two-tailed Students’ t-test was used to calculate statistical significance between two independent conditions. Fisher’s exact test was used to determine statistical enrichment of gene sets in scRNA-Seq data. Chi-squared test is used to determine statistical difference between two proportions. A P value of <0.05 was considered significant.
Reporting Summary
Further information on research design is available in the Nature Research Reporting Summary linked to this article.
Data availability
All data generated to support this study are available within the paper. The ATAC-Seq (Fig. 1,7 and Extended Data Fig. 1,7), scRNA-Seq (Fig. 3,6 and Extended Data Fig. 3,6), and RNA-Seq (Fig. 4,6 and Extended Data Fig. 4,6) data have been deposited at Gene Expression Omnibus (GEO accession no. GSE152379). H3K27AC ChIP-Seq and RNA-Seq data of stem-like and terminally exhausted CD8 T cells were previously published (GEO accession no. GSE119943).
Code availability
Custom code used for ATAC–Seq, RNA-Seq and scRNA-Seq analyses are available from the corresponding author upon request.
Extended Data
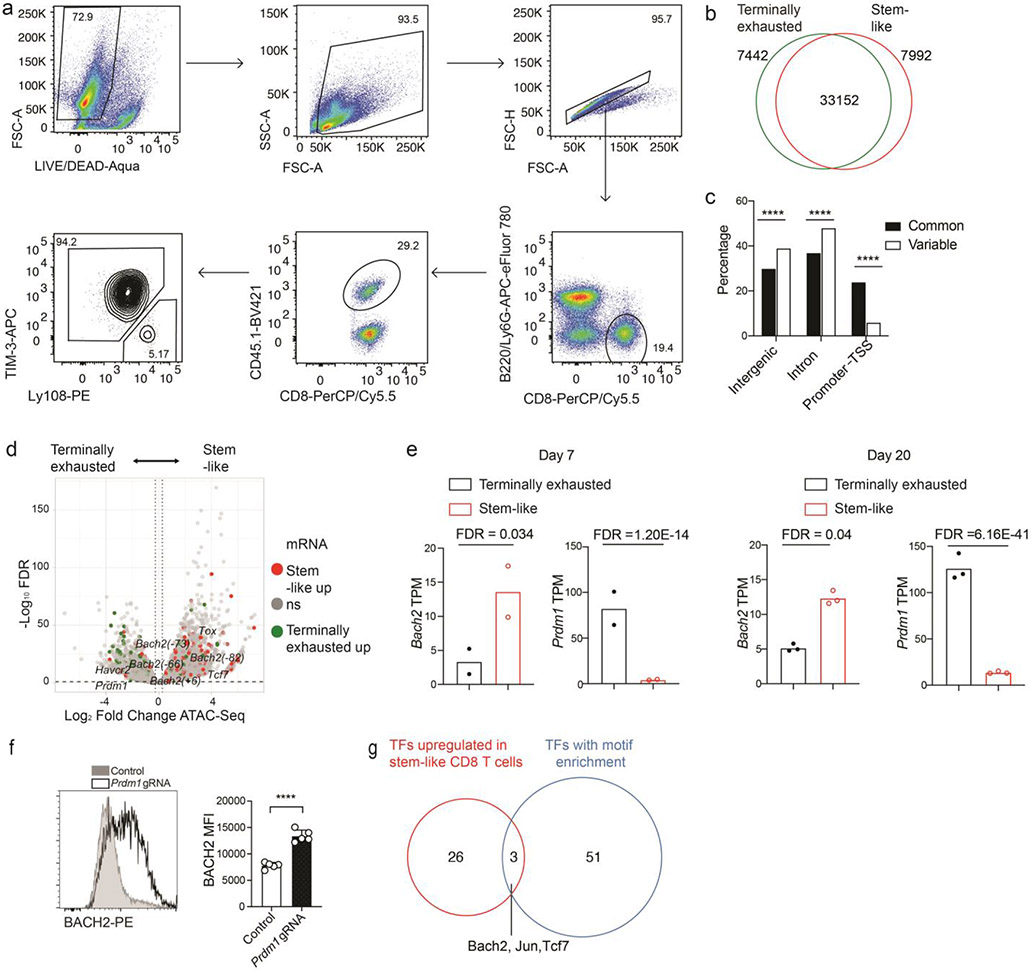
Extended Data Figure 1. Stem-like and terminally exhausted CD8+ T cells exhibited distinct open chromatin landscapes.
a, Experimental setup has been described in Fig. 1a. Gating strategy for sorting stem-like (Ly108hiTIM-3lo) and terminally exhausted (Ly108loTIM-3hi) P14 cells on day 7 p.i.. b, Venn diagram illustrating the numbers of ATAC-Seq peaks in stem-like and terminally exhausted CD8+ T cells. c, Percentages of common and variable ATAC-Seq peaks, as defined in Extended Data Fig.1b, annotated to Intergenic, Intronic, and Promoter-TSS regions. Filled bars represent common peaks; unfilled bars represent variable peaks. P values were determined by the Chi-squared test. d, Volcano plots of differentially accessible chromatin regions between stem-like and terminally exhausted CD8+ T cells are shown. The x axis represents log2 fold change of chromatin accessibility; the y axis represents −log10FDR. The horizontal dash line indicates FDR=0.1; vertical dash lines indicate fold change of +/− 1.2. Dots represent peaks associated with significantly upregulated genes (fold change >1.5, FDR <0.05) in stem-like (red) or terminally exhausted (green) CD8+ T cells, and non-significantly regulated genes (grey). FDR is calculated by edgeR. ATAC-Seq data include n=2 independent experiments per group. e, The transcript abundance of Bach2 and Prdm1 in stem-like and terminally exhausted P14 CD8+ T cells harvested on day 7 (left, n=2 independent samples) and day 20 (right, n=3 independent samples) after LCMV clone 13 infection are shown in bar graphs. FDR was determined using edgeR. f, Cas9; P14 CD8+ T cells transduced with control or Prdm1 gRNA constructs were adoptively transferred into C57BL/6 mice that were subsequently infected with LCMV clone 13. Splenic P14 cells were analyzed on day 7 p.i.. The protein expression of BACH2 in control or Prdm1 gRNA transduced P14 CD8+ T cells are shown in representative FACS plot (left) and bar graph (right). g. A Venn diagram shows transcription factors (TFs) upregulated in stem-like compared to terminally exhausted CD8+ T cells (red) and TFs with motif enriched in the differentially accessible chromatin regions between stem-like and terminally exhausted CD8+ T cells (blue). Statistical significance in f was calculated with a two-sided Student’s t-test. ****P < 0.0001.
Extended Data Figure 2. BACH2 overexpression enhances stem-like CD8+ T cell differentiation during chronic LCMV infection.
a, Representative FACS plots of TCF-1 and TIM-3 expression in pMIG and BACH2 OE P14 CD8+ T cells on day 28 p.i. b, Left panel: representative FACS plots of pMIG and BACH2 OE P14 cells in CD8+ T cells on day 14 and day 28 p.i.. Right panel: fold changes in the numbers of BACH2 OE P14 cells relative to the numbers of pMIG P14 cells on day 14 and day 28 p.i.. n=5 mice/group. c-e, FACS analyses of PD-1 (c, n=5 mice/group), TIM-3 (d, n=5 mice/group), TIGIT (e, n=5 mice/group) expression in pMIG and BACH2 OE P14 CD8+ T cells on day 14 p.i.. f-h, FACS analyses of PD-1 (f, n=5 mice/group), TIM-3 (g, n=5 mice/group), TIGIT (h, n=5 mice/group) expression in pMIG and BACH2 OE P14 CD8+ T cells on day 28 p.i.. i,j, FACS analyses of KLRG1 expression in pMIG and BACH2 OE P14 CD8+ T cells on day 14 (i, n=5 mice/group) and day 28 (j, n=5 mice/group) p.i.. k,l, FACS analyses of EOMES expression in pMIG and BACH2 OE P14 CD8+ T cells on day 14 (k, n=5 mice/group) and day 28 (l, n=5 mice/group) p.i.. m-o, FACS analyses of granzyme B (m, n=5 mice/group), IFNγ (n, n=5 mice/group), TNFα (o, n=5 mice/group) expression in pMIG and BACH2 OE P14 CD8+ T cells on day 7 p.i.. p, Numbers of pMIG (n=4 mice) and BACH2 OE (n=5 mice) P14 CD8+ T cells in the liver (left) and the ratio of P14 cells in the liver versus P14 cells in the spleen in pMIG (n=4 mice) and BACH2 OE (n=5 mice) groups (right) on day 7 p.i.. q, Numbers of pMIG (n=4 mice) and BACH2 OE (n=5 mice) P14 CD8+ T cells in the lung (left) and the ratio of P14 cells in the lung versus P14 cells in spleen in pMIG (n=4 mice) and BACH2 OE (n=5 mice) groups (right) on day 7 p.i.. r,s, Representative FACS plots (left) and bar graph (right) showing the percentage of stem-like (TCF-1hiTIM-3lo) pMIG (n=4 mice) and BACH2 OE (n=5 mice) P14 CD8+ T cells in the liver (r) and lung (s). Data are representative of at least two independent experiments. Circles represent individual mice. Bar graphs represent mean±s.d.. Statistical significance was calculated with a two-sided Student’s t-test. *P < 0.05, **P < 0.01, ***P < 0.001, ****P < 0.0001
Extended Data Figure 3. ScRNA-Seq analyses of pMIG and BACH2 OE P14 cells.
a, Violin plots illustrating the mRNA amounts of differentially expressed genes between pMIG (iris blue) and BACH2 OE (red) P14 cells on day 7 p.i.. b, Left panel: UMAP projection of P14 cells colored by cell-cycle phases (G1: red; S: blue; G2/M: green). Middle panel: percentages of cells in different cell-cycle phases from each cluster defined in Fig. 3c. Right panel: percentages of cells in cluster 0 pMIG P14 cells or cluster 0 BACH2 OE P14 cells that are in different cell-cycle phases. c, Volcano plots showing differentially expressed genes between cluster 0 pMIG P14 cells and cluster 0 BACH2 OE P14 cells.
Extended Data Figure 4. RNA-Seq analyses of pMIG and BACH2 OE stem-like P14 CD8+ T cells.
a, Correlation heatmap of RNA-Seq data from independent samples (n=3/group) of pMIG and BACH2 OE stem-like (Ly108hiTIM-3lo) P14 cells in Fig. 4a. b, Significantly enriched pathways in Fig. 4c determined by GSEA. c,d, FACS analyses of phospho-ribosomal protein S6 (c) and phospho-AKT (d) in pMIG (n=5 mice) and BACH2 OE (n=4 mice) P14 cells on day 7 p.i.. e, Percentages of dead (Annexin V+ Aqua Live/Dead+) cells among pMIG (n=4 mice) and BACH2 OE (n=5 mice) P14 cells on day 7 p.i.. Data in c-e are representative of at least two independent experiments. Circles represent individual mice. Bar graphs represent mean±s.d.. Statistical significance in c-e was calculated with a two-sided Student’s t-test. **P < 0.01, ***P < 0.001.
Extended Data Figure 5. BACH2 deficiency impairs the differentiation of stem-like CD8+ T cells and persistence of antiviral CD8+ T cells during chronic LCMV infection.
Bach2loxP/loxP; Cre/ERT2 CD8+ T cells were transduced with P14 TCR and adoptively transferred to B6 CD45.1 mice. Recipients were treated with vehicle (control) or tamoxifen (Bach2 iKO) and infected with LCMV clone 13. a-f, Splenocytes were analyzed on day 7 post-infection. a, Representative FACS plots (left) and bar graph (right) showing the percentage of stem-like (TCF-1hiTIM-3lo) control (n=5 mice) and Bach2 iKO (n=4 mice) P14 cells. b,c, Numbers of stem-like (TCF-1hi) (b) and terminally exhausted (TCF-1lo) (c) control (n=5 mice) and Bach2 iKO (n=4 mice) P14 cells. d-f, FACS analysis of granzyme B (d), IFNγ (e), TNFα (f) in control (n=5 mice) and Bach2 iKO (n=4 mice) P14 cells. g-i, Splenocytes were analyzed two-week post-infection. g, Representative FACS plots (left) and bar graph (right) showing the percentage of stem-like (TCF-1hiTIM-3lo) control (n=5 mice) and Bach2 iKO (n=4 mice) P14 cells. h,i, Numbers of stem-like (TCF-1hi) (h) and terminally exhausted (TCF-1lo) (i) control (n=5 mice) and Bach2 iKO (n=4 mice) P14 cells. j-l, Splenocytes were analyzed one-month post-infection. j, Bar graph showing the percentage of stem-like control (n=5 mice) and Bach2 iKO (n=5 mice) P14 cells. k,l, Numbers of stem-like (k) and terminally exhausted (l) control (n=5 mice) and Bach2 iKO (n=5 mice) P14 cells. Data are representative of at least two independent experiments. Circles represent individual mice. Bar graphs represent mean±s.d.. Statistical significance was calculated with a two-sided Student’s t-test. *P < 0.05, **P < 0.01, ***P < 0.001, ****P < 0.0001.
Extended Data Figure 6. Transcriptome analysis of control and Bach2 gRNA transduced P14 cells.
a, Violin plots illustrating the mRNA amounts of differentially expressed genes between control (iris blue) and Bach2 gRNA (purple) transduced P14 cells on day 7 p.i.. Each dot represents one cell. b, Correlation between WT GP33 tetramer+ stem-like CD8+ T cells and control stem-like P14 CD8+ T cells (left) or between Bach2 KO GP33 tetramer+ stem-like CD8+ T cells and Bach2 gRNA stem-like P14 CD8+ T cells (right). 3 independent samples per condition. c, GSEA of RNA-Seq data from WT and Bach2 KO GP33 tetramer+ stem-like CD8+ T cells shows the enrichment of gene sets containing genes upregulated (left) or downregulated (right) in Bach2 gRNA transduced stem-like P14 cells relative to control stem-like P14 cells. d, Significantly enriched pathways in Fig. 6h determined by GSEA.
Extended Data Figure 7. The molecular program downstream of BACH2.
a, Experimental setup has been described in Fig. 7a. A pie chart illustrates the genomic distribution of differentially accessible (DA) regions between pMIG and BACH2 OE stem-like P14 cells. b, Experimental setup has been described in Fig. 7f. A pie chart illustrates the genomic distribution of DA regions between control and Bach2 gRNA transduced stem-like P14 cells. c,d, Cas9; P14 CD8+ T cells co-transduced with pMKO GFP vector expressing Bach2 gRNA and SL21 VEX vector expressing Runx3 gRNA were adoptively transferred into C57BL/6 mice that were subsequently infected with LCMV clone 13 (n=4 mice). Splenic P14 cells were analyzed on day 7 p.i.. c, Representative FACS plots of Ly108 and TIM-3 expression on GFP−VEX−, GFP+VEX−, GFP−VEX+, and GFP+VEX+ P14 CD8+ T cells. d, Percentage of stem-like (Ly108hiTIM-3lo) cells within GFP−VEX−, GFP+VEX−, GFP−VEX+, and GFP+VEX+ P14 CD8+ T cells. e-g, Cas9; P14 CD8+ T cells co-transduced with pMKO GFP vector expressing Bach2 gRNA and SL21 VEX vector expressing Prdm1 gRNA were adoptively transferred into C57BL/6 mice that were then infected with LCMV clone 13 (n=5 mice). Splenic P14 cells were analyzed on day 7 p.i.. Representative FACS plots of Ly108 and TIM-3 expression on GFP−VEX−, GFP+VEX−, GFP−VEX+, and GFP+VEX+ P14 CD8+ T cells (e) and percentage of stem-like (Ly108hiTIM-3lo) cells within GFP−VEX−, GFP+VEX−, GFP−VEX+, and GFP+VEX+ P14 cells (f) are shown. g, CD62L expression on GFP−VEX−, GFP+VEX−, GFP−VEX+, and GFP+VEX+ P14 cells. Data in c-g are representative of at least two independent experiments. Circles represent individual mice. Lines in d,f,g connect data points from the same individual mice. Statistical significance in d,f,g was calculated with a two-sided Student’s paired t-test. *P < 0.05, **P < 0.01, ***P < 0.001, ****P < 0.0001.
Acknowledgements
We thank T. Kupfer (CU), G. Hedlund (CU), K. Helm (CU), Y. Zhang (CU), M. Kirby (NHGRI), S. Anderson (NHGRI), J. Reilley (NIAID), R. Handon (NHGRI), L. Garrett (NHGRI), I. Ginty (NHGRI), G. Gutierrez-Cruz (NIAMS), and S. Dell’Orso (NIAMS) for their excellent technical support. This research was supported in part by NIH grant (AG056524) to T.W.; the intramural programs of the NIAMS (to J.J.O.), NIAID (to P.L.S.), NHGRI (to P.L.S.), NINDS (to D.B.M.), NCI (to L.G.), and NIDDK (to B.A.); NIH Office of Dietary Supplements (ODS) Research Scholar to D.C.; NIH grants (AI105343, AI117950, AI082630, AI112521, AI115712, AI108545, CA210944) and Stand Up 2 Cancer to E.J.W.; and NIH grant (CA234842) to Z.C.. E.J.W. is also supported by the Parker Institute for Cancer Immunotherapy which supports the cancer immunology program at UPenn.
Footnotes
Competing Interests Statement
E.J.W. has consulting agreements with and/or is on the scientific advisory board for Merck, Roche, Pieris, Elstar, Related Sciences and Surface Oncology. E.J.W. is a founder of Surface Oncology and Arsenal Biosciences. E.J.W. has a patent licensing agreement on the PD-1 pathway with Roche/Genentech. L.G. is inventor on a patent describing methods for the generation and isolation of stem-like memory T cells. L.G. has consulting agreements with Lyell Immunopharma and Advaxis Immunotherapies.
References
- 1.Hashimoto M et al. CD8 T Cell Exhaustion in Chronic Infection and Cancer: Opportunities for Interventions. Annu Rev Med 69, 301–318 (2018). [DOI] [PubMed] [Google Scholar]
- 2.McLane LM, Abdel-Hakeem MS & Wherry EJ CD8 T Cell Exhaustion During Chronic Viral Infection and Cancer. Annu Rev Immunol 37, 457–495 (2019). [DOI] [PubMed] [Google Scholar]
- 3.Wu T et al. The TCF1-Bcl6 axis counteracts type I interferon to repress exhaustion and maintain T cell stemness. Sci Immunol 1, eaai8593 (2016). [DOI] [PMC free article] [PubMed] [Google Scholar]
- 4.Im SJ et al. Defining CD8+ T cells that provide the proliferative burst after PD-1 therapy. Nature 537, 417–421 (2016). [DOI] [PMC free article] [PubMed] [Google Scholar]
- 5.Leong YA et al. CXCR5(+) follicular cytotoxic T cells control viral infection in B cell follicles. Nat Immunol 17, 1187–1196 (2016). [DOI] [PubMed] [Google Scholar]
- 6.He R et al. Follicular CXCR5- expressing CD8(+) T cells curtail chronic viral infection. Nature 537, 412–428 (2016). [DOI] [PubMed] [Google Scholar]
- 7.Utzschneider DT et al. T Cell Factor 1-Expressing Memory-like CD8(+) T Cells Sustain the Immune Response to Chronic Viral Infections. Immunity 45, 415–427 (2016). [DOI] [PubMed] [Google Scholar]
- 8.Hudson WH et al. Proliferating Transitory T Cells with an Effector-like Transcriptional Signature Emerge from PD-1(+) Stem-like CD8(+) T Cells during Chronic Infection. Immunity 51, 1043–1058 e1044 (2019). [DOI] [PMC free article] [PubMed] [Google Scholar]
- 9.Chen Z et al. TCF-1-Centered Transcriptional Network Drives an Effector versus Exhausted CD8 T Cell-Fate Decision. Immunity 51, 840–855 e845 (2019). [DOI] [PMC free article] [PubMed] [Google Scholar]
- 10.Zander R et al. CD4(+) T Cell Help Is Required for the Formation of a Cytolytic CD8(+) T Cell Subset that Protects against Chronic Infection and Cancer. Immunity 51, 1028–1042 e1024 (2019). [DOI] [PMC free article] [PubMed] [Google Scholar]
- 11.Snell LM et al. CD8(+) T Cell Priming in Established Chronic Viral Infection Preferentially Directs Differentiation of Memory-like Cells for Sustained Immunity. Immunity 49, 678–694 e675 (2018). [DOI] [PMC free article] [PubMed] [Google Scholar]
- 12.Chu HH et al. Continuous Effector CD8(+) T Cell Production in a Controlled Persistent Infection Is Sustained by a Proliferative Intermediate Population. Immunity 45, 159–171 (2016). [DOI] [PMC free article] [PubMed] [Google Scholar]
- 13.Jansen CS et al. An intra-tumoral niche maintains and differentiates stem-like CD8 T cells. Nature 576, 465–470 (2019). [DOI] [PMC free article] [PubMed] [Google Scholar]
- 14.Sade-Feldman M et al. Defining T Cell States Associated with Response to Checkpoint Immunotherapy in Melanoma. Cell 175, 998–1013 e1020 (2018). [DOI] [PMC free article] [PubMed] [Google Scholar]
- 15.Miller BC et al. Subsets of exhausted CD8(+) T cells differentially mediate tumor control and respond to checkpoint blockade. Nat Immunol 20, 326–336 (2019). [DOI] [PMC free article] [PubMed] [Google Scholar]
- 16.Siddiqui I et al. Intratumoral Tcf1(+)PD-1(+)CD8(+) T Cells with Stem-like Properties Promote Tumor Control in Response to Vaccination and Checkpoint Blockade Immunotherapy. Immunity 50, 195–211 e110 (2019). [DOI] [PubMed] [Google Scholar]
- 17.Kurtulus S et al. Checkpoint Blockade Immunotherapy Induces Dynamic Changes in PD-1(−)CD8(+) Tumor-Infiltrating T Cells. Immunity 50, 181–194 e186 (2019). [DOI] [PMC free article] [PubMed] [Google Scholar]
- 18.Man K et al. Transcription Factor IRF4 Promotes CD8(+) T Cell Exhaustion and Limits the Development of Memory-like T Cells during Chronic Infection. Immunity 47, 1129–1141 e1125 (2017). [DOI] [PubMed] [Google Scholar]
- 19.Yao C et al. Single-cell RNA-seq reveals TOX as a key regulator of CD8(+) T cell persistence in chronic infection. Nat Immunol 20, 890–901 (2019). [DOI] [PMC free article] [PubMed] [Google Scholar]
- 20.Khan O et al. TOX transcriptionally and epigenetically programs CD8(+) T cell exhaustion. Nature 571, 211–218 (2019). [DOI] [PMC free article] [PubMed] [Google Scholar]
- 21.Alfei F et al. TOX reinforces the phenotype and longevity of exhausted T cells in chronic viral infection. Nature 571, 265–269 (2019). [DOI] [PubMed] [Google Scholar]
- 22.Scott AC et al. TOX is a critical regulator of tumour-specific T cell differentiation. Nature 571, 270–274 (2019). [DOI] [PMC free article] [PubMed] [Google Scholar]
- 23.Seo H et al. TOX and TOX2 transcription factors cooperate with NR4A transcription factors to impose CD8(+) T cell exhaustion. Proc Natl Acad Sci U S A 116, 12410–12415 (2019). [DOI] [PMC free article] [PubMed] [Google Scholar]
- 24.Gautam S et al. The transcription factor c-Myb regulates CD8(+) T cell stemness and antitumor immunity. Nat Immunol 20, 337–349 (2019). [DOI] [PMC free article] [PubMed] [Google Scholar]
- 25.Huang Z et al. IL-27 promotes the expansion of self-renewing CD8(+) T cells in persistent viral infection. J Exp Med 216, 1791–1808 (2019). [DOI] [PMC free article] [PubMed] [Google Scholar]
- 26.Pauken KE et al. Epigenetic stability of exhausted T cells limits durability of reinvigoration by PD-1 blockade. Science 354, 1160–1165 (2016). [DOI] [PMC free article] [PubMed] [Google Scholar]
- 27.Sen DR et al. The epigenetic landscape of T cell exhaustion. Science 354, 1165–1169 (2016). [DOI] [PMC free article] [PubMed] [Google Scholar]
- 28.Igarashi K, Kurosaki T & Roychoudhuri R BACH transcription factors in innate and adaptive immunity. Nat Rev Immunol 17, 437–450 (2017). [DOI] [PubMed] [Google Scholar]
- 29.Kim EH et al. Bach2 regulates homeostasis of Foxp3+ regulatory T cells and protects against fatal lung disease in mice. J Immunol 192, 985–995 (2014). [DOI] [PMC free article] [PubMed] [Google Scholar]
- 30.Roychoudhuri R et al. BACH2 regulates CD8(+) T cell differentiation by controlling access of AP-1 factors to enhancers. Nat Immunol 17, 851–860 (2016). [DOI] [PMC free article] [PubMed] [Google Scholar]
- 31.Roychoudhuri R et al. BACH2 represses effector programs to stabilize T(reg)-mediated immune homeostasis. Nature 498, 506–510 (2013). [DOI] [PMC free article] [PubMed] [Google Scholar]
- 32.Herndler-Brandstetter D et al. KLRG1(+) Effector CD8(+) T Cells Lose KLRG1, Differentiate into All Memory T Cell Lineages, and Convey Enhanced Protective Immunity. Immunity 48, 716–729 e718 (2018). [DOI] [PMC free article] [PubMed] [Google Scholar]
- 33.Richer MJ, Lang ML & Butler NS T Cell Fates Zipped Up: How the Bach2 Basic Leucine Zipper Transcriptional Repressor Directs T Cell Differentiation and Function. J Immunol 197, 1009–1015 (2016). [DOI] [PMC free article] [PubMed] [Google Scholar]
- 34.Singer M et al. A Distinct Gene Module for Dysfunction Uncoupled from Activation in Tumor-Infiltrating T Cells. Cell 166, 1500–1511 e1509 (2016). [DOI] [PMC free article] [PubMed] [Google Scholar]
- 35.Trapnell C et al. The dynamics and regulators of cell fate decisions are revealed by pseudotemporal ordering of single cells. Nat Biotechnol 32, 381–386 (2014). [DOI] [PMC free article] [PubMed] [Google Scholar]
- 36.Shin H et al. A role for the transcriptional repressor Blimp-1 in CD8(+) T cell exhaustion during chronic viral infection. Immunity 31, 309–320 (2009). [DOI] [PMC free article] [PubMed] [Google Scholar]
- 37.Subramanian A et al. Gene set enrichment analysis: a knowledge-based approach for interpreting genome-wide expression profiles. Proc Natl Acad Sci U S A 102, 15545–15550 (2005). [DOI] [PMC free article] [PubMed] [Google Scholar]
- 38.Tsukumo S et al. Bach2 maintains T cells in a naive state by suppressing effector memory-related genes. Proc Natl Acad Sci U S A 110, 10735–10740 (2013). [DOI] [PMC free article] [PubMed] [Google Scholar]
- 39.Dominguez CX et al. The transcription factors ZEB2 and T-bet cooperate to program cytotoxic T cell terminal differentiation in response to LCMV viral infection. J Exp Med 212, 2041–2056 (2015). [DOI] [PMC free article] [PubMed] [Google Scholar]
- 40.Omilusik KD et al. Transcriptional repressor ZEB2 promotes terminal differentiation of CD8+ effector and memory T cell populations during infection. J Exp Med 212, 2027–2039 (2015). [DOI] [PMC free article] [PubMed] [Google Scholar]
- 41.Shan Q et al. The transcription factor Runx3 guards cytotoxic CD8(+) effector T cells against deviation towards follicular helper T cell lineage. Nat Immunol 18, 931–939 (2017). [DOI] [PMC free article] [PubMed] [Google Scholar]
- 42.Vahedi G et al. Super-enhancers delineate disease-associated regulatory nodes in T cells. Nature 520, 558–562 (2015). [DOI] [PMC free article] [PubMed] [Google Scholar]
- 43.Afzali B et al. BACH2 immunodeficiency illustrates an association between super-enhancers and haploinsufficiency. Nat Immunol 18, 813–823 (2017). [DOI] [PMC free article] [PubMed] [Google Scholar]
- 44.Wang D et al. The Transcription Factor Runx3 Establishes Chromatin Accessibility of cis-Regulatory Landscapes that Drive Memory Cytotoxic T Lymphocyte Formation. Immunity 48, 659–674 e656 (2018). [DOI] [PMC free article] [PubMed] [Google Scholar]
- 45.Utzschneider DT et al. Early precursor T cells establish and propagate T cell exhaustion in chronic infection. Nat Immunol 21, 1256–1266 (2020). [DOI] [PubMed] [Google Scholar]
Methods-only References
- 46.Pircher H, Burki K, Lang R, Hengartner H & Zinkernagel RM Tolerance induction in double specific T-cell receptor transgenic mice varies with antigen. Nature 342, 559–561 (1989). [DOI] [PubMed] [Google Scholar]
- 47.Kometani K et al. Repression of the transcription factor Bach2 contributes to predisposition of IgG1 memory B cells toward plasma cell differentiation. Immunity 39, 136–147 (2013). [DOI] [PubMed] [Google Scholar]
- 48.Wu T et al. TCF1 Is Required for the T Follicular Helper Cell Response to Viral Infection. Cell Rep 12, 2099–2110 (2015). [DOI] [PMC free article] [PubMed] [Google Scholar]
- 49.Ji Y et al. miR-155 harnesses Phf19 to potentiate cancer immunotherapy through epigenetic reprogramming of CD8(+) T cell fate. Nat Commun 10, 2157 (2019). [DOI] [PMC free article] [PubMed] [Google Scholar]
- 50.Leisegang M et al. Enhanced functionality of T cell receptor-redirected T cells is defined by the transgene cassette. J Mol Med (Berl) 86, 573–583 (2008). [DOI] [PubMed] [Google Scholar]
- 51.Shih HY et al. Developmental Acquisition of Regulomes Underlies Innate Lymphoid Cell Functionality. Cell 165, 1120–1133 (2016). [DOI] [PMC free article] [PubMed] [Google Scholar]
- 52.Corces MR et al. Lineage-specific and single-cell chromatin accessibility charts human hematopoiesis and leukemia evolution. Nat Genet 48, 1193–1203 (2016). [DOI] [PMC free article] [PubMed] [Google Scholar]
- 53.Langmead B, Trapnell C, Pop M & Salzberg SL Ultrafast and memory-efficient alignment of short DNA sequences to the human genome. Genome Biol 10, R25 (2009). [DOI] [PMC free article] [PubMed] [Google Scholar]
- 54.Zhang Y et al. Model-based analysis of ChIP-Seq (MACS). Genome Biol 9, R137 (2008). [DOI] [PMC free article] [PubMed] [Google Scholar]
- 55.Heinz S et al. Simple combinations of lineage-determining transcription factors prime cis-regulatory elements required for macrophage and B cell identities. Mol Cell 38, 576–589 (2010). [DOI] [PMC free article] [PubMed] [Google Scholar]
- 56.Robinson MD, McCarthy DJ & Smyth GK edgeR: a Bioconductor package for differential expression analysis of digital gene expression data. Bioinformatics 26, 139–140 (2010). [DOI] [PMC free article] [PubMed] [Google Scholar]
- 57.Yu G, Wang LG, Han Y & He QY clusterProfiler: an R package for comparing biological themes among gene clusters. OMICS 16, 284–287 (2012). [DOI] [PMC free article] [PubMed] [Google Scholar]
- 58.Macosko EZ et al. Highly Parallel Genome-wide Expression Profiling of Individual Cells Using Nanoliter Droplets. Cell 161, 1202–1214 (2015). [DOI] [PMC free article] [PubMed] [Google Scholar]
- 59.Shannon P et al. Cytoscape: a software environment for integrated models of biomolecular interaction networks. Genome Res 13, 2498–2504 (2003). [DOI] [PMC free article] [PubMed] [Google Scholar]
- 60.Trapnell C & Salzberg SL How to map billions of short reads onto genomes. Nat Biotechnol 27, 455–457 (2009). [DOI] [PMC free article] [PubMed] [Google Scholar]
Associated Data
This section collects any data citations, data availability statements, or supplementary materials included in this article.
Data Availability Statement
All data generated to support this study are available within the paper. The ATAC-Seq (Fig. 1,7 and Extended Data Fig. 1,7), scRNA-Seq (Fig. 3,6 and Extended Data Fig. 3,6), and RNA-Seq (Fig. 4,6 and Extended Data Fig. 4,6) data have been deposited at Gene Expression Omnibus (GEO accession no. GSE152379). H3K27AC ChIP-Seq and RNA-Seq data of stem-like and terminally exhausted CD8 T cells were previously published (GEO accession no. GSE119943).


