Abstract
Present study aims to investigate the combined effect of anticancer drug, norcantharidin (NCTD) in combination with glycolytic inhibitor, i.e. 2-deoxy-d-glucose (2-DG) in liver cancer (HepG2 and Hepa 1–6) cells. Cell viability of NCTD and 2-DG exposed cells was determined by MTT assay, whereas, colony-forming efficiency and migration rate was determined by clonogenic assay and wound healing assay, respectively. Nuclear DAPI staining and Annexin V FITC-PI staining were used to study the apoptosis induction in cells. Fluorescence microscopy imaging was performed to detect the intracellular reactive oxygen species (ROS) generation and mitochondrial membrane potential by staining with DCFDA and JC-1 dye, respectively. Cell viability assay revealed that NCTD and 2-DG exposure in combination displays more cytotoxic effect than a single drug. Additionally, cells lose their colony formation efficiency, as well as the reduced migration rate ability was also observed upon combined exposure. Increased nuclear condensation and mitochondrial membrane depolarization are considered as key features for apoptosis induction in cancerous cells. Furthermore, oxidative stress produced in cells due to enhanced intracellular ROS generation is also major probability for cellular damage. Thus, from the initial data it can be concluded that further preclinical studies will be needed to prove the efficacy of NCTD and 2-DG in hepatocellular carcinoma therapy.
Keywords: Norcantharidin, 2-deoxy-d-glucose, Combined effect, Anti-cancer therapeutics
Introduction
Hepatocellular carcinoma (HCC) is the third leading cause of death worldwide due to its high metastatic and recurrence rate (Hu et al. 2017). Despite the development of new therapeutic techniques, the death rate due to HCC increases consistently. Thus, there is an urgent need to develop novel and more effective therapeutic approach for HCC therapy. In this context, combination therapy which consists of multiple drugs at a single platform has become more popular in cancer treatment, as combination of two or more drugs may effectively show enhanced effect in cancerous cells (Cho et al. 2015; Zhang et al. 2016). Although combination therapy successfully utilized for several years, however, fails to cure many patients, as clinical combination mechanism of drugs are poorly understood (Pritchard et al. 2013). Combined effect leads to reduction in drug concentration with the same efficacy thus decreasing drug side effects and also minimizes the drug resistance of cancer cells (Li et al. 2014; Bayat Mokhtari et al. 2017; Zhang et al. 2016). Cancer cells exhibit altered cellular metabolism in comparison to normal cells, with increased glucose metabolism and loss of regulation between respiration and glycolytic metabolism. Cancer cells thus have an enhanced glycolysis rate and pentose phosphate cycle activity, with a reduced respiration rate. Thus, cancer cells are hypothesized to compensate for reduced respiration by increasing glycolysis but the metabolism underlying this remains obscure.
2-Deoxy-d-glucose (2-DG) is a well-known glycolytic inhibitor which acts by inhibiting the activity of enzymes involved in the glycolytic pathway, i.e. hexokinase and phosphoglucoisomerase. Other than to inhibit glycolysis, 2-DG also interferes with other metabolic processes like cellular energy depletion, oxidative stress enhancement, alteration in the N-linked glycosylation and autophagy induction. In cancer cells, toxicity of 2-DG can be governed by more than one mechanisms (Zhang et al. 2014). It competitively inhibits the glucose uptake in cells because both (2-DG and glucose) of them transferred by the glucose transporters (GLUTs). As 2-DG inhibits the critical steps of glycolysis, it also disturbs the glucose metabolism as well as ATP production which further inhibits cell growth and causes cell death (Giammarioli et al. 2012).
Norcantharidin (NCTD) is the demethylated derivative of cantharidin, with enhanced anti-cancer activity and reduced toxicity of cantharidin (Sun et al. 2017). It was obtained from dried Chinese traditional medicine blister beetle (Wang 1989). Several reports suggested about NCTD anti-tumor effect as it inhibits the growth of multiple tumors including HCC (Yang et al. 2016; Peng et al. 2016). Recently, Zhu et al. demonstrated that NCTD exposure arrest the cells in G2/M phase of cell cycle, inhibits cell growth and also induces apoptosis in osteosarcoma cells (Zhu et al. 2019). Moreover, NCTD anti-proliferation and pro-apoptotic effects in HCC were reported by up-regulating the FAM46C (tumor suppressor in HCC) (Zhang et al. 2017).
As 2-DG (glucose analog) is a well-known inhibitor of glucose metabolism, we hypothesized that 2-DG in combination with NCTD may have a combined additive effect in the treatment of cancer. Several reports suggest that a combination of 2-DG with cisplatin enhanced the cytotoxic effect via metabolic oxidative stress as well as reduces the chemoresistance in both hypoxic and normoxic conditions (Simons et al. 2007; Jalota et al. 2016). This combination up-regulated the apoptosis marker in cancerous cells with decreased autophagic marker indicating switch over from autophagy to apoptosis. In the present study, two liver cancer cells (HepG2 and Hepa 1–6) were used to analyze the effect of NCTD and 2-DG in combination or alone. Result indicates that exposure of 2-DG and NCTD in combination, enhanced the oxidative stress in both cells with increased cytotoxic effect. These results thus provide a possible therapeutic application of 2-DG and NCTD in cancer therapy.
Materials and methods
Cell culture
Two different liver cancer cell lines, i.e. HepG2 and Hepa 1–6, were used in the present study. HepG2 cells were cultured in DMEM supplemented with 10% FBS and 1% antibiotic. Whereas, Hepa 1–6 were cultured in DMEM supplemented with 10% FBS only. Both cell lines were maintained at 37 °C in a humified atmosphere with 5% CO2.
Cell viability assay
Cell viability was determined by well-known mitochondrial activity assay, i.e. MTT assay. 5 × 10³ cells/well were seeded in 96-well plate and incubated at 37 °C and 5% CO2 for 24 h. Cells were exposed to different NCTD (50 µM) and 2-DG (5 and 20 mM) concentrations alone and in combination for 48 h. Norcantharidin (NCTD) and 2-deoxy glucose (2-DG) were obtained from Innochem chemical Co, Ltd. with catalog number N159736 and B49613, respectively. NCTD stock solution was prepared in DMSO at concentration of 1 mM and working solution (50 µM) was prepared by diluting the stock solution in cell culture media. 2-DG working solution at concentration of 10 and 20 mM was prepared in the cell culture media. Same amount of DMSO was added in the control cells to maintain the similar environment as treated cells. After completion of exposure time, media was discarded and 100 µL of MTT dye (5 mg in 10 mL of cell culture media) was added into each well and incubated for 3–4 h at 37 °C. Further, MTT dye was discarded and 100 µL of dimethyl sulfoxide (DMSO) was added into each well to dissolve the blue color formazan crystals. Result was quantified in a microplate reader (iMark Bio-Rad) by recording absorbance at 590 nm. Experiment was performed in the triplicates (n = 3) to obtain the statistical significance.
Combination index analysis
Combination index (CI) analysis is used to evaluate the nature of interaction between the two drugs in combination therapy. It provides quantitative measure regarding the nature of drug interaction.
CA,X and CB,X are the drug A and B concentration, used to achieve X% effect in combination therapy. ICX,A and ICX,B, are the concentration of single drug used to achieve the same effect. In general, CI < 0.9, CI = 0.9–1.1 and CI > 1.1 indicate synergism, additivity and antagonism, respectively (Chou and Talalay 1984; Li et al. 2014).
Clonogenic assay
Clonogenic assay was performed to investigate the colony formation efficiency of HepG2 and Hepa 1–6 cells. 1000 HepG2 and 2000 Hepa 1–6 cells were seeded in 12-well and 6-well cell culture plates, respectively. After 24 h, media was replaced with a fresh medium containing 2-DG (5 and 20 mM) and 50 µM NCTD in combination and alone. Further, HepG2 and Hepa 1–6 cells were incubated for few days to allow colony formation, respectively. Colony formation was imaged under the bright field microscope (Nikon Eclipse Ti-s). Experiment was performed in the triplicates (n = 3) to obtain the statistical significance.
Wound-healing assay
Cell-based wound healing assay was performed to analyze the effect of drugs on cancer cell migration. Cells were grown up to 90% confluency in a 6-well plate and the linear wound was created into each well monolayer using 200 µL micropipette tip. Cells were then washed with PBS to remove detached cells and treated with different concentrations of 2-DG (5 mM and 20 mM) and 50 µM NCTD alone and in combination for 48 h. Further, cells edge movement was monitored by microscopy. Three different microscopic areas from three independent experiment were considered for quantification of the result. Distance between the cell edges were measured using image J software and plotted by dividing the distance between cell edges of treated groups with control group. Experiment was performed in the triplicates (n = 3) to obtain the statistical significance.
Nuclear fragmentation
Nuclear fragmentation in NCTD and 2-DG exposed cells was analyzed by DAPI staining. 50,000 cells were seeded in 12-well cell culture plate and treated with 2-DG (5 mM and 20 mM) and 50 µM NCTD alone and in combination for 48 h. Media was discarded and cells were washed with PBS followed by incubation with DAPI (1 µg/mL in methanol) for 10 min. Further, cells were washed with PBS for three times to remove extra background staining and images were acquired with fluorescence microscope (Nikon Eclipse Ti-s). Graph was plotted by counting three independent microscopic areas. Experiment was performed in the triplicates (n = 3) to obtain the statistical significance.
Intracellular reactive oxygen species generation measurement
Intracellular ROS generation was estimated using H2DCFDA dye (2, 7-dichlorofluorescein diacetate). 50,000 cells were seeded in 12-well cell culture plate and treated with 2-DG (5 mM and 20 mM) and 50 µM NCTD alone and in combination for 48 h. Media was discarded and cells were washed with PBS and stained with H2DCFDA dye (20 µM in PBS) for 30 min at 37 °C in dark. Further, extra background staining was removed by washing the cells with PBS for three times and images were acquired using fluorescence microscope. Experiment was performed in the triplicates (n = 3) to obtain the statistical significance.
Mitochondrial membrane potential assay
Membrane potential was estimated using JC-1 dye. 50,000 cells were seeded in 12 well cell culture plate and treated with 2-DG (5 mM and 20 mM) and 50 µM NCTD alone and in combination for 48 h. Media was discarded and cells were washed with PBS and stained with JC-1 dye (20 µM in PBS) for 20 min at 37 °C in dark. Further, extra background staining was removed by washing the cells with PBS for three times. Cells images were acquired using fluorescence microscope (Nikon Eclipse Ti-s). Experiment was performed in the triplicates (n = 3) to obtain the statistical significance.
Apoptosis
Apoptosis was detected using Annexin V-Fluorescein isothiocyanate (FITC) apoptosis detection kit (KeyGEN, KGA106). 2.0 × 10⁵ cells were seeded in 6-well plate and incubated for 24 h at 37 °C. Cells were then treated with 2-DG (5 mM and 20 mM) and 50 µM NCTD alone and in combination for 48 h. After completion of exposure time, media was discarded and cells were washed with PBS and trypsinized. Further, cells were collected by centrifugation, washed with PBS twice and re-suspended in 100 µl 1× binding buffer. 5 µL each of PI and FITC dye were added into cells and incubated for 15 min in dark. After incubation, 400 µL of binding buffer was added into each sample and result was acquired by flow cytometer under red and green channels. Experiment was performed in the triplicates (n = 3) to obtain the statistical significance.
Western blot
Total protein was isolated from cells seeded in 6-well plate (2 × 10⁵ cells per well). Cells were treated with 20 mM 2-DG and 50 µM NCTD alone and in combination for 48 h. Cells were washed with ice cold PBS and harvested in lysis buffer by sonication. Protein was quantified using BCA method (Pierce™, BCA Protein Assay kit). 30 µg of protein was resolved on 12% SDS–PAGE and transferred to PVDF membrane for 3 h at 300 mV. Membrane was blocked in 5% BSA for 2 h and incubated with specific primary antibody (MMP-9 and MMP-2) overnight at 4 °C. MMP-9 and MMP-2 antibodies were purchased from cell signalling technology, with catalog number #3852 and #4022, respectively. Both the antibodies were used at 1:1000 dilution in experiment. Secondary antibody was also purchased from cell signalling technology, with catalog number #7074 and used at dilution of 1:2000. Membrane was washed thrice with TBST and incubated with secondary antibody for 2 h. Blots were developed using immobilon Western-HRP substrate (Millipore, Billerica, MA, USA). Densitometry analysis of protein bands intensity was performed using image J software. Data was plotted by dividing the protein band intensity of treated group with control group. Experiment was performed in the triplicates (n = 3) to obtain the statistical significance.
Statistical analysis
Statistical analysis and significance was performed by one-way ANOVA (GraphPad Prism). For each variable at least three independent experiments were carried out. Data are given as the mean ± standard error (SE).
Result
Combination of NCTD and 2-DG exhibit the enhanced cytotoxic effect on cancer cells:
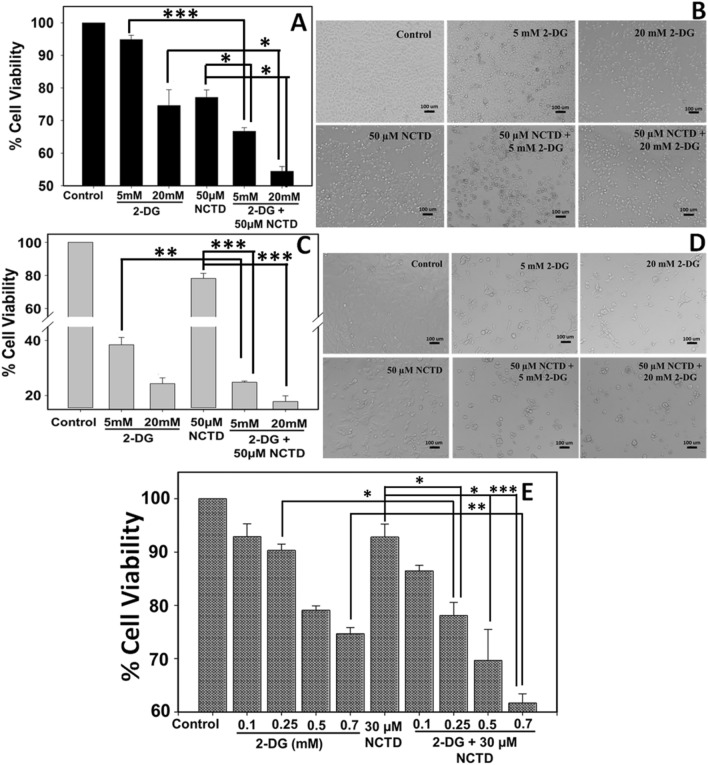
Effect of NCTD and 2-DG on the viability of HepG2 and Hepa 1–6 cells was determined by MTT assay (Fig. 1a, c). Result revealed that 2-DG exposure induces higher toxicity to Hepa 1–6 cells in comparison to HepG2 cells. 5 mM 2-DG exposure has no significant toxicity over HepG2 cells and cell viability remains more than 90%. Whereas, Hepa 1–6 cells experiences high toxicity at concentration of 5 mM 2-DG and viability decreases up to ~ 38%. However, 20 mM 2-DG proved to be toxic to both cells lines and its exposure reduces the viability of HepG2 and Hepa 1–6 cells up to 74% and 24%, respectively. Further, toxicity of anti-cancerous drug, NCTD was also evaluated and the result revealed that at concentration of 50 µM, NCTD displays the similar toxic effect on HepG2 and Hepa 1–6 cells and reduces the cell viability up to 77% and 78%, respectively. Next, we have evaluated the combined cytotoxic effect of NCTD and 2-DG over HepG2 and Hepa 1–6 cells. As shown in Fig. 1a, c, NCTD and 2-DG exhibit significant higher inhibition rate when compared with a single treatment. In HepG2 cells, 50 µM NCTD in combination with 5 mM and 20 mM 2-DG reduces the cell survival up to 66% and 54% (Fig. 1a), respectively, which is significantly lower when compared to the cell survival percentage of their respective controls. Similar, observations were obtained with Hepa 1–6 cells also where, cell viability reduces to 24% and 17% when exposed to 5 mM and 20 mM 2-DG, respectively, in combination with 50 µM NCTD (Fig. 1c).
Fig. 1.
Cell viability and morphological distortion in response to 2-DG and NCTD (in combination and alone) was determined by MTT assay and bright field microscopy, respectively. MTT assay revealed that NCTD and 2-DG combination exhibit enhanced cytotoxic effect in a HepG2 and c, e Hepa 1–6 cells. Significant increase in dead cells and distorted morphology was observed in combined treated groups when compared to single treated groups in both cell lines b HepG2 and d Hepa 1–6. Data expressed as standard error (SE) calculated from three (n = 3) independent experiments, *p < 0.05 **p < 0.01, ***p < 0.001
To prove the combined effect of these two drugs, we have performed the viability experiment at low, non-cytotoxic dose (Fig. 1e). Hepa 1–6 cells were incubated with NCTD (30 µM) and 2-DG (0.1, 0.2, 0.5 and 0.7 mM), alone and in combination for 48 h. Result clearly displayed that at lower concentrations, NCTD (30 µM) and 2-DG (0.1 and 0.2 mM) alone does not exhibit toxicity to Hepa 1–6 cells and cell viability remains more than 90%. However, when these two drugs are applied in combination, exhibit enhanced effect and the viability of cells decreases to ~ 78%. Further, we have analyzed the combination index (CI) to find the exact nature of drug interaction. Result showed that CI value is ~ 1.0, so the effect shown here seems to be additive rather than synergistic (Chou and Talalay 1984; Chou 2006).
Morphological changes of HepG2 and Hepa 1–6 cells in response to NCTD and 2-DG exposure were evaluated by bright field microscopy (Fig. 1b, d). In agreement with cell viability result, upon exposure of 5 mM 2-DG, HepG2 cells remain healthy and retains morphology similar to that of control cells, whereas, upon exposure to 20 mM DG and 50 µM NCTD, cells undergo morphological changes and higher percentage of dead cells were observed (Fig. 1a). However, Hep 1–6 cells show distorted morphology and more dead cells when exposed to 5 mM and 20 mM DG (Fig. 1d). Additionally, NCTD in combination with 2-DG imparts higher toxic effect in Hep 1–6 also, as shown in Fig. 1d, more percentage of dead cells were observed, when compared with their respective single treated groups. This observation in accordance with cell viability result displays that upon 48 h exposure, NCTD or 2-DG alone can induce significant cytotoxicity to cancer cells. However, NCTD in combination with 2-DG exhibit enhanced cytotoxic effect on HepG2 and Hepa 1–6 cells and thus inhibit the cell growth more effectively than single treatment.
NCTD and 2-DG inhibit the colony formation efficiency in liver cancer cells
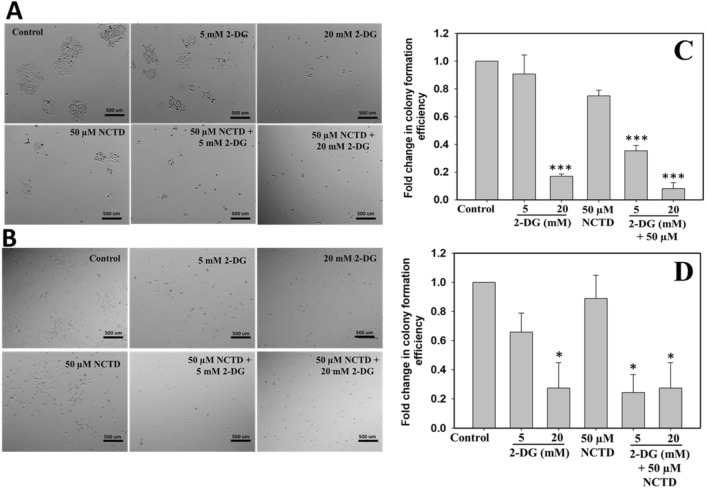
Tumorigenicity of HepG2 and Hepa 1–6 cells was determined by colony formation assay following treatment of 50 µM NCTD with 5 mM and 20 mM 2-DG for 48 h. As shown in Fig. 2a, b, control cells with no drug exposure can undergo well-formed colonies in both cells lines, whereas, cells treated with 5 mM 2-DG and 50 µM NCTD display partial inhibition and very few colonies formation were observed. However, 20 mM 2-DG exposure completely inhibited the colony formation efficiency of both cells. Further, it has been clearly observed from Fig. 2a, b, that combined treatment of NCTD and 2-DG displays complete inhibition of colony formation in both hepatocellular carcinoma cell lines, i.e. HepG2 and Hepa 1–6. Figure 2c, d shows the quantification result of HepG2 and Hepa 1–6, respectively, which was obtained by counting the colonies in three independent microscopic areas. Result clearly shows the less colony formation in combined treated group than in single treated and control groups.
Fig. 2.
Colony forming efficiency of cancerous cells in response to 2-DG and NCTD exposure was determined by clonogenic assay. Result revealed that 2-DG and NCTD combined exposure efficiently suppresses the colony formation efficiency of a HepG2 and b Hepa 1–6 cells in comparison to single treated groups. c, d Graph of c HepG2 and d Hepa1-6 plotted by counting three independent microscopic areas. Data expressed as standard error (SE) calculated from three (n = 3) independent experiments, *p < 0.05, ***p < 0.001
NCTD and 2-DG combined exposure suppresses the aggressive migration in liver cancer cells by downregulating the MMP-9 and MMP-2 expression
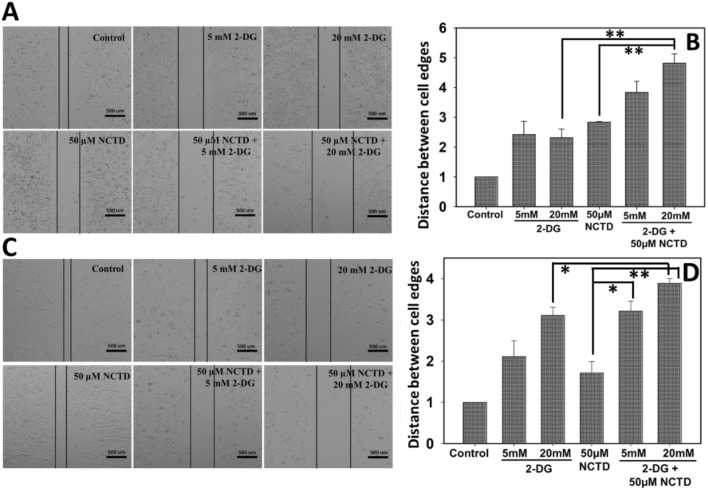
Cancer cell migration in response to combined effect of 2-DG and NCTD was evaluated by wound healing assay. Result showed that combined exposure of NCTD and 2-DG for 48 h significantly reduces the cell migration when compared to a single treated groups. As shown in Fig. 3a, b, wound in control cells was almost closed whereas, cells treated with 2-DG (5 mM and 20 mM) and NCTD (50 µM) alone as well in combination still displays noticeable wound. It has been clearly observed, wound gap is more prominent in cells treated with combination of two drugs in comparison to their respective controls. Thus, result suggests that the combined treatment of NCTD and 2-DG displays higher inhibition in the migratory potential of HepG2 and Hepa 1–6 cells.
Fig. 3.
Migration of HepG2 and Hepa 1–6 in response to 2-DG and NCTD (alone and in combination) exposure was determined by wound healing assay. Microscopy result revealed that the combination of NCTD and 2-DG efficiently suppresses the cell migration rate of a HepG2 and b Hepa 1–6 cells. Quantitative analysis of migration assay in b HepG2 and d Hepa 1–6 cells was obtained by counting three independent microscopic areas in each sample. Data expressed as standard error (SE) calculated from three (n = 3) independent experiments. *p < 0.05, **p < 0.01
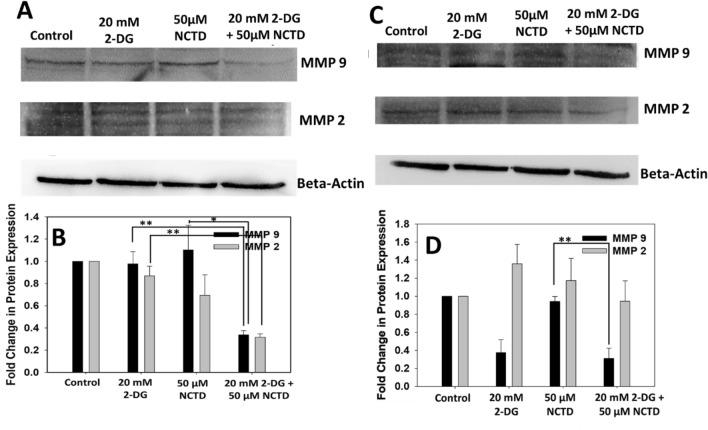
To investigate the mechanism underlying inhibitory effect of 2-DG and NCTD on migration of cells, we have analyzed the expression of MMP-9 and MMP-2 proteins, which are well known to play a key role in invasion and migration of cancerous cells. Figure 4 clearly showed that the expressions of MMP-9 and MMP-2 were decreased in the NCTD and 2-DG treated groups when compared with single treated groups, in both cell lines, HepG2 (Fig. 4a, b) and Hepa 1–6 (Fig. 4c, d). Thus, result suggest that NCTD and 2-DG, in combination inhibits the migration of liver cancerous cells by reducing the activity of MMP-9 and MMP-2 proteins, when compared to single treated groups.
Fig. 4.
Effect of 2-DG and NCTD over MMP-9 and MMP-2 protein was determined by western blot analysis. Combined exposure of 2-DG and NCTD significantly reduces the expression of MMP-9 and MMP-2 proteins in a HepG2 and c Hepa 1–6 cells. b, d Densitometry analysis of proteins were expressed in fold change. Data expressed as standard error (SE) calculated from three (n = 3) independent experiments. *p < 0.05, **p < 0.01
Enhanced effect of NCTD and 2-DG on nuclear fragmentation and apoptosis
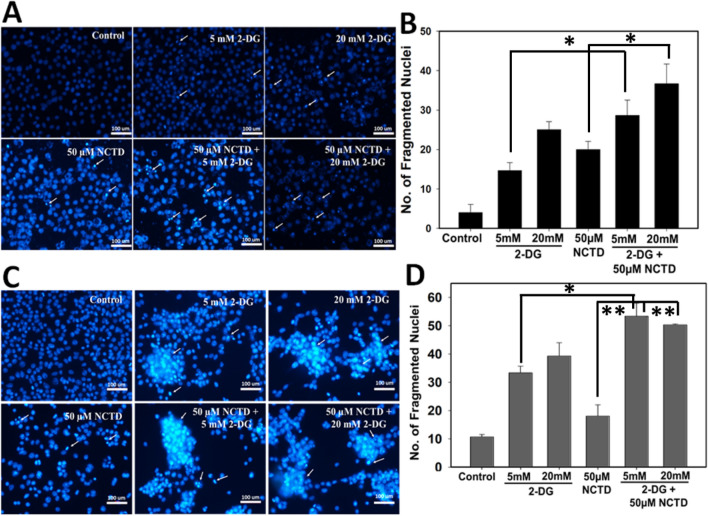
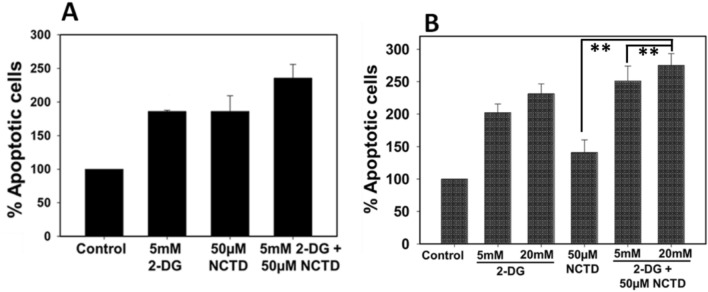
We further investigated the effect of NCTD and 2-DG alone and in combination by staining the HepG2 and Hepa 1–6 cells with DAPI, followed by recording the nuclear fragmentation under fluorescence microscopy (Fig. 5). It has been observed that 2-DG and NCTD alone and in combination exhibit significant increases in apoptotic cells in comparison to control cells. Result clearly revealed that combined exposure of NCTD and 2-DG induces significant increase in number of nuclear condensation and fragmentation (indicated by white arrows) in comparison to single treated groups. For quantitative analysis, three different microscopic areas were analyzed from each group and the graph was plotted accordingly (Fig. 5b, d). Result showed that in HepG2 cells, single drug exposure groups exhibited ~ 15–25 fragmented nuclei, whereas, in combined exposure of NCTD and 2-DG number of fragmented nuclei increased to ~ 28–35 (Fig. 5a, b). Similar trend was observed in Hepa 1–6 cells also, i.e. in single treated groups ~ 33–35 fragmented nuclei were observed, which increase to ~ 50–53 in combination groups (Fig. 5c, d). Further, Annexin V/Propidium Iodide (PI) (Fig. 6) double staining also displays an enhanced apoptotic population in cells exposed to the combined treatment of NCTD and 2-DG in comparison to single treated and control groups. As shown in Fig. 6a, a single treatment of NCTD or 2-DG induces ~ 1.85-fold increase in apoptotic cell fraction of HepG2 cells, whereas, due to combined drug exposure apoptotic cell population increases up to ~ 2.35-fold in comparison to control cells. Similar observation was also recorded for Hepa 1–6 cells, where exposure of NCTD and 2-DG alone induces ~ 1.4–2.3-fold increase in apoptotic cells, respectively, which increases to ~ 2.7-fold in the combined treated group (Fig. 6b). These combined data revealed an efficient combined effect of NCTD and 2-DG in inducing cell death by apoptosis.
Fig. 5.
Nuclear fragmentation in NCTD and 2-DG (in combination and alone) treated cells was determined by DAPI staining and image was acquired using fluorescence microscopy. Result showed that 2-DG and NCTD in combination significantly induces the nuclear fragmentation (indicated by white arrows) in a HepG2 and c Hepa 1–6 cells. Quantitative analysis of nuclear fragmentation in b HepG2 and d Hepa 1–6 cells was obtained by counting three independent microscopic areas in each sample. Data expressed as standard error (SE) calculated from three (n = 3) independent experiments, *p < 0.05, **p < 0.01
Fig. 6.
Apoptotic analysis in NCTD and 2-DG (in combination and alone) exposed cells was determined by PI FITC staining. Result showed that percentage of apoptotic cells significantly increases in the combined treated groups of a HepG2 and b Hepa 1–6 cells. Data expressed as standard error (SE) calculated from three (n = 3) independent experiments, **p < 0.01
Combined effect of NCTD and 2-DG enhance the ROS production in HepG2 and Hepa 1–6 cells
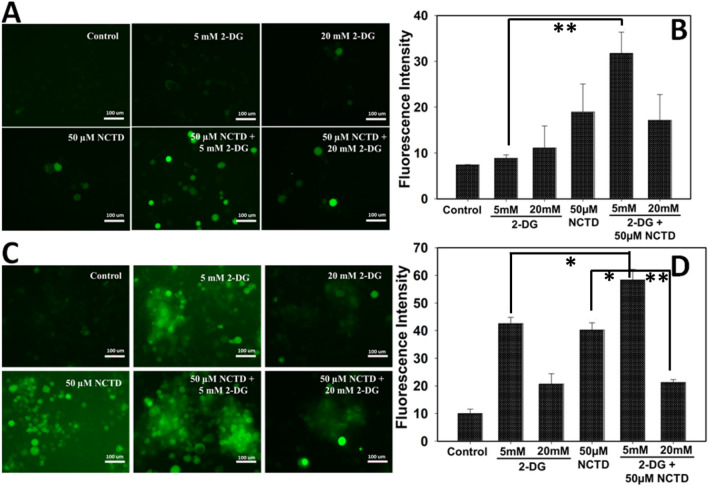
To evaluate the involvement of ROS in drug-mediated toxicity, intracellular ROS generation in NCTD and 2-DG exposed cells was estimated by DCFDA staining (Fig. 7). Result revealed that exposure of 2-DG and NCTD in combination induces a significant increase in intracellular ROS generation in comparison to single treated and control cells as evident by increased green fluorescence in HepG2 (Fig. 7a, b) and Hepa 1–6 (Fig. 7c, d) cells. Increased ROS generation leads to oxidative stress in cells which in turn damage the important biological macromolecules and induces apoptosis in cells.
Fig. 7.
Oxidative stress in NCTD and 2-DG exposed groups was determined by DCFDA staining and images were acquired by fluorescence microscopy. Result showed that NCTD and 2-DG in combination efficiently induces the ROS generation in a HepG2 and c Hepa 1–6 cells. b, d Quantitative analysis was done by measuring the fluorescent intensity of three independent areas in HepG2 and Hepa 1–6 cells, respectively. Data expressed as standard error (SE) calculated from three (n = 3) independent experiments, *p < 0.05, **p < 0.01
NCTD and 2-DG combined effect induces membrane depolarization in liver cancer cells
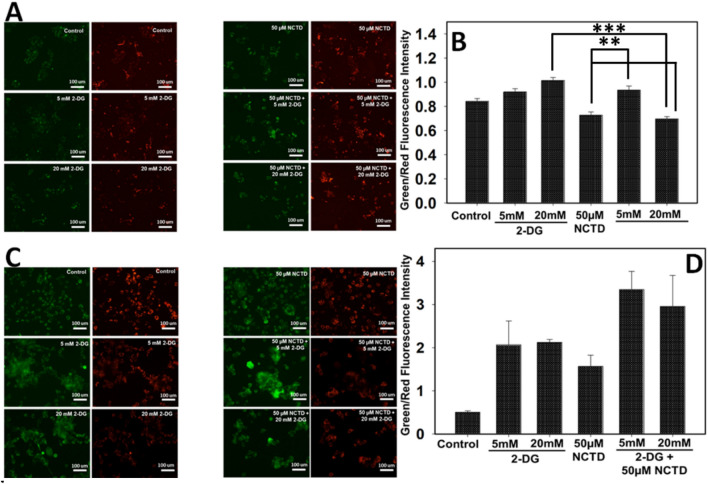
Mitochondrial membrane potential was analyzed by staining cancer cells with JC-1 dye and further analysed by fluorescence microscope. The dye undergoes aggregation and displays red color fluorescence in healthy cells, whereas, in apoptotic cells, due to loss of mitochondrial membrane potential, dye exists in monomeric form and change color from red to green. As shown in Fig. 8, NCTD or 2-DG treated cells cause decreased membrane potential and showed high green:red fluorescence than control cells. Further, microscopic investigation revealed that Hepa 1–6 cells exposed to combined treatment of 2-DG and NCTD shows enhanced green:red fluorescence in comparison to single treated and control groups (Fig. 8c, d). Thus, result suggest that NCTD and 2-DG in combination induces additive membrane depolarization effect on Hepa 1–6 cells which further leads to cytotoxicity and apoptosis, whereas in HepG2 cells no such effect was observed (Fig. 8a, b).
Fig. 8.
NCTD and 2-DG induced membrane depolarization in HepG2 and Hepa 1–6 cells were determined by JC-1 staining and images were acquired by fluorescence microscopy. Result showed that combined exposure of 2-DG and NCTD decreases the membrane potential of a HepG2 and b Hepa 1–6 cells in comparison to single treated groups. Quantitative analysis for b HepG2 and d Hepa 1–6 cells were done by measuring the fluorescence intensity of three independent areas. Data expressed as standard error (SE) calculated from three (n = 3) independent experiments, *p < 0.05, **p < 0.01, ***p < 0.001
Discussion
Cancer cells are well reported to have defects in their respiratory mechanism and also known to exhibit increased glucose metabolism and pentose phosphate cycle activity (Warburg 1956; Weber 1977). Products of glycolysis and pentose phosphate pathway are important for detoxification of pro-oxidants in cells (Averill-Bates and Przybytkowski 1994; Lucarelli et al. 2015). In comparison to normal cells, cancer cells ferment glucose into lactate for energy generation even in the presence of sufficient oxygen. Cancer cells increased dependency on glucose metabolism has proved to be an attractive target and can be utilized to gain therapeutic advantage in targeted eradication of cancer cells. Reports suggest that glucose deprivation and 2-DG exposure leads to cytotoxic effect in cancerous cells due to increased production of pro-oxidants, which supports the involvement of oxidative stress in mechanism (Andringa et al. 2006; Sharma et al. 2010; Kaushik et al. 2015). 2-DG is a synthetic glucose analog which competitively prevents the glucose internalization into cells, inhibits glycolysis and also interferes with cellular processes like energy generation, enhanced oxidative stress and autophagy induction (Bandugula and Prasad 2013). NCTD is a potent anticancer agent and reported to induce toxicity in various types of cancers including liver cancer, with anti-proliferative and apoptotic effect (Wang et al. 2017; Li et al. 2017; Liu et al. 2012). Most important, in comparison to other traditional therapeutic drugs, NCTD preferentially induces toxicity to cancerous cells rather than normal cells (Liao et al. 2007).
HCC is a hypervascular type of tumor with high level of neovascularization and angiogenesis (Geis et al. 2015). To avoid the single treatment resistance in cancer cells, the present study demonstrated the combination therapy to enhance the lethality of treatment and also to reduce the dose-responsive side-effects (Wang et al. 2017). Earlier 2-DG was reported to enhance the efficacy of several drugs like Adriamycin, paclitaxel and cisplatin in in vivo and in vitro studies (Maschek et al. 2004; Simons et al. 2007; Jalota et al. 2016). These reports suggest that 2-DG may have ability to increase the efficacy of standard chemotherapeutic drugs. Based on these observations, in the present study, we investigated whether NCTD in combination with 2-DG serves to be a better anti-tumor agent than NCTD or 2-DG alone in the liver cancerous cell line (HepG2 and Hepa 1–6). Result demonstrated that NCTD or 2-DG alone can exhibit a significant cytotoxic effect in both cells over 48 h treatment. However, NCTD and 2-DG combination exhibit more potent and enhanced antitumor effect in terms of cytotoxicity, apoptosis induction, metastasis and membrane depolarization.
Several reports demonstrated about anti-cancerous effect of NCTD and 2-DG independently, through different mechanisms (O'Neill et al. 2019; Shafaee et al. 2019; Zhang et al. 2018; Lin et al. 2017). Recently, Lin et al. reported that NCTD exposure efficiently reduces the cell viability in human prostate cancer cells via inducing mitochondrial dysfunction and apoptosis (Lin et al. 2017). Further, Zhang et al. also demonstrated that NCTD in combination with diamminedichloroplatinum inhibits the cell proliferation and induces apoptosis in H22 cancer cells (Zhang et al. 2018). In a similar context, present study also demonstrated the combinatorial effect of NCTD and 2-DG over cancer cell viability by MTT assay. Combined exposure of NCTD and 2-DG induces more cell death in comparison to single treated groups, suggesting the increased cytotoxic effect of combined treatment in HepG2 and Hepa 1–6 cells (Fig. 1a, c). Further, morphological analysis by microscopy also indicates the presence of more distorted and round cells in combined NCTD and 2-DG exposure than single treatment (Fig. 1b, d). Clonogenic assay is an indicator of colony-forming ability of isolated cancer cells in response to drug exposure. Several reports demonstrated about the colony formation inhibiting ability of NCTD in different cell lines (Hong et al. 2019; Shou et al. 2013). In the present study also, NCTD in combination with 2-DG significantly inhibits the colony-forming ability of HepG2 (Fig. 2a) and Hepa 1–6 (Fig. 2b) cells in comparison to single treated or control groups. Thus, above observations similar to reported by others, suggest that NCTD and 2-DG in combination can alter the regular cellular morphology of cells, induces toxicity and thus inhibit the colony-forming ability of liver cancerous cells.
Cancer recurrence is closely related to the invasiveness and metastasis property of cancerous cells (Irani 2016). Several chemotherapeutic agents are introduced to minimize the invasion and metastasis effect of tumor. But, due to their harmful effects, natural product like NCTD found application in cancer therapy. Several studies demonstrated that NCTD exert its toxic effect by inhibiting the tumor migration, invasion and metastasis (Shou et al. 2013; Hong et al. 2019). Recently, Hong et al. demonstrated that NCTD exposure inhibited the migration and invasion of cancer cells by decreasing the MMP-2 and MMP-9 activity (Hong et al. 2019). In the present study also, NCTD and 2-DG combined exposure significantly inhibited the HepG2 and Hepa 1–6 cell migration, in comparison to single treated groups (Fig. 3a, b), as well as reduced the expression of MMP-2 and MMP-9 proteins (Fig. 4). Results are consistent with other previous studies with liver and gall bladder cancer (Yeh et al. 2012). As shown in Fig. 3 due to toxic effect and growth repression in NCTD and 2-DG treated groups, number of cells in NCTD and 2-DG combined treatment was inhomogeneous to the control group.
Various reports suggest about the apoptotic effect of NCTD in different cell lines (Shen et al. 2013; Lin et al. 2017). Antitumor activity of NCTD is also reported to be due to the induction of cell apoptosis in vitro and inhibition of tumor growth in vivo. NCTD apoptotic effect was due to the modulation of AKT signalling and interaction with the myeloid cell leukemia-1 (Mcl-1) in prostate cancer cells (Lin et al. 2017). Nuclear condensation is one of the remarkable indicator of apoptosis as well as nuclear damage can also represses the proliferation of NCTD treated liver cancer cells. As shown in Fig. 5, NCTD and 2–DG significantly increased the nuclear fragmentation rate in HepG2 (Fig. 5a, b) and Hepa 1–6 (Fig. 5c, d) cells than single treated and control groups. ~ 28–50 fragmented nuclei were recorded in the combined treated group, which was found to be higher than the control and their single treated groups. Similar, result was observed with Annexin-FITC/PI double staining (Fig. 6), which showed that combined exposure of NCTD and 2-DG increases the apoptotic cell fraction up to ~ 2.35–2.7-fold in comparison to control and single treated groups. Mitochondria is also a key indicator of apoptosis as chemotherapeutics agents can alter the mitochondrial membrane integrity which led to collapse of membrane potential (Jeong and Seol 2008; Shen et al. 2013). Earlier studies demonstrated about the mitochondrial signalling pathway-dependent apoptosis in various cancers like gastric and prostate cancer (Zheng et al. 2016; Shen et al. 2013). In the present study also, membrane potential was analyzed to investigate the mitochondrial-dependent apoptotic potential of NCTD and 2-DG. As shown in Fig. 8c, d, NCTD and 2-DG exposed Hepa 1–6 cells exhibit enhanced green:red fluorescence than single treated group, thus confirming the mitochondrial depolarization activity of NCTD and 2-DG in combination. However, no significant observation was recorded in HepG2 cells (Fig. 8a, b).
Excessive intracellular ROS generation by toxicants can damage the several macromolecules like DNA, membrane lipids and enzymes. Furthermore, ROS generation can also induce membrane depolarization and permeability transition (Fatemi and Izadiyan 2011). Oxidative stress-induced DNA damage to cells may lead to decreased proliferation and survival rate. Thus, to investigate the mechanism behind apoptosis induction by NCTD and 2-DG in HepG2 and Hepa 1–6 cells, we have evaluated the intracellular ROS production in response to NCTD and 2-DG exposure. DCFDA fluorescence revealed that ROS level in combination-exposed HepG2 (Fig. 7a, b) and Hepa 1–6 (Fig. 7c, d) cells was significantly higher than the single treated and control groups. Thus, it can be assumed that enhanced oxidative stress by combination of NCTD and 2-DG in liver cancerous cells leads to nuclear condensation, apoptosis induction and membrane depolarization. Thus, enhanced ROS generation can be considered as key factor in cellular damage and cytotoxicity. The result is in similar context as reported by Shen et al., that NCTD leads to ROS accumulation in DU145 cells which activate the apoptotic pathway by inducing DNA damage and ATP depletion (Shen et al. 2013).
Conclusion
In conclusion, present study demonstrated that combined exposure of NCTD and 2-DG exhibit enhanced toxic effect in in vitro liver cancer model, HepG2 and Hepa 1–6 cells. Furthermore, enhanced intracellular ROS generation and nuclear condensation induces apoptosis and thus inhibit the cancer cell growth, survival and migration. Thus, the initial result suggest that preclinical studies will be required to validate the utilization of NCTD and 2-DG combined therapy in cancer treatment.
Acknowledgements
R. Singh gratefully acknowledges the funding from Liaocheng University, China (Fund No. 318051901). J. Li acknowledges the National Natural Science Foundation of China (81402512), Youth Innovative Science and Technology Program of Shandong Colleges and University (2019KJM012) and The Open Project of Shandong Collaborative Innovation Centre for Antibody Drugs, No.CIC-AD1817, CIC-AD1820, CIC AD1825. Q. Zeng would like to acknowledge the Shandong Provincial Undergraduate Training Program for Innovation and Entrepreneurship (S201910447048).
Compliance with ethical standards
Conflict of interest
The authors declare no conflict of interest.
References
- Andringa KK, Coleman MC, Aykin-Burns N, Hitchler MJ, Walsh SA, Domann FE, Spitz DR. Inhibition of glutamate cysteine ligase activity sensitizes human breast cancer cells to the toxicity of 2-deoxy-d-glucose. Can Res. 2006;66(3):1605–1610. doi: 10.1158/0008-5472.CAN-05-3462. [DOI] [PubMed] [Google Scholar]
- Averill-Bates DA, Przybytkowski E. The role of glucose in cellular defences against cytotoxicity of hydrogen peroxide in Chinese hamster ovary cells. Arch Biochem Biophys. 1994;312(1):52–58. doi: 10.1006/abbi.1994.1279. [DOI] [PubMed] [Google Scholar]
- Bandugula VR, Prasad R. 2-Deoxy-d-glucose and ferulic acid modulates radiation response signaling in non-small cell lung cancer cells. Tumour Biol J Int Soc Oncodev Biol Med. 2013;34(1):251–259. doi: 10.1007/s13277-012-0545-6. [DOI] [PubMed] [Google Scholar]
- Bayat Mokhtari R, Homayouni TS, Baluch N, Morgatskaya E, Kumar S, Das B, Yeger H. Combination therapy in combating cancer. Oncotarget. 2017;8(23):38022–38043. doi: 10.18632/oncotarget.16723. [DOI] [PMC free article] [PubMed] [Google Scholar]
- Cho H, Lai TC, Tomoda K, Kwon GS. Polymeric micelles for multi-drug delivery in cancer. AAPS Pharm Sci Tech. 2015;16(1):10–20. doi: 10.1208/s12249-014-0251-3. [DOI] [PMC free article] [PubMed] [Google Scholar]
- Chou T-C, Talalay P. Quantitative analysis of dose-effect relationships: the combined effects of multiple drugs or enzyme inhibitors. Adv Enzyme Regul. 1984;22:27–55. doi: 10.1016/0065-2571(84)90007-4. [DOI] [PubMed] [Google Scholar]
- Chou TC. Theoretical basis, experimental design, and computerized simulation of synergism and antagonism in drug combination studies. Pharmacol Rev. 2006;58(3):621–681. doi: 10.1124/pr.58.3.10. [DOI] [PubMed] [Google Scholar]
- Fatemi MH, Izadiyan P. Cytotoxicity estimation of ionic liquids based on their effective structural features. Chemosphere. 2011;84(5):553–563. doi: 10.1016/j.chemosphere.2011.04.021. [DOI] [PubMed] [Google Scholar]
- Geis T, Doring C, Popp R, Grossmann N, Fleming I, Hansmann ML, Dehne N, Brune B. HIF-2alpha-dependent PAI-1 induction contributes to angiogenesis in hepatocellular carcinoma. Exp Cell Res. 2015;331(1):46–57. doi: 10.1016/j.yexcr.2014.11.018. [DOI] [PubMed] [Google Scholar]
- Giammarioli AM, Gambardella L, Barbati C, Pietraforte D, Tinari A, Alberton M, Gnessi L, Griffin RJ, Minetti M, Malorni W. Differential effects of the glycolysis inhibitor 2-deoxy-d-glucose on the activity of pro-apoptotic agents in metastatic melanoma cells, and induction of a cytoprotective autophagic response. Int J Cancer. 2012;131(4):E337–347. doi: 10.1002/ijc.26420. [DOI] [PubMed] [Google Scholar]
- Hong KO, Ahn CH, Yang IH, Han JM, Shin JA, Cho SD, Hong SD. Norcantharidin suppresses YD-15 cell invasion through inhibition of FAK/paxillin and F-actin reorganization. Molecules. 2019 doi: 10.3390/molecules24101928. [DOI] [PMC free article] [PubMed] [Google Scholar]
- Hu X, Zhao Y, Wei L, Zhu B, Song D, Wang J, Yu L, Wu J. CCDC178 promotes hepatocellular carcinoma metastasis through modulation of anoikis. Oncogene. 2017;36(28):4047–4059. doi: 10.1038/onc.2017.10. [DOI] [PubMed] [Google Scholar]
- Irani S. Distant metastasis from oral cancer: a review and molecular biologic aspects. J Int Soc Prev Community Dent. 2016;6(4):265–271. doi: 10.4103/2231-0762.186805. [DOI] [PMC free article] [PubMed] [Google Scholar]
- Jalota A, Kumar M, Das BC, Yadav AK, Chosdol K, Sinha S. Synergistic increase in efficacy of a combination of 2-deoxy-d-glucose and cisplatin in normoxia and hypoxia: switch from autophagy to apoptosis. Tumour Biol J Int Soc Oncodev Biol Med. 2016;37(9):12347–12358. doi: 10.1007/s13277-016-5089-8. [DOI] [PubMed] [Google Scholar]
- Jeong SY, Seol DW. The role of mitochondria in apoptosis. BMB Rep. 2008;41(1):11–22. doi: 10.5483/bmbrep.2008.41.1.011. [DOI] [PubMed] [Google Scholar]
- Kaushik N, Lee SJ, Choi TG, Baik KY, Uhm HS, Kim CH, Kaushik NK, Choi EH. Non-thermal plasma with 2-deoxy-d-glucose synergistically induces cell death by targeting glycolysis in blood cancer cells. Sci Rep. 2015;5:8726. doi: 10.1038/srep08726. [DOI] [PMC free article] [PubMed] [Google Scholar]
- Li KY, Shi CX, Huang JZ, Tang KL. Cisplatin plus norcantharidin alter the expression of TGF-beta1/Smads signaling pathway in hepatocellular carcinoma. Bratisl Lek Listy. 2017;118(2):85–88. doi: 10.4149/BLL_2017_018. [DOI] [PubMed] [Google Scholar]
- Li P, Yang S, Dou M, Chen Y, Zhang J, Zhao X. Synergic effects of artemisinin and resveratrol in cancer cells. J Cancer Res Clin Oncol. 2014;140(12):2065–2075. doi: 10.1007/s00432-014-1771-7. [DOI] [PMC free article] [PubMed] [Google Scholar]
- Liao HF, Su SL, Chen YJ, Chou CH, Kuo CD. Norcantharidin preferentially induces apoptosis in human leukemic Jurkat cells without affecting viability of normal blood mononuclear cells. Food Chem Toxicol Int J Publ Br Ind Biol Res Assoc. 2007;45(9):1678–1687. doi: 10.1016/j.fct.2007.03.003. [DOI] [PubMed] [Google Scholar]
- Lin CL, Chen CM, Lin CL, Cheng CW, Lee CH, Hsieh YH. Norcantharidin induces mitochondrial-dependent apoptosis through Mcl-1 inhibition in human prostate cancer cells. Biochim et Biophys Acta Mol Cell Res. 2017;18(10):1867–1876. doi: 10.1016/j.bbamcr.2017.07.015. [DOI] [PubMed] [Google Scholar]
- Liu D, Shi P, Yin X, Chen Z, Zhang X. Effect of norcantharidin on the human breast cancer Bcap-37 cells. Connect Tissue Res. 2012;53(6):508–512. doi: 10.3109/03008207.2012.694928. [DOI] [PubMed] [Google Scholar]
- Lucarelli G, Galleggiante V, Rutigliano M, Sanguedolce F, Cagiano S, Bufo P, Lastilla G, Maiorano E, Ribatti D, Giglio A, Serino G, Vavallo A, Bettocchi C, Selvaggi FP, Battaglia M, Ditonno P. Metabolomic profile of glycolysis and the pentose phosphate pathway identifies the central role of glucose-6-phosphate dehydrogenase in clear cell-renal cell carcinoma. Oncotarget. 2015;6(15):13371–13386. doi: 10.18632/oncotarget.3823. [DOI] [PMC free article] [PubMed] [Google Scholar]
- Maschek G, Savaraj N, Priebe W, Braunschweiger P, Hamilton K, Tidmarsh GF, De Young LR, Lampidis TJ. 2-deoxy-d-glucose increases the efficacy of adriamycin and paclitaxel in human osteosarcoma and non-small cell lung cancers in vivo. Can Res. 2004;64(1):31–34. doi: 10.1158/0008-5472.CAN-03-3294. [DOI] [PubMed] [Google Scholar]
- O'Neill S, Porter RK, McNamee N, Martinez VG, O'Driscoll L. 2-Deoxy-d-Glucose inhibits aggressive triple-negative breast cancer cells by targeting glycolysis and the cancer stem cell phenotype. Sci Rep. 2019;9(1):3788. doi: 10.1038/s41598-019-39789-9. [DOI] [PMC free article] [PubMed] [Google Scholar]
- Peng C, Li Z, Niu Z, Niu W, Xu Z, Gao H, Niu W, Wang J, He Z, Gao C, Lin P, Agrez M, Zhang Z, Niu J. Norcantharidin suppresses colon cancer cell epithelial-mesenchymal transition by inhibiting the alphavbeta6-ERK-Ets1 signaling pathway. Sci Rep. 2016;6:20500. doi: 10.1038/srep20500. [DOI] [PMC free article] [PubMed] [Google Scholar]
- Pritchard JR, Bruno PM, Gilbert LA, Capron KL, Lauffenburger DA, Hemann MT. Defining principles of combination drug mechanisms of action. Proc Natl Acad Sci USA. 2013;110(2):E170–179. doi: 10.1073/pnas.1210419110. [DOI] [PMC free article] [PubMed] [Google Scholar]
- Shafaee A, Pirayesh Islamian J, Zarei D, Mohammadi M, Nejati-Koshki K, Farajollahi A, Aghamiri SMR, Rahmati Yamchi M, Baradaran B, Asghari Jafarabadi M. Induction of apoptosis by a combination of 2-deoxyglucose and metformin in esophageal squamous cell carcinoma by targeting cancer cell metabolism. Iran J Med Sci. 2019;44(2):99–107. [PMC free article] [PubMed] [Google Scholar]
- Sharma PK, Bhardwaj R, Dwarakanath BS, Varshney R. Metabolic oxidative stress induced by a combination of 2-DG and 6-AN enhances radiation damage selectively in malignant cells via non-coordinated expression of antioxidant enzymes. Cancer Lett. 2010;295(2):154–166. doi: 10.1016/j.canlet.2010.02.021. [DOI] [PubMed] [Google Scholar]
- Shen B, He PJ, Shao CL. Norcantharidin induced DU145 cell apoptosis through ROS-mediated mitochondrial dysfunction and energy depletion. PLoS ONE. 2013;8(12):e84610. doi: 10.1371/journal.pone.0084610. [DOI] [PMC free article] [PubMed] [Google Scholar]
- Shou LM, Zhang QY, Li W, Xie X, Chen K, Lian L, Li ZY, Gong FR, Dai KS, Mao YX, Tao M. Cantharidin and norcantharidin inhibit the ability of MCF-7 cells to adhere to platelets via protein kinase C pathway-dependent downregulation of alpha2 integrin. Oncol Rep. 2013;30(3):1059–1066. doi: 10.3892/or.2013.2601. [DOI] [PMC free article] [PubMed] [Google Scholar]
- Simons AL, Ahmad IM, Mattson DM, Dornfeld KJ, Spitz DR. 2-Deoxy-d-glucose combined with cisplatin enhances cytotoxicity via metabolic oxidative stress in human head and neck cancer cells. Can Res. 2007;67(7):3364–3370. doi: 10.1158/0008-5472.CAN-06-3717. [DOI] [PMC free article] [PubMed] [Google Scholar]
- Sun CY, Zhu Y, Li XF, Tang LP, Su ZQ, Wang XQ, Li CY, Yang HM, Zheng GJ, Feng B. Norcantharidin alone or in combination with crizotinib induces autophagic cell death in hepatocellular carcinoma by repressing c-Met-mTOR signaling. Oncotarget. 2017;8(70):114945–114955. doi: 10.18632/oncotarget.22935. [DOI] [PMC free article] [PubMed] [Google Scholar]
- Wang D, Yang C, Wang Z, Yang Y, Li D, Ding X, Xu W, Zheng Q. Norcantharidin combined with Coix seed oil synergistically induces apoptosis and inhibits hepatocellular carcinoma growth by downregulating regulatory T cells accumulation. Sci Rep. 2017;7(1):9373. doi: 10.1038/s41598-017-09668-2. [DOI] [PMC free article] [PubMed] [Google Scholar] [Retracted]
- Wang GS. Medical uses of mylabris in ancient China and recent studies. J Ethnopharmacol. 1989;26(2):147–162. doi: 10.1016/0378-8741(89)90062-7. [DOI] [PubMed] [Google Scholar]
- Warburg O. On the origin of cancer cells. Science. 1956;123(3191):309–314. doi: 10.1126/science.123.3191.309. [DOI] [PubMed] [Google Scholar]
- Weber G. Enzymology of cancer cells (first of two parts) N Engl J Med. 1977;296(9):486–492. doi: 10.1056/NEJM197703032960905. [DOI] [PubMed] [Google Scholar]
- Yang PY, Hu DN, Kao YH, Lin IC, Chou CY, Wu YC. Norcantharidin induces apoptosis in human prostate cancer cells through both intrinsic and extrinsic pathways. Pharmacol Rep PR. 2016;68(5):874–880. doi: 10.1016/j.pharep.2016.04.010. [DOI] [PubMed] [Google Scholar]
- Yeh CB, Hsieh MJ, Hsieh YH, Chien MH, Chiou HL, Yang SF. Antimetastatic effects of norcantharidin on hepatocellular carcinoma by transcriptional inhibition of MMP-9 through modulation of NF-kB activity. PLoS ONE. 2012;7(2):e31055. doi: 10.1371/journal.pone.0031055. [DOI] [PMC free article] [PubMed] [Google Scholar]
- Zhang D, Li J, Wang F, Hu J, Wang S, Sun Y. 2-Deoxy-d-glucose targeting of glucose metabolism in cancer cells as a potential therapy. Cancer Lett. 2014;355(2):176–183. doi: 10.1016/j.canlet.2014.09.003. [DOI] [PubMed] [Google Scholar]
- Zhang QY, Yue XQ, Jiang YP, Han T, Xin HL. FAM46C is critical for the anti-proliferation and pro-apoptotic effects of norcantharidin in hepatocellular carcinoma cells. Sci Rep. 2017;7(1):396. doi: 10.1038/s41598-017-00313-6. [DOI] [PMC free article] [PubMed] [Google Scholar]
- Zhang RX, Wong HL, Xue HY, Eoh JY, Wu XY. Nanomedicine of synergistic drug combinations for cancer therapy—strategies and perspectives. J Controlled Release Off J Controlled Release Soc. 2016;240:489–503. doi: 10.1016/j.jconrel.2016.06.012. [DOI] [PMC free article] [PubMed] [Google Scholar]
- Zhang XP, Luo LL, Liu YQ, Liu XS, An FY, Sun SB, Xie XR, Geng GQ, Chen XJ, Li ZD. Norcantharidin combined with diamminedichloroplatinum inhibits tumor growth and cancerometastasis of hepatic carcinoma in murine. J Cancer Res Ther. 2018;14(Supplement):S1035–S1040. doi: 10.4103/0973-1482.192852. [DOI] [PubMed] [Google Scholar]
- Zheng LC, Yang MD, Kuo CL, Lin CH, Fan MJ, Chou YC, Lu HF, Huang WW, Peng SF, Chung JG. Norcantharidin-induced apoptosis of AGS human gastric cancer cells through reactive oxygen species production, and caspase- and mitochondria-dependent signaling pathways. Anticancer Res. 2016;36(11):6031–6042. doi: 10.21873/anticanres.11192. [DOI] [PubMed] [Google Scholar]
- Zhu Y, Mi Y, Wang Z, Jia X, Jin Z. Norcantharidin inhibits viability and induces cell cycle arrest and apoptosis in osteosarcoma. Oncol Lett. 2019;17(1):456–461. doi: 10.3892/ol.2018.9615. [DOI] [PMC free article] [PubMed] [Google Scholar]


