

Abstract
Family formation in the United States has changed dramatically: marriage has become less common, nonmarital cohabitation has become more common, and racial and economic inequalities in these experiences have increased. We provide insights into recent U.S. trends by presenting cohort estimates for people born between 1970 and 1997, who began forming unions between 1985 and 2015. Using Panel Study of Income Dynamics data, we find that typical ages at marriage and union formation increased faster across these recent cohorts than across cohorts born between 1940 and 1969. As fewer people married at young ages, more cohabited, but the substitution was incomplete. We project steep declines in the probability of ever marrying, declines that are larger among Black people than White people. We provide novel information on the intergenerational nature of family inequalities by measuring parental income, wealth, education, and occupational prestige. Marriage declines are particularly steep among people from low-income backgrounds. Black people are overrepresented in this low-income group because of discrimination and opportunity denial. However, marriage declines are larger among Black people than White people across parental incomes. Further, most racial differences in marriage occur among people from similar socioeconomic backgrounds. Family inequalities increasingly reflect both economic inequalities and broader racial inequalities generated by racist structures; in turn, family inequalities may prolong these other inequalities across generations.
Keywords: Marriage, Cohabitation, Racial inequality, Income inequality
Introduction
Since the mid-twentieth century, U.S. men and women have delayed marriage to increasingly older ages and have become increasingly likely to cohabit with nonmarital romantic partners (Kennedy and Bumpass 2008; U.S. Census Bureau 2019). These changes in union formation (a term encompassing marriage and nonmarital cohabitation) were widespread but progressed unevenly across the population. Black people delayed marriage more than White people but increased cohabitation less (Manning 2013; Raley et al. 2015). People without college degrees both delayed marriage and increased cohabitation more than college graduates (Manning et al. 2014; Torr 2011). The concentration of marriage among advantaged demographic groups contributed to rising income inequality and its reproduction across generations (McLanahan and Percheski 2008).
We update past research on change and heterogeneity in union formation by tracing the experiences of cohorts born between 1970 and 1997, who began marrying and cohabiting between 1985 and 2015. Studies of earlier cohorts suggest that people born in the late 1960s were the first to see less than 90% ever marrying by their 40s (Ruggles 2016). Because our cohorts are still young, we do not observe their full relationship histories. Rather, we document how their union formation experiences are developing, tracking them prospectively as they age. In so doing, we make three contributions to the literature.
First, we distinguish the experiences of recent cohorts (born since 1970) from the experiences of earlier cohorts (born between 1940 and 1969). Marital delays began with the 1940s cohorts; the 1925–1939 cohorts married at similar ages to one another, which were slightly younger than the 1915–1924 cohorts’ typical ages at marriage (Sweeney 2016). We find that the marital delays pioneered by the 1940s cohorts compounded over time: every cohort built on the previous delays. Consequently, typical ages at marriage increased faster across recent cohorts (born since 1970) than across earlier cohorts. This accelerated change left many people without coresidential partners for long periods of their lives; nonmarital cohabitation did not rise enough to fully substitute for marriage.
Second, we shed new light on racial differences in marriage and union-formation trends. Projecting forward to age 40 using a suite of models, we find that both Black and White people’s chances of ever marrying decline markedly across cohorts but that Black people’s chances decline more than White people’s, thereby increasing the racial gap in marriage. Using data on individuals’ parental family incomes from the Panel Study of Income Dynamics (PSID), we show that marital declines are particularly large among people from low-income backgrounds—a group in which Black people are overrepresented because of historical and ongoing racial discrimination and opportunity denial. However, racial differences in cohort trends cannot be reduced to differences in economic backgrounds; even among people with relatively high-income parents, lifetime marriage chances decline more among Black people than White people. We add cohort projections and intergenerational analyses to prior work on period trends by education (Schneider et al. 2018).
Past research has linked rising class gaps in marriage to educational attainment (McLanahan 2004). Tracing these patterns back earlier in the life course, to parental income, allows us to understand the intersection of racial and economic inequalities. It is also useful because parental income is fixed prior to individuals’ family-formation choices, whereas individuals’ own educational attainment and earnings are at least partly endogenous to these choices (Thornton et al. 2007). Further, studying parental income provides new insights into the intergenerational persistence of economic inequalities. Single people tend to have lower incomes than partnered people, partly due to differences in their attributes and partly due to the simple reality that partners share resources and two people tend to earn more than one (Martin 2006). Consequently, if people from low-income backgrounds become increasingly overrepresented among single adults, then low incomes may increasingly persist from one generation to the next. Educational gradients in marriage and union formation provide only indirect insight into these intergenerational dynamics because parental income predicts educational attainment imperfectly (Bloome et al. 2018). Family trends may perpetuate economic inequalities across generations and between racial groups, although the latter would not disappear even if family structures converged completely across racial groups because of economic inequalities within family structures (Darity et al. 2018).
Our third contribution builds on our second, turning from racial differences in cohort trends to racial differences within cohorts. We quantify the extent to which within-cohort differences in marriage and union formation reflect differences in parental income as well as parental wealth, educational attainment, and occupational prestige. We heed the call to incorporate a variety of indicators used by stratification scholars to understand racial and family inequalities (Burton et al. 2010:454). Many explanations for racial gaps in marriage and union formation highlight economic disadvantage (Raley and Sweeney 2009). Yet we find that the large majority of racial differences in marriage and union formation occur among people from similar economic backgrounds. These results should push demographers to uncover new sources of inequality, including those related to racism and sexism that may affect people from all economic backgrounds (Horton 1999; Johnson and Loscocco 2015). Although the choices of whether and when to marry are very personal, they are made within racist social contexts that powerfully shape family outcomes regardless of socioeconomic advantages.
Change and Heterogeneity in Marriage and Union Formation
Cohort Trends
Some research on cohorts born before 1970 suggested that people might delay marriage to older ages without reducing their chances of ever marrying, as rising education and employment (particularly among women) led people to find compatible partners later in life (Oppenheimer 1988). More recent studies suggest that marital delays will correspond to forgone marriages (Martin et al. 2014; Ruggles 2016). We cannot expect marriage to be as ubiquitous as it was in the mid-twentieth century, given the major shifts in the factors promoting marriage (Coontz 2016). Women’s civil rights and economic opportunities expanded; jobs with steady wages for men became less common; effective fertility-control methods became more widely available; and stigmas against nonmarital sex, cohabitation, and childbearing weakened (Cherlin 2005; Coontz 2005). As these forces continue to reduce the imperative to marry, we hypothesize that marriage will be delayed to increasingly older ages across recent birth cohorts (and increasingly forgone altogether).
Indeed, marital delays may be progressing more rapidly across recent cohorts (born since 1970) than they progressed across prior birth cohorts, given that young marriage is no longer normative and people increasingly spend “emerging adulthood”—from their late teens to late 20s—testing different roles and relationships (Arnett 2000). Delays may be particularly extreme among people in their 20s because people often postpone marriage while in school and tertiary education has become more common (Schofer and Meyer 2005; Thornton et al. 2007). We provide novel cohort projections of marriage and union formation for people born in the 1970s, 1980s, and 1990s. We compare these cohorts with the 1940s, 1950s, and 1960s cohorts to illuminate how recent trends diverge from earlier patterns, studying 58 cohorts in total.
We expect changes in union formation (including marriage and nonmarital cohabitation) to be less extreme than changes in marriage alone because cohabitation has become common as both a precursor to marriage and, increasingly, a terminal relationship status (Kuo and Raley 2016; Smock 2000). Cohabitors benefit from the economies of scale associated with marriage but do not bear its legal costs or full social obligations (Cherlin 2004; Sassler 2004). People often choose to cohabit before they reach their subjective marriage thresholds, including financial and nonfinancial thresholds (e.g., in terms of relationship quality) (Edin and Kefalas 2005). Consequently, as marriage has been delayed to older ages across periods, cohabitation has not (Manning et al. 2014). However, period analyses of synthetic cohorts often understate the pace of change across real birth cohorts by assuming that prevailing age-specific rates will remain stable (Preston et al. 2000). We relax that assumption, using a cohort perspective to build on previous period analyses (e.g., Manning et al. 2014; Zeng et al. 2012). Because not all people cohabit and cohort change is likely quicker than period change, we expect cohort delays in union formation (albeit less drastic than marital delays). If our expectations are confirmed, the results should push family demographers to better understand the causes and consequences of prolonged singlehood. Researchers have extensively documented the rise of cohabitation in young adulthood, but we may misunderstand people’s union experiences if we assume that cohabitation has fully substituted for marriage at young ages. Indeed, almost 40% of people born in the early 1980s were mostly single through age 30 (Zhang and Ang 2020).
Heterogeneity Across Racial Groups and Economic Backgrounds
Racism has long shaped the narrative around family structure. Differences between Black and White Americans have been racialized to reinforce “hierarchies of power and privilege” (Burton et al. 2010:445), often by stigmatizing and decontextualizing the behavior of Black people. Marriage regulation has also long served to subordinate Black people (Williams 2019). Legal regulations include the refusal to recognize marriage among enslaved people and the imposition of anti-miscegenation laws. Social and economic regulations include postbellum marriage-promotion projects to “domesticate” freedpeople (Franke 1999:253) and transfer responsibilities for economic support from the government to male household heads, as well as more recent social policies that promote marriage as a means toward self-sufficiency (Davis 1999; Eichner 2010; Stanley 1998). In light of these facts, it is important for demographers to document the variability of racial differences in marriage across contexts, which reflect different structures of opportunities and constraints.
Racial differences in marriage have changed dramatically over time. Indeed, they reversed in the mid-twentieth century. Between 1870–1950, Black Americans married younger and more frequently than Whites (Elliott et al. 2012; Fitch and Ruggles 2000). Then, both Black and White people began delaying marriage to older ages (Tucker and Mitchell-Kernan 1996). Yet Black people delayed more; they began marrying later in life than Whites and forgoing marriage more often (Bennett et al. 1989; Mare and Winship 1991; Waite 1995). Today, racial differences are larger in terms of marriage than union formation; yet union-formation differences are nontrivial, and White people recently became more likely to cohabit than Black people, reversing patterns from the 1980s–1990s (Addo 2012; Manning 2013; Raley 1996, 2000). This reversal suggests that racial differences in recent cohort trends may be similar for marriage and union formation, given that racial gaps in cohabitation now resemble racial gaps in marriage in direction (with Whites more likely to cohabit) if not in magnitude.
The forces driving Black people to postpone marriage and union formation more than White people in previous years may continue to generate racial divergence across recent birth cohorts. The most common explanation for larger declines among Black people highlights the decreasing number of “marriageable (i.e., economically stable)” young Black men (Wilson 1987:91), whose employment rates diverged from young White men’s. Many studies confirm that men’s financial difficulties (including unemployment, unstable work histories, and low wages) predict late marriage (Gibson-Davis et al. 2005; Sassler and Goldscheider 2004; Xie et al. 2003) and that differences in men’s economic circumstances help explain racial differences in marriage (Cohen and Pepin 2018; Lichter et al. 1992; Lichter et al. 2019; Schneider et al. 2018; South and Lloyd 1992). Racial divergence in marriage also could reflect larger declines in male-female wage ratios or sharper increases in women’s educational advantages among Black people than among White people, which may have reduced Black women’s incentives to marry more than White women’s (Sweeney 2002). Further, larger change among Black men than among White men in incarceration, excess mortality, and interracial marriage also may have constrained marriage markets more for Black women than for White women (Crowder and Tolnay 2000; Lopoo and Western 2005). We thus expect that the chance of ever marrying will decline more across recent birth cohorts for Black people than for White people. (However, in the long term, White people may catch up to the low marriage rates pioneered by Black people; see the online appendix for details.)
Notably, many of these explanations focus on economic disadvantages, particularly long-standing economic disadvantages (which may heighten people’s risks of educational exclusion, unstable work, incarceration, and early mortality). Long histories of racial discrimination and opportunity denial generated large inequalities in the resources available to Black and White children; in turn, these inequalities in economic backgrounds have played important roles in reproducing racial inequalities across multiple aspects of social life (Bloome 2014; Hamilton and Darity 2010; Johnson 2018; Killewald and Bryan 2018; Wilson 1978, 1987). To what extent do racial differences in marriage and union formation reflect racial differences in socioeconomic backgrounds?
Scholars and policymakers working from a variety of theoretical perspectives—from patriarchal perspectives on the economic basis of marriage to intersectional perspectives on the interlocking nature of multiple inequalities—have long highlighted the importance of socioeconomic backgrounds in shaping family life (Few-Demo and Allen 2020). However, if individuals’ personal backgrounds do little to explain racial inequalities in marriage and union formation, then researchers must consider how racist systems play a broader role in generating family inequalities (Few 2007; James and McGeorge 2019).
We use parental income, wealth, educational attainment, and occupational prestige to examine marriage and union formation among people from similar socioeconomic backgrounds. We take a comprehensive approach toward measuring socioeconomic backgrounds; many types of young-adult resources shape marriage chances, including the assets and debts that together generate wealth (Addo 2014; Schneider 2011), and the same is likely true for parental resources. Such an approach also accounts for the varying magnitudes of racial inequalities across resources; wealth inequalities are particularly large partly because they reflect the cumulative nature of discrimination against Black families (Darity et al. 2018).
Classic studies of racial differences in family life written before the mid-1960s highlighted Black-White similarities within socioeconomic classes as well as class variations (Drake and Cayton 1945/2015; Du Bois 1899/1996; Frazier 1939). Publication of the Moynihan report shifted focus to the family patterns of economically disadvantaged Black people (Furstenberg 2007). However, the focus may have shifted too far, to the neglect of both racial inequalities among people from advantaged backgrounds and racial similarities within economic backgrounds.
We hypothesize, first, that both Black and White people from low-income backgrounds are experiencing steeper declines in marriage and union formation than their peers from high-income backgrounds and, second, that racial differences cannot be reduced to differences in socioeconomic backgrounds. To the first point, both Black and White women saw the marriage-education association reverse between cohorts born in the 1950s and 1960s, as less-educated women became less likely to marry than their more-educated peers (Goldstein and Kenney 2001). Yet, to the second point, racial gaps in marriage rose in all education groups (Raley et al. 2015). We expect racial differences in marriage and union formation among people with similar socioeconomic backgrounds.
The size of these differences will help reveal how family patterns contribute to the joint reproduction of racial and economic inequalities across generations. Because single people tend to have lower incomes than married and cohabiting people, intergenerational income persistence should increase when single people are increasingly drawn from low-income backgrounds (McLanahan and Percheski 2008). Scholars have also argued that changes in marriage and union formation reflect changes in the opportunity structure of society (Cherlin 2014). Thus, by documenting divergence in marriage and union formation across people from different socioeconomic backgrounds, we provide early insight into the intergenerational reproduction of inequalities. Prior work has provided only indirect insight into the (potentially strengthening) tie between parental economic inequality and adult family inequality by documenting that union declines have been concentrated among people without college degrees (Kuo and Raley 2016; Torr 2011). Yet education is only partially predicted by economic background, and parental characteristics independently predict family formation (Axinn and Thornton 1992; South 2001; Ziol-Guest and Lee 2016). Moreover, individuals’ decisions about how much education to attain and when to start a family may be co-determined, whereas parental income, wealth, education, and occupational prestige are fixed before family decisions are made. Therefore, considering the extent to which (racial differences in) marriage and union formation reflect (racial differences in) parental socioeconomic resources should provide new, early insights into the role of family change in the intergenerational persistence of (racial and) economic inequalities. Of course, inequalities exist within all family structures; family formation cannot fully explain the persistence of racial inequalities in economic resources (even in a proximate sense, recognizing that family patterns reflect earlier economic and racial inequalities) (Darity et al. 2018). But if marriage becomes increasingly concentrated among White people, it is likely to exacerbate inequalities.
In sum, we expect that young people will continue to delay marriage and union formation to increasingly older ages across recent birth cohorts and that the speed of this age increase will be faster in recent cohorts (born since 1970) than in cohorts born between 1940 and 1969. We expect smaller changes in union formation than marriage as people substitute cohabitations for young marriages. We expect that delays will be particularly extreme among people from low-income backgrounds and that, partially as a consequence of their overrepresentation among these low-income people, Black people’s probabilities of ever marrying will decline more than White people’s. Such unequal declines will contribute, in a proximate sense,1 to the intergenerational persistence of income inequalities. However, we also anticipate that that racial differences will appear across socioeconomic backgrounds, even after accounting for multiple measures of parental resources. The extent to which this expectation is fulfilled will determine how much work must be done to understand the causes and consequences of family inequalities between racial groups within economic backgrounds.
Data and Methods
We use Panel Study of Income Dynamics (PSID) data to study recent trends in marriage and union formation and their variation across racial groups and socioeconomic backgrounds. These data are ideal for our study because they include information on parental socioeconomic characteristics (including income, wealth, education, and occupation) for a large number of birth cohorts that are followed prospectively, facilitating our intergenerational, cohort perspective. The PSID began data collection in 1968 with about 5,000 families, including a nationally representative sample and an oversample of low-income families. Combining these samples ensures substantial representation of non-Hispanic Black people, whom we analyze together with non-Hispanic White people.2 Individuals from the sampled families and their descendants were interviewed annually through 1997 and biennially thereafter. We employ data from survey years 1970–2015.
We study people born between 1970 and 1997 for substantive and measurement reasons. Substantively, previous research provides the least information about these cohorts, which are the most recent to decide whether and when to form unions; the 1970 and 1997 birth cohorts turned age 15 and entered the risk set for union formation in 1985 and 2012, respectively. Because of the youth of many of these cohorts in 2015, many relationship histories remain incomplete; the 1990 cohort is the last to provide information through age 25. We study the speed with which people enter unions and project how their family formation will develop at older ages. From a measurement perspective, beginning with the 1970 cohort is ideal because their parental characteristics are observed from birth and because their entire marital history is recorded via the PSID’s marriage history calendar, which began in 1985. However, we supplement our analyses of the 1970–1997 cohorts with analyses of the 1940–1969 cohorts to assess whether recent trends differ from earlier trends.
To capture the date of first marriage (if any), we use the marriage history calendar. To capture the date of first union, we construct the date of entrance into cohabitation (if any) and take the minimum of the first marriage and first cohabitation dates as the union formation date. The PSID lacks a cohabitation history calendar to mirror the marriage history calendar. We construct cohabitation dates by combining several sources of information, including information on marital status and changes in marital status from annual questions and the marriage history calendar, information on relationship status and changes in relationship status from annual questions about household residents and their interrelationships, and information on residential changes from annual questions about whether and when members of existing PSID households split to form new households as well as whether and when people moved in and out of existing PSID households. Cohabitation is notoriously hard to measure, with quantitative estimates varying widely across surveys with different measurement strategies and likely understating cohabitation’s prevalence (Manning and Smock 2005; Manning et al. 2019a). Our data may miss short cohabitations that both began and ended between survey waves.3 Consequently, we do not study marriage and cohabitation as competing risks. Rather, we study marriage and union formation (including marriage and nonmarital cohabitation) separately. Differences between the patterns in these two outcomes indicate how recent cohorts of men and women have used marriage and nonmarital cohabitation differently. Our sample contains 8,608 individuals, including 8,527 with nonmissing parental income; observations are at the person-month level.
One of our goals is to map recent trends in marriage and union formation by racial group and economic background. We first capture economic background with parental total family income, which we code into terciles (bottom, middle, or top third of the income distribution in the respondent’s birth cohort) after averaging between respondent ages 0–17 and adjusting for several factors (for need via the square root of family size, for top-coding via imputation from a Pareto distribution in the top 2% tail, and for inflation using the personal consumption expenditures index). We examined several parental-income specifications and found that comparing people from the top tercile versus people from the bottom two terciles provided the best description of differential trends by parental income. When studying within-cohort differences (rather than cohort trends), we further disaggregate into deciles. We also consider continuous income and additional measures of socioeconomic background, including parental wealth, parental occupational prestige, and parental educational attainment.4 Because our goal is to provide descriptions of population patterns, we do not include additional predictors beyond birth cohort, age, gender, racial group, and socioeconomic background.
Crucially, we include a variety of interactions. In all models, we include a quartic in age (and all lower-order age terms), a linear cohort indicator, and an interaction between linear age and linear cohort. We find that additional polynomials in cohort and age-by-cohort interactions do not improve model fit for our focal cohorts, born in 1970–1997. However, when we examine trends across cohorts born in 1940–1997 to assess whether recent trends differ from earlier trends, we include a spline for cohort with three knots, at 1955, 1969, and 1985. This spline allows the cohort trends to vary smoothly but potentially shift at 1955, halfway through our earlier cohorts (born in 1940–1969); at 1969, between our earlier cohorts and our recent cohorts (born in 1970–1997); and, finally, at 1985, about halfway through our recent cohorts. We also always include an indicator for male gender and interactions between gender and linear age, quadratic age, and linear cohort. In our most saturated models, we also include main effects for racial group, R, and parental income tercile, I, and interactions with these indicators, R × male, R × linear cohort, I × male, I × linear cohort, I × linear age, I × quadratic age, R × I, and R × I × linear cohort. We find that interactions between racial group and age do not improve model fit. We also report results from models stratified by parental income.
Given the uncertainty inherent in projection exercises, we analyze the data using three classes of models: (1) discrete-time event-history models, which have been widely applied to study recent union patterns (e.g., Kuo and Raley 2016; Musick and Michelmore 2018; Sassler et al. 2018); (2) Coale-McNeil models, which were developed to forecast marriage patterns (Coale and McNeil 1972) and which can be expressed as generalized log gamma regressions to incorporate covariates (Kaneko 2003; Rodriguez and Trussell 1980); and (3) life-table models, which do not incorporate covariates but can assess the lifetime implications of period age-specific rates, assuming that they do not change across cohorts (e.g., Rodgers and Thornton 1985; Schoen and Standish 2001).
In discrete-time event-history models, the unit of analysis is the person-month. Respondents enter the risk set for each family transition (marriage and union formation) in January of the year they turn age 15 and are followed until they make the transition or are censored.5 Censoring occurs when data collection ends before respondents enter a union, when they die before entering a union, and when they attrit from the survey before entering a union.6 We use survey weights designed to adjust for differential sampling and attrition probabilities. We model the monthly hazard of transitioning into a union using logistic regression, where the hazard for person i in month t is defined as the conditional probability of transitioning within that month, given that they have not previously transitioned. Denote this conditional probability as pit, where pit = P(Yit = 1|Xit), Yit is 1 if individual i experiences a first union in month t and 0 otherwise, and Xit is a vector of covariates.7 The hazard model is
| (1) |
where Xj, it is the value of the jth covariate (including an intercept) at time t for person i. The probability of marriage and union formation is very small within each month; thus, estimates from discrete-time models are extremely similar to those obtained using comparable continuous-time models (Petersen 1991, 1992; Yamaguchi 1987).
We use this discrete-time event-history model to describe cohort trends in marriage and union formation across demographic groups. We focus on the cumulative probability of ever marrying/forming a union by age 40, but we also calculate cumulative probabilities across all ages to find the ages by which one-quarter and one-half of people have done so. Following standard techniques, we calculate the cumulative probability of ever marrying/forming a union by age t as
| (2) |
where Sit is the cumulative probability of surviving to month t without ever marrying/forming a union, and is the cumulative hazard (a discrete-time version of the integrated hazard, where a = 0 during the first month at risk). Nonparametric Kaplan-Meier estimates correspond very well to our model-based estimates (Fig. 1).
Fig. 1.
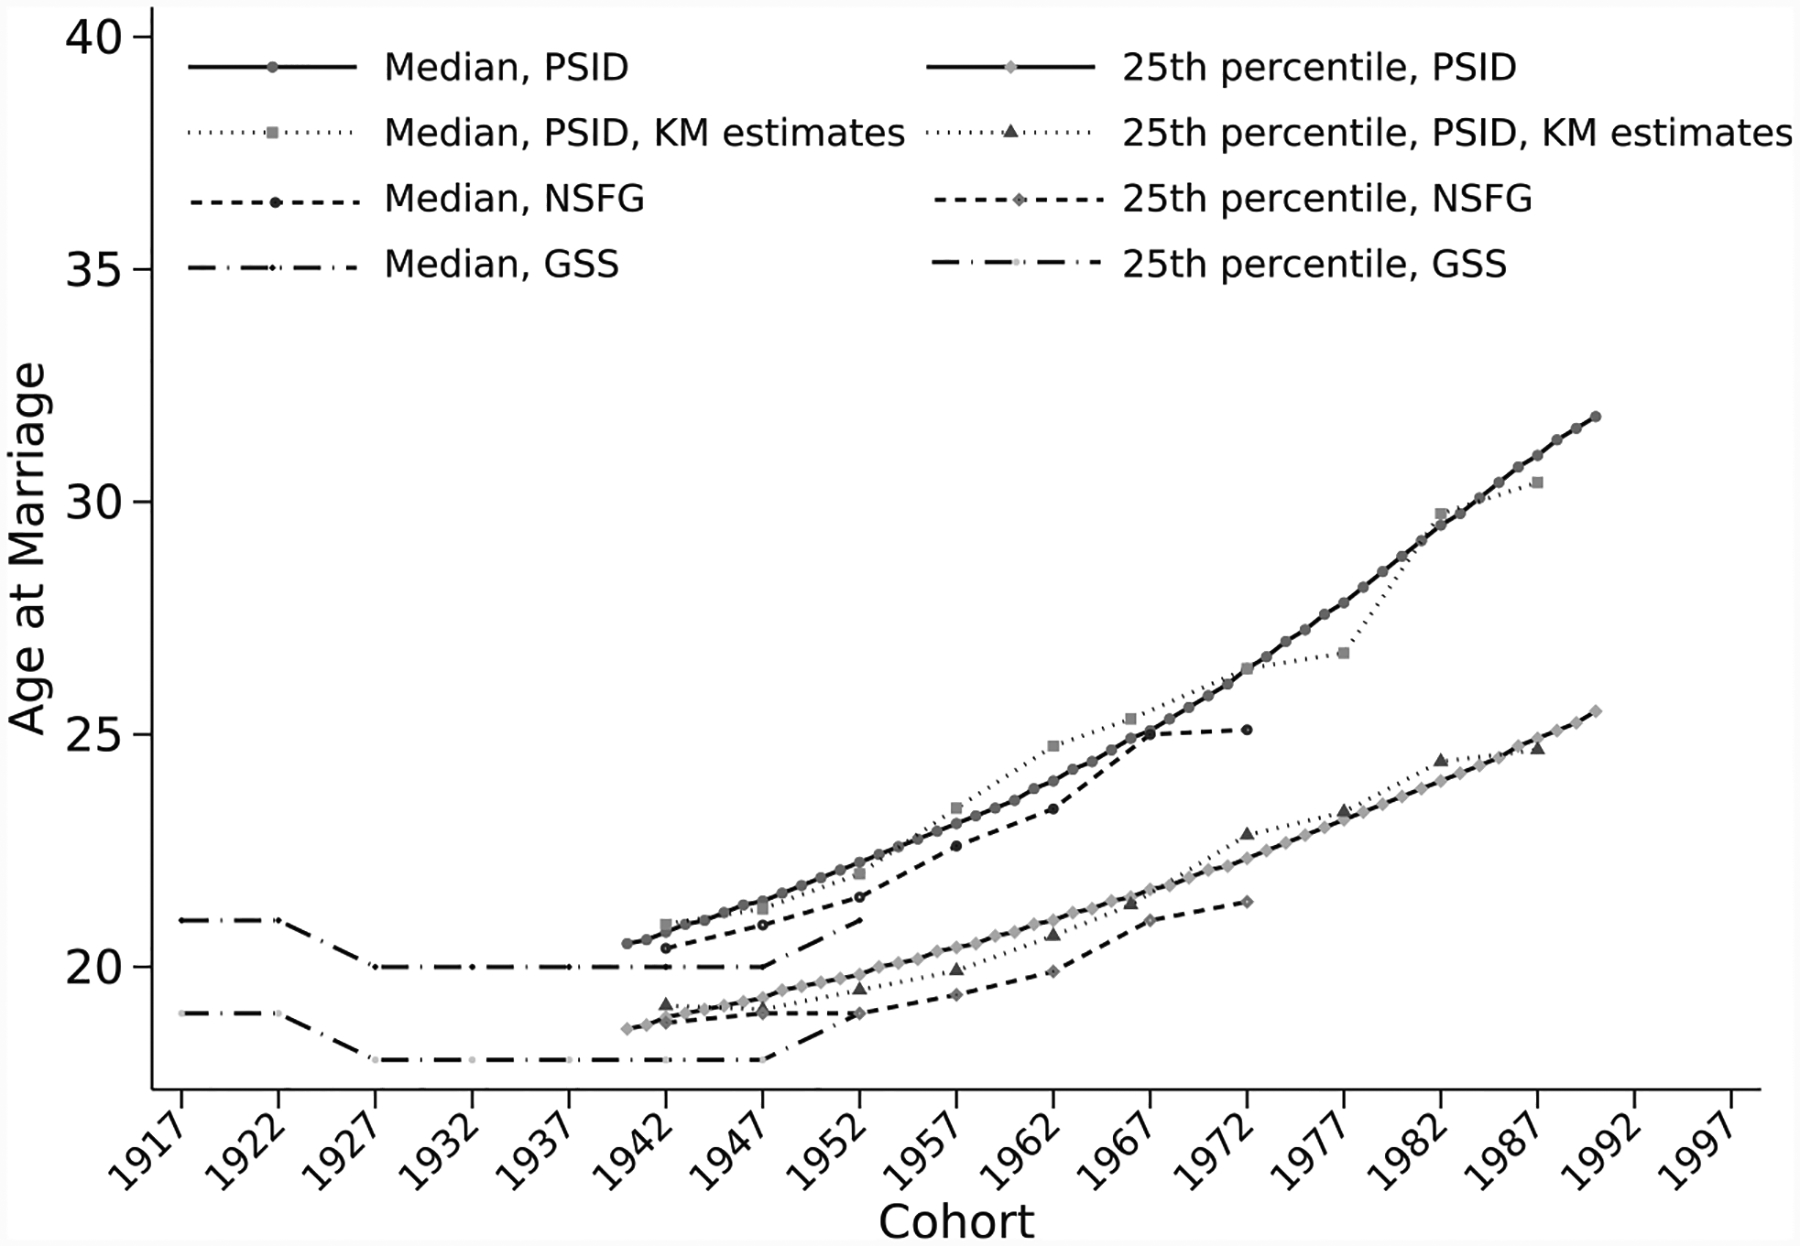
Cohort trends in the ages by which 25% and 50% of women have married. Note: PSID, GSS, and NSFG data. PSID series include model-based estimates for single-year birth cohorts and nonparametric Kaplan-Meier (KM) estimates for five-year birth cohorts. GSS and NSFG series for five-year birth cohorts tabulated by Sweeney (2016:277). Five-year cohort point estimates placed at the midpoint of the range (e.g., 1917 for cohorts born in 1915–1919).
We supplement our discrete-time event-history analyses with projections from Coale-McNeil and life-table models. We estimate Coale-McNeil models using generalized log gamma regressions, following Rodriguez and Trussell (1980) and Kaneko (2003). The probability density function for age at marriage t is
| (3) |
We write μ and σ as functions of covariates, incorporating the same covariates as in our discrete-time event-history model. We use Eq. (3) to estimate age-specific hazards, pit, and Eq. (2) to calculate cumulative probabilities of ever marrying by age 40 for each demographic group and cohort. We compare our parametric results with results from nonparametric life tables. We create life tables for each demographic group and cohort, pooling three years of period data to calculate age-specific monthly hazards: survey years 1985–1988, 1995–1998, 2005–2008, and 2012–2015 for the 1970, 1980, 1990, and 1997 cohorts, respectively. These years capture the cohorts at ages 15–18, when they were just entering the marriage risk set. We then expose each cohort to these age-specific monthly hazards under the assumption that they will follow the same age schedule as earlier cohorts. For example, for the 1970 cohort, we assume that their monthly marriage hazards at age 40 equal the hazards observed among 40-year-olds in 1985–1988, who were born in 1945–1948. We again use Eq. (2) to calculate cumulative probabilities of marrying by age 40. Comparing our projections across life-table, Coale-McNeil, and discrete-time event-history models allows us to capture more uncertainty than any single model permits.
To quantify the extent to which racial differences in marriage reflect differences in economic backgrounds, we first employ a simple decomposition. We separate the total racial difference in the projected share of people ever marrying by age 40 (within each cohort and gender) into contributions from racial differences in (1) parental income and (2) marriage among people from the same parental-income background.
| (4) |
where Δ is the racial difference in marriage, y indicates birth-cohort year, g indicates gender (male or female), w and b indicate White and Black people, and i indicates income group (parental tercile or decile). The first term in the sum captures (1) income compositional differences between racial groups ( is the share of people of racial group r, gender g, and cohort y in income group i) weighted by the simple average marriage probability . The second term captures (2) marriage differences between racial groups within income groups ( is the probability that a person of racial group r, gender g, cohort y, and income group i ever marries by age 40) weighted by the simple average income composition .
To further probe how much of the racial difference in marriage reflects differences in economic backgrounds, we explore a second decomposition that accounts for differences in not only parental income but also parental wealth, education, and occupational prestige. We extend the logic of Blinder-Oaxaca decompositions to our output from nonlinear models, following Sinning et al. (2008).
| (5) |
where is the racial difference in the probability of marrying by age 40 among people of gender g using reference coefficients from White people, w.
The first expression in parentheses captures the amount of this racial difference in marriage that is associated with racial differences in parental socioeconomic characteristics, as captured in X (holding constant the association between those characteristics and marriage at the levels observed among White men/women, βg,w).8 The second expression in parentheses captures the amount of the racial difference in marriage related to racial differences in the associations between characteristics and marriage, called the returns to these characteristics (holding constant the distribution of those characteristics). The coefficients are estimated from our discrete-time event-history model and the expectations are taken over the respondents, each of whom receives a projected probability of marrying by age 40 based on their characteristics and the relevant coefficients, the coefficients of either their own racial group or the other racial group, depending on the part of the decomposition being calculated in Eq. (5). To examine the sensitivity of our results to the reference group, we also examine the decomposition
| (6) |
in which we hold constant the returns at the levels observed among Black men/women in the first expression in parentheses, βg,b. Because many of our quantities of interest are nonlinear combinations of parameters, we create confidence intervals using a nonparametric bootstrap percentile method using 1,000 bootstrapped samples.
Results
Cohort Trends in Marriage and Union Formation
Across recent cohorts (born between the 1970s and 1990s), people have delayed marriage to increasingly older ages, extending previously documented delays across cohorts born earlier in the twentieth century. Women’s median age at marriage fell between cohorts born in the mid-1910s and mid-1930s, according to General Social Survey (GSS) data. It then rose almost five years between the cohorts born in the early 1940s and the cohorts born almost 30 years later, in the late 1960s, according to both National Survey of Family Growth (NSFG) and PSID data (Fig. 1).9 The upward trend in typical marriage ages has accelerated in more recent cohorts. After taking 30 cohorts (1940–1969) to rise 4.8 years, it took only 15 cohorts (1970–1984) for the median age to rise an additional 4.3 years. Table A1 in the online appendix confirms that this acceleration is evident after accounting for statistical uncertainty and that it reflects the accumulation of declines in the monthly risk of first marriage—which fell across each cohort, from increasingly low levels—rather than increasingly fast declines in this risk (see online appendix).
Marriage has been delayed at both younger and older ages (Fig. 1). One-quarter of women born in 1970–1974 had married by age 22.8; women born in 1985–1989 did not reach that landmark until age 24.7. This increase of 1.9 years is smaller than the 4.3-year increase in the median age; not only was marriage entry delayed across cohorts, but it also became more variable. Men also delayed marriage (Fig. 2, panel a). The age by which one-quarter of men had married rose from 23.6 to 26.8 between the 1970–1974 and 1985–1989 cohorts. We present, in light gray, the marital delays projected for people born between 1990–1997. Because these people are still quite young—aged 18–25 in 2015, the last year observed—less than 25% have married. We project that among women born in 1997, one-quarter will marry by age 27.3, and one-half will marry by age 37.4.
Fig. 2.

Cohort trends in the ages by which 25% and 50% of men and women have married (panel a) or formed a union (including nonmarital cohabitation; panel b). Note: Light-gray lines indicate model projections for cohorts that have not yet reached 25% or 50% ever marrying or forming a union. Data are from the PSID.
Nonmarital cohabitation has not completely substituted for marriage at young ages (Fig. 2, panel b). While women’s median age at marriage increased 4.3 years between the 1970–1974 and 1985–1989 cohorts, their median age at union formation rose about 2.1 years. Men exhibit similar trends. People are partially substituting cohabitations for marriage at young ages, but they are also delaying union formation altogether.
The risks of first marrying decreased most rapidly around ages 24 and 26 among women and men, respectively (Fig. 3). The average decline in the monthly first marriage hazard associated with being born one year later (e.g., being born in 1971 vs. 1970) was about three times larger for 24-year-old women than for 19-year-old women (with declines of about .03 vs. .01 percentage points). Cohort changes were much larger in the 20s than in the teens, 30s, or 40s (although we estimate the changes less precisely at older ages than younger ages because we observe fewer of our target cohorts at older ages). Moreover, cohort changes were substantial. A decline of .03 percentage points might seem small, but it suggests an average annual change of about 4% when compared with the average monthly first-marriage hazard among 24-year-old women of .69 (i.e., never-married 24-year-old women had, on average, a .69% chance of marrying in a given month).10 The age patterns in cohort change are similar for men and women and for marriage and union formation.11 Incorporating these clear age-by-cohort interactions has important implications for our understanding of recent family-formation trends. Allowing cohort change to progress differently across age leads us to project that 71.8% (63.0%) of White women (men) born in 1990 will marry by age 40, compared with 79.9% (79.6%) using a synthetic-cohort approach (Table 1).12
Fig. 3.

Average change in the monthly hazard of first marrying (panel a) or first forming a union (including nonmarital cohabitation; panel b) associated with being born later (i.e., average marginal effect of cohort), by age and gender. Note: Point estimates in black surrounded by 95% confidence intervals in gray. Data are from the PSID.
Table 1.
Projected percentage of people marrying by age 40, by gender, racial group, and birth cohort
| Discrete-Time Event-History Model | Coale-McNeil Generalized Gamma Model | Nonparametric Life-Table Model | Martin et al. (2014) Estimates | |
|---|---|---|---|---|
| A. Women | ||||
| White | ||||
| 1970 cohort | 89.2 (83.0, 94.1) |
86.5 (84.7, 88.0) |
90.2 (86.3, 93.5) |
87.1 |
| 1980 cohort | 81.2 (75.2, 86.7) |
80.7 (78.0, 83.0) |
87.6 (81.3, 92.9) |
81.9 |
| 1990 cohort | 71.8 (61.7, 82.0) |
72.9 (69.0, 76.3) |
79.9 (73.6, 86.2) |
77.3 |
| 1997 cohort | 65.0 (50.8, 80.4) |
66.3 (61.6, 70.6) |
79.4 (71.5, 86.4) |
|
| Black | ||||
| 1970 cohort | 59.8 (48.0, 72.0) |
59.5 (56.0, 63.0) |
51.9 (44.4, 59.1) |
59.6 |
| 1980 cohort | 43.0 (36.0, 51.0) |
49.0 (44.2, 54.0) |
52.1 (44.3, 60.0) |
48.4 |
| 1990 cohort | 29.6 (19.6, 43.5) |
37.4 (32.1, 43.5) |
49.8 (42.4, 57.1) |
42.3 |
| 1997 cohort | 22.5 (11.8, 40.7) |
29.1 (23.8, 35.6) |
45.2 (37.7, 52.5) |
|
| B. Men | ||||
| White | ||||
| 1970 cohort | 85.5 (78.9, 91.0) |
83.9 (82.0, 85.6) |
81.2 (75.0, 86.4) |
80.2 |
| 1980 cohort | 74.8 (68.3, 81.5) |
76.1 (73.0, 78.9) |
81.9 (75.5, 87.3) |
74.5 |
| 1990 cohort | 63.0 (52.0, 75.4) |
67.0 (62.8, 71.0) |
79.6 (72.2, 85.9) |
70.3 |
| 1997 cohort | 54.9 (40.4, 72.6) |
60.1 (55.5, 64.8) |
70.1 (61.5, 77.6) |
|
| Black | ||||
| 1970 cohort | 65.3 (51.3, 78.9) |
52.6 (48.8, 56.7) |
60.9 (52.6, 69.4) |
60.4 |
| 1980 cohort | 46.4 (38.3, 55.7) |
41.5 (36.9, 47.1) |
47.3 (38.0, 56.3) |
50.8 |
| 1990 cohort | 31.0 (20.5, 45.7) |
31.1 (26.4, 37.1) |
50.0 (39.3, 60.5) |
46.4 |
| 1997 cohort | 22.8 (12.0, 41.6) |
24.6 (20.1, 30.5) |
45.4 (36.9, 53.9) |
Notes: Bootstrapped 95% confidence intervals are included in parentheses below point estimates. Columns 1–3 contain estimates from PSID data. Column 4 contains estimates from American Community Survey data reported by Martin et al. (2014:11).
In short, delays in marriage first evident among cohorts born in the 1940s continue to grow across cohorts born in 1970–1997. Union formation is also being delayed across these cohorts but less so than marriage because many young people substitute marriage with nonmarital cohabitation. Delays are most rapid among people in their 20s.
Heterogeneity by Racial Group and Socioeconomic Background
People from many different demographic groups are delaying marriage and, to a lesser extent, nonmarital cohabitation. However, the magnitude and speed of cohort change differs substantially across people from different racial groups and socioeconomic backgrounds. For parsimony, we discuss racial and socioeconomic differences in marriage levels and trends only. Figs. A2, A4–A7, and A9 as well as Tables A2, A4, and A5 in the online appendix contain union-formation results.
In studying group differences, we focus on the projected shares of people ever married by age 40 because changes in these shares may be especially consequential for the persistence of inequalities across generations and between racial groups (Goldstein and Kenney 2001; McLanahan and Percheski 2008). Further, as Ruggles (2016:6) noted, “people do not have unlimited opportunities to marry…. Empirically, it has been unusual for a cohort to forgo marriage early on but then catch up in later life.” Across all cohorts born between 1825 and 1965, the share ever married by age 20–24 almost perfectly predicts the share never married by age 40–44, with one exception: only the cohort reaching age 20–24 during World War II evidenced a higher level of marriage at age 40–44 than expected based on their early delays (Ruggles 2016). Projections naturally entail uncertainty, so we compare estimates from several different models.
The first two columns of Table 1 report shares of people ever married by age 40 by cohort, gender, and racial group, as projected from models relying on two sets of parametric assumptions: discrete-time event-history models and Coale-McNeil models. The third column reports projections from nonparametric life-table calculations, which rely on synthetic cohort assumptions. The fourth column contains projections from Martin et al. (2014) using a different data source, the American Community Survey (ACS), and methods that, like our life-table methods, expose young people to age-specific rates assuming that they will follow the same marriage schedule as earlier cohorts (our parametric models, in contrast, allow age-by-cohort interactions). Interestingly, the two parametric models generate very similar projections (despite their very different forms, as discussed earlier), and the two nonparametric methods also generate very similar projections to one another (despite their different data sources). However, the parametric and nonparametric results diverge for cohorts born in the 1990s.
For the 1970 cohort, all models produce fairly similar results, which reveal striking racial inequalities in marriage. About 87% to 90% of White women and 80% to 86% of White men in the 1970 cohort were projected to have ever married by age 40 (depending on the model) versus 52% to 60% of Black women and 53% to 65% of Black men.13 In the earliest of our recent cohorts, then, Black people were about 20–30 percentage points less likely than White people to have married by age 40. We project that these racial gaps will grow across cohorts, although the extent of the growth varies across models. The nonparametric models project that between the 1970 and 1990 cohorts, the Black-White difference in the share of people ever married by age 40 will grow about 4–9 percentage points (depending on the model and gender);14 the parametric models project that it will grow 5–13 percentage points. As more people decline to marry, the typical ages at marriage will increase across cohorts, and they will diverge across racial groups, with Black people marrying at increasing older ages than White people (online appendix, Fig. A1). The extent of Black-White divergence varies across models (Table 1). Yet more striking is the variation in the magnitude of projected declines. Models using parametric assumptions project much larger declines for both Black and White people than models using synthetic-cohort assumptions. The former suggest that the share of Black (White) people ever marrying by age 40 will fall to 30% to 37% (63% to 73%) by the 1990 cohort, whereas the latter suggest that it will fall only to 42% to 50% (70% to 80%) (depending on the model and gender). The synthetic-cohort assumptions are about 10–20 percentage points more conservative in terms of projected marital declines. All models, however, project large and growing racial differences in marriage.15
These racial differences partially reflect economic differences. White men and women are about four times more likely than their Black counterparts to come from high-income families, in the top tercile of the income distribution. Moreover, marital delays and declines across cohorts are much smaller among people from the top tercile of parental income than among people from the bottom two terciles (Fig. 4; and online appendix, Fig. A3).16 We estimate that share of people ever marrying by age 40 will decline by 12.4 (19.6) percentage points between the 1970 and 1990 cohorts for women (men) from the top tercile of parental income versus an astonishing 25.7 (31.6) percentage points for women (men) from the bottom two terciles—a substantial and significant difference (Fig. 4).
Fig. 4.

Cohort trends in the projected share of people marrying by age 40, by gender and parental income tercile (panels a and b) and differences across parental income terciles, by gender (panels c and d). Note: Point estimates in black surrounded by 95% confidence intervals in gray. Data are from the PSID.
To explore the intersection of racial and economic differences, we focus on results from discrete-time event-history models to smooth the data and avoid problems that arise with nonparametric estimation of marriage rates within potentially small cells defined by racial group and parental income tercile, among other characteristics, such as age and gender (see online appendix Table A3). Figure 5 plots the projected shares of Black and White women and men ever married by age 40 across birth cohorts (along with 95% confidence intervals in gray), separately among people from the bottom two terciles of parental income and the top tercile. Figure 6 plots the racial differences in these shares by parental income as well as the parental-income difference in these racial differences.
Fig. 5.

Cohort trends in the projected share of people marrying by age 40, by gender, parental income, and racial group. Note: Point estimates in black surrounded by 95% confidence intervals in gray. Data are from the PSID.
Fig. 6.

Racial differences in the projected share of people marrying by age 40, by cohort, gender, and parental income (panels a and b) and parental income differences in these racial differences (panels c and d). Note: Point estimates in black surrounded by 95% confidence intervals in gray. Data are from the PSID.
These graphs clearly illustrate that racial differences in marriage cannot be reduced to differences in economic backgrounds. In all cohorts and regardless of parental income, White men and women have substantially and significantly higher projected chances of marrying by age 40 than Black men and women (Figs. 5 and 6). These projected probabilities never fall below 50% for Whites; they first fall below 50% for Black women (men) from low-income backgrounds in the 1975 (1977) cohort and for Black women (men) from high-income backgrounds in the 1986 (1988) cohort. Because many substitute nonmarital cohabitation for marriage, the projected shares reaching age 40 without any romantic coresidential union are lower than the shares never marrying; however, the joint racial and economic patterns are similar (online appendix, Figs. A6 and A7). We project that less than 50% of Black women (men) from low-income backgrounds will form a union by age 40 beginning in the 1987 (1995) cohort, whereas Black women (men) from high-income backgrounds will cross that threshold in the 1991 (1996) cohort. Ages at marriage and union formation will continue to rise for people from all racial and economic backgrounds, but they will rise more among Black people than among White people from similar economic backgrounds (online appendix, Figs. A8 and A9).
In all cohorts, racial differences in marriage are larger among people from low-income than high-income backgrounds (Fig. 6, panels a and b). Among women (men) in the 1970 cohort, the racial difference is 3.7 (4.0) percentage points larger among people from low-income backgrounds than among people from high-income backgrounds; by the 1990 cohort, this number is 16.4 (16.2). These point estimates are large; however, we cannot reject the null hypothesis that racial differences in each cohort are the same among people from low- and high-income backgrounds (Fig. 6, panels c and d).
Considering trends across cohorts, marital declines progressed faster among both White and Black people from lower-income backgrounds than among their peers from higher-income backgrounds, as expected (Fig. 5, comparing the slopes in panels a and b vs. panels c and d, and Table 2).17 Within economic backgrounds, marital declines were larger among Black people than White people, particularly between the 1970–1984 cohorts (Table 2). For example, between these cohorts, the share of Black women from low-income (high-income) backgrounds projected to marry by age 40 fell by 26.4 (12.7) percentage points versus 11.3 (8.3) percentage points among their White peers, leading the racial gap to grow by 15.2 (4.4) points (Table 2, column 2).18 Notably, the estimated growth in the racial gap is not sensitive to model specification (compare columns 2 and 5 in the “Black − White” rows in Table 2).19 However, the estimated amount of cohort change within each racial-gender-income group is sensitive to model specification, particularly among the high-income groups. Their projected cohort declines are notably larger when estimated from interacted models than stratified models; compare, for example, the projected declines of 8.3 versus 4.6 percentage points among White women from high-income backgrounds (Table 2; see also footnote 17). In short, neither lower marriage levels nor larger marriage declines among Black people than among White people can be fully explained by differences in economic backgrounds.
Table 2.
Cohort differences in the projected percentage of people marrying by age 40, by gender, parental income, racial group, and model specification
| Income-Interacted Model | Income-Stratified Model | |||||
|---|---|---|---|---|---|---|
| Δ1 1997–1985 | Δ2 1984–1970 | Δ1-Δ2 | Δ1 1997–1985 | Δ2 1984–1970 | Δ1-Δ2 | |
| Women, Low-Income Parents | ||||||
| White | −10.5 (−19.5, −.6) |
−11.3 (−18.4, −4.1) |
.8 (−1.7, 4.2) |
−14.0 (−23.4, −3.0) |
−13.4 (−21.8, −5.5) |
−.6 (−3.0, 3.0) |
| Black | −13.8 (−16.7, −8.1) |
−26.4 (−37.9, −15.1) |
12.6 (6.3, 21.8) |
−14.1 (−16.9, −9.0) |
−26.6 (−38.9, −14.7) |
12.5 (5.8, 23.0) |
| Black - White | −3.4 (−11.7, 5.7) |
−15.2 (−26.5, −4.4) |
11.8 (4.2, 22.3) |
−.1 (−9.5, 8.6) |
−13.2 (−24.8, −2.9) |
13.1 (4.6, 24.1) |
| Women, High-Income Parents | ||||||
| White | −7.6 (−17.9, 2.3) |
−8.3 (−16.6, .0) |
.8 (−2.1, 3.2) |
−1.0 (−17.9, 8.0) |
−4.6 (–17.6, 7.8) |
3.6 (−2.5, 7.5) |
| Black | −8.9 (−24.4, 16.9) |
−12.7 (−50.7, 17.8) |
3.8 (−1.7, 30.6) |
−3.2 (−24.3, 18.9) |
−8.4 (−48.0, 23.6) |
5.2 (−8.3, 27.0) |
| Black - White | −1.4 (−18.7, 23.0) |
−4.4 (−42.4, 26.0) |
3.0 (−3.0, 30.3) |
−2.2 (−22.5, 21.4) |
−3.8 (−40.6, 28.0) |
1.6 (−11.6, 23.9) |
| Men, Low-Income Parents | ||||||
| White | −13.6 (−21.5, −3.0) |
−15.6 (−24.0, −6.6) |
2.0 (.5, 4.7) |
−17.5 (−24.4, −6.9) |
−19.2 (−29.3, −9.2) |
1.7 (.4, 5.4) |
| Black | −15.5 (−19.2, −10.1) |
−30.1 (−43.5, −17.5) |
14.5 (7.3, 25.3) |
−16.2 (−19.8, −10.5) |
−31.4 (−44.0, −17.3) |
15.2 (6.5, 25.4) |
| Black - White | −1.9 (−10.4, 6.1) |
−14.5 (−26.2, −3.5) |
12.5 (4.3, 23.2) |
1.3 (−7.8, 8.6) |
−12.1 (−24.6, −.2) |
13.4 (4.7, 22.9) |
| Men, High-Income Parents | ||||||
| White | −11.4 (−21.0, .0) |
−12.6 (−21.8, −2.8) |
1.2 (−.5, 3.5) |
−2.3 (−19.5, 8.8) |
−6.2 (−20.6, 7.4) |
3.9 (−.5, 7.9) |
| Black | −12.0 (−26.6, 13.7) |
−16.4 (−52.9, 15.6) |
4.5 (−1.6, 28.6) |
−4.3 (−24.6, 23.4) |
−9.6 (−47.4, 23.9) |
5.4 (−1.0, 25.0) |
| Black - White | −.6 (−18.6, 24.1) |
−3.8 (−39.4, 26.5) |
3.3 (−3.3, 27.8) |
−2.0 (−23.4, 25.2) |
−3.5 (−39.3, 28.3) |
1.5 (−4.2, 22.6) |
Notes: Low-income parents have income in the bottom two terciles of the family income distribution; high-income parents have income in the top tercile. Income-interacted models pool all respondents and interact predictors with tercile-group indicators. Income-stratified models separate respondents with low-income versus high-income parents and run separate models for each. Bootstrapped 95% confidence intervals are included in parentheses below point estimates. Data are from the PSID.
Indeed, racial differences in the projected shares of people ever marrying by age 40 overwhelmingly reflect differences among people from similar income backgrounds (Table 3). Across cohorts and genders, 87% to 99% of racial differences in marriage are attributed to racial differences in marriage within parental-income terciles versus 1% to 13% attributed to racial differences in the probability of growing up in the top tercile (Table A4 in the online appendix contains corresponding results for union formation).20 This extreme asymmetry in the roles of within-versus between-tercile differences is all the more striking in light of the fact that the between-tercile differences are very large. Black people are only about 25% as likely as Whites to grow up in the top third of the income distribution. Yet among those who do, their probability of marrying is about 25–31 (16–21) percentage points lower among Black women (men) than among their White peers from the top tercile (the ranges reflect the growing racial differences across cohorts).
Table 3.
Percentage of the racial difference in the projected share of people marrying by age 40 (denoted Δ) attributed to racial differences in marriage within parental income groups (rates) versus racial differences in parental income (composition), by gender, cohort, and granularity of parental income categories
| Women | Men | |||||||
|---|---|---|---|---|---|---|---|---|
| Parental Income Terciles | Parental Income Deciles | Parental Income Terciles | Parental Income Deciles | |||||
| Cohort | % Δ Marriage (rates) | % Δ Income (composition) | % Δ Marriage (rates) | % Δ Income (composition) | % Δ Marriage (rates) | % Δ Income (composition) | % Δ Marriage (rates) | % Δ Income (composition) |
| 1970 | 98.7 (82.3, 112.8) |
1.3 (−12.8, 17.7) |
95.0 (80.8, 108.6) |
5.0 (−8.6, 19.2) |
96.2 (67.1, 122.0) |
3.8 (−22.0, 32.9) |
77.1 (44.5, 97.6) |
22.9 (2.4, 55.5) |
| 1980 | 93.8 (86.8, 100.8) |
6.2 (−.8. 13.2) |
95.8 (85.4, 105.4) |
4.2 (−5.4, 14.6) |
90.1 (81.0, 99.4) |
9.9 (.6. 19.0) |
84.1 (69.2. 98.5) |
15.9 (1.5, 30.8) |
| 1990 | 91.1 (78.4, 102.1) |
8.9 (−2.1, 21.6) |
96.0 (86.8, 104.1) |
4.0 (−4.1. 13.2) |
87.6 (71.4, 102.4) |
12.4 (−2.4, 28.6) |
88.2 (76.4, 100.5) |
11.8 (−.5. 23.6) |
| 1997 | 89.8 (72.0, 103.1) |
10.2 (−3.1, 28.0) |
95.8 (86.2, 103.7) |
4.2 (−3.7, 13.8) |
86.7 (62.1, 103.9) |
13.3 (−3.9. 37.9) |
90.2 (78.6, 102.5) |
9.8 (−2.5, 21.4) |
| Change, 1970–1990 | −7.6 (−28.8, 16.0) |
7.6 (−16.0, 28.8) |
.9 (−7.5, 10.6) |
−.9 (−10.6, 7.5) |
−8.5 (−43.6. 30.6) |
8.5 (−30.6, 43.6) |
11.1 (−1.1, 38.7) |
−11.1 (−38.7, 1.1) |
Notes: Marriage (rates) differences capture racial differences in the projected share of people marrying by age 40 within parental income groups. Income (composition) differences capture racial differences in the share of people from families with parental income (1) in the bottom two versus top tercile, for the first two columns within each gender, and (2) in each of the bottom six income deciles plus the top three deciles combined, for the last two columns within each gender. We pool the top three deciles because of the small number of Black men and women observed with parental income in these top deciles. Bootstrapped 95% confidence intervals are included in parentheses below point estimates. Percentages for rates may exceed 100 (and percentages for compositions may fall below 0) if racial differences in marriage within income groups alone are sufficiently large to generate bigger aggregate racial differences than observed (and racial differences in parental income alone generate smaller aggregate racial differences in marriage than observed). Data are from the PSID.
Of course, within parental income terciles, income distributions vary across racial groups, with White people generally having higher incomes. Thus, we also examine finer income groups to see whether they attribute more of the racial difference in marriage to differences in economic backgrounds. We create seven income groups, distinguishing people who grew up in the bottom decile of the family income distribution from people who grew up in the second, third, fourth, fifth, and sixth deciles, as well as the top three deciles. We combine the top three deciles because of the small number of Black respondents from these deciles (a constraint that reflects the dramatic income inequality between racial groups). Considering these decile groups increases the compositional share of the racial difference in marriage (relative to tercile groups) for some cohort and gender subpopulations (e.g., men from the 1970 cohort) but not all (e.g., women from the 1990 cohort).21 However, whether we consider terciles or deciles, the vast majority of racial differences in marriage appear among people from similar economic backgrounds (Table 3).22
This finding holds even after we include a wide array of parental socioeconomic characteristics: not only income but also wealth, education, and occupational prestige (Table 4; Table A5 in the online appendix contains union-formation results). Row 1 of Table 4 includes only income deciles (as in Table 3) but uses the decomposition from Eq. (5) (rather than Eq. (4), as in Table 3). The Eq. (5) decomposition more easily incorporates multiple measures of socioeconomic background than the Eq. (4) decomposition, but when we use only income, the results from the two decompositions are very similar; Tables 3 and 4 are comparable. Row 2 of Table 4 also includes parental income only (as in row 1) but considers continuous income (rather than decile indicators) transformed using an inverse hyperbolic sine (IHS).23 Results are very similar across these income specifications. We thus move forward with the IHS transformation, which avoids collinearity problems that can arise with decile indicators combined with additional socioeconomic measures and small cell sizes, particularly among Black people with high-income parents. Rows 3, 4, and 5 of Table 4 each add one new measure of socioeconomic background, such that row 5 includes them all: parental income, wealth, occupational prestige, and educational attainment. We measure wealth in two ways: net worth (which is comprehensive of all assets and debts; in columns 1–2 for women and 5–6 for men) and home value (which reflects only one asset but is available in all survey years; in columns 3–4 and 7–8). Because the sample changes across wealth measures, with more recently born cohorts being more likely to have parental net worth observed because of the PSID design (as explicated in footnote 4), results are not identical across columns. However, they are extremely similar.
Table 4.
Percentage of the racial difference in the projected share of people marrying by age 40 (denoted Δ) associated with racial differences in parental socioeconomic characteristics (composition) and racial differences in the returns to these characteristics (rates), by gender, parental wealth measure, and reference group
| Women | Men | |||||||
|---|---|---|---|---|---|---|---|---|
| Parental Wealth: Net Worth | Parental Wealth: Home Value | Parental Wealth: Net Worth | Parental Wealtli: Home Value | |||||
| Parental Socioeconomic Characteristics Included | % Δ Returns (rates) | % Δ Characteristics (composition) | % Δ Returns (rates) | % Δ Characteristics (composition) | % Δ Returns (rates) | % Δ Characteristics (composition) | % Δ Returns (rates) | % Δ Characteristics (composition) |
| A. White Reference Group | ||||||||
| 1. Income (deciles) | 99.7 (88.6, 108.1) |
.3 (−8.1, 11.4) |
100.1 (88.5, 110.1) |
−.1 (−10.1, 11.5) |
92.8 (75.3, 108.6) |
7.2 (−8.6, 24.7) |
91.5 (73.9, 108.0) |
8.5 (−8.0, 26.1) |
| 2. Income (IHS) | 102.5 (93.5, 111.1) |
−2.5 (−11.1, 6.5) |
102.7 (94.1, 111.5) |
−2.7 (−11.5, 5.9) |
99.3 (86.8, 114.0) |
.7 (−14.0, 13.2) |
98.4 (84.0, 112.8) |
1.6 (−12.8, 16.0) |
| 3. (2) Plus wealth (IHS) | 101.4 (92.6, 109.9) |
−1.4 (−9.9, 7.4) |
100.9 (90.7, 110.8) |
−.9 (−10.8, 9.3) |
99.0 (86.2, 113.9) |
1.0 (−13.9, 13.8) |
95.8 (80.1, 110.1) |
4.2 (−10.1, 19.9) |
| 4. (3) Plus occupational prestige | 101.1 (92.3, 109.6) |
−1.1 (−9.6, 7.7) |
101.1 (90.8, 111.2) |
−1.1 (−11.2, 9.2) |
99.4 (86.3, 113.3) |
.6 (−13.3, 13.7) |
96.5 (80.8, 111.1) |
3.5 (−11.1, 19.2) |
| 5. (4) Plus educational attainment | 100.3 (91.2, 109.2) |
−.3 (−9.2, 8.8) |
100.4 (89.4, 111.0) |
−.4 (−11.0, 10.6) |
97.9 (84.4, 112.8) |
2.1 (−12.8, 15.6) |
95.1 (79.6, 110.1) |
4.9 (−10.1, 20.4) |
| B. Black Reference Group | ||||||||
| 1. Income (deciles) | 81.1 (64.3, 97.8) |
18.9 (2.2, 35.7) |
83.5 (65.8, 97.8) |
16.5 (2.2, 34.2) |
68.9 (51.3, 88.5) |
31.1 (11.5, 48.7) |
68.6 (48.9, 86.6) |
31.4 (13.4, 51.1) |
| 2. Income (IHS) | 82.7 (65.2, 97.3) |
17.3 (2.7, 34.8) |
84.6 (67.4, 98.4) |
15.4 (1.6, 32.6) |
74.8 (57.6, 90.8) |
25.2 (9.2, 42.4) |
74.2 (56.0, 90.0) |
25.8 (10.0, 44.0) |
| 3. (2) Plus wealth (IHS) | 81.9 (64.6, 96.1) |
18.1 (3.9, 35.4) |
79.7 (61.8, 93.3) |
20.3 (6.7, 38.2) |
75.0 (57.9, 91.2) |
25.0 (8.8, 42.1) |
69.1 (50.4, 85.0) |
30.9 (15.0, 49.6) |
| 4. (3) Plus occupational prestige | 75.5 (58.4, 91.3) |
24.5 (8.7, 41.6) |
73.3 (56.6, 89.1) |
26.7 (10.9, 43.4) |
67.2 (49.8, 84.0) |
32.8 (16.0, 50.2) |
61.3 (43.2, 78.1) |
38.7 (21.9, 56.8) |
| 5. (4) Plus educational attainment | 75.2 (58.0, 91.2) |
24.8 (8.8, 42.0) |
72.8 (56.4, 89.0) |
27.2 (11.0, 43.6) |
67.0 (50.0, 85.4) |
33.0 (14.6, 50.0) |
60.7 (42.3, 78.2) |
39.3 (21.8, 57.7) |
Notes: IHS indicates inverse hyperbolic sine transformation; both parental income and parental wealth (whether measured as net worth or home value) use this transformation in Models 2–5. Income is coded in deciles in Model 1, with the top three deciles combined because of small cell sizes among Black men and women in these deciles. Occupational prestige enters linearly, and educational attainment is coded in four categories; see the Data section. Results differ across net worth and home value columns even for Model 1, when wealth is not included in the model, because of differences in the samples with observed values on the two variables. Returns (rates) capture racial differences in the projected share of people marrying by age 40 that are not associated with racial differences in the observed distributions of parental socioeconomic characteristics (income, wealth, occupation, and education). Characteristics (composition) differences capture racial differences in the projected share of people marrying by age 40 that are associated with racial differences in these observed distributions of parental socioeconomic characteristics. Bootstrapped 95% confidence intervals are included in parentheses below point estimates. Data are from the PSID.
Table 4 indicates that most racial inequalities in marriage occur among people with similar socioeconomic backgrounds. Panel A, which uses White reference coefficients per Eq. (5), suggests that less than 10% of racial differences in marriage can be attributed to racial differences in socioeconomic backgrounds. Panel B, which uses Black reference coefficients per Eq. (6), suggests that socioeconomic differences could explain about one-quarter of marriage differences among women and about one-third of marriage differences among men; 95% confidence intervals include values above 40% for women and 50% for men, although they also include values below 10% to 15% for women and below 15% to 20% for men, depending on the wealth measure. Decomposition results are never unique; it is not surprising that results differ across reference groups. Yet regardless of reference group, these results suggest that racial differences in marriage levels are attributed principally to differences among people from similar socioeconomic backgrounds.
Further, as we have shown, marital delays and declines across cohorts were larger among Black people than White people from similar income backgrounds in terms of typical marital ages and projected shares ever married by age 40. However, racial gaps may close in future cohorts as White people converge to Black people’s low marriage rates. We discuss this convergence in the online appendix (see also Tables A6–A9 and Figs. A10–A13). Nevertheless, in the medium term, racial differences continue to grow among people from both low- and high-income backgrounds.
Discussion
Family life in the United States transformed across cohorts born between the early and mid-twentieth century as men and women delayed marriage and became increasingly likely to live with nonmarital partners (Ruggles 2016; Sweeney 2016). In this article, we shed light on recent trends in marriage and union formation across people born between 1970 and 1997, who began forming unions between 1985 and 2015. We document how these trends have evolved differently across people from various racial groups and socioeconomic backgrounds, providing novel insights into the extent to which people’s marriage and union formation experiences reflect their parental resources during childhood.
Four main findings emerge from our analysis. First, men and women are continuing to delay marriage to increasingly older ages; indeed, the typical ages at marriage are increasing faster across recent cohorts (born between the 1970s and 1990s) than they increased across earlier cohorts (born between the 1940s and 1960s). Delays in union formation are substantially smaller than delays in marriage, but they are not zero; young adults are remaining single until older ages. Second, delays are not uniform across age. Rather, they are especially steep for people in their mid-20s. These findings should push demographers to understand the causes and consequences of extended singlehood. Young people are replacing early marriage with cohabitation, but they are also increasingly spending long periods of their lives without coresidential partners.
Third, these delays translate into steep projected declines in the share of people ever marrying, particularly among Black people, who are experiencing larger declines than White people from a lower baseline level. We project that before the 1980 (1990) cohort, less than 50% of Black people from low-income (high-income) backgrounds will ever marry by age 40; among White people, none of our models project a crossing of the 50% threshold for the cohorts under study. Parametric models project steeper declines than synthetic-cohort models, but both project large and growing racial differences in marriage. Fourth, racial differences in marriage and union formation cannot be explained by differences in socioeconomic backgrounds. Across cohorts, racial divergence in the projected share of people ever marrying (or forming a union) is evident among people from both low- and high-income backgrounds, although the magnitude of divergence is larger among people from low-income backgrounds. Within each cohort, the large majority of racial differences in marriage occur among Black and White people from similar socioeconomic backgrounds. Racial inequalities in parental income, wealth, occupation prestige, and educational attainment are dramatic, and people from disadvantaged socioeconomic backgrounds are now less likely to marry than their advantaged peers. However, parental socioeconomic differences cannot explain most racial differences in family formation.
These findings suggest that family-formation processes are becoming increasingly central in reproducing racial and economic inequalities. Prior work has shown that across earlier cohorts, marriage declined much less among college graduates than among less-educated people. We expand these findings by tracing rising family inequalities across more recent cohorts back earlier in the life course. We provide direct evidence of the tightening link between childhood economic circumstance and adult family structure (see Fig. 4, Fig. 5, and Table 2, as well as Figs. A3–A9 in the online appendix). Adult family structure strongly predicts adult income, partly because married and cohabiting people can pool two partners’ earnings. Consequently, our results provide an early indication that the intergenerational persistence of income may increase across recent birth cohorts, with people from low-income (high-income) backgrounds becoming increasingly likely to grow into low-income (high-income) adults. Black people from low-income backgrounds have seen the largest delays in marriage and union formation. Our results thus imply that joint racial and economic inequalities may persist across multiple generations. Marriage patterns reproduce existing economic inequalities, and our results suggest that this reproductive role is growing.24
Yet our results also suggest that marriage patterns may increasingly create economic inequalities anew, with important implications for racial stratification. We show that even among people from relatively high-income backgrounds, Black men and women are much less likely to marry or form unions than their White peers, and this gap is growing. This growing gap may lead more Black men and women to fall down the income ladder across generations, which would slow the pace of progress toward racial equality in incomes (Bloome 2014; Chetty et al. 2018). Of course, the fact that marriage differences are linked to mobility differences does not imply that marriage alone can eliminate racial inequalities in income. All children can benefit from the additional resources that generally accompany multiple parents in the household, but the economic returns to marriage are often higher for White families than Black families, reflecting how racism shapes inequalities not only between but also within family structures (Darity et al. 2018). The trends that we document suggest that marriage is one among many mechanisms that perpetuates racial economic inequalities. It may also contribute to racial stratification more broadly. Letiecq (2019:398) highlighted “the benefits, often invisible and unacknowledged, that one receives by belonging to family systems long upheld in society as superior to all others.” Given the racial divergence in marriage that we project, these benefits may also increasingly contribute to the maintenance of White supremacy if the cultural and legal systems rewarding marriage do not evolve.
The large and growing racial differences in marriage and union formation among people from high-income backgrounds merit serious scholarly attention. Researchers have made important inroads into understanding racial differences in family formation, but most work has focused on economic disadvantage (Raley and Sweeney 2009). Yet little of the racial difference in partnership is explained by childhood income and wealth, in contrast to many other racial differences, including differences in economic and health outcomes, which are more tightly linked to economic background (Johnson 2018; Killewald and Bryan 2018). Our findings should push researchers to carefully trace some of the oft-termed “economic” explanations for racial differences in marriage—including differences in employment, wages, and job quality—to racist structures rather than long-standing differences in access to socioeconomic resources, which we show have limited explanatory power (at least in terms of parental resources; future work could explore access to resources outside the family, including in the neighborhood). Studies of economically advantaged people may reveal important insights into both the financial and nonfinancial drivers of family formation choices, including power differences and dynamics related to racism, sexism, and their intersection (Horton 1999; Johnson and Loscocco 2015). A goal for these studies could be understanding how individuals’ personal resources interact with larger systems to shape family outcomes. As Bell McDonald and Cross-Barnet (2018:14) noted, understanding marriage among middle-class people is crucial for understanding marriage among both Black and White Americans because “poverty rates among Black Americans may be more than double what they are among Whites, but more than 75% of Black Americans are not poor.”
For example, Black people from all economic backgrounds may face barriers to marriage and union formation because of exclusion from the physical spaces and social networks where many people find partners (Harris and Ono 2005; South and Crowder 1999). The rise of online dating may further exacerbate racial inequalities in partner access (Bruch and Newman 2018; Robnett and Feliciano 2011). Investigating the union-formation implications of intersecting social, cultural, and economic changes is particularly important. Although the vast majority of both Black and White young women today report that they expect to marry, marriage is no longer seen as necessary for a fulfilling life (Manning et al. 2019b; Wang and Parker 2014). How this shift from earlier in the century—when marrying was not only statistically normative but also culturally expected and reinforced by a variety of mechanisms, including women’s relatively limited legal rights and economic opportunities (Coontz 2005)—interacted with other social and economic changes to generate rising racial gaps in union formation is ripe for research. Historical trends clearly indicate that these racial gaps are context-dependent, as discussed earlier. Our findings indicate that explanations of today’s racial differences cannot rest on inequalities in economic backgrounds. They should also contend with the social and political forces that “impact people’s ability to think of marriage as materially feasible and emotionally sustainable” (Hunter 2017:309). This research should aspire to consider not only individuals’ attributes or perspectives but also what aspects of the institution of marriage contribute to its unequal take-up across population subgroups and what forms of family recognition could best promote “Black citizenship and belonging” (Lenhardt 2015:1324). Money matters, but exactly why, how, and to what extent depends on social context and merits much more serious investigation by family demographers.
An important next step in this research agenda, then, is to understand the social, economic, and political drivers of the patterns documented here. As Andersson and Philipov (2002:68) stated, “any sound investigation of a demographic phenomenon must originate from some knowledge about its very basic patterns.” Our descriptive findings provide the basis for future investigations into the causes of recent trends—particularly the large and growing racial differences in family formation, which are not limited to low-income populations. At the same time, even as the probabilities of ever marrying or forming a union declined more among Black people than White people, marriage and union formation hazards declined more among White people (see the online appendix). Thus, future research should also consider the forces that may drive racial convergence in marriage in the long run.
Additional descriptive analyses would also enrich our understanding of marriage and union formation trends. Future researchers could build on our results by using data sets with samples large enough to study racial/ethnic groups beyond non-Hispanic White and Black people. Similarly, more information on same-sex partners is needed. Additional studies of cohabitation per se would also enrich this stream of research. Future researchers could extend our findings by modeling cohabitation and marriage as competing risks, studying the choice between marriage and cohabitation among partnered people, and employing cohabitation as a predictor of marriage. Finally, because projections are always uncertain, our results should be checked in future years, as our target cohorts age. Our estimates appear reasonable in light of historical trends (Fig. 1), but our cohort members’ youth prevents us from making conclusive inferences regarding their lifetime experiences, particularly for people born after 1985. Our results provide early insights into ongoing trends, finding accelerating increases in typical ages at marriage and declining probabilities of ever marrying, particularly among Black people from low-income backgrounds. To the extent that changes in marriage and union formation reflect changes in the opportunity structure of society (Cherlin 2014), our results suggest that opportunities are diverging across racial and income groups.
Supplementary Material
Acknowledgments
We gratefully acknowledge support from the Eunice Kennedy Shriver National Institute of Child Health and Human Development research grant P01HD087155 and center grant P2CHD041028 as well as the Russell Sage Foundation visiting scholars program. We benefitted from the insightful discussions and comments of the Demography editors and reviewers, William Axinn, Elizabeth Cooksey, Paula Fomby, Lauren Griffin, Anders Holm, Heather Rackin, and Pamela Smock as well as excellent research assistance from Meichu Chen and Jane Furey.
Footnotes
Electronic supplementary material The online version of this article (https://doi.org/10.1007/s13524-020-00910-7) contains supplementary material, which is available to authorized users.
Data Availability Data are available from the Panel Study of Income Dynamics: https://psidonline.isr.umich.edu/.
Ethics and Consent This study conducts secondary analysis of existing data collected for research purposes and distributed under the oversight of the University of Michigan Health Sciences and Behavioral Sciences Institutional Review Board.
Conflict of Interest The authors declare no conflict of interest.
The distal causes of this persistence are wide-ranging, including systemic racism, which shapes family-formation opportunities.
Because data collection began in 1968, the PSID underrepresents recent immigrant populations.
We should miss fewer cohabitations over time because cohabitation duration increased across recent cohorts (Lamidi et al. 2019; Mernitz 2018). Moreover, very short cohabitations may be less substantively interesting than longer-lasting unions (and they are not absent from our analysis, only underrepresented). No large-scale, nationally representative U.S. survey includes complete cohabitation histories as well as information on parental income and a large number of birth cohorts, as required for this study.
We include two measures of parental wealth: net worth and home value. Net worth sums all financial assets, real assets, and home equity and then subtracts financial obligations. Unfortunately, many of our cohorts have few opportunities for their parental net worth to be observed during childhood because 1984 was the first year in which the PSID collected the information needed to calculate net worth. We thus supplement this measure of wealth with another: home values, about which the PSID has collected information since its inception in 1968. Substantively, housing wealth is the primary asset of most Americans. We set home values to 0 for people who do not own their home. We average parental net worth and (separately) home value across all childhood ages observed, ages 0–17. We code parental education into four categories (less than high school, high school, some college, and four years of college or more education) based on the highest education level completed by either parent observed over the course of childhood. We measure parental occupational prestige based on the maximum prestige score observed from either parent between respondent ages 0 and 17. We capture occupational prestige by linking PSID occupational categories to their prestige scores, following the procedure outlined in Bloome and Furey (2019).
Union formation rarely occurs before age 15. We exclude one respondent based on this restriction.
The first source of censoring is not problematic from an analytic perspective and the second is rare. The third could be problematic if attrition time relates to union-formation chances at that time (conditional on the model’s predictors). Discrete-time event-history models assume that attrition time is noninformative (Allison 2014).
In discrete-time models, the hazard, h, and probability, p, are the same.
is the conditional expectation of marrying by age 40 in gender group g and racial group r across individuals j. is the conditional expectation of marrying by age 40 in gender group g and racial group r′ across individuals j evaluated at the parameter vector βg,r. X contains socioeconomic indicators as well as other basic covariates discussed earlier, such as age, cohort, and their interactions.
Comparing the 1940–1944 and 1964–1969 cohorts, Sweeney (2016:277) reported a 4.6-year increase using NSFG data. Likewise, we estimate a 4.8-year increase comparing the 1940 and 1969 cohorts using PSID data. The similarity between the NSFG and PSID estimates suggests that the PSID estimates are reliable, as does the similarity between our model-based estimates and our nonparametric Kaplan-Meier estimates. The weighted PSID estimates are slightly higher than the NSFG estimates, just as the NSFG estimates are slightly higher than the GSS estimates for the cohorts in both series (Fig. 1). Unweighted PSID estimates are almost identical to the NSFG estimates for the overlapping cohorts.
Monthly probabilities are quite low because they accumulate with age; for example, we estimate that about 39% of women born in 1970 had married by age 24.
Because union formation occurs younger than marriage (and it occurs younger among women than men), the age of most rapid change is lower for union formation than for marriage (and lower for women than for men).
The importance of including age-by-cohort interactions is even larger among Black men and women than among White men and women; we discuss racial differences shortly. Bootstrapped 95% confidence intervals for the difference between our model-based estimates and synthetic cohort-based estimates allow us to reject the null hypothesis that the difference is zero in some, but not all, gender and racial groups; for example, the bootstrapped 95% confidence interval for the difference for White women (men) ranges between −1.2% and 15.6% (3.1% and 25.8%).
Similarly, the Kaplan-Meier estimates for the 1970–1974 birth cohorts are 89.4%, 83.2%, 56.8%, and 61.0% for White women, White men, Black women, and Black men, respectively.
This pattern is evident comparing the Black and White shares in 1970 versus 1990 for men using our life-table estimates and the Martin estimates and for women using the Martin estimates. Our life-table estimates for women suggest a different pattern because our 1970 estimate for Black women is quite low, although our 1980 estimate for Black women corresponds very closely to the 1980 Martin estimate.
We project racial divergence in marriage by age 40. However, we project racial convergence in marriage by age 25. Young White people are catching up to young Black people’s low marriage probabilities, but they are still quite likely to marry between ages 25 and 40; thus, by older ages, White and Black people’s cumulative marriage probabilities diverge.
Notably, union delays were not nearly as stratified by parental income (online appendix, Figs. A4 and A5).
This difference in trends is even more obvious in stratified models—which separately estimate low- and high-income people’s trends (Table 2, columns 4–6)—than in interacted models—which pool people across income backgrounds but allow for separate trends via interactions (Table 2, columns 1–3). Trends among people from high-income backgrounds are more extreme in the interacted models than the stratified models because they are pulled toward the steeper, downward trends observed among people from low-income backgrounds. The high-income trends are more sensitive to model specification than the low-income trends because fewer people stem from high-income than low-income backgrounds. This model sensitivity appears on the scale of lifetime marriage probabilities (Table 2) but not on the scale of monthly marriage hazards (compare Tables A6 and A7 in the online appendix). Small differences in hazards across model specifications compound over the life course to generate large differences in the projected probabilities of marrying by age 40.
Racial differences in cohort trends are evident among people from both low- and high-income backgrounds, although the differences are not statistically significant among people from high-income backgrounds due to small sample sizes within the top-tercile cells for Black men and women (Table A3, online appendix).
When we pool people from low- and high-income backgrounds and include interactions, we project the racial gap among women from low-income (high-income) backgrounds to grow by 15.2 (4.4) percentage points between the 1970–1984 cohorts (Table 2, column 2) versus 13.2 (3.8) percentage points when we instead stratify our models by income background (Table 2, column 5).
Table 3 indicates that the tercile-based compositional share increased about 7–8 percentage points between the 1970 and 1990 cohorts. However, this increase is not statistically significant. Neither is it substantively meaningful because rather than reflecting growing racial gaps in the probability of having high-income parents, it reflects growing differences across income groups in the compositional weights. See the online appendix.
It also reveals the expected decline in the compositional share across cohorts, reflecting the fact that in more recent cohorts, Black men and women were less concentrated in the bottom income deciles.
Point estimates vary between 77% and 99%, depending on cohort and gender, with women’s estimates generally exceeding men’s. Incorporating sampling uncertainty, Table 3 shows that one of the 16 bootstrapped confidence intervals (2 genders × 2 income classification systems × 4 cohorts = 16) includes 50% (with a lower bound of 44.5). But the weight of the evidence suggests that racial differences within economic backgrounds are much more important than racial differences in economic backgrounds themselves (as extreme as they are) in producing aggregate racial differences in marriage. Indeed, several of the bootstrapped intervals contain values exceeding 100%, indicating that racial differences in marriage within parental income groups might be so large that they generate larger aggregate racial gaps in marriage than actually observed (with the observed gaps thus resulting from negative composition effects, with Black men and women from low-income backgrounds marrying more than expected from their parental incomes).
The IHS transformation allows us to maintain 0 and negative values while reducing sensitivity to extreme outliers. This transformation is especially useful for wealth; we use it for both income and wealth for consistency across our dollar-based measures.
In future years, once the young people in this study have reached the ages when their adult family incomes can be reliably measured, researchers should test this implication of our results.
References
- Addo FR (2012). Ethnoracial differences in early union experiences among young adult women. Review of Black Political Economy, 39, 427–444. [Google Scholar]
- Addo FR (2014). Debt, cohabitation, and marriage in young adulthood. Demography, 51, 1677–1701. [DOI] [PMC free article] [PubMed] [Google Scholar]
- Allison PD (2014). Event history and survival analysis (2nd ed.). Thousand Oaks, CA: Sage Publications. [Google Scholar]
- Andersson G, & Philipov D (2002). Life-table representations of family dynamics in Sweden, Hungary, and 14 other FFS countries. Demographic Research, 7, 67–144. 10.4054/DemRes.2002.7.4 [DOI] [Google Scholar]
- Arnett JJ (2000). Emerging adulthood: A theory of development from the late teens through the twenties. American Psychologist, 55, 469–480. [PubMed] [Google Scholar]
- Axinn WG, & Thornton A (1992). The influence of parental resources on the timing of the transition to marriage. Social Science Research, 21, 261–285. [Google Scholar]
- Bell McDonald K, & Cross-Barnet C (2018). Marriage in Black: The pursuit of married life among American-born and immigrant Blacks. New York, NY: Routledge. [Google Scholar]
- Bennett NG, Bloom DE, & Craig PH (1989). The divergence of Black and White marriage patterns. American Journal of Sociology, 95, 692–722. [Google Scholar]
- Bloome D (2014). Racial inequality trends and the intergenerational persistence of income and family structure. American Sociological Review, 79, 1196–1225. [DOI] [PMC free article] [PubMed] [Google Scholar]
- Bloome D, Dyer S, & Zhou X (2018). Educational inequality, educational expansion, and intergenerational income persistence in the United States. American Sociological Review, 83, 1215–1253. [Google Scholar]
- Bloome D, & Furey J (2019). Lifetime inequality: Income and occupational differences and dynamics in the US. Research in Social Stratification and Mobility. Advance online publication. 10.1016/j.rssm.2019.100470 [DOI] [Google Scholar]
- Bruch EE, & Newman MEJ (2018). Aspirational pursuit of mates in online dating markets. Science Advances, 4, eaap9815. 10.1126/sciadv.aap9815 [DOI] [PMC free article] [PubMed] [Google Scholar]
- Burton LM, Bonilla-Silva E, Ray V, Buckelew R, & Freeman EH (2010). Critical race theories, colorism, and the decade’s research on families of color. Journal of Marriage and Family, 72, 440–459. [Google Scholar]
- Cherlin AJ (2004). The deinstitutionalization of American marriage. Journal of Marriage and Family, 66, 848–861. [Google Scholar]
- Cherlin AJ (2005). American marriage in the early twenty-first century. Future of Children, 15(2), 33–55. [DOI] [PubMed] [Google Scholar]
- Cherlin AJ (2014). Labor’s love lost: The rise and fall of the working-class family in America. New York, NY: Russell Sage Foundation. [Google Scholar]
- Chetty R, Hendren N, Jones M, & Porter SR (2018). Race and economic opportunity in the United States: An intergenerational perspective (Working paper). Cambridge, MA: Harvard University, Opportunity Insights Project. [Google Scholar]
- Coale AJ, & McNeil DR (1972). The distribution by age of the frequency of first marriage in female cohort. Journal of American Statistical Association, 67, 743–749. [DOI] [PubMed] [Google Scholar]
- Cohen PN, & Pepin JR (2018). Unequal marriage markets: Sex ratios and first marriage among Black and White women. Socius: Sociological Research for a Dynamic World, 4, 1–10. 10.1177/2378023118791084 [DOI] [Google Scholar]
- Coontz S (2005). Marriage, a history: From obedience to intimacy, or how love conquered marriage. New York, NY: Viking. [Google Scholar]
- Coontz S (2016). Gender equality and economic inequality: Impact on marriage. In McHale SM, King V, Van Hook J, & Booth A (Eds.), Gender and couple relationships (National Symposium on Family Issues, Vol. 6, pp. 79–90). New York, NY: Springer. [Google Scholar]
- Crowder KD, & Tolnay SE (2000). A new marriage squeeze for Black women: The role of racial intermarriage by Black men. Journal of Marriage and the Family, 62, 792–807. [Google Scholar]
- Darity W Jr., Hamilton D, Paul M, Aja A, Price A, Moore A, & Chiopris C (2018). What we get wrong about closing the racial wealth gap (White paper). Durham, NC: Samuel DuBois Cook Center on Social Equity at Duke University, Insight Center for Community Economic Development. [Google Scholar]
- Davis A (1999). The private law of race and sex: An antebellum perspective. Stanford Law Review, 51, 221–288. [Google Scholar]
- Drake SC, & Cayton HR (2015). Black metropolis: A study of Negro life in a northern city. Chicago, IL: University of Chicago Press. (Original work published 1945) [Google Scholar]
- Du Bois WEB (1996). The Philadelphia Negro. Philadelphia: University of Pennsylvania Press. (Original work published 1899) [Google Scholar]
- Edin K, & Kefalas M (2005). Promises I can keep: Why poor women put motherhood before marriage. Berkeley: University of California Press. [Google Scholar]
- Eichner M (2010). The supportive state: Families, government, and America’s political ideals. New York, NY: Oxford University Press. [Google Scholar]
- Elliott DB, Krivickas K, Brault MW, & Kreider RM (2012). Historical marriage trends from 1890–2010: A focus on race differences (SEHSD Working Paper Number 2012–12). Washington, DC: U.S. Census Bureau. [Google Scholar]
- Few AL (2007). Integrating Black consciousness and critical race feminism into family studies research. Journal of Family Issues, 28, 452–473. [Google Scholar]
- Few-Demo AL, & Allen KR (2020). Gender, feminist, and intersectional perspectives on families: A decade in review. Journal of Marriage and Family, 82, 326–345. [Google Scholar]
- Fitch CA, & Ruggles S (2000). Historical trends in marriage formation: The United States 1850–1990. In Waite LJ, Bacharach C, Hindin M, Thomson E, & Thornton A (Eds.), The ties that bind: Perspectives on marriage and cohabitation (pp. 59–88). New York, NY: Aldine de Gruyter. [Google Scholar]
- Franke KM (1999). Becoming a citizen: Reconstruction era regulation of African American marriages. Yale Journal of Law & the Humanities, 11, 251–310. [Google Scholar]
- Frazier EF (1939). The Negro family in the United States. Chicago, IL: University Chicago Press. [Google Scholar]
- Furstenberg FF (2007). The making of the Black family: Race and class in qualitative studies in the twentieth century. Annual Review of Sociology, 33, 429–448. [Google Scholar]
- Gibson-Davis CM, Edin K, & McLanahan S (2005). High hopes but even higher expectations: The retreat from marriage among low-income couples. Journal of Marriage and Family, 67, 1301–1312. [Google Scholar]
- Goldstein JR, & Kenney CT (2001). Marriage delayed or marriage forgone? New cohort forecasts of first marriage for U.S. women. American Sociological Review, 66, 506–519. [Google Scholar]
- Hamilton D, & Darity W Jr. (2010). Can “baby bonds” eliminate the racial wealth gap in putative post-racial America? Review of Black Political Economy, 37, 207–216. [Google Scholar]
- Harris DR, & Ono H (2005). How many interracial marriages would there be if all groups were of equal size in all places? A new look at national estimates of interracial marriage. Social Science Research, 34, 236–251. [Google Scholar]
- Horton HD (1999). Critical demography: The paradigm of the future? Sociological Forum, 14, 363–367. [Google Scholar]
- Hunter TW (2017). Bound in wedlock: Slave and free Black marriage in the nineteenth century. Cambridge, MA: Belknap/Harvard University Press. [Google Scholar]
- James AG, & McGeorge CR (2019). Introduction to special issue on social justice in family science: An exploration of race and racism. Journal of Family Theory and Review, 11, 347–353. [Google Scholar]
- Johnson KR, & Loscocco K (2015). Black marriage through the prism of gender, race, and class. Journal of Black Studies, 46, 142–171. [Google Scholar]
- Johnson RC (2018). Addressing racial health disparities: Looking back to point the way forward. Annals of the American Academy of Political and Social Science, 680, 132–171. [DOI] [PMC free article] [PubMed] [Google Scholar]
- Kaneko R (2003). Elaboration of the Coale-McNeil nuptiality model as the generalized log gamma distribution: A new identity and empirical enhancements. Demographic Research, 9, 223–262. 10.4054/DemRes.2003.9.10 [DOI] [Google Scholar]
- Kennedy S, & Bumpass LL (2008). Cohabitation and children’s living arrangements: New estimates from the United States. Demographic Research, 19, 1663–1692. 10.4054/DemRes.2008.19.47 [DOI] [PMC free article] [PubMed] [Google Scholar]
- Killewald A, & Bryan B (2018). Falling behind: The role of inter- and intragenerational processes in widening racial and ethnic wealth gaps through early and middle adulthood. Social Forces, 97, 705–740. [Google Scholar]
- Kuo JC-L, & Raley RK (2016). Diverging patterns of union transition among cohabitors by race/ethnicity and education: Trends and marital intentions in the United States. Demography, 53, 921–935. [DOI] [PMC free article] [PubMed] [Google Scholar]
- Lamidi EO, Manning WD, & Brown SL (2019). Change in the stability of first premarital cohabitation among women in the United States, 1983–2013. Demography, 56, 427–450. [DOI] [PubMed] [Google Scholar]
- Lenhardt RA (2015). Marriage as Black citizenship. Hastings Law Journal, 66, 1317–1364. [Google Scholar]
- Letiecq BL (2019). Surfacing family privilege and supremacy in family science: Toward justice for all. Journal of Family Theory and Review, 11, 398–411. [Google Scholar]
- Lichter DT, Mclaughlin DK, Kephart G, & Landry DJ (1992). Race and the retreat from marriage: A shortage of marriageable men? American Sociological Review, 57, 781–799. [Google Scholar]
- Lichter DT, Price JP, & Swigert JM (2019). Mismatches in the marriage market. Journal of Marriage and Family, 82, 796–809. [Google Scholar]
- Lopoo LM, & Western B (2005). Incarceration and the formation and stability of marital unions. Journal of Marriage and Family, 67, 721–734. [Google Scholar]
- Manning WD (2013). Trends in cohabitation over twenty years of change, 1987–2010 (NCFRM Family Profiles, FP-13–12). Bowling Green, OH: National Center for Family and Marriage Research. Retrieved from https://www.bgsu.edu/content/dam/BGSU/college-of-arts-and-sciences/NCFMR/documents/FP/FP-13-12.pdf [Google Scholar]
- Manning WD, Brown SL, & Payne KK (2014). Two decades of stability and change in age at first union formation. Journal of Marriage and Family, 76, 247–260. [DOI] [PMC free article] [PubMed] [Google Scholar]
- Manning WD, Joyner K, Hemez P, & Cupka C (2019a). Measuring cohabitation in U.S. national surveys. Demography, 56, 1195–1218. [DOI] [PubMed] [Google Scholar]
- Manning WD, & Smock PJ (2005). Measuring and modeling cohabitation: New perspectives from qualitative data. Journal of Marriage and Family, 67, 989–1002. [Google Scholar]
- Manning WD, Smock PJ, & Fettro MN (2019b). Cohabitation and marital expectations among single millennials in the U.S. Population Research and Policy Review, 38, 327–346. [DOI] [PMC free article] [PubMed] [Google Scholar]
- Mare R, & Winship C (1991). Socioeconomic change and the decline of marriage for Blacks and Whites. In Jencks C & Peterson PE (Eds.), The urban underclass (pp. 175–197). Washington, DC: The Brookings Institution. [Google Scholar]
- Martin MA (2006). Family structure and income inequality in families with children, 1976–2000. Demography, 43, 421–445. [DOI] [PubMed] [Google Scholar]
- Martin SP, Astone NM, & Peters HE (2014). Fewer marriages, more divergence: Marriage projections for millennials to age 40 (Report). Washington, DC: The Urban Institute. [Google Scholar]
- McLanahan S (2004). Diverging destinies: How children are faring under the Second Demographic Transition. Demography, 41, 607–627. [DOI] [PubMed] [Google Scholar]
- McLanahan S, & Percheski C (2008). Family structure and the reproduction of inequalities. Annual Review of Sociology, 34, 257–276. [Google Scholar]
- Mernitz S (2018). A cohort comparison of trends in first cohabitation duration in the United States. Demographic Research, 38, 2073–2086. 10.4054/DemRes.2018.38.66 [DOI] [PMC free article] [PubMed] [Google Scholar]
- Musick K, & Michelmore K (2018). Cross-national comparisons of union stability in cohabiting and married families with children. Demography, 55, 1389–1421. [DOI] [PMC free article] [PubMed] [Google Scholar]
- Oppenheimer VK (1988). A theory of marriage timing. American Journal of Sociology, 94, 563–591. [Google Scholar]
- Petersen T (1991). The statistical analysis of event histories. Sociological Methods & Research, 19, 270–323. [Google Scholar]
- Petersen T (1992). Time-aggregation bias in hazard-rate models with covariates. Sociological Methods & Research, 21, 25–51. [Google Scholar]
- Preston SH, Heuveline P, & Guillot M (2000). Demography: Measuring and modeling population processes. Malden, MA: Wiley-Blackwell. [Google Scholar]
- Raley RK (1996). A shortage of marriageable men? A note on the role of cohabitation in Black-White differences in marriage rates. American Sociological Review, 61, 973–983. [Google Scholar]
- Raley RK (2000). Recent trends and differentials in marriage and cohabitation: The United States. In Waite LJ, Bacharach C, Hindin M, Thomson E, & Thornton A (Eds.), The ties that bind: Perspectives on marriage and cohabitation (pp. 19–39). New York, NY: Aldine de Gruyter. [Google Scholar]
- Raley RK, & Sweeney MM (2009). Explaining race and ethnic variation in marriage: Directions for future research. Race and Social Problems, 1, 132–142. [Google Scholar]
- Raley RK, Sweeney MM, & Wondra D (2015). The growing racial and ethnic divide in U.S. marriage patterns. Future of Children, 25(2), 89–109. [DOI] [PMC free article] [PubMed] [Google Scholar]
- Robnett B, & Feliciano C (2011). Patterns of racial-ethnic exclusion by internet daters. Social Forces, 89, 807–828. [Google Scholar]
- Rodgers WL, & Thornton A (1985). Changing patterns of first marriage in the United States. Demography, 22, 265–279. [PubMed] [Google Scholar]
- Rodriguez G, & Trussell J (1980). Maximum likelihood estimation of the parameters of Coale’s model nuptiality schedule from survey data (World Fertility Survey Technical Bulletins, #7). The Hague, the Netherlands: International Statistical Institute. [Google Scholar]
- Ruggles S (2016). Marriage, family systems, and economic opportunity in the USA since 1850. In McHale SM, King V, Van Hook J, & Booth A (Eds.), Gender and couple relationships (National Symposium on Family Issues, Vol. 6, pp. 3–41). New York, NY: Springer. [Google Scholar]
- Sassler S (2004). The process of entering cohabiting unions. Journal of Marriage and Family, 66, 491–505. [Google Scholar]
- Sassler S, & Goldscheider F (2004). Revisiting Jane Austen’s theory of marriage timing: Changes in union formation among American men in the late 20th century. Journal of Family Issues, 24, 139–166. [Google Scholar]
- Sassler S, Michelmore K, & Qian Z (2018). Transitions from sexual relationships into cohabitation and beyond. Demography, 55, 522–534. [DOI] [PMC free article] [PubMed] [Google Scholar]
- Schneider D (2011). Wealth and the marital divide. American Journal of Sociology, 117, 627–667. [DOI] [PubMed] [Google Scholar]
- Schneider D, Harknett K, & Stimpson M (2018). What explains the decline in first marriage in the United States? Evidence from the Panel Study of Income Dynamics, 1969–2013. Journal of Marriage and Family, 80, 791–811. [Google Scholar]
- Schoen R, & Standish N (2001). The retrenchment of marriage: Results from marital status life tables for the United States, 1995. Population and Development Review, 27, 553–563. [Google Scholar]
- Schofer E, & Meyer JW (2005). The worldwide expansion of higher education in the twentieth century. American Sociological Review, 70, 898–920. [Google Scholar]
- Sinning M, Hahn M, & Bauer TK (2008). The Blinder-Oaxaca decomposition for nonlinear regression models. Stata Journal, 8, 480–492. [Google Scholar]
- Smock PJ (2000). Cohabitation in the United States: An appraisal of research themes, findings, and implications. Annual Review of Sociology, 26, 1–20. [Google Scholar]
- South SJ (2001). The variable effects of family background on the timing of first marriage: United States, 1969–1993. Social Science Research, 30, 606–626. [Google Scholar]
- South SJ, & Crowder KD (1999). Neighborhood effects on family formation: Concentrated poverty and beyond. American Sociological Review, 64, 113–132. [Google Scholar]
- South SJ, & Lloyd KM (1992). Marriage opportunities and family formation: Further implications of imbalanced sex ratios. Journal of Marriage and the Family, 54, 440–451. [Google Scholar]
- Stanley AD (1998). From bondage to contract: Wage labor, marriage, and the market in the age of slave emancipation. New York, NY: Cambridge University Press. [Google Scholar]
- Sweeney MM (2002). Two decades of family change: The shifting economic foundations of marriage. American Sociological Review, 67, 132–147. [Google Scholar]
- Sweeney MM (2016). Socioeconomic standing and variability in marriage timing in the twentieth century. Annals of the American Academy of Political and Social Science, 633, 271–291. [Google Scholar]
- Thornton A, Axinn WG, & Xie Y (2007). Marriage and cohabitation. Chicago, IL: University of Chicago Press. [Google Scholar]
- Torr BM (2011). The changing relationship between education and marriage in the United States, 1940–2000. Journal of Family History, 36, 483–503. [DOI] [PMC free article] [PubMed] [Google Scholar]
- Tucker MB, & Mitchell-Kernan C (1996). Trends in African American family formation: A theoretical and statistical overview. In Tucker MB & Mitchell-Kernan C (Eds.), The decline in marriage among African Americans (pp. 3–26). New York, NY: Russell Sage Foundation. [Google Scholar]
- U.S. Census Bureau. (2019). Estimated median age at first marriage, by sex: 1890 to the present (Historical Marital Status Tables, Table MS-2). Retrieved from https://www.census.gov/data/tables/time-series/demo/families/marital.html
- Waite LJ (1995). Does marriage matter? Demography, 32, 483–507. [PubMed] [Google Scholar]
- Wang W, & Parker K (2014). Record share of Americans have never married: As values, economics and gender patterns change (Social & Demographic Trends report). Washington, DC: Pew Research Center. [Google Scholar]
- Williams DT (2019). A call to focus on racial domination and oppression: A response to “Racial and ethnic inequality in poverty and affluence, 1959–2015.” Population Research and Policy Review, 38, 655–663. [DOI] [PMC free article] [PubMed] [Google Scholar]
- Wilson WJ (1978). The declining significance of race: Blacks and changing American institutions. Chicago, IL: University of Chicago Press. [Google Scholar]
- Wilson WJ (1987). The truly disadvantaged: The inner city, the underclass, and public policy. Chicago, IL: University of Chicago Press. [Google Scholar]
- Xie Y, Raymo JM, Goyette K, & Thornton A (2003). Economic potential and entry into marriage and cohabitation. Demography, 40, 351–367. [DOI] [PubMed] [Google Scholar]
- Yamaguchi K (1987). Event history analysis. Sociological Theory and Methods, 2, 61–82. [Google Scholar]
- Zeng Y, Morgan SP, Wang Z, Gu D, & Yang C (2012). A multistate life table analysis of union regimes in the United States: Trends and racial differentials, 1970–2002. Population Research and Policy Review, 31, 207–234. [DOI] [PMC free article] [PubMed] [Google Scholar]
- Zhang Y, & Ang S (2020). Trajectories of union transition in emerging adulthood: Socioeconomic status and race/ethnicity differences in the National Longitudinal Survey of Youth 1997 Cohort. Journal of Marriage and Family, 82, 713–732. [Google Scholar]
- Ziol-Guest KM, & Lee KTH (2016). Parent income-based gaps in schooling: Cross-cohort trends in the NLSYs and the PSID. AERA Open, 2(2). 10.1177/2332858416645834 [DOI] [Google Scholar]
Associated Data
This section collects any data citations, data availability statements, or supplementary materials included in this article.