

Abstract
According to the ISO 14687-2:2019 standard, the water content of H2 fuel for transportation and stationary applications should not exceed 5 ppm (molar). To achieve this water content, zeolites can be used as a selective adsorbent for water. In this work, a computational screening study is carried out for the first time to identify potential zeolite frameworks for the drying of high-pressure H2 gas using Monte Carlo (MC) simulations. We show that the Si/Al ratio and adsorption selectivity have a negative correlation. 218 zeolites available in the database of the International Zeolite Association are considered in the screening. We computed the adsorption selectivity of each zeolite for water from the high-pressure H2 gas having water content relevant to vehicular applications and near saturation. It is shown that due to the formation of water clusters, the water content in the H2 gas has a significant effect on the selectivity of zeolites with a helium void fraction larger than 0.1. Under each operating condition, five most promising zeolites are identified based on the adsorption selectivity, the pore limiting diameter, and the volume of H2 gas that can be dried by 1 dm3 of zeolite. It is shown that at 12.3 ppm (molar) water content, structures with helium void fractions smaller than 0.07 are preferred. The structures identified for 478 ppm (molar) water content have helium void fractions larger than 0.26. The proposed zeolites can be used to dry 400–8000 times their own volume of H2 gas depending on the operating conditions. Our findings strongly indicate that zeolites are potential candidates for the drying of high-pressure H2 gas.
Keywords: zeolites, hydrogen drying, Monte Carlo simulation, adsorption selectivity, hydrogen gas, computational Screening
1. Introduction
The energy demand worldwide is predicted to increase by 23–31% by 2040.1 To meet this demand while reducing carbon emissions, the composition of the world’s energy mix is expected to shift toward the use of alternative energy sources in the future.1 H2 is considered a promising energy carrier, which can be used in fuel cells and in combustion engines.2−5 Currently, H2 is mainly produced from natural gas reforming. H2 can also be produced in a sustainable way via water electrolysis using renewable energy sources.6,7 Due to its low volumetric energy density, to efficiently use H2, it has to be compressed to high-pressures, that is, 350–700 bar.4,8,9 Conventionally, hydrogen is compressed using mechanical compressors.8,10,11 The most commonly used mechanical compressor types for H2 compression are piston, compressed air, and ionic and diaphragm compressors.8
In the past decade, electrochemical H2 compressors (EHCs) have been developed12,13 as an alternative to mechanical compressors. Compared to mechanical compressors, EHCs do not have moving parts that can be damaged during the operation of the device.11,12 Additionally, due to the isothermal compression process, EHCs can be more energetically efficient compared to mechanical compressors based on adiabatic compression.10 HyET Hydrogen B.V.13 has developed an EHC that can compress H2 from ambient pressures to 1000 bar in a single step.13 The working principle of EHC is similar to proton-exchange membrane (PEM)-based fuel cells.14 In the EHC stack, a PEM is placed between the anode and the cathode allowing only protons to permeate from the anode to the cathode side. On the cathode, protons are reduced to molecular H2 at elevated pressures.13,14 Since EHCs rely on the presence of water for the transport of protons through the PEM, the outgoing high-pressure H2 stream has a water content that exceeds the quality requirements of the ISO 14687-2:2019 standard.15 According to this standard, the water content of H2 fuel used in transportation and stationary applications should not exceed 5 ppm (throughout our study, mole-based ppm values are reported). This limit ensures that at high-pressures (e.g., P > 700 bar) and close to ambient temperatures, water remains in the gas phase preventing ice formation, upon expansion, and corrosion of the metallic parts of the storage vessel.16
Rahbari et al.17 investigated the solubility of water in H2 at high-pressures (P = 10–1000 bar) for a wide range of temperatures (T = 283–423 K) using molecular simulations and equation-of-state (EoS) modeling. Additionally, an overview of all available experimental data on the solubility of water in high-pressure H2 was reported.17 It was shown that at the investigated pressure and temperature range, the equilibrium content of water in the gas phase is significantly higher than 5 ppm (molar) (i.e., ISO standard requirement15). Experimental data at high pressures (P > 300 bar) are only available at T = 323 K. The experimentally measured water content at T = 323 K and P = 1013 bar is 280 ppm (mole-based). At the lowest temperature (T = 283 K) and the highest pressure (P = 1000 bar) investigated in that study, the water content of the H2 gas was computed to be 29 ppm.17 This suggests that achieving 5 ppm water content using conventional drying methods, that is, based on cooling or pressure swing, can be very energy-intensive.
As an alternative drying method, selective adsorption of water on porous materials can be considered. Porous materials such as metal–organic frameworks, activated carbons, zeolites, and so forth have been investigated for the drying of different gas streams.18,19 In particular, zeolites are promising candidates for the selective adsorption of water from high-pressure H2 streams due to their high-water adsorption capacity, tuneable hydrophilicity, and high thermal stability, which ensure easy regeneration of the adsorbent upon heating.20,21 Zeolites are nanoporous materials consisting of tetrahedral SiO4 and AlO4 units connected to each other by shared oxygen atoms.22 The Al content of zeolites leads to charge imbalance, which is compensated by the presence of exchangeable nonframework cations, usually alkali or alkaline ions, located in the cavities of the framework.22 An important characteristic of zeolites is the ratio of the number of Si to Al atoms (Si/Al ratio) present in the framework, which determines the hydrophilicty of the structure.23−25 The pore structure of zeolites varies significantly with the different secondary building units formed by the tetrahedral units, such as four-, six-, or eight-member rings, and so forth. Based on the topology of the framework, various types of zeolites can be distinguished, which are commonly denoted with a three letter code, for example, MFI, LTA, and so forth.26 The properties of zeolites, namely, the well-defined pore structure, exchangeable cations, and tuneable hydrophilicity are exploited in several fields of industry such as catalysis,27−29 separation technology,30−40 water purification,25,41−43 and energy storage.44−46 The adsorption of pure water and pure H2 on zeolites has been studied by several research groups both by simulation20,47−53 and experimental techniques.20,48−50,52 In these studies, it was shown that depending on the Si/Al ratio of the framework, zeolites can have either high water- or H2-loading capacities. However, to the best of our knowledge, there is no reported work on the adsorption of binary H2/water mixtures at high-pressures.
In this work, as experimental data are limited, a computational screening study is carried out to identify potential zeolite frameworks for the drying of high-pressure H2 streams. To simulate the adsorption of water/H2 mixtures on zeolites, force-field-based Monte Carlo (MC) simulations are performed. We show that the adsorption selectivity for water increases as the Si/Al ratio decreases. Since a high adsorption selectivity for water is desirable for the drying of high-pressure H2, the Al content of zeolites available in the zeolite database of the International Zeolite Association (IZA) is adjusted to obtain structures with the lowest possible Si/Al ratio while obeying the Löwenstein rule,54 which states that the formation of Al–O–Al bonds is prohibited in zeolites. To identify promising zeolites for the drying of high-pressure H2 gas under conditions relevant to vehicular applications, the H2O/H2 mixture with a water content of 12.3 ppm (molar) at 875 bar and 310 K is considered in this study. The selected operating pressure is based on the conditions typically used at refueling stations for vehicles, where H2 should be stored at P = 875 bar (or higher) to be able to fuel a vehicle within 3–5 min.8,55 According to HyET Hydrogen B.V.,13 the water content of H2 compressed to 875 bar using EHC is approximately 12.3 ppm. This water content does not correspond to the equilibrium solubility of water in H2 gas under these conditions, but it is a representative composition of the outgoing stream from an EHC. Moreover, to obtain a better understanding of the effect of pressure and water content on the adsorption selectivity of zeolite structures, additional water/H2 mixtures with 12.3 and 478 ppm of water at 400 bar and 310 K are considered. The value of 478 ppm is an estimation of the equilibrium solubility of water in H2 at 400 bar and 310 K based on the study of Rahbari et al.17 Promising zeolites for high-pressure H2 drying are identified based on the computed adsorption selectivity for water, the pore limiting diameter (PLD), and the volume of H2 gas that can be dried by 1 dm3 of zeolite. The proposed zeolites can be used to dry 400–8000 times their own volume of H2 gas depending on the operating conditions. Our findings strongly indicate that zeolites with high Al content are potential candidates for the drying of high-pressure H2 gas. To date, most types of zeolites have not been synthesized with the highest possible Al content.56 For example, MFI-type zeolite can be synthesized with a Si/Al ratio of 9.3,57 which is considerably higher than the theoretical minimum (Si/Al ratio = 2). Our findings indicate that the development of new synthetic pathways allowing for the creation of zeolites with a high Al content would be beneficial for high-pressure H2 drying.
The remainder of the paper is structured as follows: in Section 2, details of the simulation methods are explained. In Section 3, the effects of Si/Al ratio, pressure, and water content on the adsorption selectivity, and the selection procedure of the most promising zeolites for high-pressure H2 drying are reported. In Section 4, the conclusions of this study are summarized.
2. Simulation Methodology and Computational Details
2.1. Force Fields
In all simulations, the (12-6) Lennard-Jones (LJ) potential is used for van der Waals interactions between guest–guest and guest–host. The LJ potential is truncated and shifted at 12 Å. No tail corrections are used. The force-field parameters reported by Castillo et al.20 are used to model the zeolite frameworks and the interactions between water and the zeolite atoms. In that study, the guest–host force-field parameters were fitted using the rigid, five-site TIP5P/Ew58 water model. Therefore, the TIP5P/Ew force field is used in all our simulations. In the study by Castillo et al.,20 the LJ parameters for the interactions between water and the framework atoms were fitted to experimentally measured water adsorption isotherms for the LTA4A structure.20 It is important to note that our choice to use these force fields was based on the fact that no transferable force fields for the simulation of adsorption of water onto Al-containing zeolites are currently available (mainly because the relevant experimental data are largely lacking). To model H2 and the interactions of H2 with Si and O atoms of the framework, the parameters reported by Deeg et al.52 are used. These parameters were fitted to experimentally measured H2 adsorption isotherms on pure Si zeolites. To the best of our knowledge, the accuracy of the fitted H2 model for computing bulk properties was not reported. Recently, Bartolomeu and Franco59 reported a new force field, which accurately predicts experimentally measured thermodynamic and transport properties of H2.
In this work, we fitted the LJ parameters for the interaction of H2 with the Al and Na+ atoms of the framework to an experimentally measured H2 adsorption isotherm on the LTA4A structure60 at T = 77 K and P up to 100 kPa. The calculated and experimentally measured adsorption isotherms of H2 are shown in Figure S1 in the Supporting Information. Since these simulations are performed at 77 K, the Feynman–Hibbs effective interaction potential61 is used to account for quantum effects. It can be observed that the computed isotherm is in good agreement with the experiments. Since the diffusion of adsorbates inside zeolites is an important property for separation processes, the diffusion of H2 molecules inside the LTA4A structure is also investigated using these force-field parameters. The relevant discussion can be found in the Supporting Information along with the computed mean-squared displacement of H2 in LTA4A as a function of time (Figure S2). For interactions between unlike interaction sites, the Lorentz–Berthelot combining rules62 are used. In all simulations, electrostatic interactions are described by fixed point charges. The long-range electrostatic interactions are calculated using the Ewald method with a relative precision of 10–6.63 All force-field parameters are listed in Tables S1 and S2 of the Supporting Information.
2.2. Simulation Details
The MC simulations for the calculation of adsorption isotherms are performed using the RASPA software package.64,65 The atomic positions of the zeolite structures are taken from crystallographic files (CIF) of the IZA database26 implemented in the iRASPA visualization package.66 In this database, 231 zeolite structures are included. Among these, 13 structures contain Si atoms coordinated by only three oxygen atoms instead of four. These zeolites were excluded from the screening study. The zeolite structures are considered rigid in all simulations. This is a common practice in the simulation of adsorption of small molecules onto nanoporous materials because it significantly reduces the CPU time.67,68 Recently, it has been shown by Krokidas et al.69 that framework flexibility can affect the diffusion of adsorbates into zeolitic imidazolate frameworks (ZIFs), which is an important property to consider in separation processes. For small non-aromatic molecules, it has been shown that the framework flexibility of zeolites has a small effect on the adsorption properties,67 which are the focus of this study. The Al-containing zeolites were created by randomly exchanging the Si atoms of the original zeolite structure for Al, while obeying the Löwenstein rule.54 The Löwenstein rule54 is an axiom of zeolite science, which is based on the general experimental observation that Al–O–Al bonds are not formed in zeolites. Zeolites obeying the Löwenstein rule are not guaranteed to be stable. In theoretical zeolites with a high Al content, Al atoms may be placed in thermodynamically unfavorable positions while still obeying the Löwenstein rule. This might prevent the synthesis of zeolite. As shown in the literature,70−72 the distribution of Al atoms in certain types of zeolites can affect the adsorption properties such as adsorption loading, diffusion, and so forth. However, at very high Al contents (i.e., Si/Al ratio < 3), the effect of the distribution of Al atoms is expected to be small. The structures with the lowest possible Si/Al ratio were created using the following MC scheme: initially, half of the Si atoms are exchanged for Al (i.e., Si/Al = 1). Consequently, identical changes are carried out during which the Al atoms violating the Löwenstein rule are exchanged with randomly selected Si atoms that are connected to at least one other Si atom via an oxygen atom. If no structure obeying the Löwenstein rule is obtained after 100,000 attempts, then a new structure with one less Al atom is created (i.e., Si/Al > 1) and the exchange of Al atoms is started again. This procedure was performed until a structure obeying the Löwenstein rule is obtained. CIF files containing the obtained structures with the lowest Si/Al ratio are provided as separate files in the Supporting Information.
The charge imbalance of the framework due to the presence of Al atoms is compensated by the insertion of nonframework Na+ cations. In principle, the nonframework cations should be placed at the experimentally measured crystallographic positions.73,74 However, the crystallographic positions of Na+ are not available for most zeolites. Therefore, in this study, the cations are randomly inserted in the framework, and their positions are equilibrated by performing simulations in the canonical (NVT) ensemble at 1000 K. Simulations are performed at T = 1000 K to overcome the energy barrier hindering the motion of cations due to strong electrostatic interactions with the framework. In these simulations, translation (50%) and random reinsertion (50%) trial moves are used. To obtain an equilibrated structure, 500,000 cycles are carried out. A cycle consists of as many MC steps as the number of molecules in the system. A minimum of 20 MC steps are carried out per cycle. Due to random insertions, cations may be placed in positions which should not be accessible, in the so-called pockets. The Zeo++ software package75,76 provides the functionality to identify pockets that should be blocked for a sphere with a certain radius (i.e., probe size). This approach was tested for LTA- and FAU-type zeolites. We observed that by using the ionic radius of Na+ (rNa+ = 1.16 Å) as the probe size, the sodalite cages are blocked in both structures. Based on the reported crystallographic positions of Na+, the sodalite cages should be accessible for Na+ in FAU-type zeolite77 but not in LTA-type zeolite.78 This shows that by using blocking spheres, the inaccessible pockets for Na+ cannot be clearly identified without experimental data. Therefore, in our study, blocking spheres are only used for LTA-type zeolite in which the location of Na+ cations (sodalite cages) are reported experimentally. Since the kinetic diameter of water (2.65 Å) and H2 (2.89 Å) are similar to the window size of most zeolites, for these molecules, no blocking spheres are used, in accordance with other studies.20,50,51
To calculate the adsorption isotherms of H2/water binary mixture on zeolites, MC simulations in the grand-canonical ensemble (μVT) are performed. In these simulations, the following trial moves are used for the cations: translations (50%) and random reinsertions (50%). For the H2 and water molecules, the following trial moves are carried out: translations (20%), rotations (20%), random reinsertions (20%), and particle exchanges with the reservoir (40%). For all structures, 200,000 equilibration cycles are performed, which ensures that the equilibrium loading of the components is reached. To ensure that the equilibrium was reached, the instantaneous adsorption loading of the components in the last 20,000 cycles of equilibration were used. For these 20,000 cycles, block averaging is used with four blocks. The overall mean and standard deviation were calculated from the block averages. The system is considered to be in equilibrium if the standard deviation is smaller than 10%. Using the equilibrated configuration, five independent simulations of 100,000 production cycles are carried out to obtain accurate ensemble averages.
In the grand-canonical ensemble, the simulation box of fixed volume (zeolite structure) is in equilibrium with a reservoir containing a fluid with a constant temperature (T) and a chemical potential (μ). In the RASPA software package,64 the imposed chemical potential is calculated from the fugacity of the fluid. The fugacity coefficients of components are predicted by the Peng–Robinson (PR) EoS.79 Recently, Rahbari et al.17 compared the performance of the PR EoS and MC simulations for predicting the fugacity coefficients of water and H2 in a broad pressure range (10–1000 bar). It was shown that the PR EoS yields inaccurate fugacity coefficients at high-pressures (P > 400 bar), while the fugacity coefficients computed by MC simulations are in reasonable agreement with the experimentally measured data. Therefore, in our study, the fugacity coefficients of water and H2 are calculated by performing MC simulations in the continuous fractional component NPT (CFCNPT) ensemble80 implemented in the BRICK-CFCMC software package.81 In CFCMC simulations, special types of molecules, the so-called fractional molecules, are used. The LJ and electrostatic interactions of these molecules with the rest of the system are scaled by a parameter λ ∈ [0, 1], where λ = 0 means that the fractional molecule does not interact with other molecules and λ = 1 means that the fractional molecule has the same interactions as other molecules of the same type. For calculating fugacity coefficients, it is assumed that the water is infinitely diluted in H2, since only a few ppm of water are present in the H2 gas. The simulation box consists of 512 H2 and one fractional molecule of each component which enables the calculations of the excess chemical potential that can be related to the fugacity coefficient. The detailed derivation of the relations between the fugacity coefficients and the excess chemical potential are presented elsewhere.17,80 The trial moves used in the CFCNPT simulations are selected with the following probabilities: 35% translations, 30% rotations, 1% volume changes, 17% λ changes, and 17% identity changes of the fractional molecule. The simulations consist of 100,000 equilibration and 500,000 production cycles. The calculated fugacity coefficients of components are shown in Table S3 of the Supporting Information. The uncertainty of ensemble averages were calculated as the standard deviation of the mean from five independent simulations.
To identify potential zeolite structures for the drying of high-pressure H2 streams, the adsorption selectivity (SH2O,H2) is used as a criterion. The adsorption selectivity is most commonly defined as the fraction of the component’s mole fractions in the adsorbed phase. By using this definition, division by zero can occur if one of the components is not present in the adsorbed phase. Therefore, in this work, the adsorption selectivity is defined as the percentage of water adsorbed on the zeolite
| 1 |
where NH2O and NH2 are the number of water and H2 molecules adsorbed per unit cell, respectively. Using this definition, the adsorption selectivity of zeolites which do not adsorb any H2 molecules can be handled. In this case, the adsorption selectivity is 100%. The adsorption selectivities are computed for water/H2 mixtures with 12.3 and 478 ppm water content. The value of 478 ppm is an estimation of the equilibrium content of water in H2 at 400 bar and 310 K based on the study of Rahbari et al.17 To the best of our knowledge, there is no available experimental data under these conditions. The solubility is estimated based on the computed solubilities reported in ref (17). In that study, the solubility of water at T = 323, 366, and 423 K was reported for various water force fields, that is TIP3P,82 TIP4P/2005,83 and TIP5P/Ew,58 while at T = 310 K, the authors used only TIP3P. Since in our study, the TIP5P/Ew force field is used at T = 310 K, the solubility of water is estimated based on the solubilities reported with TIP3P. In particular, we assume that the ratio of solubilities computed with TIP3P and TIP5P/Ew force fields at the same pressure is independent of the temperature. Thus, the ratio of solubilities predicted with the two force fields at T = 423 K is calculated (i.e., ca. 0.62) and assumed to be equal with the ratio at T = 310 K. Using the available solubility data reported by Rahbari et al.,17 we estimate the solubility of water in H2 at T = 310 K and P = 400 bar with the TIP5P/Ew model to be 478 ppm.
The helium void fraction (ϕHe) of each zeolite is calculated using Widom’s test particle insertion method63 using the RASPA software package.64,65 In this work, the reported helium void fractions are computed for zeolites with the lowest Si/Al ratio in the presence of Na+ cations. The geometrical properties of zeolite structures, that is, PLD, largest cavity diameter (LCD), and accessible surface area (ASA) are calculated using the Zeo++ software package.75,76
3. Results and Discussion
3.1. Effect of Si/Al Ratio
In Figure 1, the adsorption selectivities of FAU-, MOR-, MFI-, FER-, CHA-, and LTA-type zeolites for water are shown for a water/H2 mixture with 12.3 ppm water content at P = 875 bar and T = 310 K as a function of Si/Al ratio of the framework. As expected, for all structures, the adsorption selectivity increases with the decrease of the Si/Al ratio. This is due to the increasing hydrophilicity of the structure. The FAU-, CHA-, and LTA-type zeolites show preferential adsorption for water (SH2O,H2 > 50%) only for relatively high Al contents, that is, Si/Al < 4. Figure 1 also shows that the difference in adsorption selectivities of MFI-type zeolites that can be experimentally synthesized (i.e., Si/Al = 9.357) with the theoretical ones having low Si/Al ratios (>8) can be as high as 60%. This clearly indicates that the progress in the synthesis techniques of zeolites allowing for the creation of structures with high Al contents would be beneficial for high-pressure H2 drying.
Figure 1.

Adsorption selectivity of FAU-, MOR-, MFI-, FER-, CHA-, and LTA-type zeolites for water from a water/H2 mixture with 12.3 ppm water content as a function of the Si/Al ratio of the framework, at P = 875 bar and T = 310 K. The error bars indicate the standard deviation of the mean.
To obtain a better understanding of the adsorption mechanism, the preferred adsorption sites of water and H2 are identified based on the computed density plots. The simulation box is divided into a 3D grid, and the number of H2O and H2 molecules and the number of Na+ cations at the grid points are calculated from 200 simulation snapshots. The number of occurrences of each species in the snapshots is summed along the z-axis of the grid and normalized to a [0, 1] interval. The obtained 2D grid of the normalized occurrences is referred to as the normalized density corresponding to the relative probability of finding the species at a grid point. In Figure 2a,b, the normalized densities of H2O, H2, and Na+ on MFI-type zeolite without Al and with the lowest possible Si/Al ratio, respectively, are shown on the xy plane for a system at P = 875 bar, T = 310 K, and yH2O = 12.3 ppm. MFI-type zeolites consist of straight and zig-zag channels connected via intersections. These characteristics can be identified in Figure 2c: the straight channels are perpendicular to the xz plane and the zigzag channels are located in the xz plane.26 From Figure 2a (Si/Al ratio → ∞), it becomes clear that practically only H2 (black color) is adsorbed onto the zeolite. This is caused by the highly hydrophobic nature of pores due to the absence of Al atoms. As shown clearly, H2 molecules are absorbed onto all pores, having a slightly higher occurrence at the center of the intersection of straight and zigzag channels than at other parts of zeolite. From Figure 2b (Si/Al ratio = 2), it can be observed that practically only water molecules (red color) are adsorbed. This is expected due to the high Al content of the structure. In Figure S3 in the Supporting Information, the radial distribution functions (RDFs) are shown for the oxygen atoms of water molecules with the Na+ cations on MOR-, MFI-, LTA-, and FAU-type zeolites having the lowest possible Si/Al ratio. In Figures 2b and S3, it can be observed that the water molecules are preferentially adsorbed near the wall of the zeolite and around the Na+ cations.
Figure 2.

Normalized densities of H2O (red), H2 (black), and Na+ (green) on the xy plane for MFI-, MOR-, LTA-, and FAU-type zeolites without and with the maximum amount of Al atoms. (a,d,g,j) show the normalized densities for pure silicon MFI-, MOR-, LTA- and FAU-type zeolites, respectively. (b,e,h,k) show the normalized densities for MFI-, MOR-, LTA- and FAU-type zeolites with the lowest Si/Al ratio, respectively. The pore structures of (c) MFI-, (f) MOR-, (i) LTA-, and (l) FAU-type zeolites represented by the adsorption surface computed with water as a probe molecule. The simulations were carried out at P = 875 bar, T = 310 K, and yH2O = 12.3 ppm. The representations of the pore structures are created with the iRASPA software package.66
In Figure 2d,e, the normalized densities of H2O, H2, and Na+ on MOR-type zeolite without Al and with the lowest possible Si/Al ratio are shown, respectively, on the xy plane for a system at P = 875 bar, T = 310 K, and yH2O = 12.3 ppm. As shown in Figure 2f, in MOR-type zeolites, two characteristic parts can be identified, that is, the large main channels formed by the 12-membered rings which are located along the z-axis, and the small side pockets connected to the main channels by 8-membered rings are located along the y-axis. As expected, on the pure Si structure (see Figure 2d), only H2 is adsorbed because of its hydrophobic nature. H2 molecules are adsorbed throughout the structure with a slightly higher occurrence at the walls of the main channel. As shown in Figure 2e, considerably more water than H2 is adsorbed (SH2O,H2 = 88%) on MOR-type zeolite with the lowest Si/Al ratio. The adsorbed H2 molecules are preferentially located at the intersection of the main channel and at the 8-membered ring connecting the main channels to the side pockets. The different adsorption location of the H2 molecules is caused by the presence of water and Na+ cations in the structure. The water molecules are clustered around the Na+ cations which are located at the center of the main channels and side pockets. This is further substantiated from Figure S3 in the Supporting Information in which the RDFs are shown for the oxygen atoms of water molecules with the Na+ cations on MOR-type zeolite having the lowest Si/Al ratio.
In Figure 2g,h, the normalized densities of H2O, H2, and Na+ on LTA-type zeolite without Al and with the lowest Si/Al ratio are shown on the xy plane at P = 875 bar, T = 310 K, and yH2O = 12.3 ppm. As shown in Figure 2i, the LTA-type zeolite consists of small sodalite cages connected to each other by four-membered rings. The void space between the sodalite cages is called the alpha cage. The alpha cages are connected to each other by eight-membered rings and are larger than the sodalite cages. Similar to MFI- and MOR-type zeolites, only H2 is adsorbed onto pure Si LTA-type zeolite (see Figure 2g). The H2 molecules are adsorbed onto both the sodalite and alpha cages of the LTA-type zeolite with a preference toward the center of the alpha cage. As expected, considerably more water than H2 is adsorbed onto the LTA-type zeolite having the lowest Si/Al ratio due to the hydrophilicity of the structure (see Figure 2h). From Figure 2h, it can be observed that H2 is preferentially adsorbed at the center of the alpha cage and the sodalite cages. The water molecules are clustered around the Na+ ions which are located near the center of the alpha cages. This is further substantiated in the respective RDF shown in Figure S3 in the Supporting Information.
In Figure 2j,k, the normalized densities of H2O, H2, and Na+ on FAU-type zeolite without Al and with the lowest Si/Al ratio are shown on the xy plane for a system at P = 875 bar, T = 310 K, and yH2O = 12.3 ppm. As shown in Figure 2l, similar to LTA-type zeolite, FAU-type zeolite consists of sodalite cages, with the difference that the cages of FAU are connected by six-membered instead of four-membered rings. The alpha cages of FAU-type zeolite are similar in size to the LTA-type zeolite but are connected to each other by 12-membered rings instead of 8-membered rings. Similar to the other investigated zeolites, only H2 is adsorbed onto the pure Si FAU-type zeolite (see Figure 2j). H2 molecules have the same preferential adsorption site on the pure Si FAU-type zeolite as on LTA-type zeolite, that is, at the center of the alpha cage. As expected, considerably more water than H2 is adsorbed onto the FAU-type zeolite with the lowest Si/Al ratio due to the hydrophilicity of the structure (see Figure 2k). From Figure 2k, it can be observed that H2 is preferentially adsorbed at the center of the alpha cage. The water molecules are clustered around the Na+ ions which are located around the center of the sodalite and alpha cages. This can also be concluded from the respective RDFs shown in Figure S3 in the Supporting Information.
MFI- and MOR-type zeolites can be saturated by adsorption of water around the Na+ cations leaving no available space for the adsorption of H2. Due to their higher accessible volume, LTA- and FAU-type zeolites are not saturated by water, and thus, H2 can be adsorbed at its preferential adsorption location. This shows that the presence of nonframework Na+ cations is advantageous for the adsorption selectivity of zeolites for water. The Na+ cations occupy a significant amount of pore space and promote the adsorption of water, which further limits the available space for the adsorption of H2. Therefore, for high-pressure H2 drying, zeolites with a high Na+ (Al) content are preferred. These findings suggest that the adsorption selectivity of Al-containing structures for water is correlated with the available free space in pores containing nonframework Na+ cations.
3.2. Screening of Zeolites for High-Pressure H2 Drying
In Figure 3, the computed adsorption selectivities of water (SH2O,H2) for each investigated zeolite structure for 12.3 and 478 ppm water contents at P = 400 and 875 bar and T = 310 K are shown as a function of helium void fraction (ϕHe). It is clear that structures with low-helium void fractions have high adsorption selectivity for water. This finding is in line with the observation that structures with less free space can be saturated with water, which is adsorbed close to the Na+ cations hindering the adsorption of H2. By comparing the adsorption selectivities calculated for the water/H2 mixtures with 12.3 ppm water content at P = 400 (see Figure 3a) with the corresponding selectivities at P = 875 bar (see Figure 3c), the effect of fluid pressure can be observed. The average difference between the adsorption selectivities at the two pressures is ca. 2%. This means that the pressure of the gas phase has limited effect on the adsorption selectivity. The effect of water content of the H2 gas on the adsorption selectivity can be observed in Figure 3a,b, in which the adsorption selectivities are shown for water/H2 mixtures with 12.3 and 478 ppm water contents at P = 400 bar and T = 310 K. The difference between the adsorption selectivities of a structure for the two water fractions can be up to 50%. For example, the adsorption selectivity of RWY-type zeolite for the mixture with 12.3 ppm water content is 27%, which corresponds to the adsorption loading of 33 H2 and 12 water molecules per unit cell. The adsorption selectivity of the same zeolite with 478 ppm water content is 77%, which corresponds to the adsorption loading of 18 H2 and 58 water molecules per unit cell, respectively. It can be seen that the adsorption loading of H2 and water at yH2O = 478 ppm are ca. half and five times the loadings at yH2O = 12.3 ppm, respectively. Evidently, the effect of water content is only significant for structures with helium void fractions larger than 0.1. This is caused by the formation of water clusters in the larger pores of the structure. Water cluster formation is inhibited at low yH2O since the amount of adsorbed water cannot saturate the pores. However, at high yH2O, sufficient number of water molecules can be adsorbed from the H2 gas to fill the larger pores.
Figure 3.

Computed adsorption selectivities (SH2O,H2) of the 218 zeolite structures for water at (a) P = 400 bar, T = 310, and yH2O = 12.3 ppm; (b) P = 400 bar, T = 310, and yH2O = 478 ppm; and (c) P = 875 bar, T = 310, and yH2O = 12.3 ppm conditions as a function of helium void fraction of the structures. The helium void fractions are calculated for zeolites containing Na+ cations using Widom’s test particle insertion method.63 The Si/Al ratio of each framework type is listed in Table S7 in the Supporting Information. The colors represent the Si/Al ratio of structures.
In Figure 4, RDFs are shown for the oxygen atoms of water molecules, H2 molecules with Na+ cations, and oxygen atoms of water molecules with Na+ cations for FAU- and BSV-type zeolites with Si/Al ratio = 1 under the three operating conditions: (a,d) P = 400 bar and yH2O = 12.3 ppm, (b,e) P = 400 bar and yH2O = 478 ppm, and (c,f) P = 875 bar and yH2O = 12.3 ppm. In all cases, the water molecules are clustered around the Na+ cations, as indicated by the strong peaks in the RDFs. From Figure 4a,c, it can be observed that the calculated RDFs are almost identical. This observation is in line with our finding presented earlier, that is, the pressure of the gas phase has a negligible effect on the selectivity of zeolite for water. By comparing the RDFs calculated for water contents of 12.3 and 478 ppm, it can be observed that water molecules are less likely to cluster around Na+ cations and more probable to form water clusters at a higher water content of the gas phase. This phenomenon cannot be observed for the BSV-type zeolite (Figure 4d–f), which has smaller pores than FAU-type zeolite. The RDFs calculated for the BSV-type zeolite are almost identical under all investigated operating conditions (see Figure 4d–f). This is due to the small size of the pores which are saturated with water under all conditions investigated.
Figure 4.

RDFs for the oxygen atoms of water molecules (black), H2 molecules with Na+ cations (red), and oxygen atoms of water molecules with Na+ cations (blue). (a) FAU-type zeolite at P = 400 bar, T = 310 K, and yH2O = 12.3 ppm; (b) FAU-type zeolite at P = 400 bar, T = 310 K, and yH2O = 478 ppm; (c) FAU-type zeolite at P = 875 bar, T = 310 K, and yH2O = 12.3 ppm; (d) BSV-type zeolite at P = 400 bar, T = 310 K, and yH2O = 12.3 ppm; (e) BSV-type zeolite at P = 400 bar, T = 310 K, and yH2O = 478 ppm; and (f) BSV-type zeolite at P = 875 bar, T = 310 K, and yH2O = 12.3 ppm. The Si/Al ratio of BSV- and FAU-type zeolites are 1.0.
Besides the adsorption selectivity for water, the size of the system used for H2 drying also plays an important role. Therefore, in this study, the volume of H2 gas that can be dried by 1 dm3 of zeolite structure (VH2) is considered as a criterion to identify potential zeolites for the drying of high-pressure H2 gas. In Figure 5, the volume of H2 gas that can be dried by 1 dm3 of zeolite at P = 400 and 875 bar and T = 310 K is shown as a function of helium void fraction. It can be observed that the VH2 is nearly twice as high at P = 400 bar (see Figure 4a) compared to that at P = 875 bar (see Figure 4c). This difference is mainly caused by the different densities of H2 under the two conditions (ρH2 = 25.2 and 44.6 kg m–3). The amount of H2 gas that can be dried increases with the helium void fraction. However, the adsorption selectivity of structures with ϕHe > 0.1 tends to be lower than 85%. This means that a significant amount of H2 is also adsorbed onto zeolite, which is undesirable for H2-storage applications. To identify promising zeolites for the drying of high-pressure H2, only structures with adsorption selectivity higher than 99% are considered. Moreover, to ensure that water molecules can diffuse along the structure and adsorb, only structures with PLD larger than the kinetic diameter of water (dkinetic = 2.65 Å) are considered. Based on these criteria, the five best performing structures are identified for each studied condition. The identified frameworks for the drying of H2 with 12.3 ppm water content at P = 400 and P = 875 bar are almost identical, that is BSV-, ASV-, PON-, and MFI-type zeolites. Additionally, at P = 400 and P = 875 bar, STO- and AFN-type zeolites are identified, respectively. For drying H2 gas having 478 ppm water content at P = 400 bar, ITT-, SBE-, SBS-, FAU-, and SBT-type zeolites are found to be the best. In Figure 6, atomistic representations of the best performing structures are shown.
Figure 5.

The volume of H2 gas (VH2) that can be dried by 1 dm3 of zeolite structure at (a) P = 400 bar, T = 310, and yH2O = 12.3 ppm; (b) P = 400 bar, T = 310, and yH2O = 478 ppm; and (c) P = 875 bar, T = 310, and yH2O = 12.3 ppm. Data are plotted as a function of helium void fraction of framework types. The helium void fractions are calculated for zeolites containing Na+ cations using Widom’s test particle insertion method.63 The Si/Al ratio of each framework type is listed in Table S7 in the Supporting Information. The colors represent the adsorption selectivity of the structure for water.
Figure 6.
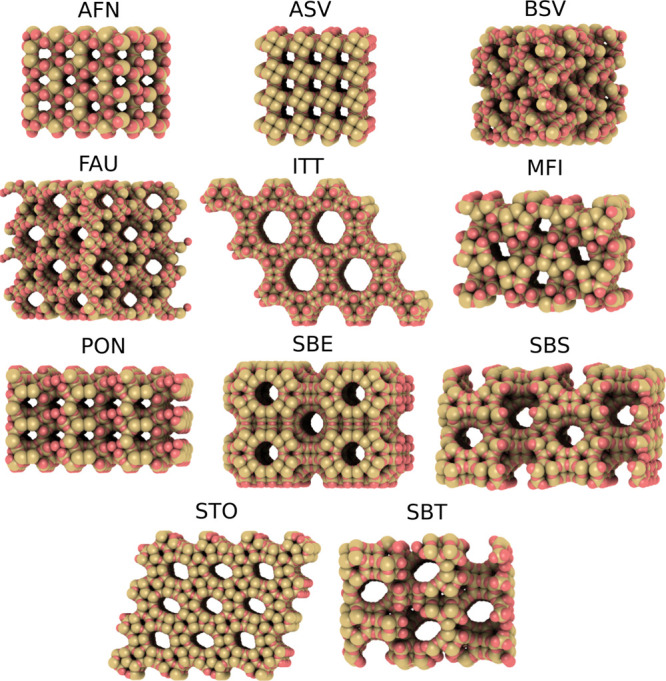
Atomistic representations of the 11 best-performing zeolite framework types for high-pressure H2 drying. The graphical representation is created with iRASPA.66
In Table 1, the 11 best performing structures and their helium void fraction, PLD, LCD, ASA, adsorption selectivities, and volume of H2 that 1 dm3 of structure can dry are listed. The zeolites identified for the drying of H2 gas with 12.3 ppm water content have helium void fractions in the range from 0.01 to 0.07. In contrast, all the identified structures at the higher water content have helium void fractions larger than 0.26. This difference is caused by the higher adsorption selectivity of zeolites with more free space (ϕHe > 0.1) at higher water contents (see Figure 3a,b). For example, the adsorption selectivity of ITT-type zeolite (which has a ϕHe = 0.33) for water is 58.8% at P = 400 bar and yH2O = 12.3 ppm, while it is 99.4% at P = 400 bar and ppm. A similar tendency can be observed for the structures, which were identified for the case of yH2O = 478 ppm. The ASA of the yH2O = 478 structures shows the same trend as the helium void fraction. The structures identified for the case of lower water content have consistently lower ASA than the ones identified for P = 400 bar and yH2O = 478 ppm. It can also be observed that the LCD of the structures identified for the case of higher water content is on average twice as large as of the structures identified for the conditions with lower water contents. This is in line with the finding that water clusters can be formed in the larger pores of the zeolites for higher water contents. It can be seen that the identified zeolite structures can be used to dry 400–8 000 times their own volume of H2 gas depending on the operating conditions.
Table 1. List of Zeolites That are Identified as the Most Promising Structures for High-Pressure H2 Dryinga.
|
P = 400 bar, yH2O = 12.3 ppm |
P = 400 bar, yH2O = 478 ppm |
P = 875 bar, yH2O = 12.3 ppm |
|||||||||
|---|---|---|---|---|---|---|---|---|---|---|---|
| name | Si/Al ratio | ϕHe | PLD/[Å] | LCD/[Å] | ASA/[m2 cm–3] | SH2O,H2/[%] | VH2/[dm3] | SH2O,H2/[%] | VH2/[dm3] | SH2O,H2/[%] | VH2/[dm3] |
| BSV | 1.0 | 0.01 | 3.44 | 4.77 | 1367 | 100 | 8298 | 100 | 247 | 100 | 4917 |
| ASV | 1.0 | 0.01 | 4.03 | 4.95 | 1112 | 100 | 8166 | 100 | 225 | 100 | 4702 |
| PON | 1.0 | 0.03 | 3.9 | 4.5 | 1147 | 100 | 7629 | 100 | 234 | 100 | 4383 |
| MFI | 2.0 | 0.06 | 4.3 | 5.94 | 1272 | 99.4 | 6896 | 100 | 219 | 99.2 | 4131 |
| STO | 1.5 | 0.07 | 5.61 | 6.4 | 888 | 99.5 | 6475 | 100 | 195 | 99.3 | 3822 |
| AFN | 1.0 | 0.04 | 3.08 | 4.75 | 1249 | 99.4 | 6927 | 100 | 228 | 98.7 | 4185 |
| ITT | 1.6 | 0.33 | 11.6 | 12.77 | 1598 | 58.8 | 5899 | 99.4 | 452 | 56 | 3852 |
| SBE | 1.0 | 0.26 | 6.83 | 12.1 | 1572 | 80 | 9078 | 99.4 | 430 | 84.1 | 6459 |
| SBS | 1.0 | 0.26 | 6.87 | 10.98 | 1618 | 85.4 | 10766 | 99.8 | 430 | 86.9 | 6887 |
| FAU | 1.0 | 0.29 | 6.95 | 10.7 | 1488 | 77.1 | 9008 | 99.4 | 427 | 79.3 | 5980 |
| SBT | 1.0 | 0.27 | 6.94 | 10.4 | 1629 | 84.5 | 10683 | 99.8 | 427 | 86.1 | 6758 |
The reported properties are helium void fraction (ϕHe), PLD, LCD, ASA, adsorption selectivity (SH2O,H2), and the volume of H2 that 1 dm3 of structure can dry (VH2).
As a next step, our computational findings should be verified by experimental measurements. Among the identified zeolite types, FAU-type zeolites can be synthesized with a Si/Al ratio near 1, which are usually denoted zeolite X. The adsorption loading from binary water/H2 mixtures under the investigated conditions could be measured on this zeolite. In the case of the rest of the identified zeolites, measurements could be carried out on the structures with the lowest available Si/Al ratio and compared with our computational findings.
4. Conclusions
The performance of 218 zeolites is investigated for the drying of high-pressure H2 gas. The effect of Si/Al ratio on the adsorption selectivity of six zeolite structures for water is also studied. We show that structures with the lowest possible Si/Al ratio have the highest adsorption selectivity for water. To obtain a better understanding of the adsorption mechanism, the preferred adsorption sites of H2 and water on MFI-, MOR-, LTA-, and FAU-type zeolites without Al and with the lowest Si/Al ratio are investigated. It is shown that in the structures with a high Al content, water is adsorbed close to the Na+ cations. For structures with a small free space (MFI- and MOR-type zeolites), the structures are saturated by water molecules, thus hindering the adsorption of H2. On structures with larger pores (FAU- and LTA-type zeolites), water cannot saturate the pores, thus, H2 can also be adsorbed. The adsorption selectivities of 218 structures with the lowest Si/Al ratio are computed under three operating conditions relevant to high-pressure H2 drying: (1) P = 400 bar, T = 310 K, and yH2O = 12.3 ppm; (2) P = 400 bar, T = 310 K, and yH2O = 478 ppm; and (3) P = 875 bar, T = 310 K, and yH2O = 12.3 ppm. It is shown that the gas pressure has only limited effect on the adsorption selectivity of zeolites. In sharp contrast, the water content of the H2 gas has a significant effect on the adsorption selectivity of zeolites with ϕHe > 0.1. This phenomenon is caused by water clustering in larger pores. The five most promising zeolites based on the volume of H2 that can be dried by 1 dm3 of zeolite, the PLD and the adsorption selectivity of the structure are identified under each studied operating condition. It is shown that at low water concentrations in the gas phase, structures with helium void fractions smaller than 0.07 are preferred. The structures identified in the case of high water contents have helium void fractions larger than 0.26. The structures identified for lower water contents have consistently lower ASAs than the ones identified for P = 400 bar and yH2O = 478 ppm. It is also shown that the LCDs of the structures identified for high water contents (478 ppm) are on average twice as large as for the structures identified for low water contents (12.3 ppm). Our findings indicate that the volume of H2 that can be dried by zeolites can be up to 8000 times the volume of the zeolite framework. To date, most types of zeolites have not been synthesized with the highest possible Al content.56 For example, MFI-type zeolite can be synthesized57 for the Si/Al ratio of 9.3, which is considerably higher than the theoretical minimum (i.e., Si/Al ratio = 2). We show that the difference in the adsorption selectivities of the already synthesized MFI-type zeolites (Si/Al ratio = 9.3) with the ones having low Si/Al ratios can be as high as 60%. Our findings indicate that the development of new synthetic pathways allowing for the creation of zeolites with a high Al content would be beneficial for high-pressure H2 drying.
Acknowledgments
This work was sponsored by NWO Exacte Wetenschappen (Physical Sciences) for the use of supercomputer facilities, with financial support from the Nederlandse Organisatie voor Wetenschappelijk Onderzoek (Netherlands Organisation for Scientific Research, NWO). T.J.H.V. acknowledges NWO-CW (Chemical Sciences) for a VICI grant.
Supporting Information Available
The Supporting Information is available free of charge at https://pubs.acs.org/doi/10.1021/acsami.0c20892.
Adsorption isotherms of H2 on the LTA4A structure, mean-squared displacement of H2 on the LTA4A structure, fugacity coefficients of water and H2 at P = 400 and 875 bar and T = 310 K, force-field parameters for the framework and adsorbates, and adsorption selectivity and geometrical descriptors for each zeolite type (PDF)
CIF files of Al-exchanged zeolites (ZIP)
The authors declare no competing financial interest.
Supplementary Material
References
- International Energy Agency . World Energy Outlook 2019. Available at https://www.iea.org/reports/world-energy-outlook-2019 (13 Oct, 2020).
- Abe J. O.; Popoola A. P. I.; Ajenifuja E.; Popoola O. M. Hydrogen Energy, Economy and Storage: Review and Recommendation. Int. J. Hydrogen Energy 2019, 44, 15072–15086. 10.1016/j.ijhydene.2019.04.068. [DOI] [Google Scholar]
- International Energy Agency . The Future of Hydrogen. Available at https://www.iea.org/reports/the-future-of-hydrogen (13 Oct, 2020).
- Niaz S.; Manzoor T.; Pandith A. H. Hydrogen Storage: Materials, Methods and Perspectives. Renewable Sustainable Energy Rev. 2015, 50, 457–469. 10.1016/j.rser.2015.05.011. [DOI] [Google Scholar]
- Singh S. A.; Vishwanath K.; Madras G. Role of Hydrogen and Oxygen Activation over Pt and Pd-Doped Composites for Catalytic Hydrogen Combustion. ACS Appl. Mater. Interfaces 2017, 9, 19380–19388. 10.1021/acsami.6b08019. [DOI] [PubMed] [Google Scholar]
- Jia N.; Liu Y.; Wang L.; Chen P.; Chen X.; An Z.; Chen Y. 0.2 V Electrolysis Voltage-Driven Alkaline Hydrogen Production with Nitrogen-Doped Carbon Nanobowl-Supported Ultrafine Rh Nanoparticles of 1.4 nm. ACS Appl. Mater. Interfaces 2019, 11, 35039–35049. 10.1021/acsami.9b13586. [DOI] [PubMed] [Google Scholar]
- Tong X.; Ovtar S.; Brodersen K.; Hendriksen P. V.; Chen M. A 4 × 4 cm2 Nanoengineered Solid Oxide Electrolysis Cell for Efficient and Durable Hydrogen Production. ACS Appl. Mater. Interfaces 2019, 11, 25996–26004. 10.1021/acsami.9b07749. [DOI] [PubMed] [Google Scholar]
- Adolf J.; Balzer C.; Louis J.. Energy of the Future? Sustainable Mobility through Fuel Cells and H2; Shell Deutschland Oil GmbH, 2017. [Google Scholar]
- Bouwman P. Electrochemical Hydrogen Compression (EHC) Solutions for Hydrogen Infrastructure. Fuel Cell. Bull. 2014, 2014, 12–16. 10.1016/s1464-2859(14)70149-x. [DOI] [Google Scholar]
- Rhandi M.; Trégaro M.; Druart F.; Deseure J.; Chatenet M. Electrochemical Hydrogen Compression and Purification versus Competing technologies: Part I. Pros and Cons. Chin. J. Catal. 2020, 41, 756–769. 10.1016/s1872-2067(19)63404-2. [DOI] [Google Scholar]
- Wipke K.; Sprik S.; Kurtz J.; Ramsden T.; Ainscough C.; Saur G.. National Fuel Cell Electric Vehicle Learning Demonstration Final Report, Contract 2012; p 303.
- Zou J.; Han N.; Yan J.; Feng Q.; Wang Y.; Zhao Z.; Fan J.; Zeng L.; Li H.; Wang H. Electrochemical Compression Technologies for High-Pressure Hydrogen: Current Status, Challenges and Perspective. Electrochem. Energy Rev. 2020, 3, 690–729. 10.1007/s41918-020-00077-0. [DOI] [Google Scholar]
- HyET Hydrogen BV. Available at https://hyet.nl/hydrogen (13 Oct, 2020).
- Bampaou M.; Panopoulos K. D.; Papadopoulos A. I.; Seferlis P.; Voutetakis S. An Electrochemical Hydrogen Compression Model. Chem. Eng. Trans. 2018, 70, 1213–1218. [Google Scholar]
- International Organization for Standardization . Hydrogen Fuel, Product Specification, Part 2: Proton Exchange Membrane (PEM) Fuel Cell Applications for Road Vehicles. Available at www.iso.org/committee/54560/x/catalogue/ (13 Oct, 2020).
- Ligen Y.; Vrubel H.; Girault H. Energy Efficient Hydrogen Drying and Purification for Fuel Cell Vehicles. Int. J. Hydrogen Energy 2020, 45, 10639–10647. 10.1016/j.ijhydene.2020.02.035. [DOI] [Google Scholar]
- Rahbari A.; Brenkman J.; Hens R.; Ramdin M.; van den Broeke L. J. P.; Schoon R.; Henkes R.; Moultos O. A.; Vlugt T. J. H. Solubility of Water in Hydrogen at High Pressures: A Molecular Simulation Study. J. Chem. Eng. Data 2019, 64, 4103–4115. 10.1021/acs.jced.9b00513. [DOI] [Google Scholar]
- Sircar S.; Golden T. C.; Rao M. B. Activated Carbon for Gas Separation and Storage. Carbon 1996, 34, 1–12. 10.1016/0008-6223(95)00128-x. [DOI] [Google Scholar]
- Seo Y.-K.; Yoon J. W.; Lee J. S.; Hwang Y. K.; Jun C.-H.; Chang J.-S.; Wuttke S.; Bazin P.; Vimont A.; Daturi M.; Bourrelly S.; Llewellyn P. L.; Horcajada P.; Serre C.; Férey G. Energy-Efficient Dehumidification over Hierachically Porous Metal-Organic Frameworks as Advanced Water Adsorbents. Adv. Mater. 2012, 24, 806–810. 10.1002/adma.201104084. [DOI] [PubMed] [Google Scholar]
- Castillo J. M.; Silvestre-Albero J.; Rodriguez-Reinoso F.; Vlugt T. J. H.; Calero S. Water Adsorption in Hydrophilic Zeolites: Experiment and Simulation. Phys. Chem. Chem. Phys. 2013, 15, 17374–17382. 10.1039/c3cp52910j. [DOI] [PubMed] [Google Scholar]
- Gómez-Álvarez P.; Calero S. Insights into the Microscopic Behaviour of Nanoconfined Water: Host Structure and Thermal Effects. CrystEngComm 2015, 17, 412–421. 10.1039/c4ce01335b. [DOI] [Google Scholar]
- Mortier W. J.; Schoonheydt R. A. Surface and Solid State Chemistry of Zeolites. Prog. Solid State Chem. 1985, 16, 1–125. 10.1016/0079-6786(85)90002-0. [DOI] [Google Scholar]
- Ng E.-P.; Mintova S. Nanoporous Materials with Enhanced Hydrophilicity and High Water Sorption Capacity. Microporous Mesoporous Mater. 2008, 114, 1–26. 10.1016/j.micromeso.2007.12.022. [DOI] [Google Scholar]
- Khalid M.; Joly G.; Renaud A.; Magnoux P. Removal of Phenol from Water by Adsorption Using Zeolites. Ind. Eng. Chem. Res. 2004, 43, 5275–5280. 10.1021/ie0400447. [DOI] [Google Scholar]
- Jiang N.; Erdős M.; Moultos O. A.; Shang R.; Vlugt T. J. H.; Heijman S. G. J.; Rietveld L. C. The Adsorption Mechanisms of Organic Micropollutants on High-silica Zeolites Causing S-shaped Adsorption Isotherms: An Experimental and Monte Carlo Simulation Study. Chem. Eng. J. 2020, 389, 123968. 10.1016/j.cej.2019.123968. [DOI] [Google Scholar]
- Baerlocher C.; McCusker L.. Database of Zeolite Structures. Available at http://www.iza-structure.org/databases/ (13 Oct, 2020).
- Li L.; Wang Q.; Liu H.; Sun T.; Fan D.; Yang M.; Tian P.; Liu Z. Preparation of Spherical Mordenite Zeolite Assemblies with Excellent Catalytic Performance for Dimethyl Ether Carbonylation. ACS Appl. Mater. Interfaces 2018, 10, 32239–32246. 10.1021/acsami.8b11823. [DOI] [PubMed] [Google Scholar]
- Di Renzo F. Zeolites as Tailor-made Catalysts: Control of the Crystal Size. Catal. Today 1998, 41, 37–40. 10.1016/s0920-5861(98)00036-4. [DOI] [Google Scholar]
- Hölderich W.; van Bekkum H. In Introduction to Zeolite Science and Practice; van Bekkum H., Flanigen E., Jansen J., Eds.; Studies in Surface Science and Catalysis; Elsevier, 1991; Vol. 58, pp 631–726. [Google Scholar]
- Wang S.; Bai P.; Wei Y.; Liu W.; Ren X.; Bai J.; Lu Z.; Yan W.; Yu J. Three-Dimensional-Printed Core–Shell Structured MFI-Type Zeolite Monoliths for Volatile Organic Compound Capture under Humid Conditions. ACS Appl. Mater. Interfaces 2019, 11, 38955–38963. 10.1021/acsami.9b13819. [DOI] [PubMed] [Google Scholar]
- Thakkar H.; Eastman S.; Hajari A.; Rownaghi A. A.; Knox J. C.; Rezaei F. 3D-Printed Zeolite Monoliths for CO2 Removal from Enclosed Environments. ACS Appl. Mater. Interfaces 2016, 8, 27753–27761. 10.1021/acsami.6b09647. [DOI] [PubMed] [Google Scholar]
- Ackley M.; Rege S. U.; Saxena H. Application of Natural Zeolites in the Purification and Separation of Gases. Microporous Mesoporous Mater. 2003, 61, 25–42. 10.1016/s1387-1811(03)00353-6. [DOI] [Google Scholar]; , ZEOLITE’02 (Proceedings of the 6th Internationanl Conference on the Occurrence, Properties and Utilization of Natural Zeolites)
- de Ridder D. J.; Verberk J. Q. J. C.; Heijman S. G. J.; Amy G. L.; van Dijk J. C. Zeolites for Nitrosamine and Pharmaceutical Removal from Demineralised and Surface Water: Mechanisms and Efficacy. Sep. Purif. Technol. 2012, 89, 71–77. 10.1016/j.seppur.2012.01.025. [DOI] [Google Scholar]
- Perez-Carbajo J.; Matito-Martos I.; Balestra S. R. G.; Tsampas M. N.; van de Sanden M. C. M.; Delgado J. A.; Águeda V. I.; Merkling P. J.; Calero S. Zeolites for CO2–CO–O2 Separation to Obtain CO2-Neutral Fuels. ACS Appl. Mater. Interfaces 2018, 10, 20512–20520. 10.1021/acsami.8b04507. [DOI] [PubMed] [Google Scholar]
- Yu Y.; Li X.; Krishna R.; Liu Y.; Cui Y.; Du J.; Liang Z.; Song X.; Yu J. Enhancing CO2 Adsorption and Separation Properties of Aluminophosphate Zeolites by Isomorphous Heteroatom Substitutions. ACS Appl. Mater. Interfaces 2018, 10, 43570–43577. 10.1021/acsami.8b11235. [DOI] [PubMed] [Google Scholar]
- Itadani A.; Oda A.; Torigoe H.; Ohkubo T.; Sato M.; Kobayashi H.; Kuroda Y. Material Exhibiting Efficient CO2 Adsorption at Room Temperature for Concentrations Lower Than 1000 ppm: Elucidation of the State of Barium Ion Exchanged in an MFI-Type Zeolite. ACS Appl. Mater. Interfaces 2016, 8, 8821–8833. 10.1021/acsami.6b00909. [DOI] [PubMed] [Google Scholar]
- Song Z.; Dong Q.; Xu W. L.; Zhou F.; Liang X.; Yu M. Molecular Layer Deposition-Modified 5A Zeolite for Highly Efficient CO2 Capture. ACS Appl. Mater. Interfaces 2018, 10, 769–775. 10.1021/acsami.7b16574. [DOI] [PubMed] [Google Scholar]
- Besser B.; Tajiri H. A.; Mikolajczyk G.; Möllmer J.; Schumacher T. C.; Odenbach S.; Gläser R.; Kroll S.; Rezwan K. Hierarchical Porous Zeolite Structures for Pressure Swing Adsorption Applications. ACS Appl. Mater. Interfaces 2016, 8, 3277–3286. 10.1021/acsami.5b11120. [DOI] [PubMed] [Google Scholar]
- Zhu Z.; Xu H.; Jiang J.; Wu H.; Wu P. Hydrophobic Nanosized All-Silica Beta Zeolite: Efficient Synthesis and Adsorption Application. ACS Appl. Mater. Interfaces 2017, 9, 27273–27283. 10.1021/acsami.7b06173. [DOI] [PubMed] [Google Scholar]
- Al-Naddaf Q.; Thakkar H.; Rezaei F. Novel Zeolite-5A@MOF-74 Composite Adsorbents with Core–Shell Structure for H2 Purification. ACS Appl. Mater. Interfaces 2018, 10, 29656–29666. 10.1021/acsami.8b10494. [DOI] [PubMed] [Google Scholar]
- Shaw R.; Sharma R.; Tiwari S.; Tiwari S. K. Surface Engineered Zeolite: An Active Interface for Rapid Adsorption and Degradation of Toxic Contaminants in Water. ACS Appl. Mater. Interfaces 2016, 8, 12520–12527. 10.1021/acsami.6b01754. [DOI] [PubMed] [Google Scholar]
- Jiang N.; Shang R.; Heijman S. G. J.; Rietveld L. C. High-silica Zeolites for Adsorption of Organic Micro-pollutants in Water Treatment: A Review. Water Res. 2018, 144, 145–161. 10.1016/j.watres.2018.07.017. [DOI] [PubMed] [Google Scholar]
- Gupta K. M.; Qiao Z.; Zhang K.; Jiang J. Seawater Pervaporation through Zeolitic Imidazolate Framework Membranes: Atomistic Simulation Study. ACS Appl. Mater. Interfaces 2016, 8, 13392–13399. 10.1021/acsami.6b01626. [DOI] [PubMed] [Google Scholar]
- Tchernev D. I. Natural Zeolites in Solar Energy Heating, Cooling, and Energy Storage. Rev. Mineral. Geochem. 2001, 45, 589–617. 10.2138/rmg.2001.45.17. [DOI] [Google Scholar]
- Johannes K.; Kuznik F.; Hubert J.-L.; Durier F.; Obrecht C. Design and Characterisation of a High Powered Energy Dense Zeolite Thermal Energy Storage System for Buildings. Appl. Energy 2015, 159, 80–86. 10.1016/j.apenergy.2015.08.109. [DOI] [Google Scholar]
- Cai J.; Li L.; Lv X.; Yang C.; Zhao X. Large Surface Area Ordered Porous Carbons via Nanocasting Zeolite 10X and High Performance for Hydrogen Storage Application. ACS Appl. Mater. Interfaces 2014, 6, 167–175. 10.1021/am403810j. [DOI] [PubMed] [Google Scholar]
- Zygmunt S. A.; Curtiss L. A.; Iton L. E.; Erhardt M. K. Computational Studies of Water Adsorption in the Zeolite H-ZSM-5. J. Phys. Chem. 1996, 100, 6663–6671. 10.1021/jp952913z. [DOI] [Google Scholar]
- Trzpit M.; Soulard M.; Patarin J.; Desbiens N.; Cailliez F.; Boutin A.; Demachy I.; Fuchs A. H. The Effect of Local Defects on Water Adsorption in Silicalite-1 Zeolite: A Joint Experimental and Molecular Simulation Study. Langmuir 2007, 23, 10131–10139. 10.1021/la7011205. [DOI] [PubMed] [Google Scholar]
- Kuhn J.; Castillo-Sanchez J. M.; Gascon J.; Calero S.; Dubbeldam D.; Vlugt T. J. H.; Kapteijn F.; Gross J. Adsorption and Diffusion of Water, Methanol, and Ethanol in All-Silica DD3R: Experiments and Simulation. J. Phys. Chem. C 2009, 113, 14290–14301. 10.1021/jp901869d. [DOI] [Google Scholar]
- Castillo J. M.; Dubbeldam D.; Vlugt T. J. H.; Smit B.; Calero S. Evaluation of Various Water Models for Simulation of Adsorption in Hydrophobic Zeolites. Mol. Simul. 2009, 35, 1067–1076. 10.1080/08927020902865923. [DOI] [Google Scholar]
- Martin-Calvo A.; Gutiérrez-Sevillano J. J.; Matito-Martos I.; Vlugt T. J. H.; Calero S. Identifying Zeolite Topologies for Storage and Release of Hydrogen. J. Phys. Chem. C 2018, 122, 12485–12493. 10.1021/acs.jpcc.8b02263. [DOI] [Google Scholar]
- Deeg K. S.; Gutiérrez-Sevillano J. J.; Bueno-Pérez R.; Parra J. B.; Ania C. O.; Doblaré M.; Calero S. Insights on the Molecular Mechanisms of Hydrogen Adsorption in Zeolites. J. Phys. Chem. C 2013, 117, 14374–14380. 10.1021/jp4037233. [DOI] [Google Scholar]
- Thornton A. W.; Simon C. M.; Kim J.; Kwon O.; Deeg K. S.; Konstas K.; Pas S. J.; Hill M. R.; Winkler D. A.; Haranczyk M.; Smit B. Materials Genome in Action: Identifying the Performance Limits of Physical Hydrogen Storage. Chem. Mater. 2017, 29, 2844–2854. 10.1021/acs.chemmater.6b04933. [DOI] [PMC free article] [PubMed] [Google Scholar]
- Hriljac J. A.; Eddy M. M.; Cheetham A. K.; Donohue J. A.; Ray G. J. Powder Neutron Diffraction and 29Si MAS NMR Studies of Siliceous Zeolite-Y. J. Solid State Chem. 1993, 106, 66–72. 10.1006/jssc.1993.1265. [DOI] [Google Scholar]
- Kuroki T.; Sakoda N.; Shinzato K.; Monde M.; Takata Y. Prediction of Transient Temperature of Hydrogen Flowing from Pre-cooler of Refueling Station to Inlet of Vehicle Tank. Int. J. Hydrogen Energy 2018, 43, 1846–1854. 10.1016/j.ijhydene.2017.11.033. [DOI] [Google Scholar]
- Muraoka K.; Chaikittisilp W.; Okubo T. Energy Analysis of Aluminosilicate Zeolites with Comprehensive Ranges of Framework Topologies, Chemical Compositions, and Aluminum Distributions. J. Am. Chem. Soc. 2016, 138, 6184–6193. 10.1021/jacs.6b01341. [DOI] [PubMed] [Google Scholar]
- Itabashi K.; Kamimura Y.; Iyoki K.; Shimojima A.; Okubo T. A Working Hypothesis for Broadening Framework Types of Zeolites in Seed-Assisted Synthesis without Organic Structure-Directing Agent. J. Am. Chem. Soc. 2012, 134, 11542–11549. 10.1021/ja3022335. [DOI] [PubMed] [Google Scholar]
- Rick S. W. A Reoptimization of the Five-site Water Potential (TIP5P) for Use with Ewald Sums. J. Chem. Phys. 2004, 120, 6085–6093. 10.1063/1.1652434. [DOI] [PubMed] [Google Scholar]
- Bartolomeu R. A. C.; Franco L. F. M. Thermophysical Properties of Supercritical H2 from Molecular Dynamics Simulations. Int. J. Hydrogen Energy 2020, 45, 16372–16380. 10.1016/j.ijhydene.2020.04.164. [DOI] [Google Scholar]
- Martin-Calvo A.; Parra J. B.; Ania C. O.; Calero S. Insights on the Anomalous Adsorption of Carbon Dioxide in LTA Zeolites. J. Phys. Chem. C 2014, 118, 25460–25467. 10.1021/jp507431c. [DOI] [Google Scholar]
- Feynman R. P.; Hibbs A. R.. Quantum Mechanics and Path Integrals, 2nd ed.; McGraw-Hill: New York, 1965. [Google Scholar]
- Allen M. P.; Tildesley D. J.. Computer Simulation of Liquids, 2nd ed.; Oxford University Press: Oxford, 2017. [Google Scholar]
- Frenkel D.; Smit B.. Understanding Molecular Simulation, 2nd ed.; Academic Press: London, 2001. [Google Scholar]
- Dubbeldam D.; Calero S.; Ellis D. E.; Snurr R. Q. RASPA: Molecular Simulation Software for Adsorption and Diffusion in Flexible Nanoporous Materials. Mol. Simul. 2016, 42, 81–101. 10.1080/08927022.2015.1010082. [DOI] [Google Scholar]
- Dubbeldam D.; Torres-Knoop A.; Walton K. S. On the Inner Workings of Monte Carlo Codes. Mol. Simul. 2013, 39, 1253–1292. 10.1080/08927022.2013.819102. [DOI] [Google Scholar]
- Dubbeldam D.; Calero S.; Vlugt T. J. H. iRASPA: GPU-accelerated Visualization Software for Materials Scientists. Mol. Simul. 2018, 44, 653–676. 10.1080/08927022.2018.1426855. [DOI] [Google Scholar]
- Vlugt T. J. H.; Schenk M. Influence of Framework Flexibility on the Adsorption Properties of Hydrocarbons in the Zeolite Silicalite. J. Phys. Chem. B 2002, 106, 12757–12763. 10.1021/jp0263931. [DOI] [Google Scholar]
- Erdös M.; de Lange M. F.; Kapteijn F.; Moultos O. A.; Vlugt T. J. H. In Silico Screening of Metal-Organic Frameworks for Adsorption-Driven Heat Pumps and Chillers. ACS Appl. Mater. Interfaces 2018, 10, 27074–27087. 10.1021/acsami.8b09343. [DOI] [PMC free article] [PubMed] [Google Scholar]
- Krokidas P.; Castier M.; Moncho S.; Sredojevic D. N.; others E. N.; Kwon H. T.; Jeong H.-K.; Lee J. S.; Economou I. G. ZIF-67 Framework: A Promising New Candidate for Propylene/Propane Separation. Experimental Data and Molecular Simulations. J. Phys. Chem. C 2016, 120, 8116–8124. 10.1021/acs.jpcc.6b00305. [DOI] [Google Scholar]
- Ban S.; Vlugt T. J. H. Adsorption and Diffusion of Alkanes in Na-MOR: Modeling the Effect of the Aluminum Distribution. J. Chem. Theory Comput. 2009, 5, 2858–2865. 10.1021/ct900315r. [DOI] [PubMed] [Google Scholar]
- García-Pérez E.; Dubbeldam D.; Liu B.; Smit B.; Calero S. A Computational Method To Characterize Framework Aluminum in Aluminosilicates. Angew. Chem., Int. Ed. 2007, 46, 276–278. 10.1002/anie.200603136. [DOI] [PubMed] [Google Scholar]
- Liu B.; García-Pérez E.; Dubbeldam D.; Smit B.; Calero S. Understanding Aluminum Location and Non-framework Ions Effects on Alkane Adsorption in Aluminosilicates: A Molecular Simulation Study. J. Phys. Chem. C 2007, 111, 10419–10426. 10.1021/jp0683521. [DOI] [Google Scholar]
- Perez-Carbajo J.; Dubbeldam D.; Calero S.; Merkling P. J. Diffusion Patterns in Zeolite MFI: The Cation Effect. J. Phys. Chem. C 2018, 122, 29274–29284. 10.1021/acs.jpcc.8b08963. [DOI] [Google Scholar]
- Calero S.; Dubbeldam D.; Krishna R.; Smit B.; Vlugt T. J. H.; Denayer J. F. M.; Martens J. A.; Maesen T. L. M. Understanding the Role of Sodium during Adsorption: A Force Field for Alkanes in Sodium-Exchanged Faujasites. J. Am. Chem. Soc. 2004, 126, 11377–11386. 10.1021/ja0476056. [DOI] [PubMed] [Google Scholar]
- Willems T. F.; Rycroft C. H.; Kazi M.; Meza J. C.; Haranczyk M. Algorithms and Tools for High-throughput Geometry-based Analysis of Crystalline Porous Materials. Microporous Mesoporous Mater. 2012, 149, 134–141. 10.1016/j.micromeso.2011.08.020. [DOI] [Google Scholar]
- Martin R. L.; Smit B.; Haranczyk M. Addressing Challenges of Identifying Geometrically Diverse Sets of Crystalline Porous Materials. J. Chem. Inf. Model. 2012, 52, 308–318. 10.1021/ci200386x. [DOI] [PubMed] [Google Scholar]
- Olson D. H. The Crystal Structure of Dehydrated NaX. Zeolites 1995, 15, 439–443. 10.1016/0144-2449(95)00029-6. [DOI] [Google Scholar]
- Pluth J. J.; Smith J. V. Accurate Redetermination of Crystal Structure of Dehydrated Zeolite A. Absence of Near Zero Coordination of Sodium. Refinement of Silicon,Aluminum-ordered Superstructure. J. Am. Chem. Soc. 1980, 102, 4704–4708. 10.1021/ja00534a024. [DOI] [Google Scholar]
- Peng D.-Y.; Robinson D. B. A New Two-Constant Equation of State. Ind. Eng. Chem. Fundam. 1976, 15, 59–64. 10.1021/i160057a011. [DOI] [Google Scholar]
- Rahbari A.; Hens R.; Ramdin M.; Moultos O. A.; Dubbeldam D.; Vlugt T. J. H. Recent Advances in the Continuous Fractional Component Monte Carlo Methodology. Mol. Simul. 2020, 10.1080/08927022.2020.1828585. [DOI] [Google Scholar]; In Press.
- Hens R.; Rahbari A.; Caro-Ortiz S.; Dawass N.; Erdős M.; Poursaeidesfahani A.; Salehi H. S.; Celebi A. T.; Ramdin M.; Moultos O. A.; Dubbeldam D.; Vlugt T. J. H. BRICK-CFCMC: Open Source Software for Monte Carlo Simulations of Phase and Reaction Equilibria Using the Continuous Fractional Component Method. J. Chem. Inf. Model. 2020, 60, 2678–2682. 10.1021/acs.jcim.0c00334. [DOI] [PMC free article] [PubMed] [Google Scholar]
- Jorgensen W. L.; Chandrasekhar J.; Madura J. D.; Impey R. W.; Klein M. L. Comparison of Simple Potential Functions for Simulating Liquid Water. J. Chem. Phys. 1983, 79, 926–935. 10.1063/1.445869. [DOI] [Google Scholar]
- Abascal J. L. F.; Vega C. A General Purpose Model for the Condensed Phases of Water: TIP4P/2005. J. Chem. Phys. 2005, 123, 234505. 10.1063/1.2121687. [DOI] [PubMed] [Google Scholar]
Associated Data
This section collects any data citations, data availability statements, or supplementary materials included in this article.