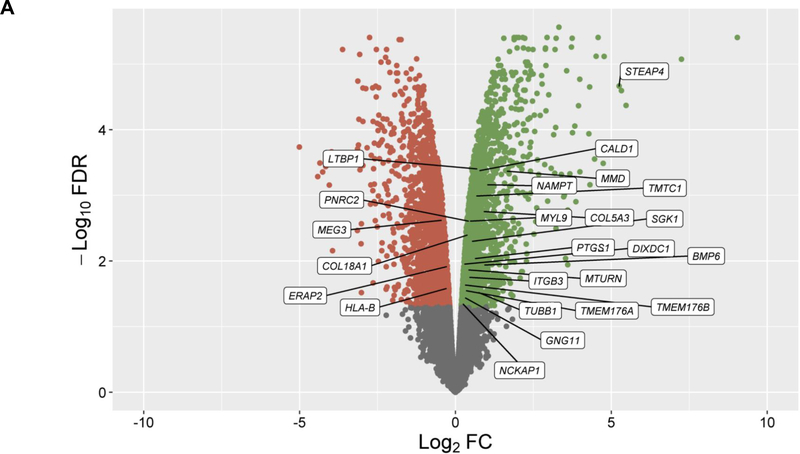
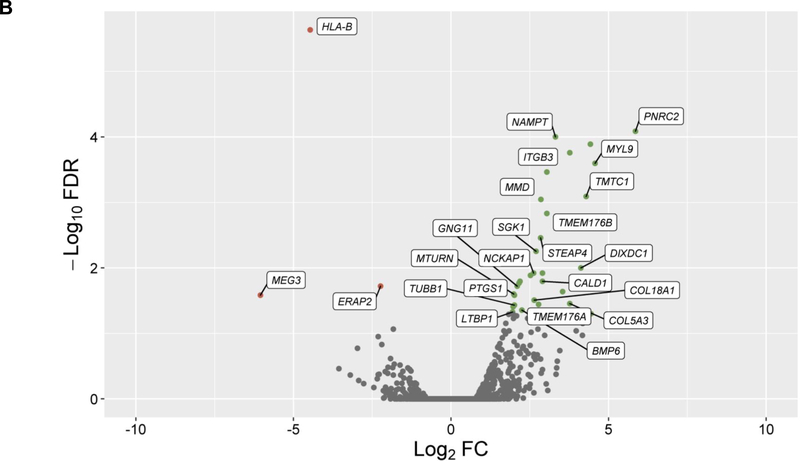
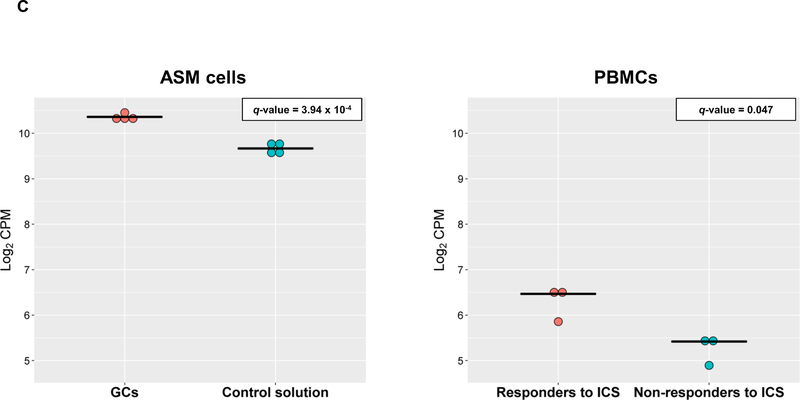
Figure 1. Results of differential expression in response to GCs in ASM cells and PBMCs.
Volcano plot of differential expression results in ASM cells after exposure to GCs compared to a control solution (panel A). Results of differential expression in PBMCs from ICS responders are shown for genes with significant changes in expression levels in ASM cells in response to GCs after adjusting with a false discovery rate (FDR) of 5% (q-value≤0.05) (panel B). Results are represented in terms of log2 fold change (log2 FC) (x-axis) and the logarithmic transformation of FDR (-log10 FDR) (x-axis). Genes significantly (q-value≤0.05) found to be up-regulated (log2 FC>0) or downregulated (log2 FC<0) are represented by means of green or red dots, respectively. Genes with consistent alteration of expression levels in ASM cells and PBMCs are labeled into white boxes.
Dots plots of differential expression for LTBP1 in ASM cells and PBMCs (panel C). Gene expression levels are represented in terms of log2 counts per million (CPM) in the y-axis as dots for cases (red) and control (blue) samples. The median expression level is represented for each sample group by a black horizontal line. P-values adjusted by false discovery rate are shown (q-value).


