

Supplemental Digital Content is available in the text
Keywords: body mass index, immune cell, immune checkpoint inhibitor, LSCC, prognosis
Abstract
This study aims to evaluate the prognosis and serum immune cells of patients with different pretreatment body mass index (BMI) values. The data of 61 newly diagnosed patients with advanced lung squamous cell carcinoma (LSCC) who received immune checkpoint inhibitors (ICIs) combined with chemotherapy were obtained from the database of Rizhao People's Hospital (Rizhao, Shandong). According to the cutoff value of BMI (23.2 kg/m2), 32 patients had a high BMI and the remaining 29 patients had a low BMI. The effects of different BMIs on the prognosis and serum immune cells of patients were analyzed. The median progression-free survival (PFS) times were 7.72 months in the high BMI group and 4.83 months in the low BMI group [adjusted hazard ratio (HR), 0.23; 95% confidence interval (CI), 0.11–0.48; P < .001]. In terms of the overall survival (OS), the median times of the high BMI group and low BMI group were 18.10 and 13.90 months, respectively (adjusted HR, 0.15; 95% CI, 0.07–0.32; P < .001). After 4 cycles of ICI therapy combined with chemotherapy, the objective response rate was 59.4% for the high BMI group and 20.7% for the low BMI group (P = .002). In addition, the number of serum immune cells in patients with high BMI was significantly higher than that in patients with low BMI (all P < .001). There was a linear relationship between BMI value and the number of serum immune cells (all R2 > 0.7). The current results showed that high BMI is associated with better prognosis in LSCC patients who received ICIs, which may be related to higher levels of serum immune cells.
1. Introduction
Lung cancer is a public health problem worldwide and has the highest mortality among all cancers in the United States.[1] According to the pathological morphology, lung cancer can be divided into non-small cell lung cancer (NSCLC) and small cell lung cancer (SCLC).[2,3] The incidence rate of lung squamous cell carcinoma (LSCC) accounts for 20% to 30% of NSCLC.[4] The causes of LSCC are mostly related to smoking and air pollution.[5] Many LSCC patients missed the opportunity for surgery as advanced staging at diagnosis and are lack of effective targeted drugs for gene mutations.[6,7] For advanced LSCC patients, the previous standard treatment of platinum-containing chemotherapy can only bring a median overall survival (OS) of less than 1 year.[8] Fortunately, in the recent KEYNOTE-407 trial, the median OS time of advanced LSCC patients was increased to 17.1 months by receiving immune checkpoint inhibitor (ICI) therapy combined with chemotherapy.[9,10] This study also modified the NCCN guideline for NSCLC, making ICI (pembrolizumab) added to the first-line treatment for advanced LSCC.[11]
Body mass index (BMI) is commonly used to measure the degree of obesity and whether the body is healthy or not. BMI is related to many diseases, including hypertension, type 2 diabetes, coronary heart disease, and tumors.[12–14] Although obesity can increase the risk of multiple malignancies,[15] high BMI is an independent protective factor against lung cancer-related mortality.[16] In addition, obesity can not only bring some complications to lung cancer resection, but also reduce operative mortality and prolong OS of patients.[17] For the LSCC patients receiving second-line and later ICI therapy, the OS and progression-free survival (PFS) time of patients with high BMI were longer.[18] The relationship between BMI and the occurrence, development and prognosis of lung cancer is complex, which has not been fully studied.
With the publication of the results of several major clinical trials, including KEYNOTE-024, KEYNOTE-042, KEYNOTE-189 and KEYNOTE-407, ICI therapy in the first-line treatment of advanced NSCLC is becoming increasingly important.[9,10,15,19–21] However, the effect of ICI therapy in different lung cancer patients is very different.[22] Recent studies had shown that ICI therapy is more effective in tumor patients with high PD-L1 expression, high tumor mutation burden, and DNA mismatch-repair deficient /microsatellite instability-high.[22–24] Therefore, to find out the factors that affect the effect of ICI therapy can not only guide the choice of clinical treatment, but also explore the new direction of scientific research. Therefore, the purpose of this study is to explore the effect of pretreatment BMI on the prognosis and serum immune cells in the advanced LSCC patients who received ICI therapy.
2. Patients and methods
2.1. Patient selection
The author searched the internal database from the Rizhao People's Hospital (Rizhao, China) between January 2018 (the first diagnosis of tumor) and May 2020 with a hospital's medical records browsing protocol. The medical histories of advanced LSCC patients were reviewed to confirm that they have received ICI therapy combined with chemotherapy at the first diagnosis. The lung cancer staging in this study were based on the 8th TNM stage classification.[25] The inclusion criteria of this study are as follows:
-
1.
LSCC with distant metastasis was confirmed by pathology and imaging,
-
2.
The patients were treated with ICI and chemotherapy at the initial diagnosis for 4 cycles. After that, they received ICI maintenance therapy,
-
3.
Patients were given ICI therapy until the tumor progressed or died,
-
4.
The medical record and patient information are complete,
-
5.
Serum immune cells were detected before and after 4 cycles of ICI therapy combined with chemotherapy.
According to the inclusion criteria, this study finally included 61 patients. Patients were divided into 2 groups according to the calculated cutoff value of BMI (23.2 kg/m2). Of all the patients included, 32 belonged to the high BMI group, and the remaining 29 had low BMI value. This study was approved by the Institutional Review Board of Rizhao people's hospital (Rizhao, China; IRB number: SDCH20180123).
2.2. Data collection
The patients’ clinical information was obtained from the medical records, including gender, age, smoking status, performance status, BMI, prealbumin, albumin, tumor differentiation, tumor metastasis, tumor markers, chemotherapy, and serum immune cells. The authors carefully reviewed and recorded the treatment strategy and treatment process of all patients. The basic information and tumor status of patients were the data before treatment. The authors also collected the number of serum immune cells before and after treatment, including CD4+ and CD8+ T cell. Flow cytometry was used to detect the immune cells in peripheral blood, which was conducted by the Department of Laboratory, Rizhao People's Hospital. The antibodies used in the detection of serum immune cells were CD4-FITC and CD8-PE (BCs Company, Inc.).
2.3. Response, survival evaluation
According to the Response Evaluation Criteria in Solid Tumors (RECIST), 2 radiologists calculated the objective response of tumors independently from the high and low BMI groups after 4 cycles of chemotherapy combined with ICI.[26] A partial response to RECIST was defined as a ≥30% decrease in the sum of the longest diameter for all target lesions. Progressive disease was defined as an increase in the sum of the longest diameter for all target lesions of ≥20%, or the appearance of new lesions. The definition of stable disease to RECIST lies between these 2 situations. The authors made a statistical analysis of PFS and OS time of each patients in different groups. PFS was defined as the time from the beginning of treatment to the progression of disease or death. OS was defined as the time from the beginning of randomization to death for any reason.[27,28] In this study, patients received high-resolution CT every 6 weeks to evaluate the therapeutic effect. The patients with the longest follow-up time had a total survival time of 25.1 months.
2.4. Statistical analyses
The Chi-Squared test was used to analyze the patient characteristics and baseline data of high and low BMI groups. The unpaired student t test was performed to analyze continuous variables from 2 groups. The influence of clinical variables on prognosis was analyzed by Cox multivariate analysis. Cox multivariate model, including the following important variables: gender, age, smoking status, performance status, prealbumin, albumin, tumor differentiation, tumor metastasis, tumor markers, and chemotherapy. The survival analysis of different groups was calculated by the Kaplan–Meier method and Log-rank test. All data analysis was done by SPSS version 17.0 (SPSS, Inc.). P < .05 was considered statistically significant. The relationship between BMI value and the number of immune cells was analyzed by line-fitting method. The closer the value of R2 is to 1, the higher the linear correlation is. When R2 is between 0.7 and 0.9, it indicates a certain accuracy, and when the value is above 0.9, it indicates a high accuracy.[29,30] The line-fitting analysis of this study was completed by GraphPad Prism version 8.2 (GraphPad Software, Inc.).
3. Results
3.1. Patient characteristics
A total of 376 patients with advanced LSCC received ICI therapy combined with chemotherapy. Three hundred fifteen patients were excluded from this study for the following various reasons: 128 patients did not have sufficient clinical records. Eighty seven patients were terminated for treatment toxicity or other reasons. Fifty six patients were treated with only ICI after the initial diagnosis. The treatment strategies for 42 patients were not fully developed according to the KEYNOTE-407 study or NCCN guideline. The remaining 2 patients developed other malignancies during the treatment. Finally, according to the inclusion and exclusion criteria, 61 patients were included in this study (Table 1). All patients received 4 cycles of ICI therapy combined with chemotherapy, and then maintained ICI therapy until tumor progression or death. For untreated patients with advanced LSCC, 32 (52.5%) of them belonged to the high BMI group, and the remaining 29 (47.5%) belong to the low BMI group (cutoff value = 23.2 kg/m2) (Fig. 1). The proportion of male patients in the 2 groups was higher (65.5% and 79.3%). Two groups of patients received chemotherapy regimens without significant difference, including. There was no significant difference in the smoking status, nutritional status, and performance status of the 2 groups (Table 1). In addition, the general tumor status, including tumor differentiation, metastasis and tumor markers, of the high and low BMI groups were similar (all P > .05). However, the significant difference was not exact in the median age and chemotherapeutic regimens between the 2 groups (P = .068 and .065). Finally, there were significant differences in the number of immune cells before and after treatment in the high and low BMI groups (all P < .05) (Table 1). The changes of immune cells before and after treatment in two groups were also analyzed, but no statistical difference was found (Supplementary Table 1).
Table 1.
Patients demographics and study treatment.
| Patient characteristics | High BMI (kg/m2) (n = 32) | Low BMI (kg/m2) (n = 29) | P value |
| Sex, n (%) | .234 | ||
| Male | 21 (65.6) | 23 (79.3) | |
| Female | 11 (34.4) | 6 (20.7) | |
| Median age, years (range) | 65 (48–76) | 67 (49–82) | .068 |
| Smoking status, n (%) | .395 | ||
| Never-smoker | 20 (62.5) | 15 (51.7) | |
| Former/current smoker | 12 (37.5) | 14 (48.3) | |
| Mean prealbumin, g/l (SD) | 229.8 (79.6) | 218.7 (89.8) | .611 |
| Mean albumin, g/l (SD) | 39.5 (6.1) | 39.7 (5.0) | .878 |
| Performance status, n (%) | .088 | ||
| 0–1 | 27 (84.4) | 19 (65.5) | |
| >1 | 5 (15.6) | 10 (34.5) | |
| Tumor differentiation | .143 | ||
| Poor/Moderate | 15 (46.9) | 19 (65.5) | |
| High | 17 (53.1) | 10 (34.5) | |
| Brain metastases, n (%) | 12 (37.5) | 17 (58.6) | .099 |
| Bone metastases, n (%) | 12 (37.5) | 7 (24.1) | .260 |
| Mean Cyfra21–1, ng/ml (SD) | 11.4 (11.8) | 8.6 (5.0) | .245 |
| Mean SCC, ng/ml (SD) | 7.1 (5.6) | 6.7 (3.5) | .717 |
| Chemotherapeutic regimen, n (%) | .065 | ||
| TAX+CBP | 17 (53.1) | 22 (75.9) | |
| ABX+CBP | 15 (46.9) | 7 (24.1) | |
| Mean pretreatment CD4+ T cell (SD) | 646.2 (43.5) | 460.1 (113.9) | .001 |
| Mean pretreatment CD8+ T cell (SD) | 425.9 (89.2) | 270.7 (48.7) | .001 |
| Mean post-treatment CD4+ T cell (SD) | 697.5 (52.1) | 491.6 (124.4) | .001 |
| Mean post-treatment CD8+ T cell (SD) | 474.3 (105.9) | 302.5 (60.9) | .001 |
χ2 test was used to compare patient characteristics, and P-value <.05 was statistically significant.
ABX = albumin-bound paclitaxel, BMI = body mass index, CBP = carboplatin, SD = standard deviation, TAX = paclitaxel.
Figure 1.
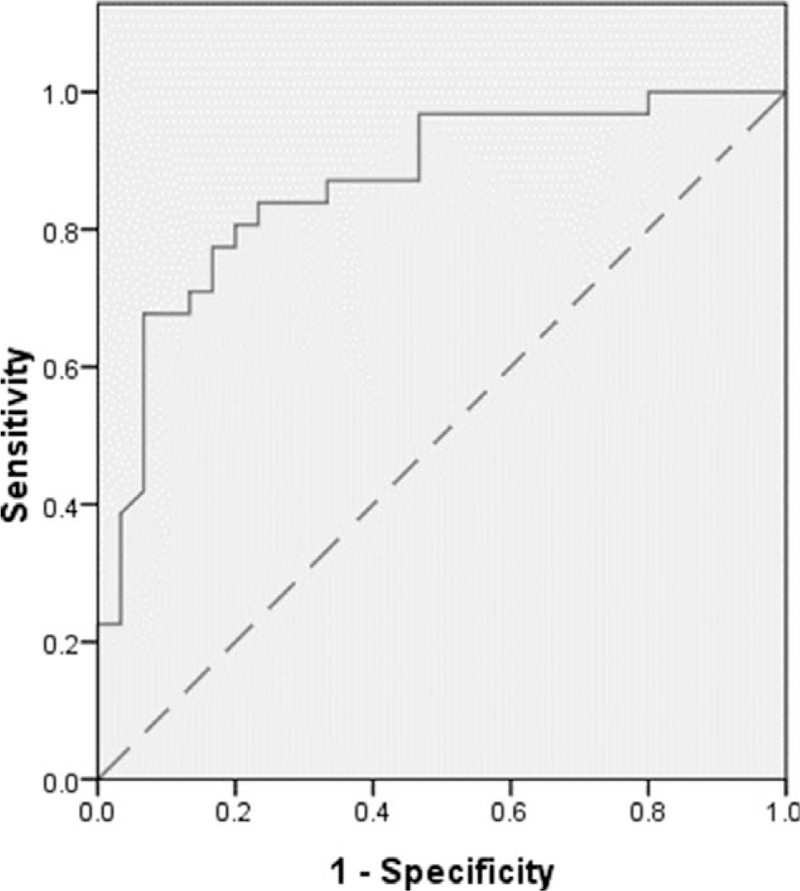
The receiver operating characteristic (ROC) curve of BMI value.BMI = body mass index.
3.2. Association of high and low BMI with PFS and OS time
In this study, all 61 patients were divided into high and low BMI groups according to the cutoff value. The PFS and OS time of patients from different BMI groups were statistically analyzed. The median PFS time of high and low BMI groups were 7.72 months and 4.83 months respectively (adjusted HR, 0.232; 95%CI, 0.112–0.483; P < .001) (Fig. 2A). Similarly, the OS time of high BMI group (18.10 months) was much longer than that of low BMI group (13.90 months), and the difference was statistically significant (adjusted HR, 0.148; 95%CI, 0.069–0.318; P < .001) (Fig. 2B). In order to exclude the influence of other clinical factors on results, we established Cox multivariate survival analysis model which included the following clinical factors: gender, age, smoking status, performance status, BMI, prealbumin, albumin, tumor differentiation, tumor metastasis, tumor markers, and chemotherapy (Supplementary Table 2 and 3).
Figure 2.
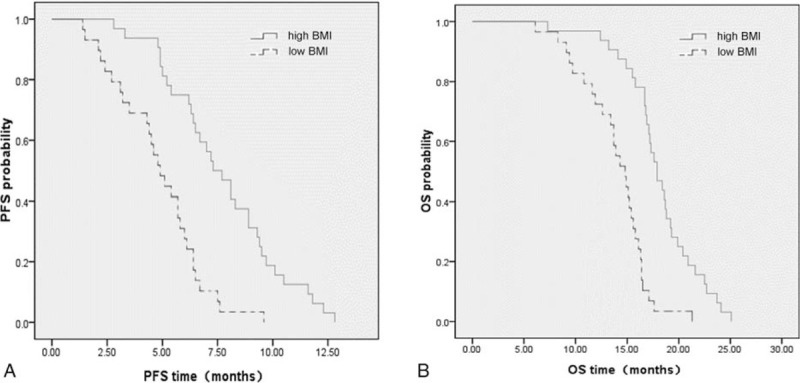
(A) Progression-free survival (adjusted HR, 0.232; P < .001) and (B) overall survival (adjusted HR, 0.148; P < .001) in the high and low BMI groups. BMI = body mass index.
3.3. Association of high and low BMI with response after 4 cycles of treatment
In this study, the objective response of all patients after 4 cycles of ICI therapy combined with chemotherapy was statistically analyzed. According to the RECIST, we counted and compared the partial response, stable disease and progressive disease rate of patients from high and low BMI groups. The numbers of patients with partial response in high and low BMI groups were 19 (59.6%) and 6 (20.7%), respectively (P = .002) (Fig. 3A and B; Table 2). In addition, the number of patients with stable disease in high BMI group was 12 (37.5%), compared with 21 (72.4%) in low BMI group after 4 cycles of treatment (P = .006). However, the progressive disease rates of high and low BMI groups were similar, which were 3.1% and 6.9%, respectively (P = .496) (Fig. 3A and B; Table 2).
Figure 3.
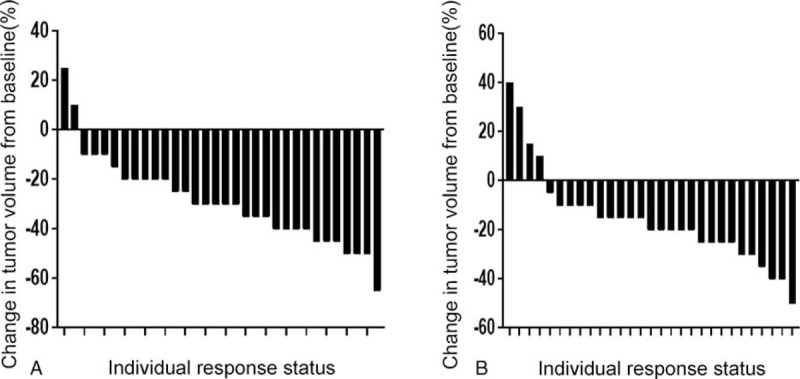
Response to (A) high BMI group and (B) low BMI group. Each bar represents an individual patient and demonstrates the percent change in tumor after 4 cycles of ICI therapy combined with chemotherapy as measured by Response Evaluation Criteria in Solid Tumors (RECIST). BMI = body mass index.
Table 2.
Response to treatment.
| Treatment response | High BMI (n = 32) | Low BMI (n = 29) | P value |
| Partial response, n (%) | 19 (59.4) | 6 (20.7) | .002 |
| Stable disease, n (%) | 12 (37.5) | 21 (72.4) | .006 |
| Progressive disease, n (%) | 1 (3.1) | 2 (6.9) | .496 |
BMI = body mass index.
3.4. Association of high and low pretreatment immune cells with PFS and OS times
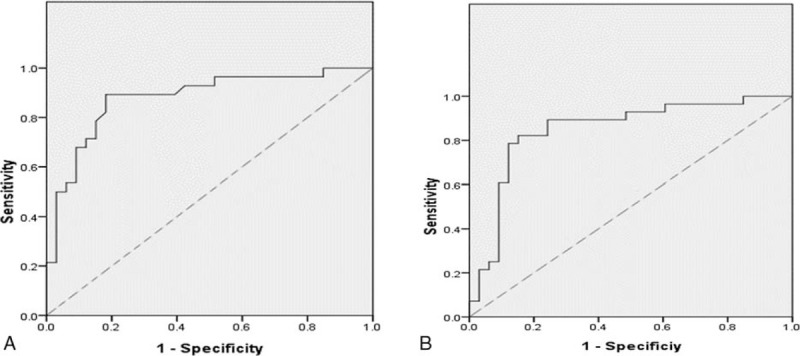
The relationship between pretreatment serum immune cells and prognosis of 61 patients was analyzed in this study. The cutoff values of pretreatment CD4+ and CD8+ T cells were 608/μl and 332.5/μl respectively (Fig. 4A and B). The median PFS times of high and low pretreatment CD4+ T cell groups were 7.89 months and 4.85 months (adjusted HR, 0.219; 95%CI, 0.106–0.445; P < .001) (Fig. 5A). Similarly, the median OS times of high and low pretreatment CD4+ T cell groups were also statistically different, which were 18.59 months and 13.69 months, respectively (adjusted HR, 0.105; 95%CI, 0.046–0.238; P < .001) (Fig. 5B). Compared with the 4.84 months median PFS time of low pretreatment CD8+ T cell group, the median PFS time of high BMI group (7.80 months) was statistically different (adjusted HR, 0.269; 95%CI, 0.154–0.570; P < .001) (Fig. 5c). The OS time of high pretreatment CD8+ T cell group was longer than that of low pretreatment CD8+ T cell group (adjusted HR, 0.165; 95%CI, 0.080–0.343; P < .001), with median OS time of 18.53 months and 13.60 months, respectively (Fig. 5D).
Figure 4.
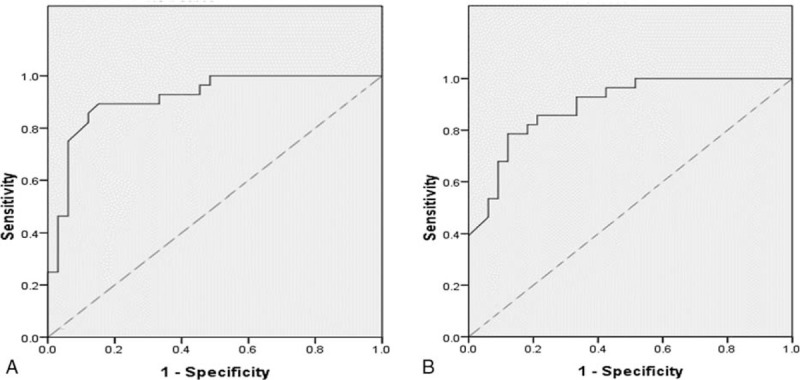
The receiver operating characteristic (ROC) curve of (A) the pretreatment CD4+ T cell and (B) the pretreatment CD8+ T cell.
Figure 5.
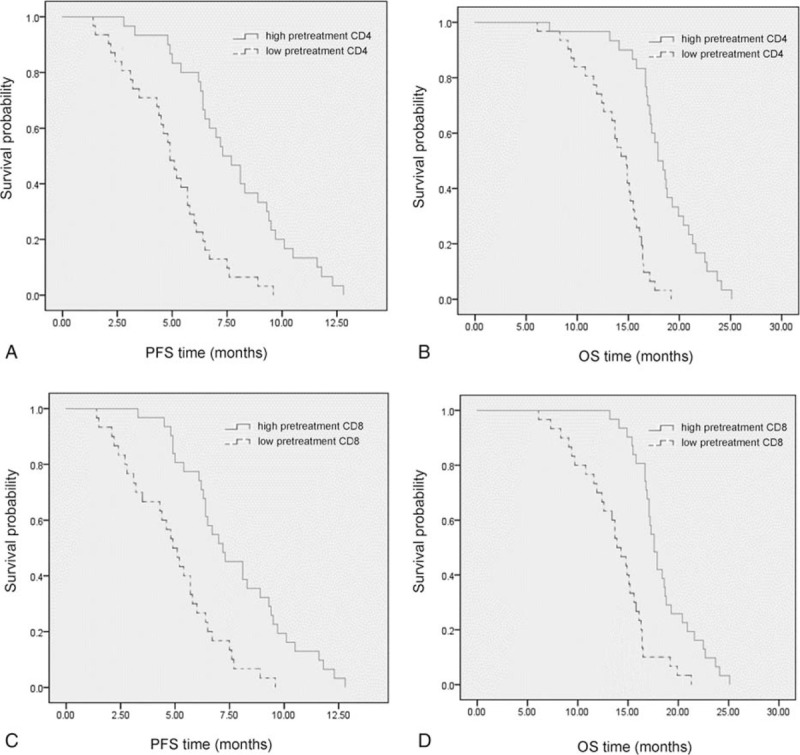
(A) Progression-free survival (adjusted HR, 0.219; P < .001) and (B) overall survival (adjusted HR, 0.105; P < .001) in the high and low pretreatment CD4+ T cell groups. (C) Progression-free survival (adjusted HR, 0.269; P < .001) and (D) overall survival (adjusted HR, 0.165; P < .001) in the high and low pretreatment CD8+ T cell groups.
3.5. Association of high and low post-treatment immune cells with PFS and OS times
The relationship between post-treatment immune cells and prognosis of advanced LSCC patients was also analyzed. After 4 cycles of treatment, the cutoff values of CD4+ and CD8+ T cells were 666/μl and 387.5/μl, respectively (Fig. 6A and B). The median PFS and OS times of low post-treatment CD4+ T cell group were 5.11 months and 14.03 months, respectively, and there were significant differences comparing with the median PFS (8.01 months) and OS (18.89 months) times of patients from the high post-treatment CD4+ T cell group (adjusted HR of PFS, 0.190; 95%CI, 0.092–0.394; P < .001. adjusted HR of OS, 0.110; 95%CI, 0.049–0.247; P < .001) (Fig. 7A and B). The median PFS times of high and low post-treatment CD8+ T cell groups were 7.99 months and 4.95 months (adjusted HR, 0.304; 95%CI, 0.164–0.564; P < .001) (Fig. 7C). In addition, comparing with the median OS time (13.94 months) of low post-treatment CD8+ T cell group, and the median OS time (18.65 months) of high post-treatment CD8+ T cell group was significantly prolonged, with statistical difference (adjusted HR, 0.247; 95%CI, 0.130–0.471; P < .001) (Fig. 7D).
Figure 6.
The receiver operating characteristic (ROC) curve of (A) the post-treatment CD4+ T cell and (B) the post-treatment CD8+ T cell.
Figure 7.
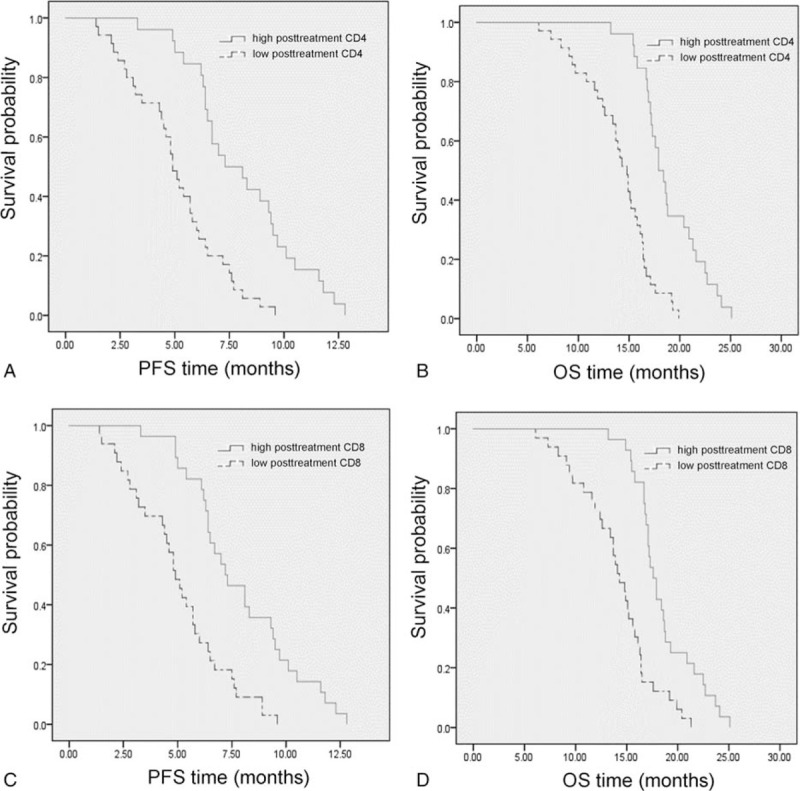
(A) Progression-free survival (adjusted HR, 0.190; P < .001) and (B) overall survival (adjusted HR, 0.110; P < .001) in the high and low post-treatment CD4+ T cell groups. (C) Progression-free survival (adjusted HR, 0.304; P < .001) and (D) overall survival (adjusted HR, 0.247; P < .001) in the high and low post-treatment CD8+ T cell groups.
3.6. Association of different BMI value with immune cells
The relationship between pretreatment BMI value and immune cells before and after treatment, including CD4+ T cell and CD8+ T cells, was studied in the advanced LSCC patients. As shown in Figure 8A, compared with low BMI group, the levels of pretreatment CD4+ and CD8+ T cells in high BMI group patients were significantly higher (all P < .0001). Similarly, for post-treatment CD4+ and CD8+ T cells, the numbers of immune cells in the high BMI group were significantly higher than those in the low BMI group (all P < .001) (Fig. 8B). In addition, for patients with high BMI, the level of post-treatment CD4+ T cells was significantly higher than pretreatment CD4+ T cells (P < .001) (Fig. 8C). Finally, the level of CD8+ T cells in low BMI group was significantly higher than this cell before treatment in the same group (P = .032) (Fig. 8D). However, there was no significant difference between the levels of pretreatment and post-treatment CD8+ T cells in patients with high BMI (P = .268). Similarly, no significant difference was found between pretreatment and post-treatment CD4+ T cells from low BMI group (P = .305). In order to further explore the relationship between pretreatment BMI and serum immune cells before and after treatment, this study conducted linear fitting analysis. The conclusion is that there is a certain linear relationship between the pretreatment BMI and pretreatment CD4+ T cells (R2 = 0.813) (Fig. 9A), pretreatment CD8+ T cells (R2 = 0.888) (Fig. 9B), post-treatment CD4+ T cells (R2 = 0.828) (Fig. 9C) and post-treatment CD8+ T cells (R2 = 0.735) (Fig. 9D).
Figure 8.
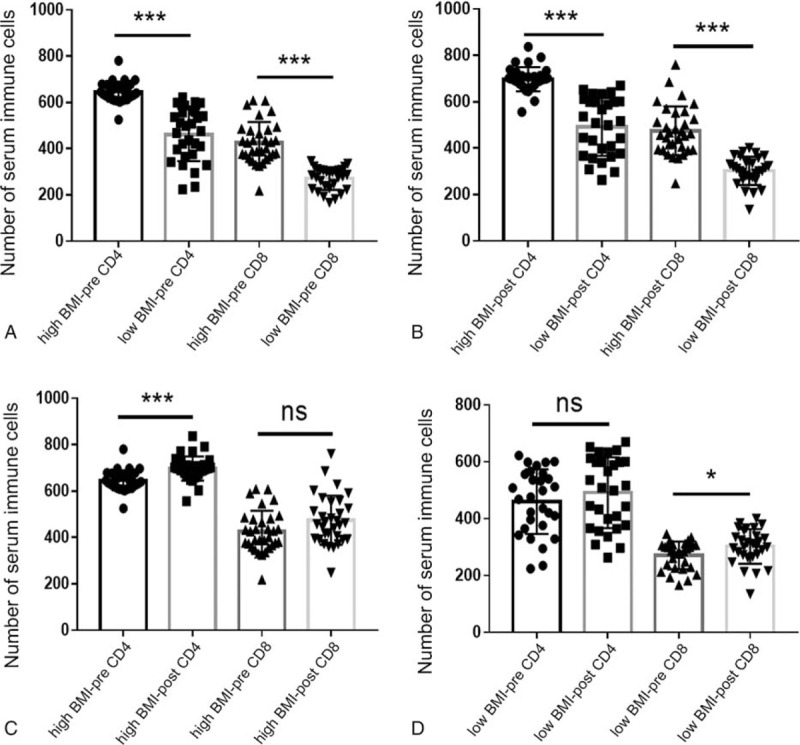
The effect of different BMI value on pretreatment and post-treatment serum immune cells. (A) Pretreatment immune cells in different BMI groups. (B) Post-treatment immune cells in different BMI groups. (C) Pretreatment and post-treatment immune cells in high BMI group. (D) Pretreatment and post-treatment immune cells in low BMI group. BMI = body mass index.
Figure 9.
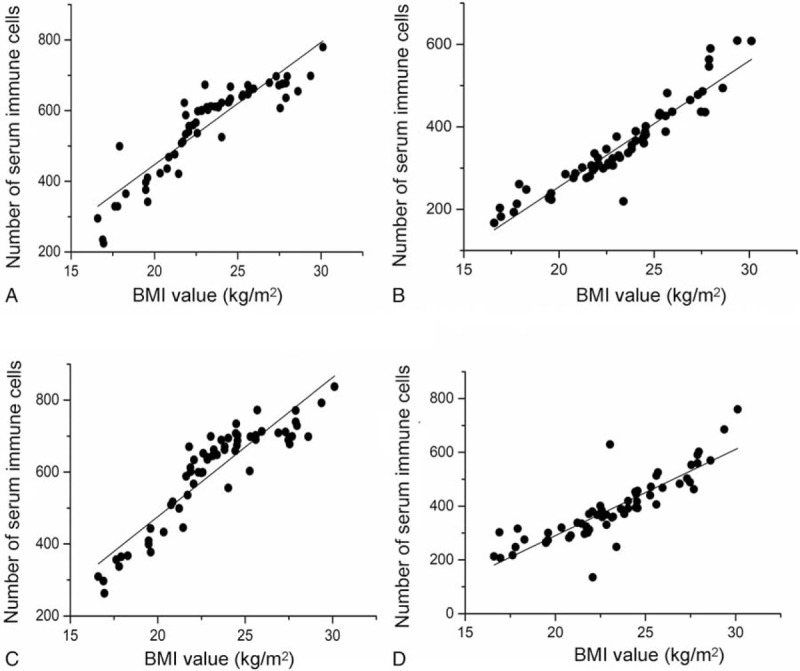
The linear correlation analysis of (A) BMI and pretreatment CD4+ T cell, (B) BMI and pretreatment CD8+ T cell, (C) BMI and post-treatment CD4+ T cell, and (D) BMI and post-treatment CD8+ T cell. BMI = body mass index.
4. Discussion
To the best of our knowledge, this is the first study to explore the relationship among pretreatment BMI, serum immune cells, and the prognosis of advanced LSCC patients who received ICI therapy. The number of serum immune cells of advanced LSCC patients with high pretreatment BMI was greater than that in who with low pretreatment BMI, and high pretreatment BMI was related to longer PFS and OS times. However, the detailed molecular mechanism needs further study.
Although LSCC accounts for only 20% to 30% of NSCLC, this is a malignant tumor worthy of our attention.[4] Because the early symptoms are not obvious, most patients are already in an advanced stage when diagnosed.[6] Unfortunately, despite the rapid development of molecular targeted drugs in recent years, the therapeutic effect of advanced LSCC patients is far less than that of patients with lung adenocarcinoma.[6,7] Through traditional platinum-containing chemotherapy, the median OS time of LSCC patients is only 8 to 12 months.[8,31] Although antiangiogenic drugs can prolong the survival time of advanced LSCC patients, their serious side effects, including pulmonary hemorrhage and pulmonary embolism, are particularly prominent.[32,33] However, ICI therapy has broken the embarrassing situation of the treatment of advanced LSCC.
ICI therapy, represented by pembrolizumab, has replaced chemotherapy as the first-line treatment for advanced NSCLC patients with PD-L1 expression.[11] Recently, the final analysis of the KEYNOTE-407 trial showed that PFS and OS were significantly prolonged in advanced LSCC patients after receiving pembrolizumab combined with chemotherapy.[10] What's more, advanced LSCC patients can benefit from ICI therapy combined with chemotherapy regardless of the expression level of PD-L1. However, the efficacy of ICI therapy varies greatly from patient to patient.[22] Although previous studies have shown that patients with high PD-L1, high tumor mutation burden and DNA mismatch-repair deficient/microsatellite instability-high can benefit more from ICI therapy,[22–24] we need to further explore the clinical factors affecting the therapeutic effect. Therefore, we started from BMI to reveal its impact on ICI therapy and the prognosis of advanced LSCC patients.
BMI is one of the most common measures of obesity. Although BMI cannot reflect visceral fat content, it is a very easy to obtain indicators in clinical practice.[34] The formula for BMI is weight divided by the square of height (kg/m2). According to the classification standard of WHO, the normal BMI ranges from 18.5 to 24.9 kg/m2.[35] However, due to the small size of Asian human body, the classification standard of BMI in Asia has been adjusted according to the actual situation. The normal BMI of Asian human ranges from 18.5 to 22.9 kg/m2.[36,37] Because all the subjects in this study were Asians, the cutoff value of BMI is 22.3 kg/m2, which is overweight according to the Asia BMI classification standard. Therefore, this study can also be interpreted as the impact of overweight and obese on the prognosis of advanced LSCC patients compared with normal and thin weight.
The relationship between BMI and the occurrence, development, treatment, and prognosis of malignant tumors has always been a research hotspot.[38] Many studies have shown that high BMI is closely related to the occurrence and development of a variety of malignant tumors, especially endometrial carcinoma, esophageal adenocarcinoma, renal cell carcinoma, liver cancer, and biliary tract cancer.[15] What's worse is that with the increase of BMI, the risk of malignant tumor is also further increased. Meanwhile, more evidences show that adipocytes play a bad role in the antitumor immune responses, which may be related to dysfunctional exhausted T-cell and immune checkpoints.[39,40] On the other hand, recent studies have found that high BMI can reduce the surgical mortality, improve the efficacy of ICI therapy and prolong the survival time of lung cancer patients.[16–18] Remarkably, new studies by Cortellini et al have shown that pretreatment obesity (BMI > 30) is associated with the significant improvement of survival outcome in metastatic NSCLC patients with a PD-L1 expression of ≥50%, receiving first line pembrolizumab.[41] There seems to be a contradiction between the above 2 conclusions. Therefore, we designed this study to explore the effects of different BMI value on the survival of advanced LSCC patients receiving ICI therapy. At the same time, we also tried to explore the underlying mechanism from the perspective of immune cells.
This study has showed that advanced LSCC patients with higher BMI had longer survival time and higher objective remission rate after receiving ICI therapy. So why do patients with higher BMI gain better survival benefits after receiving ICI therapy? First of all, patients with high BMI have better physical fitness and more energy reserves and stronger antitumor ability. One of the important signs of patients with terminal stage tumor are the rapid weight loss and rapid deterioration of physical condition. Secondly, compared with surgery, chemotherapy and radiotherapy can directly kill tumor cells, ICI therapy indirectly attack cancer cells by restarting the anti-tumor immune system. Patients with higher BMI have a more complete immune system and can mobilize more immune cells. In order to verify this conclusion, we counted and analyzed the serum immune cells of advanced LSCC patients, including CD4+ T cells and CD8+ T cells. The results of this study also showed that the serum CD4+ T cells and CD8+ T cells level of patients with higher BMI was greater than that of patients with lower BMI. At the same time, we also found that there was a positive linear correlation between serum immune cells and BMI of advanced LSCC patients receiving ICI therapy. Therefore, this study explained why advanced LSCC patients with higher BMI have longer survival time from the cellular mechanism level. Next, we will use cell and animal experiments to further explore the molecular and genetic mechanisms.
T lymphocytes are divided into CD4+ T cells and CD8+ T cells according to the expression of surface molecules. CD4+ T cells, also known as helper T cells, mainly secretes cytokines to regulate the function of other immune cells. CD8+ T cells can specifically recognize and kill virus-infected cells or tumor cells, so they are also called killer T cells.[42] Malignant tumor can get rid of T lymphocytes attack by immune escape. The mechanism of tumor immune escape can be divided into 3 types: loss or change of antigenicity, weakening of immunogenicity, and change of tumor microenvironment.[43,44] Immune checkpoint molecules play an important role in tumor immunosuppression, including programmed cell death 1 (PD-1) and cytotoxic T-lymphocyte-associated antigen 4 (CTLA-4).[45,46] Programmed cell death ligand 1(PD-L1) on the tumor cells provides inhibitory signals by binding with PD-1 on T cells, induces T cell apoptosis and inhibits T cell activation and proliferation. PD-1 antibody can reactivate tumor immunity by blocking PD-1 on the T cells, and its representative drugs include pembrolizumab and nivolumab.[45] Because several clinical trials of pembrolizumab, including KEYNOTE-024, KEYNOTE-042, KEYNOTE-189 and KEYNOTE-407, have come up with satisfactory results earlier and rewritten the global guidelines, we give NSCLC patients early use of pembrolizumab.[10,19–21] In this study, all the PD-1 antibodies used in the study were pembrolizumab. At the same time, the influence of different types of PD-1 antibody on the research results was also excluded. PD-1 antibody has been recognized by clinicians for its remarkable efficacy and low toxicity.
Of course, there are still some deficiencies in this research. Although the demographic and clinical features were used to balance the grouping, as a retrospective study, there is still unavoidable selection bias. In order to minimize the impact of confounding variables on the results of this study, the following clinical factors were included in the survival analysis model: gender, age, smoking status, performance status, prealbumin, albumin, tumor differentiation, tumor metastasis, tumor markers, and chemotherapy. In addition, a total of 61 patients were included in this study, and small sample size may lead to the deviation of results. Furthermore, pretreatment BMI of LSCC patients can not reflect the physical condition of the whole treatment process. At the same time, this study only revealed that the prognosis of patients with high pretreatment BMI is better, which may be related to more serum immune cells. However, the deeper molecular mechanism contained in the conclusion of this study has not been fully researched. This will also be our next research direction.
5. Conclusion
This study revealed that after receiving ICIs combined with chemotherapy, advanced LSCC patients from the high pretreatment BMI group had longer PFS and OS times than those in the low treatment BMI group. In addition, the survival advantage of patients with higher BMI may be related to more serum immune cells.
The supplementary can be viewed from the following website:
Acknowledgments
The author of this study should sincerely thank Dr. Jianlin Guo (Department of Medical Records, The Rizhao People's Hospital) for providing and maintaining the clinical database and Dr. Zhizhang Zhao (Department of Medical Records, The Rizhao People's Hospital) for the professional data analysis guidance.
Author contributions
Conceptualization: Fei Wang, Xiaoming Li.
Data curation: Fei Wang.
Methodology: Lei Zhou, Na Chen.
Project administration: Fei Wang, Xiaoming Li.
Resources: Na Chen, Xiaoming Li.
Supervision: Lei Zhou, Na Chen, Xiaoming Li.
Writing – original draft: Fei Wang, Xiaoming Li.
Writing – review & editing: Fei Wang, Lei Zhou, Na Chen, Xiaoming Li.
Supplementary Material
Footnotes
Abbreviations: BMI = body mass index, HR = hazard ratio, ICI = immune checkpoint inhibitor, LSCC = lung squamous cell carcinoma, NSCLC = non-small cell lung cancer, OS = overall survival, PFS = progression-free survival.
How to cite this article: Wang F, Zhou L, Chen N, Li X. The effect of pretreatment BMI on the prognosis and serum immune cells in advanced LSCC patients who received ICI therapy. Medicine. 2021;100:8(e24664).
The present study was approved by The Institutional Review Board of Rizhao People's Hospital (Rizhao, China; IRB no.: SDRZ20180219).
The authors have no conflicts of interests to disclose.
The datasets generated during and/or analyzed during the current study are not publicly available, but are available from the corresponding author on reasonable request.
References
- [1].Siegel RL, Miller KD, Jemal A. Cancer statistics, 2019. CA 2019;69:7–34. [DOI] [PubMed] [Google Scholar]
- [2].Stiles BM, Pua B, Altorki NK. Classifi cation and pathology of lung cancer. Retour Au Numéro 2016;25:447–68. [Google Scholar]
- [3].Ferrer L, Giaj Levra M, Brevet M, et al. A brief report of transformation from non-small cell to small cell lung cancer: Molecular and therapeutic characteristics. J Thorac Oncol 2019;14:130–4. [DOI] [PubMed] [Google Scholar]
- [4].Faruki H, Mayhew GM, Serody JS, et al. Lung adenocarcinoma and squamous cell carcinoma gene expression subtypes demonstrate significant differences in tumor immune landscape. J Thorac Oncol 2017;12:943–53. [DOI] [PMC free article] [PubMed] [Google Scholar]
- [5].Barclay ME, Lyratzopoulos G, Walter FM, et al. Incidence of second and higher order smoking-related primary cancers following lung cancer: a population-based cohort study. Thorax 2019;74:466–72. [DOI] [PMC free article] [PubMed] [Google Scholar]
- [6].Qiong Z, Na WY, Bo W, et al. Alterations of a spectrum of driver genes in female Chinese patients with advanced or metastatic squamous cell carcinoma of the lung. Lung Cancer 2015;87:117–21. [DOI] [PubMed] [Google Scholar]
- [7].Goss GD, Spaans JN. Epidermal growth factor receptor inhibition in the management of squamous cell carcinoma of the lung. Oncologist 2016;21:205–13. [DOI] [PMC free article] [PubMed] [Google Scholar]
- [8].Song JD, Tian J, Zhang LN, et al. Development and validation of a prognostic index for efficacy evaluation and prognosis of first-line chemotherapy in stage III-IV lung squamous cell carcinoma. Eur Radiol 2019;29:2388–98. [DOI] [PMC free article] [PubMed] [Google Scholar]
- [9].Paz-Ares L, Luft A, Vicente D, et al. Pembrolizumab plus chemotherapy for squamous non-small-cell lung cancer. N Engl J Med 2018;379:2040–51. [DOI] [PubMed] [Google Scholar]
- [10].Paz-Ares L, Vicente D, Tafreshi A, et al. A randomized, placebo-controlled trial of pembrolizumab plus chemo-therapy in patients with metastatic squamous non–small-cell lung cancer: protocol-specified final analysis of KEYNOTE-407. J Thorac Oncol 2020;15:1657–69. [DOI] [PubMed] [Google Scholar]
- [11].Ettinger DS, Wood DE, Aggarwal C, et al. NCCN guidelines insights: non–small cell lung cancer, version 1.2020. J Natl Compr Canc Netw 2019;17:1464–72. [DOI] [PubMed] [Google Scholar]
- [12].Crump C, Sundquist J, Winkleby MA, et al. Interactive effects of physical fitness and body mass index on the risk of hypertension. JAMA Intern Med 2016;176:210–6. [DOI] [PMC free article] [PubMed] [Google Scholar]
- [13].Dale CE, Fatemifar G, Palmer TM, et al. Causal associations of adiposity and body fat distribution with coronary heart disease stroke subtypes, and type 2 diabetes mellitus: a mendelian randomization analysis. Circulation 2017;135:2373–88. [DOI] [PMC free article] [PubMed] [Google Scholar]
- [14].Eveno C, Parc Y, Laurent A, et al. Body-mass index, cancer, and implications for screening. Lancet Oncol 2015;16:e102–3. [DOI] [PubMed] [Google Scholar]
- [15].Fang X, Wei J, He X, et al. Quantitative association between body mass index and the risk of cancer: a global meta-analysis of prospective cohort studies: obesity and cancer risk. Int J Cancer 2018;143:1595–603. [DOI] [PubMed] [Google Scholar]
- [16].Gupta A, Majumder K, Arora N, et al. Premorbid body mass index and mortality in patients with lung cancer: a systematic review and meta-analysis. Lung Cancer 2016;102:49–59. [DOI] [PubMed] [Google Scholar]
- [17].Cui W, Min G, Nan Z, et al. Association of body mass index and outcomes following lobectomy for non-small-cell lung cancer. World J Surg Oncol 2018;16:90. [DOI] [PMC free article] [PubMed] [Google Scholar]
- [18].Ichihara E, Harada D, Inoue K, et al. The impact of body mass index on the efficacy of anti-PD-1/PD-L1 antibodies in patients with non-small cell lung cancer. Lung Cancer 2020;139:140–5. [DOI] [PubMed] [Google Scholar]
- [19].Reck M, Rodríguez-Abreu D, Robinson AG, et al. Updated analysis of KEYNOTE-024: pembrolizumab versus platinum-based chemotherapy for advanced non–small-cell lung cancer with PD-L1 tumor proportion score of 50% or greater. J Clin Oncol 2019;37:537–46. [DOI] [PubMed] [Google Scholar]
- [20].Mok TSK, Wu YL, Kudaba I, et al. Pembrolizumab versus chemotherapy for previously untreated, PD-L1-expressing, locally advanced or metastatic non-small-cell lung cancer (KEYNOTE-042): a randomised, open-label, controlled, phase 3 trial. Lancet 2019;393:1819–30. [DOI] [PubMed] [Google Scholar]
- [21].Gadgeel S, Rodríguez-Abreu D, Speranza G, et al. Updated analysis from KEYNOTE-189: pembrolizumab or placebo plus pemetrexed and platinum for previously untreated metastatic nonsquamous non–small-cell lung cancer. J Clin Oncol 2020;38:1505–17. [DOI] [PubMed] [Google Scholar]
- [22].Bianco A, Perrotta F, Barra G, et al. Prognostic factors and biomarkers of responses to immune checkpoint inhibitors in lung cancer. Int J Mol 2019;20:4931. [DOI] [PMC free article] [PubMed] [Google Scholar]
- [23].Liqin Y, Gang J, Lingeng L, et al. Factors affecting tumor responders and predictive biomarkers of toxicities in cancer patients treated with immune checkpoint inhibitors. Int Immunopharmacol 2020;85:106628. [DOI] [PubMed] [Google Scholar]
- [24].Olbryt M, Rajczykowski M, Widłak W. Biological factors behind melanoma response to immune checkpoint inhibitors. Int J Mol Sci 2020;21:4071. [DOI] [PMC free article] [PubMed] [Google Scholar]
- [25].Chansky K, Detterbeck FC, Nicholson AG, et al. The IASLC lung cancer staging project: external validation of the revision of the TNM stage groupings in the eighth edition of theTNMclassification of lung cancer. J Thorac Oncol 2017;12:1109–21. [DOI] [PubMed] [Google Scholar]
- [26].Schwartz LH, Litire S, de Vries E. RECIST 1.1-update and clarification: from the RECIST committee. Eur J Cancer 2016;132–7. [DOI] [PMC free article] [PubMed] [Google Scholar]
- [27].Han J, Xu Y, Zhou Y, et al. The effect of TKI therapy and chemotherapy treatment delivery sequence on total progression-free survival in patients with advanced EGFR-mutated NSCLC. Oncol Lett 2020;20:391–400. [DOI] [PMC free article] [PubMed] [Google Scholar]
- [28].Pilz LR, Manegold C, Schmidbindert G. Statistical considerations and endpoints for clinical lung cancer studies: Can progression free survival (PFS) substitute overall survival (OS) as a valid endpoint in clinical trials for advanced non-small-cell lung cancer? Transl Lung Cancer Res 2012;1:26–35. [DOI] [PMC free article] [PubMed] [Google Scholar]
- [29].Tsai YC, Tsai TH, Chang CP, et al. Linear correlation between average fluorescence intensity of green fluorescent protein and the multiplicity of infection of recombinant adenovirus. J Biomed Sci 2015;22:31. [DOI] [PMC free article] [PubMed] [Google Scholar]
- [30].Ma JB, Song YP, Yu JM, et al. Linear correlation between patient survival and decreased percentage of tumor [18F]fluorodeoxyglucose uptake for late-course accelerated hyperfractionated radiotherapy for esophageal cancer. Int J Radiat Oncol Biol Physics 2012;82:1535–40. [DOI] [PubMed] [Google Scholar]
- [31].Cho BC, Kato K, Takahashi M, et al. LBA11Nivolumab versus chemotherapy in advanced esophageal squamous cell carcinoma (ESCC): The phase III ATTRACTION-3 study. Ann Oncol 2019;30:v873–4. [Google Scholar]
- [32].Piperdi B, Merla A, Perez-Soler R. Targeting angiogenesis in squamous non-small cell lung cancer. Drugs 2014;74:403–13. [DOI] [PMC free article] [PubMed] [Google Scholar]
- [33].Larrayoz M, Pio R, Pajares MJ, et al. Contrasting responses of non-small cell lung cancer to antiangiogenic therapies depend on histological subtype. Embo Molecular Medicine 2014;6:539–50. [DOI] [PMC free article] [PubMed] [Google Scholar]
- [34].Von Düring ME, Jenssen T, Bollerslev J, et al. Visceral fat is better related to impaired glucose metabolism than body mass index after kidney transplantation. Transplant Int Offic 2015;28:1162–71. [DOI] [PubMed] [Google Scholar]
- [35].Akinyemiju TF, Zhao X, Sakhuja S, et al. Life-course socio-economic status and adult BMI in Ghana; analysis of the WHO study on global ageing and adult health (SAGE). Int J Equity Health 2016;15:185. [DOI] [PMC free article] [PubMed] [Google Scholar]
- [36].Lim SY, Choi WI, Jeon K, et al. Body mass index and mortality in korean intensive care units: a prospective multicenter cohort study. PloS One 2014;9:e90039. [DOI] [PMC free article] [PubMed] [Google Scholar]
- [37].Rahman M, Williams G, Mamun AA. Hypertension and diabetes prevalence among adults with moderately increased BMI (23·0-24·9 kg/m2): findings from a nationwide survey in Bangladesh. Public Health Nutr 2017;20:1343–50. [DOI] [PMC free article] [PubMed] [Google Scholar]
- [38].Tone B, Christel H, Sara G, et al. BMI and weight changes and risk of obesity-related cancers: a pooled European cohort study. Int J Epidemiol 2019;48:1872–85. [DOI] [PubMed] [Google Scholar]
- [39].Wang Z, Aguilar EG, Luna JI. Paradoxical effects of obesity on T cell function during tumor progression and PD-1 checkpoint blockade. Nat Med 2018;25:141–51. [DOI] [PMC free article] [PubMed] [Google Scholar]
- [40].Mckay M, Ruben GP. Leptin-induced JAK/STAT signaling and cancer growth. Vaccines 2016;4:26. [DOI] [PMC free article] [PubMed] [Google Scholar]
- [41].Cortellini A, Ricciuti B, Tiseo M, et al. Baseline BMI and BMI variation during first line pembrolizumab in NSCLC patients with a PD-L1 expression ≥ 50%: a multicenter study with external validation. J Immuno Ther Cancer 2020;8:e001403. [DOI] [PMC free article] [PubMed] [Google Scholar]
- [42].Zander R, Schauder D, Xin G, et al. CD4 + T cell help is required for the formation of a cytolytic CD8 + T cell subset that protects against chronic infection and cancer. Immunity 2019;51:1028–42. [DOI] [PMC free article] [PubMed] [Google Scholar]
- [43].Sha T, Qian N, Ling Y. Mechanisms of immune escape in the cancer immune cycle. Int Immunopharmacol 2020;86:106700. [DOI] [PubMed] [Google Scholar]
- [44].Yi M, Xu L, Jiao Y, et al. The role of cancer-derived microRNAs in cancer immune escape. J Hematol Oncol 2020;13:25–39. [DOI] [PMC free article] [PubMed] [Google Scholar]
- [45].Jiang X, Wang J, Deng X, et al. Role of the tumor microenvironment in PD-L1/PD-1-mediated tumor immune escape. Molecular Cancer 2019;18:10–20. [DOI] [PMC free article] [PubMed] [Google Scholar]
- [46].Arakawa A, Vollmer S, Tietze J, et al. Clonality of CD4+ blood T cells predicts longer survival with CTLA4 or PD-1 checkpoint inhibition in advanced melanoma. Front Immunol 2019;10:1–2. [DOI] [PMC free article] [PubMed] [Google Scholar]
Associated Data
This section collects any data citations, data availability statements, or supplementary materials included in this article.